npb #13-109 institution - porkcdn.com · institution: 1animal welfare ... when carried out...
TRANSCRIPT
Title: Nitrous Oxide for piglet euthanasia: validation by electroencephalography (EEG), NPB #13-109 revised Investigator: Jean Loup Rault1
Institution: 1Animal Welfare Science Centre, Univ. of Melbourne, Australia 2Agricultural Research Service, USDA, West Lafayette IN Co-Investigator: Donald C. Lay, Jr.2
Report Submitted: July 10th, 2014
Industry Summary: The identification and validation of humane methods to euthanize piglets is critical to address public concern that current methods are not optimal. The blunt force trauma procedure is humane when carried out correctly, but most people find it aesthetically objectionable. The use of carbon dioxide is often recommended, at the same time it is criticized as being aversive to swine. This research sought to: 1) evaluate the aversiveness of inhaling nitrous oxide and oxygen, using our previously validated approach which relies on the piglet’s perspective, and 2) validate the effectiveness and humaneness of nitrous oxide to induce loss of consciousness by electroencephalogram (EEG) recording. Three experiments were conducted to determine the aversiveness and the effectiveness of different mixtures of gas to euthanize piglets. The gas mixtures tested were nitrous oxide (“laughing gas”) and air (90%:10%; ‘90N’); nitrous oxide, oxygen and air (60%:30%:10%; ‘60N’); and carbon dioxide and air (90%:10%; ‘90C’). Experiment 1.a. allowed piglets to walk freely between one chamber filled with air and another chamber prefilled with either 60N or 90N. Experiment 1.b. performed the same test except the gas chamber held nitrous oxide prefilled at 25%, 50%, or 75% concentration in air or carbon dioxide prefilled at 7%, 14%, or 21% concentration in air. Experiments 1.a. and 1.b. showed that piglets do not find exposure to nitrous oxide aversive, but at high concentrations hypoxic conditions (lack of oxygen) caused the piglets to breathe heavily and eventually flail. Carbon dioxide more often resulted in flailing behavior at 21% prefill whereas Nitrous oxide at 75% prefill caused 2 out of 7 piglets to flail but 4 out of 7 became sedated. Experiment 2 measured brain activity through EEG to assess loss of consciousness as they pigs were subjected to 60N, 90N or 90C. The EEG results backed up the behavioral studies by demonstrating that there are differences between the 3 treatments in terms of effects on the brain. This means that the behavioral changes seen reflect differences in the animal’s perceptive experience of the treatments rather than, for example, alterations in motor function. In that sense,
the EEG data strengthen the link between the behavioral results and the implications for animal welfare that nitrous oxide is less aversive than carbon dioxide, although taking slightly longer to take effect; 71 vs. 59 sec in experimental settings. Furthermore, this project demonstrated that 90% nitrous oxide in air can kill piglets.
2
Keywords: euthanasia, swine, piglet, humane, gas, nitrous oxide Scientific Abstract: The identification and validation of humane methods to euthanize piglets is critical to address public concern that current methods are not optimal. The blunt force trauma procedure is humane when carried out correctly, but most people find it aesthetically objectionable. The use of carbon dioxide (CO2) is often recommended, at the same time it is criticized as being aversive to swine. This research sought to: 1) evaluate the aversiveness of inhaling nitrous oxide and oxygen, using our previously validated approach which relies on the piglet’s perspective, and 2) validate the effectiveness and humaneness of nitrous oxide to induce loss of consciousness by electroencephalogram (EEG) recording. Three experiments were conducted to determine the aversiveness and the effectiveness of different mixtures of gas to euthanize piglets. The gas mixtures tested were nitrous oxide (“laughing gas”; N2O) and air (90%:10%; ‘90N’); nitrous oxide, oxygen and air (60%:30%:10%; ‘60N’); and carbon dioxide and air (90%:10%; ‘90C’). Experiment 1.a. allowed piglets to walk freely between one chamber filled with air and another chamber prefilled with either 60N or 90N. Experiment 1.b. performed the same test except the gas chamber held N2O prefilled at 25%, 50%, or 75% concentration in air or CO2 prefilled at 7%, 14%, or 21% concentration in air. Experiment 1.a. All eight piglets exposed to the 60N gas mixture finished the 10 min test. On the other hand, all eight of the piglets exposed to the 90N treatment had to be removed from the test (at 255.4 ± 65.5 s) before the allotted ten min because they started to flail due to the lack of oxygen. Piglets in 60N expressed more normal behavior (walking-investigating pen) compared to piglets in the 90N (P<0.01). The mean duration of disoriented behavior was much greater for the piglets in 60N (P < 0.05). There was no effect of treatment on heart rate (P > 0.80). Experiment 1.b. When gas concentrations were highest the test was shorter (P < 0.001) and had to be stopped when they succumbed to the test gas and flail or fall recumbent and non-responsive in the test chamber. The amount of time spent disoriented was greater (P < 0.002) for piglets when exposed to each gas in the middle concentration gradient (CO2: 14%; N2O: 50%). Flailing behavior tended to correlate (r = .39, P < 06) with increasing concentrations of CO2; but not N2O. Experiment 2 measured brain activity through EEG to assess loss of consciousness as they pigs were subjected to either 60N, 90N or 90C. This experiment found that both 90N and 90C induced isoelectric EEG in 71 and 59 sec, respectively, but that 60N could never induce an isoelectric EEG, equivalent to brain death, over a 15 min period. Both 90N and 90C exposure resulted in a decrease in median frequency (F50), but only 90C resulted in a decrease in total EEG power (Ptot). The 60N treatment resulted in a slow decrease in F50 and a slow increase in Ptot over the 15 min period. The 95% spectral edge frequency (F95) was not affected by any treatment. The EEG results backed up the behavioral studies by demonstrating that there are differences between the 3 treatments in terms of effects on the brain. This means that the behavioral changes seen reflect differences in the animal’s perceptive experience of the treatments rather than, for example, being alterations in motor function. In that sense, the EEG data strengthen the link between the behavioral results and the implications for animal welfare that nitrous oxide is less aversive than carbon dioxide. Furthermore, this project demonstrated that 90% nitrous oxide in air can kill piglets. Introduction:
Identification and validation of a humane method of piglet euthanasia is critical to address public concern that current methods are not optimal. Although the authors feel that blunt force trauma is humane, the public does not accept this practice, largely because it is visually difficult to accept. Carbon dioxide (CO2) has been widely adopted as an alternative, but has received criticism as being aversive to swine. Until a method of piglet euthanasia is developed which is socially acceptable, the industry leaves itself vulnerable to being criticized as indifferent to piglet welfare; this will certainly have a negative impact on the pork industry’s economic viability.
3
This research offers a significant solution with the validation of the humane use of nitrous oxide (N2O) for piglet euthanasia based on electroencephalogram (EEG) recording and the newly developed aversiveness test from our previous project (NPB #10-141; Rault et al. 2013). EEG data can provide information on the state of consciousness, as well as providing evidence of nociception in response to a noxious stimulus. Results from these experiments will provide the pork industry with a proven method of euthanasia for piglets on-farm, validated on the basis of behavioral, physiological, and neurobiological measures that show the humaneness of that method. Gas euthanasia provides the advantage that it allows producers to euthanize multiple piglets at a time using a chamber, whereas other procedures such as physical or mechanical stunning (non-penetrating captive bolt) can only be performed one piglet at a time. This project was designed to determine if higher nitrous oxide concentrations can result in a faster process. Ideally, this research will lead to the design of an automated gas chamber which provides a simple, humane, and practical tool for on-farm euthanasia. Objectives: 1) To evaluate the aversiveness of inhaling nitrous oxide and oxygen, using our previously validated approach which relies on the piglet’s perspective, and 2) To validate the effectiveness and humaneness of nitrous oxide to induce loss of consciousness by electroencephalogram (EEG) recording. Materials & Methods: As proposed, this project was comprised of three experiments. Experiments 1.a. and 1.b. measured piglet behavior to determine whether the gas mixtures tested were aversive to piglets when they were exposed to them at either full concentration, or gradients thereof. Experiment 2 determined whether the gases were aversive to piglets by measuring electroencephalographic (EEG) activity. We tested nitrous oxide and air (90%:10%; ‘90N’); nitrous oxide, oxygen and air (60%:30%:10%; ‘60N’); and carbon dioxide and air (90%:10%; ‘90C’). Experiment 1: Piglets were the progeny of Yorkshire × Landrace dams bred to Duroc × Hampshire sires. Sows and their piglets were housed in conventional farrowing crates. Piglets were selected from dams and placed into treatments such that littermates did not receive the same treatment. Piglets were not screened for their halothane genotype, which may influence their sensibility to gas changes (Velarde et al., 2007), although the proportion of halothane gene in this herd is expected to be low. Starting when the piglets were 10 days of age, the training procedure consisted of two training days, one rest day, and then one test day on which the treatment gas was used. At 10 d of age, piglets from the same litter were acclimated to the chambers. The piglets were taken from their dam to a different room and placed in a holding area (61 × 61 cm) with a heat lamp. This holding area had a clear plastic wall which directly connected to the test chamber. After a 5 min acclimation period, one piglet was placed into the control chamber for 5 min and allowed to learn to use the passage door through trial and error to obtain entry into the test chamber which contained the attractive stimuli. If after 2 min the piglet never entered the test chamber, a technician would gently push the piglet through the chamber door and then return it to the control side. It was allowed to go between the chambers for the remaining 3 min. If it stayed on the control side during this time at the end of the 5 min it was then gently herded back and forth through the door five times and then returned to its companions. This procedure was repeated for the remaining piglets. The entire procedure was repeated on the following day by reintroducing the piglets in a randomized order. On the fourth day
4
(day 13 of age), the piglet was subjected to its assigned treatment. On this day, after the 5 min acclimation period, each piglet was picked up following a pre-set random order, fitted with a belt and heart rate recorder to collect heart rate data (Polar® RS800CX, Polar Electro Oy, Kempele, Finland) and placed into the center of the control chamber, facing the door into the test chamber. The box was closed and the delivery of medical air was initiated into the control chamber while the treatment gas was delivered into the test chamber. Piglets were all females and weighed 4.6 ± 0.7 kg and did not differ by treatment (P = 0.86). Experiment 1.a. Two different gas mixtures were assessed using a prefill method: 60N or 90N. The tests were conducted using a custom gas chamber (152 × 61 × 60 cm) that had two equal sized but separate chambers. This experiment used the approach-avoidance test developed and validated in the previous project (NPB #10-141; Rault et al. 2013). Briefly, piglets were allowed to walk freely between one chamber filled with air (‘control chamber’) and another chamber filled with the gas mixture (‘test chamber’). The test chamber contained attractive stimuli in the form of a heat lamp, a towel with the odor of the dam’s udder, a speaker playing nursing grunts, iron replacement meal and three littermates placed on the other side of a plexiglass wall. The test was designed as a conflict situation between the piglet’s willingness to enter and stay in the test chamber containing the attractive stimuli, and the gas. The piglet could choose to remain in the control chamber which will contain only air and no attractive stimuli. Behavior was recorded by visual observation and by using a camera mounted directly above the box. Data were analyzed based on location and activity. Heart rate data were collected by fitting the piglet with a belt and a heart rate monitor for the duration of the test. Eight, 13-day old, piglets per each of the two treatments were tested. The test was conducted for a maximum of 10 min. If the piglet flailed or fell recumbent and non-responsive (based on loss of response to palpebral reflex and toe pinch), it was pushed back into the air side and recovered (Table 1). Experiment 1.b. This experiment was conducted as an approach-avoidance project as in Experiment 1.a., except gas concentrations were set below the concentration tested in Experiment 1.a. Piglets were also trained as in Experiment 1.a. In this study, in order to refine the procedure from our previous project, we allowed piglets access to the test chamber at three different concentrations of gas. For piglets tested with CO2 the chamber was prefilled with 7, 14 or 21% gas. For piglets being tested with N2O the chamber was prefilled with 25, 50, or 75% gas. These choices of concentrations were based on our previous project (NPB #10-141): we chose to test CO2 up to 21% because this is the maximum concentration reached according to our CO2 sensor in our previous project in which previous mixtures (Argon, Nitrogen or N2O) all contained 30% CO2 and were all aversive to some extent. For the N2O treatment, 25, 50 or 75% were chosen arbitrary as proportional milestones between 0 and 100% of N2O. Unfortunately, there are no shared measures between a 90% CO2 gas mixture and a 90% N2O gas mixture that allow a direct comparison between the two gas mixtures at various concentrations. We did not include the 60N gas mixture (60% N2O:30% O2:10% air) from Experiment 1.a. because that mixture was never aversive and thus we did not expect lower concentrations of it to be aversive. The experiment started with the test chamber filled with the specified concentration of gas. The piglet was fitted with a heart rate monitor and placed into the control chamber containing air. Then the piglet was able to cross on its own free will into the chamber containing the gas, and back
5
to the air side as it preferred. Six or seven, 13-day old piglets for each of the six treatments were tested. As in Experiment 1.a. behavior and heart rate were measured. The test duration was conducted for a maximum of 10 min. If the piglet flailed or fell recumbent and non-responsive, it was pushed back into the air side and recovered. Experiment 2. Experiment 2, used similar methods to the low anaesthetic model developed by the team of Craig Johnson, a validated model to assess the effects of noxious stimuli on pain and loss of consciousness in piglets (Murrell and Johnson, 2006), and used in previous projects (NPB 09-199). This model allows for the recording of quality EEG data while the piglets are kept under a low level of anesthesia and subsequently exposed to the gas. It also allows collecting heart rate data that are free from behavioral influence, hence allowing for heart rate variability analyses. Fifteen, 10 day old, entire male Landrace × Large white piglets were used in the study. Piglets were collected from the farm on the morning of the day of testing and group-housed in a ventilated, 30°C temperature-controlled holding room with ad libitum access to water until the time of testing. Five piglets were tested individually and submitted to one of three treatments: 90N, 60N or 90C. On each occasion a piglet was transferred from the holding room to the laboratory where anaesthesia was induced with 4% Halothane vaporised in air (4 L/min) delivered through a facemask. Once adequate anaesthesia was achieved (indicated by lateral recumbence and absence of withdrawal reflex to a toe pinch), endotracheal intubation was carried out using a 3.0–4.0 mm cuffed endotracheal tube. After confirmation of successful intubation by capnometry, the endotracheal tube was connected to a breathing circuit and anaesthesia was maintained with halothane in air. Piglets were mechanically ventilated (18–20 cm H2O maximum inspiratory pressure) with end-tidal CO2 maintained in the normocapnic range (40–50 mmHg). A digital rectal thermometer was used to continuously monitor body temperature. The animal was placed on top of a warm-water heating blanket device (Gaymar T/P 500, Gaymar Industries Inc., NY, USA) to help maintain body temperature throughout. Where available, a Doppler plethysmograph was positioned over a foreleg radial artery to monitor blood flow, and identify the point at which blood flow ceased. End tidal halothane, end tidal CO2 and body temperature were monitored throughout. Subcutaneous 27-gauge stainless steel needle electrodes (Viasys Healthcare, Surrey, England) were positioned to record electroencephalograph (EEG) and electrocardiograph (ECG) activity. A five-electrode montage was used to record EEG from both the left and right cerebral hemispheres, with inverting electrodes placed parallel to the midline over the left and right frontal bone zygomatic processes, non-inverting electrodes over the left and right mastoid processes and a ground electrode placed caudal to the occipital process. ECG was recorded using a base-apex configuration. Both EEG and ECG signals were fed via breakout boxes to separate amplifiers (Iso-Dam isolated biological amplifier, World Precision Instruments Inc.). The signals were amplified with a gain of 1000 and a band-pass of 1.0–500Hz and digitised at a rate of 1 kHz (Powerlab 4/20, ADInstruments Ltd, Colorado Springs CO, USA). The digitised signals were recorded on a computer for analysis off-line at the conclusion of the experiment. Following instrumentation, halothane delivery was reduced until an end-tidal tension of 1.2 (±0.5)% was achieved. Atracurium (Tracrium; GlaxoSmithKline, Boronia VIC, Australia), a neuromuscular blocking agent, was administered at a rate of 1 mg per kg through a 22-gauge venous cannula inserted in an auricular vein to inhibit skeletal muscular activity and prevent subsequent contamination of EEG recordings. Atracurium does not affect cardiac muscle. Following a 4 min period, sufficient for atracurium to take effect, 10 min of baseline EEG and ECG were recorded, after which administration of test gas was begun. The treatment gas was administered using a
6
separate anesthetic system by switching the connection to the endotracheal tube. Both EEG and ECG data were recorded continuously for 15 min, or until death as determined by an isolectric EEG and cardiac arrest. Piglets in the 60N treatment were exposed to the test gas mixture for a period of 15 min, immediately followed by exposure to 90C until death, whereas piglets in the 90N and 90C treatments were exposed to the test gas until death. Raw EEG data were visually inspected and classified into one of three categories: active, transitional or isoelectric. EEG was classified as active where the amplitude was the same as that observed prior to placement in the chamber (baseline EEG); transitional EEG was defined as having an amplitude less than 50% of the pre-treatment EEG; isoelectric EEG was classified as a stable trace consisting of background noise with an amplitude <1/8 that of pre-treatment. In addition, EEG data were subjected to fast Fourier transformation (FFT) using purpose-written software (Spectral Analyser; CB Johnson, Massey University, Palmerston North, 2002), yielding the summary variables median frequency (F50), 95% spectral edge frequency (F95) and total power (Ptot) for consecutive 1-sec epochs. For each animal, baseline values for F50, F95 and Ptot were obtained by calculating the mean value for each over the final 5 min of baseline EEG recorded immediately prior to test gas exposure. Values for F50, F95 and Ptot over consecutive 1-sec epochs for each individual were then transformed to a percentage of baseline. Mean transformed F50, F95 and Ptot were calculated for the final 60 sec of baseline, and for the periods 0–15, 15–30, 30–45 and 45–60 sec following start of test gas administration, for each piglet. For the purposes of comparing changes in F50, F95 and Ptot following exposure to 90C with and without prior exposure to 60N, mean values for F50, F95 and Ptot were also calculated for the periods 0–15, 15–30, 30–45 and 45–60 sec after start of 90C administration in the 60N piglets, and which will be termed ‘60NC’ to reflect that it is the EEG of the 60N treatment while being exposed to 90C to induce death. Summary graphs prepared for the 60N group (Figure 9) indicated that F50 and Ptot did not remain constant during the 15 min period of test gas exposure. To examine this trend, mean values (as percentages of pre-treatment baseline) for the periods 0–5, 5–10 and 10–15 min after start of N2O exposure were also calculated for each piglet in the 60N treatment for comparison with baseline. Electrocardiogram (ECG) activity analysis - Heart rate inter-beat intervals (IBI) data were recorded using electrodes linked to Chart 4.2.3 software (ADInstruments, Castle Hill, NSW, Australia) and analysed using Kubios HRV 2.2 software (University of Eastern Finland, Finland) to calculate mean heart rate as well as time and frequency domain analysis for heart rate variability based on inter-beat interval data, using Fourier transformation for the frequency domain analysis (von Borell et al., 2007). Time domain measures were the standard deviation of the inter-beat interval (SDNN), and the root mean square of successive difference (RMSSD) as an indicator of vagal activity. Frequency domain measures were the high frequency (HF), with a power range defined from 0.09Hz to 2Hz, and the ratio of low frequency over high frequency (LF:HF) as a measure of sympathovagal balance, with a power range for low frequency defined from 0.04Hz to 0.09Hz, according to Poletto et al (2011). Mean measures were calculated for the last 5 min of baseline ECG data and over 30 sec
period until cardiac arrest, which was defined as a mean heart rate of <1/8 that of pre-treatment. Comparisons of the latency to the appearance of transitional and isoelectric EEG between treatments were performed using the GLM procedure in SAS 9.1.3 (SAS Institute Inc, Cary NC, USA). Comparison of the changes in Fourier-transformed and ECG data between and within treatments over time were performed using the mixed procedure in SAS 9.1.3, with treatment as a fixed effect, pig and litter as random effects, time as a repeated measure and live weight as a covariate.
7
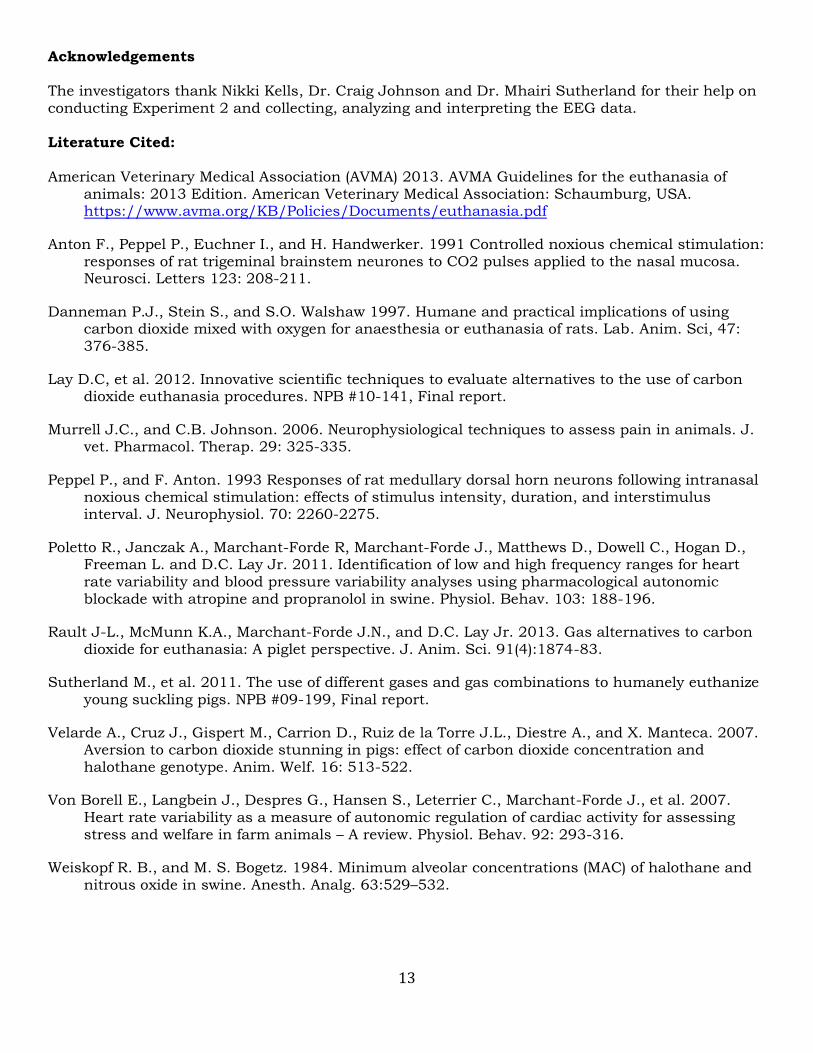
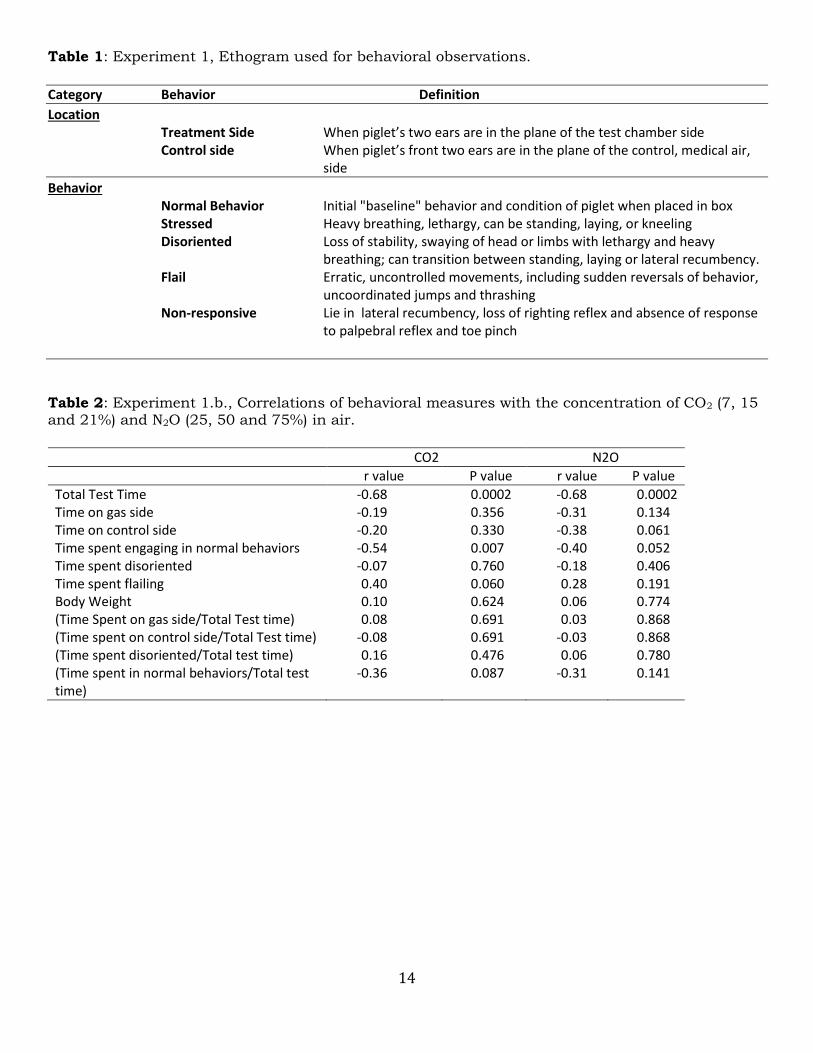
Statistical significance was set at p<0.05. Where a significant treatment effect was identified, p values were manually corrected for multiple comparisons by dividing by the number of comparisons of interest. Summary variables over time were compared to baseline within treatment and values at identical time points were compared between treatments. Results: Experiment 1.a. All eight piglets submitted to the 60N treatment finished the 10 min test. On the other hand, all eight of the piglets exposed to 90N treatment had to be removed from the test (means ± SE: 255.4 ± 65.5 sec) before the allotted 10 min (Figure 1). All of piglets exposed to the 90N treatment had to be removed because they started to flail due to the lack of oxygen. Piglets in the 60N treatment expressed more normal behavior (walking-investigating pen) compared to piglets in the 90N
treatment (58.2 9.57 sec and 18.28 6.77 sec, respectively, P < 0.01; Figure 2). The mean
duration of disoriented behavior was greater for 60N compared to 90N (120.83 48.85 sec and
83.17 32 sec, respectively, P < 0.05; Figure 2). The flail behavior did not differ between piglets in
the 60N and 90N treatments (2.5 1.13 sec and 4.43 1.55 sec, P > 0.30). There was no initial
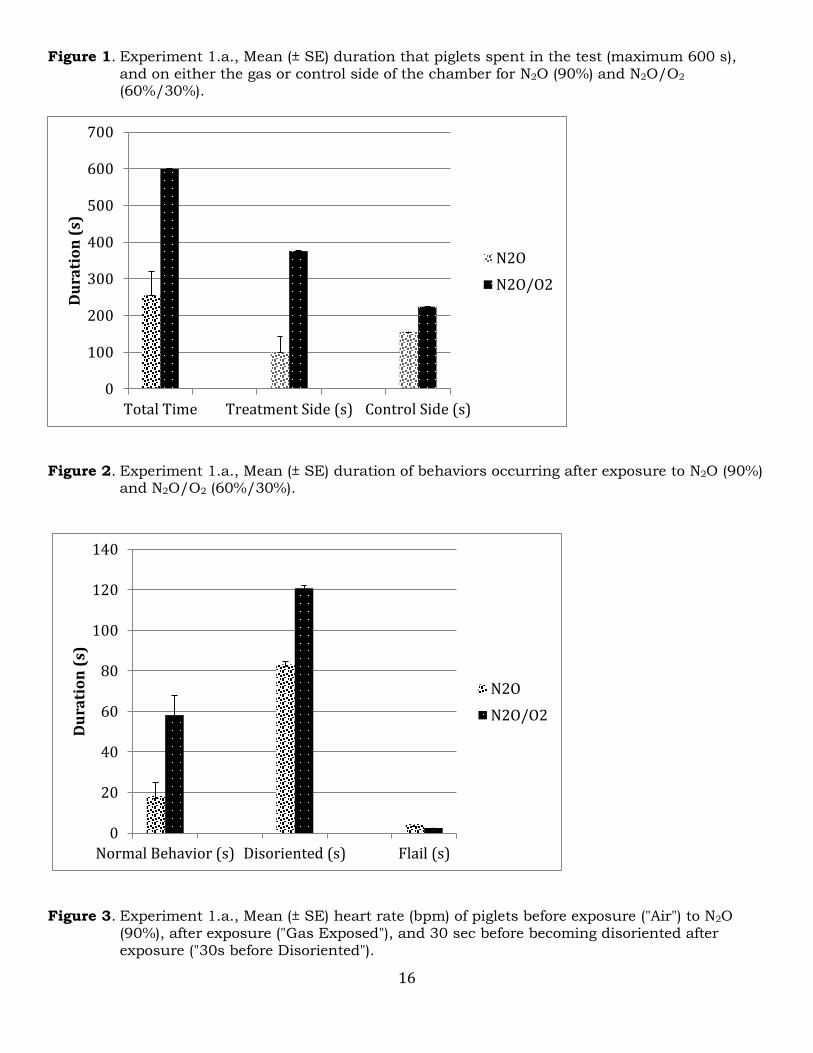
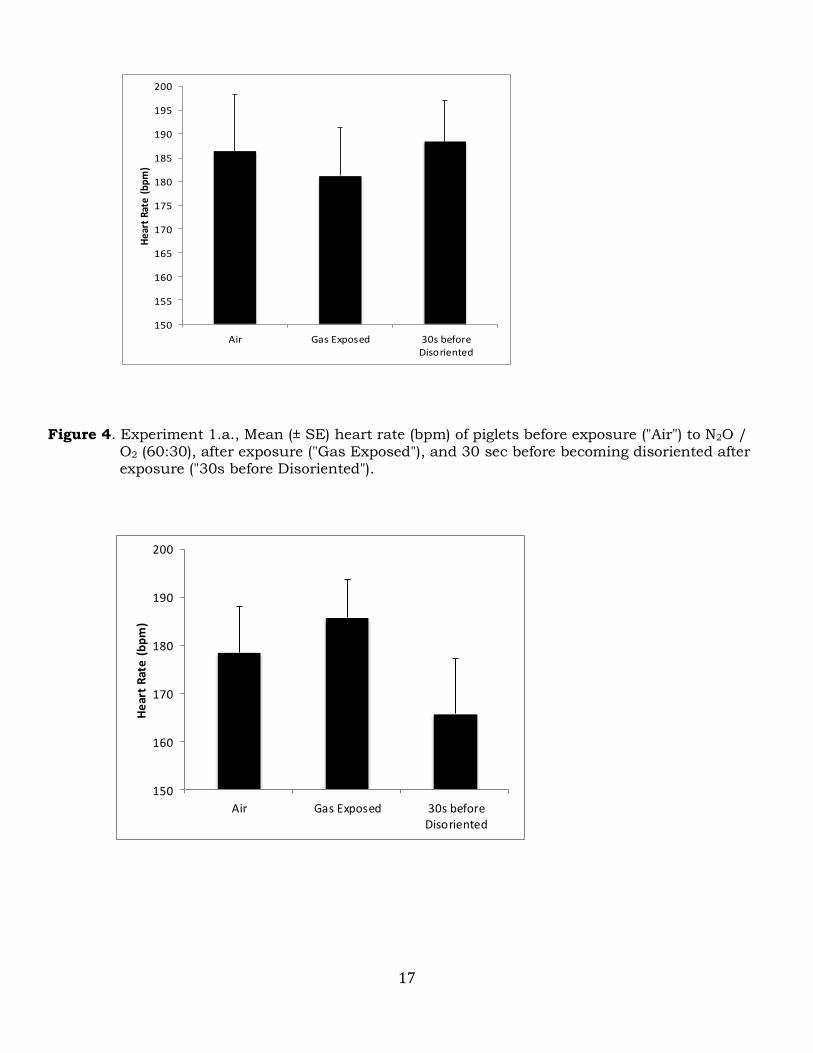
difference in weight between piglets in the 60N and 90N treatment (3.97 0.31 kg and 4.37 0.27 kg, respectively, P > 0.30). Heart rate mean of the piglets in the control chamber (containing only medical air) was not different
for piglets in 60N or 90N treatments (178.5 9.66 bpm and 186.38 11.94 bpm, respectively, P > 0.90; Figures 3 and 4). Heart rate means in the test chamber was not different when the piglets
were exposed to 60N or 90N (185.75 7.95 bpm and 181.13 10.26 bpm, respectively, P > 0.80). Heart rate mean of piglets recorded 30 sec before becoming disoriented did not differ between
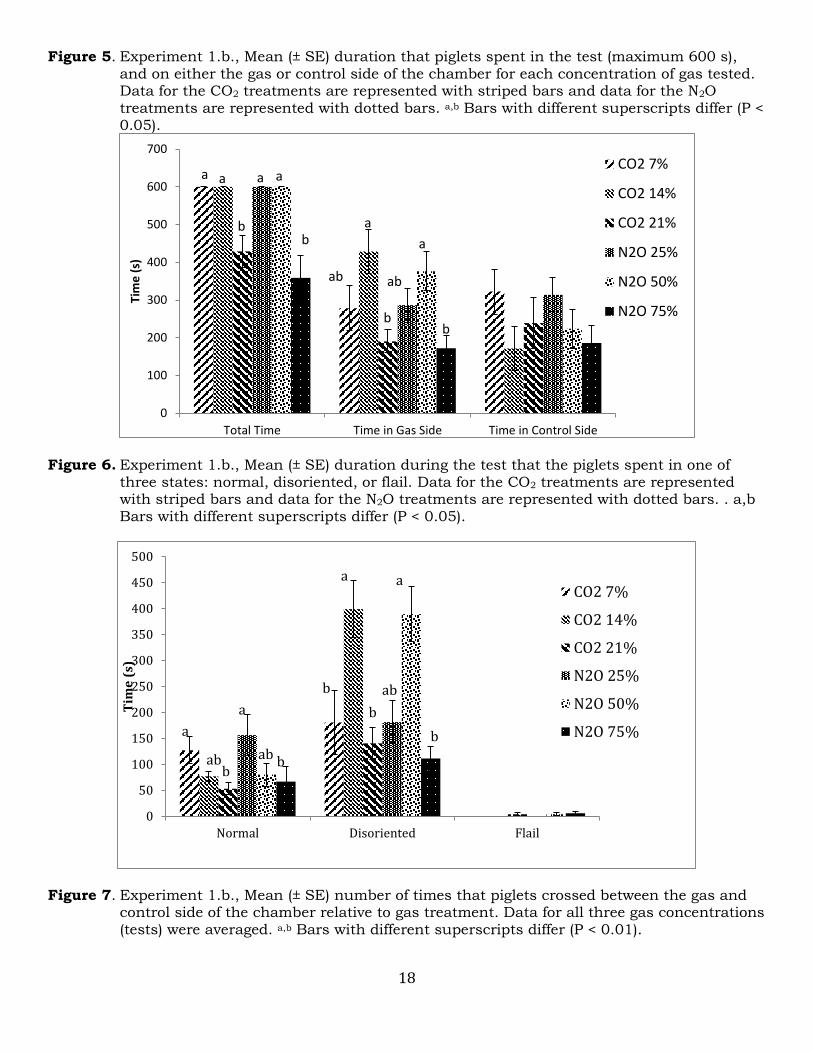
piglets exposed to 60N or 90N (165.75 11.56 bpm and 188.5 8.49 bpm, respectively, P > 0.1) when compared across treatments or to baseline when the piglet was in the control chamber breathing air. Experiment 1.b. All piglets in both the CO2 and N2O treatments completed the 10 min test when the gas concentrations were at the two lowest of the three tests (CO2: 7 and 14%; N20: 25 and 50%; Figure 5). In contrast when concentrations were highest the test was significantly shorter (P < 0.001, Figure 5) because piglets needed to be removed from the test (moved into the air side) when exposed to either 21% CO2 (n = 6) or 75% N2O (n = 7). For those piglets exposed to 21% CO2 the reason for removal was because five piglets exhibited flailing behavior and although the last piglet in the CO2 treatment didn’t need to be removed, it only spent about 40 sec in the CO2 over the 10 min test. All seven piglets exposed to the 75% N2O were removed before the end of the test because four fell recumbent and non-responsive (loss of response to palpebral reflex and toe pinch), two were flailing, and one started to seizure. The need to remove them, for ethical reasons as the aim here was to assess aversiveness and not effectiveness of the euthanasia method, resulted in a strong correlation
for both gases of approximately r =-.67 indicating as gas concentrations increased test time decreased ( P < 0.0002; Table 2). There was no difference in time spent in the control side (air) of the chamber but time spent in 14% CO2 or 50% N2O was greater than time spent in the 21% CO2 and 75% N2O, respectively (P = 0.008 and P = 0.03, respectively, Figure 5). As CO2 concentrations increased there was a linear decrease in normal behavior (P < 0.002; Figure 6), and a similar trend for piglets exposed to increasing concentrations of N2O (P < 0.08). There was a strong correlation of approximately r = -.45 for both gases showing that as concentrations increased normal behavior decreased (P < 0.008 and 0.06 for CO2 and N2O respectively, Table 2). The amount of time spent disoriented was greater (P < 0.002) for piglets when exposed to each gas in the middle concentration gradient (CO2: 14%; N2O: 50%; Figure 6). The time spent flailing was not different per treatment at
8
any concentration. However, flailing behavior was correlated (r = .39, P < 0.06) with increasing concentrations of CO2; but not N2O (Table 2). Comparing the total number of times that the piglet moved between chambers by gas treatment, regardless of concentration, indicate that piglets exposed to CO2 walked between chambers less than twice whereas piglets exposed to N2O were much more likely to change sides (P < 0.01; Figure 7). Heart rate mean did not differ based on treatment (P = 0.72, Figure 8) when piglets were in the gas or when they were compared between air and gas sides (P = 0.95). Nor did heart rate mean differ (P = 0.69) during the 30 sec prior to them becoming disoriented when it was compared to heart rate recorded when the piglet was on the air side. Experiment 2. Latency to the appearance of transitional and isoelectric EEG Exposure to 60N did not result in the development of transitional or isoelectric EEG, nor was it lethal, in any of the piglets tested. In contrast, exposure to 90N or 90C (with or without prior exposure to 60N) resulted in a shift from active to transitional, then isoelectric EEG and was lethal to all piglets tested within less than 2 min after the start of exposure to 90C or 90N. There was a tendency toward an effect of treatment on the latency to the appearance of transitional EEG (P = 0.07), but no effect of treatment on the latency to the appearance of isoelectric EEG (P = 0.19; Table 3). Transitional EEG tended to appear sooner in the 60NC group (i.e. piglets that have
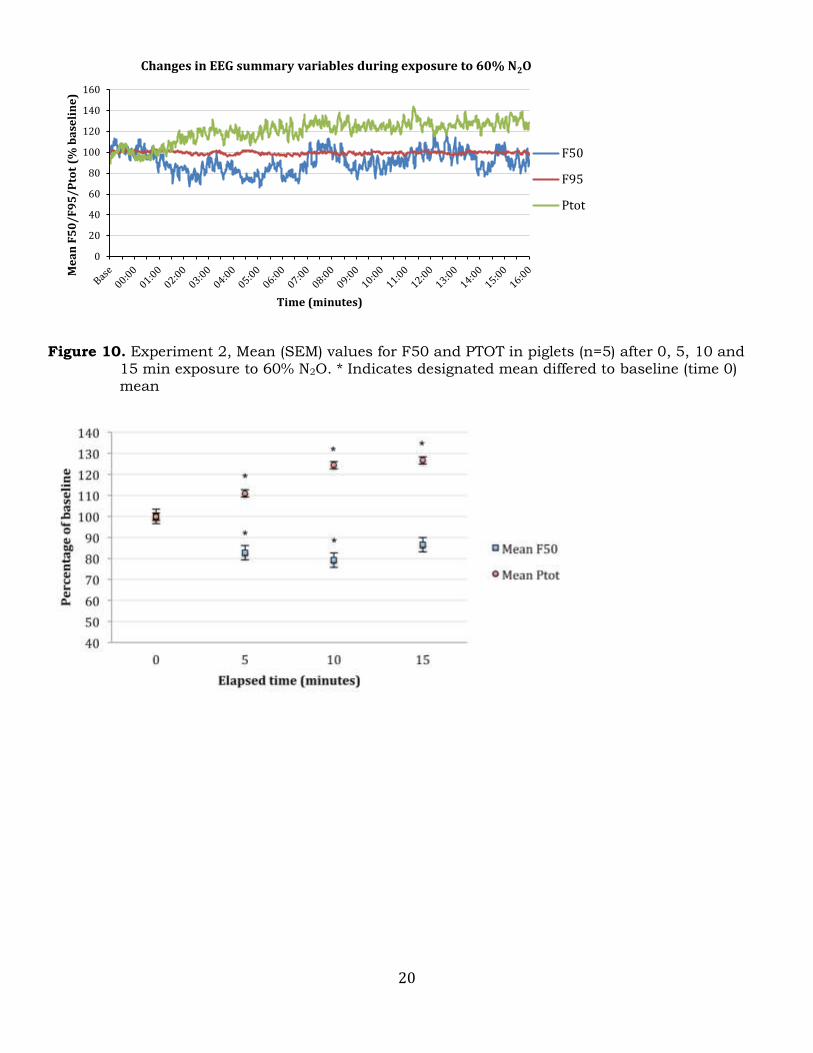
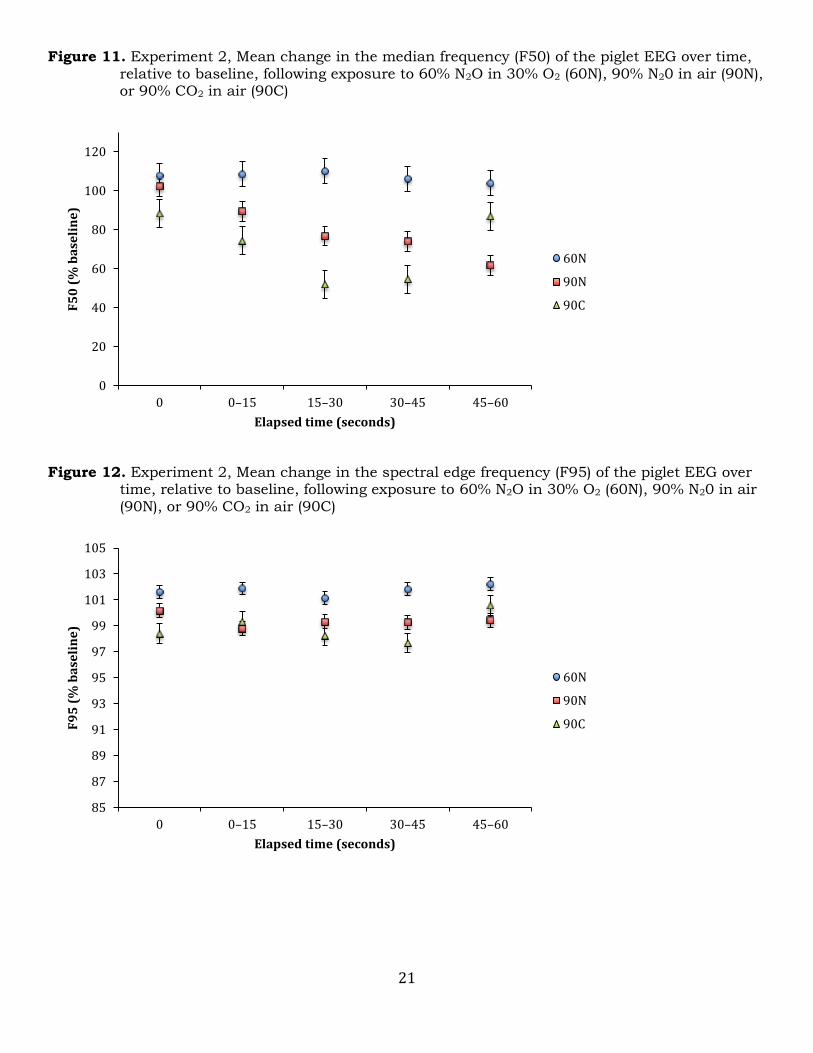
previously been exposed to 60N) than the 90N group (P = 0.06). The small sample size, along with the large individual variation (as shown by the large standard error), likely reduced the power of the test to identify any potential treatment effect on the latency to appearance of transitional or isoelectric EEG. Change in EEG parameters during the 15 min exposure to 60% N2O In piglets exposed to 60N, mean F50 was lower than baseline after 5 (P = 0.02) and 10 min (P = 0.004), but it was only a trend between baseline and 15 min (P = 0.09; Figure 10) of gas exposure. Mean values for F50 after 5, 10 and 15 min exposure did not differ to each other. Mean PTOT was greater than baseline after 5 (P = 0.005), 10 (P < 0.0001) and 15 (P < 0.0001) min exposure to 60N (Figure 10). Mean values for PTOT after 10 and 15 min exposure were greater than that observed after 5 min exposure (P < 0.0001), but did not differ to each other. However F95 (the 95% spectral edge frequency), reportedly the most reliable indices of depth of anaesthesia, was unchanged throughout the period of exposure to 60N. Comparison of changes in EEG variables during the first 60 sec of exposure to test gases Figures 11 through 13 depict the changes in F50, F95 and PTOT in piglets during the first 60 sec of exposure to 60N, 90N and 90C. Only data collected during the first 60 sec of exposure were analysed, as EEG in most individuals in the 90C and 90N groups was isoelectric after this period.
Mean F50 in the 60N group did not differ to baseline during the first 60 sec. Mean F50 in the 90N group was lower than baseline after 30, 45 and 60 sec (all P < 0.0001). Mean F50 in the 90C group was lower than baseline at 30 (P = 0.005) and 45 sec (P = 0.02), but did not differ to baseline at 60 sec. Mean F50 was lower in the 90C group than the 60N group at 15 (P = 0.004), 30 (P < 0.0001) and 45 sec (P < 0.0001). Mean F50 was lower in the 90N group than the 60N group at 30 (P = 0.003), 45 (P = 0.005) and 60 sec (P < 0.0001). Mean F50 did not differ between the 90N and 90C groups at any time point.
9
Mean F95 did not differ to baseline in any group during the first 60 sec of gas exposure. Mean F95 in the 60N group was higher than that in the 90C group at 0 (P = 0.04) and 45 (P < 0.0001) sec, and higher than the 90N group at 15 (P < 0.0001), 45 (P = 0.03) and 60 sec (P = 0.01). Mean F95 did not differ between the 90N and 90C groups at any time point.
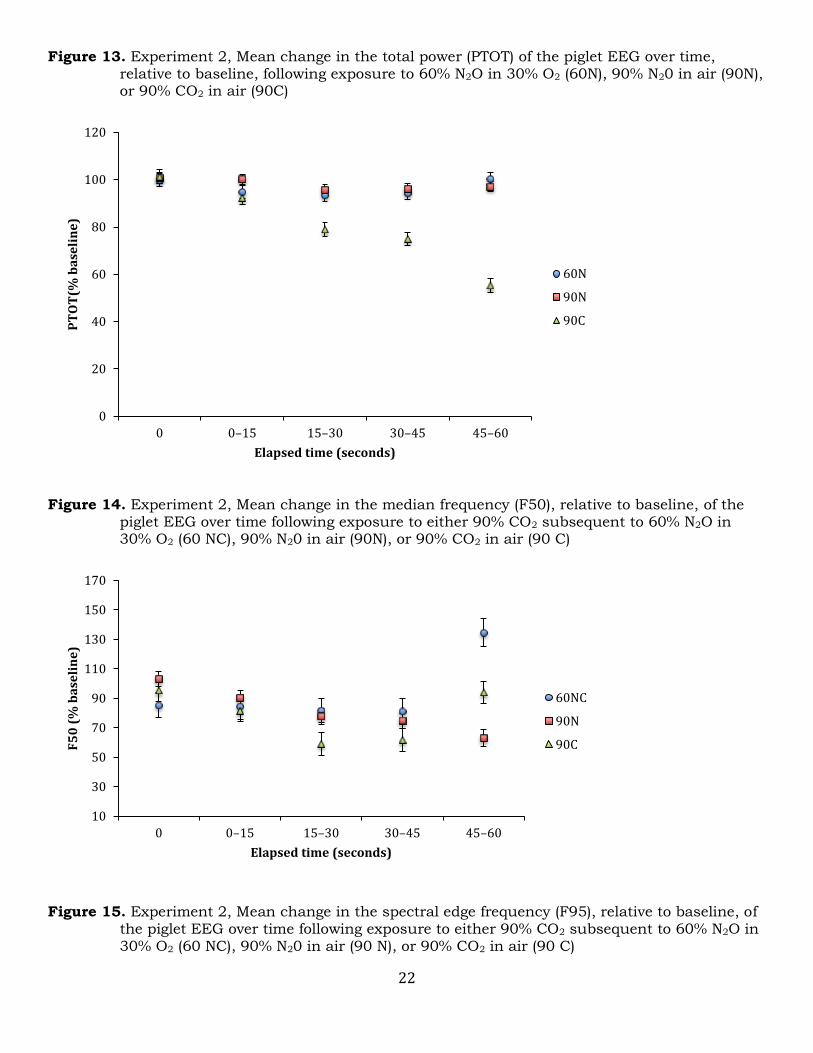
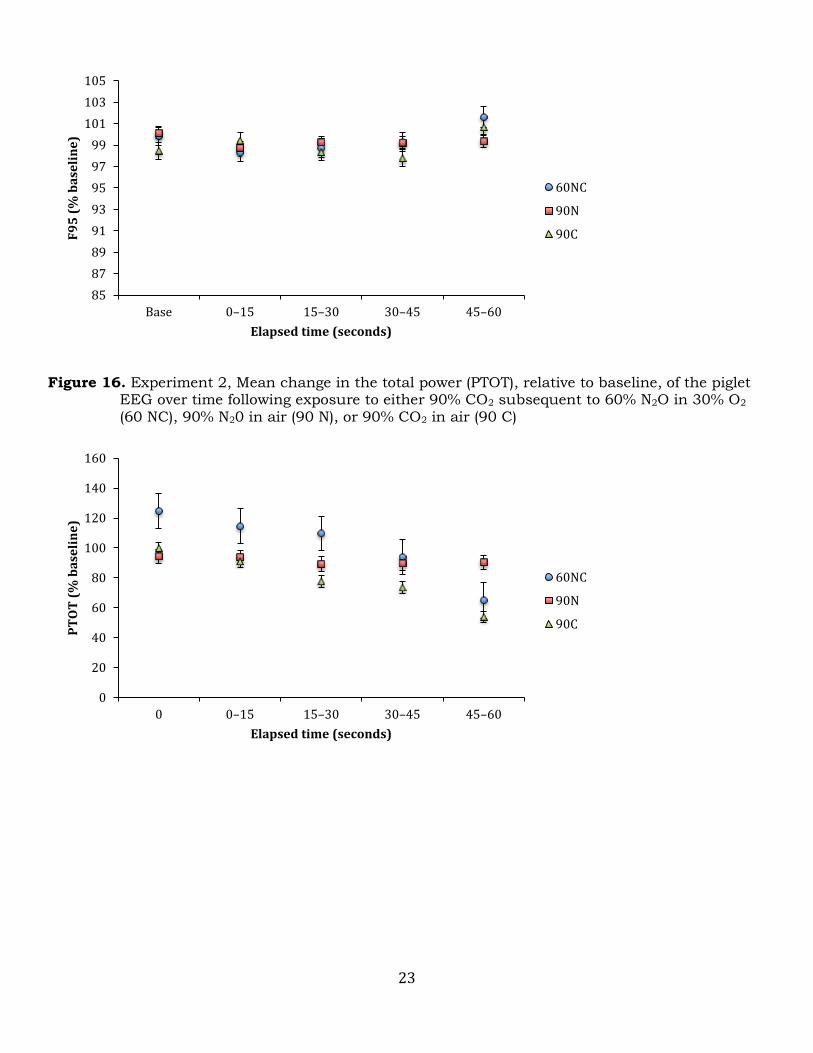
Mean PTOT in the 60N and 90N groups did not differ to baseline during the first 60 sec of gas exposure. Mean PTOT in the 90C group was lower than baseline at 30, 45 and 60 sec (all P < 0.0001). Mean Ptot was lower in the 90C group than either the 60N or 90N groups at 30 (P = 0.0008 and P < 0.0001, respectively) 45 (P < 0.0001) and 60 sec (P < 0.0001). Effects of 90% CO2 on piglets previously exposed to 60% N2O, 30% O2 and air. Figures 14 through 16 depict the changes in EEG summary variables from the first 60 sec of gas exposure in the 90N and 90C groups compared with the changes observed in the first 60 sec of exposure to 90% CO2 in pigs that had previously been exposed to 60N for 15 min (60NC). The purpose of this comparison was to determine whether prior exposure to 60% N2O affected the EEG
response to exposure to 90% CO2. Mean F50 did not differ between treatments during the first 45 sec of gas exposure. Mean F50 after 60 sec of gas exposure was lower in the 90C treatment than the 60NC treatment (P < 0.0001). Mean F50 in the 60NC group was greater than baseline at 60 sec (P = 0.005), whereas F50 in the 90C group was lower than baseline at 30 (P = 0.005) and 45 sec (P = 0.02). There was no significant change in F95 relative to baseline, during exposure to any of the gas treatments (Figure 15). Furthermore, F95 did not differ between treatments at any time point. Mean PTOT did not differ significantly between treatments during the first 45 sec of gas exposure (Figure 16). After 60 sec, PTOT was lower in the 90C group than the 90N group (P < 0.0001), but did not differ to the 60NC group. During exposure to 60NC, PTOT was lower than baseline after 60 sec (p<0.0001), whereas during exposure to 90C, PTOT was lower than baseline after 30, 45 and 60 sec (all P < 0.0001).
Cessation of blood flow A Doppler blood flow monitor was available for 9 out of the 15 piglets, during days 2 and 3 of the study. The purpose of this was as an adjunct to EEG and ECG monitoring, to ensure cardiac arrest prior to cessation of gas flow. The time to cessation of radial arterial blood flow was recorded for six piglets only; three in the 60NC group (mean 74 sec after start of CO2), two in the 90N treatment (mean 436 sec after start of N2O) and one in the 90C treatment (66 sec after start of CO2). Although there is insufficient data to draw any robust conclusions regarding the relative effects of 90% CO2 versus 90% N2O on cardiac function, these data suggest that pigs exposed to 90% CO2 generally experienced cardiac arrest sooner than those exposed to 90% N2O.
Gasping In all cases where gasping was observed, this occurred after the appearance of isoelectric EEG, and after cessation of blood flow (data available for 6 out of 15 pigs only), and therefore piglets lost awareness before gasping occurred. 60 NC One of five pigs exhibited gasping. Four gasps were recorded over a 23 sec period, beginning 2 min 25 sec after start of CO2 administration.
10
90 N Five out of five pigs exhibited gasping. The mean number of gasps recorded was 20 (range 5–42) over 5.3 (range 1.4–9.9) min, beginning 5.5 (range 1.3–7.9) min after start of N2O administration. 90 C Three out of five pigs exhibited gasping, with a mean of 7 (range 4–11) gasps recorded over 39 (range 12–90) sec, beginning 1.6 (range 1.3–2.0) min after start of CO2 administration.
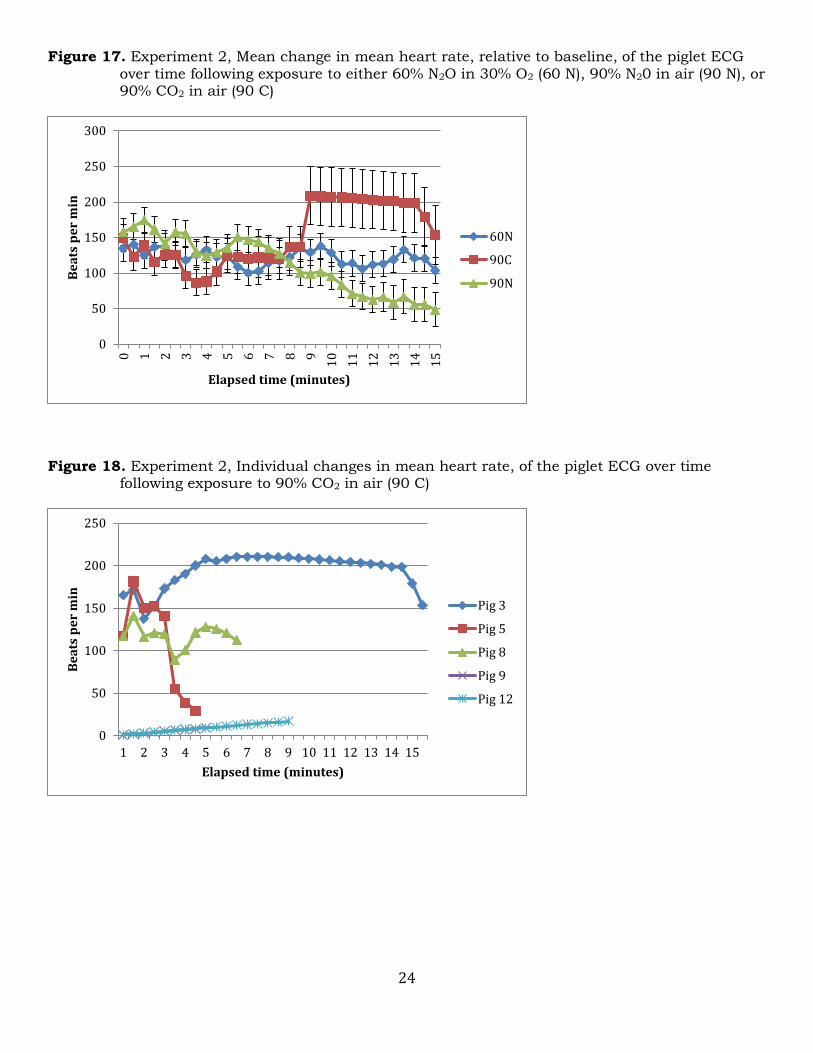
Electrocardiophy (ECG): heart rate variability analysis In Experiment 2, mean heart rate baseline did not vary between treatments (P = 0.35), for the 5 min prior to exposure to the gas mixtures. Mean heart rate never changed for piglets exposed to the 60N treatment over the 15 min test duration (all P > 0.1; Figure 17). However, mean heart rate was significantly lower than baseline from 8.5 min onwards for piglets exposed to 90N (P < 0.05). Mean heart rate started dropping between 3 and 4.5 min for 90C (P < 0.05), but was not different from baseline thereafter, probably due to one of the five piglets, piglet 3, acting as an outlier for unknown reasons with a high mean heart rate for the whole 15 min test duration (Figure 18).
In terms of time domain measures, the standard deviation of the inter-beat interval (SDNN) was significantly higher in piglets when exposed to the 60N treatment as compared to 90N or 90C (37.7
1.2 per min, 16.2 1.3 per min and 12.9 1.8 per min, respectively, both P < 0.001). The root mean square of successive difference (RMSSD) was also significantly higher in piglets exposed to
60N as compared to 90N (232.7 22.3 ms vs. 116.7 23.3 ms, P < 0.01), 90C being intermediate
and no different (193.6 32.3). None of the frequency domain measures, that is the high frequency (HF) or the ratio of low frequency over high frequency (LF:HF), differed according to treatment or time (all P > 0.01). Discussion: The heart rate and behavior observed in Experiment 1a for both treatments using nitrous oxide suggest it is not aversive to piglets. The only difference seen was that piglets in the 60N treatments (60% N2O:30% O2:10% air) spent more time disoriented (which doesn’t appear to be distressful based on behavior and the fact that piglets don’t squeal or panic), which appears to be a function of the N2O affecting them as expected but because O2 is present they do not become hypoxic and never felt recumbent and non-responsive; our main aim for exposing piglets to N2O as a sedative agent. In contrast, piglets in the N2O treatment became disoriented but because of the low O2 concentration in the chamber (2% residual O2), they became hypoxic and subsequently had to be removed from the test before the end of the 10 min because they all fell recumbent and non-responsive. Experiment 1.b. showed that piglets exposed to either 75% N20 or 21% CO2 could not complete the full test as they had to be removed from the treatments. However the reason for removal differed. Piglets in the CO2 treatment were removed due to flailing, in contrast to four out of seven piglets in the N2O treatment which were removed for being recumbent and non-responsive, although two others in the N2O treatment did start to flail and one seemed to start seizing. Piglets from both treatments also spent more time in the gas side of the chamber when the treatments were delivered at the intermediate concentrations of either 50% N20 or 14% CO2. This appears to be due to the gases having an effect on them in that they lost the ability to travel back and forth between sides. This is supported by the observation that both gas treatments caused high and equal amounts of disoriented behavior when using the intermediate concentrations. For both gas treatments, as gas concentration increased the amount of normal behavior linearly decreased. Our interpretation of the reaction of the piglets to the various concentration gradients is that when concentrations are low, there is low expression of disoriented behavior because the gas is having minimal effects on the piglets. Conversely, when concentrations are high, disoriented behavior is low because the effects of
11
the gas are robust in each treatment to push the animals to the state of flailing or falling recumbent and non-responsive which ends the experiment, thus less time spent disoriented. Nevertheless, the numbers of cross-overs (changes between the two chambers) indicate that the piglets in the N2O treatment easily moved between the air and gas; in contrast to the piglets exposed to CO2 who had much more restricted movement. Overall, these data support our initial hypothesis that CO2 causes more distress to piglets than the N2O. However, while four out of seven piglets exposed to 75% N2O fell recumbent and non-responsive, two others flailed and one seemed to start seizing. It is not clear why such diverse reaction occurred but this needs to be examined using a larger sample size if future work investigates the use of N2O in this manner. Heart rate mean in Experiment 1 never differed according to the gas treatment, or between times when the piglets were in the control side with medical air or in the gas treatment side exposed to the gas mixtures. Heart rate mean also did not differ in our previous research (NPB #10-141; Rault et al. 2013). Heart rate increases is typically used as a measure of distress so it is interesting that even as the piglets started to become disoriented or flail, heart rate mean did not increase. These results suggest that heart rate mean is not a sensitive measure to assess the effects of gas mixtures on piglets. Experiment 2 allowed us to conduct heart rate variability analyses while the piglet was kept under stable anesthesia conditions, hence removing the locomotor activity influence on the heart rate. Nevertheless, there was little difference in heart rate variability parameters between gas treatments, apart from heart rate cessation corresponding to death and 60N showing higher SDNN and RMSSD, suggesting higher parasympathetic activity while exposed to 60N, and usually associated with lower stress levels (von Borell et al., 2007), notwithstanding that this was the only treatment to not induce death. Experiment 2 showed that there are differences between the three treatments in terms of effects on the brain. This experiment found that both 90N and 90C could induce isoelectric EEG in 71 and 59 sec, respectively, but that 60N could never induce an isoelectric EEG, equivalent to brain death, over a 15 min period. When piglets were exposed to 60N, Ptot increases and F50 decreases, but this was a slow process developing gradually through the first 10 min of the 15 min exposure. The results seen with 60N are consistent with nitrous oxide being analgesic and weakly anaesthetic. Whilst an increase in Ptot and decrease in F50 may accompany increasing depth of anaesthesia, the lack of any change in F95 suggests that the observed changes were not related to anaesthesia depth. This is consistent with the reported MAC of N2O in pigs of around 200% (Weiskopf & Bogetz, 1984). Nitrous oxide may well be antinociceptive and anxiolytic in this setting and will probably reduce or prevent any noxious component of CO2 administration. The effects seen when moving from 60N to 90C are complex and difficult to interpret because of the combined effects of the onset of CO2, the offset of N2O and the interaction between them in the alveolus together with hypoxic and acidotic alterations occurring in the brain. However, the recovery time from N2O should be expected to be very rapid due to the insolubility of this drug. Moving the piglets from an atmosphere of 60N to one of 90C is therefore likely to result in the piglets beginning to recover from the effects of the N2O. Indeed, this is consistent with our previous behavioral observations (NPB #10-141, Experiment 3), in which some pigs try to stand, grunt, kick, convulse, eyes open once transferred from the N2O induction box (at 60% N2O and 30% O2 in air) to 90% CO2. So although they appeared anesthetized in the gradual fill N2O, they started responding when moved to the CO2. The EEG data also suggest that prior exposure to 60% N2O did not significantly affect pigs’ responses during exposure to 90% CO2. The increase in F50 observed after 60 sec in the 60NC group is likely an artefact caused by the rapid decrease in EEG power as the signal became transitional. As the EEG approached an isoelectric state, F50 became artificially elevated in all individuals (data not shown). Although the Ptot of the EEG in the 90C group fell below baseline sooner than that of the 60NC group, it must be noted that Ptot at time 0 was relatively higher in the 60NC group than the 90C due, due to prior exposure to 60% N2O. Overall, it may be concluded that prior exposure to 60% N2O do not alter the EEG response of piglets to 90% CO2 exposure.
12
Furthermore, 60N never resulted in an isoelectric state and therefore a transfer to CO2 was required to kill the piglet. Exposure to 90N and 90C caused a decrease in F50, but only 90C caused a decrease in Ptot. Depth of anesthesia is often accompanied by a decrease in F50 and an increase in Ptot. On the other hand, the typical response to noxious stimulation in the mammalian EEG is a transient increase in F50, often accompanied by an increase in F95, and a corresponding decrease in Ptot. Therefore, based on the changes observed in Experiment 2, exposure to 90% N2O is unlikely to be a procedure that is noxious to the piglet, based on the differences between 90N and 90C in both F50 and Ptot. Exposure to 60N lead to different EEG changes likely because it is not a hypoxic gas mixture. The question remained open of whether 90N has any significant effect on the piglet, or if the EEG changes observed are simply the results of hypoxia. Unfortunately, we could not answer that question with the current data set, as it would require separating the effects of hypoxia from the other effects of 90N and 90C using a barometric chamber to give the same partial pressure of N2O in a non-hypoxic gas mixture, a laborious and expensive setting. Nitrous oxide contributes to anaesthesia by mechanisms that are not fully understood. The 90% N2O gas mixture is a hypoxic mixture and so probably not a physiologically stable preparation (obviously not since it leads to death), and therefore it is difficult to interpret EEG changes. Nevertheless, the EEG changes observed under N2O are coherent with the behavioral changes seen when piglets are exposed to N2O.
The typical response to noxious stimulation in the mammalian EEG is a transient increase in F50, often accompanied by an increase in F95, and a corresponding decrease in Ptot. When exposed to CO2 concentrations of 40–55%, humans report pain in the eyes, nose and throat, through stimulation of nociceptors in the mucosa of the cornea, nose and upper respiratory tract (Anton et al 1992, Danneman et al 1997). Nociceptors in the rat nasal mucosa have been shown to respond to CO2 concentrations in the range of 37–50% (Peppel & Anton 1993), suggesting that rats may also experience pain during exposure to moderate to high CO2 concentrations. In the present study, and in accordance with a previous project (NPB 09-199), there was no EEG evidence of a nociceptive response to inhalation of 90% CO2, with or without prior exposure to N2O. However, animals in the present study were intubated and gas delivered via an endotracheal tube, effectively preventing exposure of the corneal and nasal mucosa to CO2. In addition, the high concentration of CO2 used caused very rapid cortical depression, potentially masking any evidence of nociception due to stimulation of lower respiratory tract nociceptors. The lack of evidence of nociception in pigs exposed to 90% CO2 meant that the EEG model could not be used successfully to examine the potential analgesic effects of exposure to 60% N2O prior to CO2. Overall conclusions Overall, these data indicate that exposure to N2O is less aversive than exposure to CO2 for piglets. The EEG results backed up the behavioral studies by demonstrating that the behavioral changes seen reflect differences in the animal’s perceptive experience of the treatments rather than, for example, being alterations in motor function. Nitrous oxide at a concentration of 90% with 10% air (hence with residual O2 around 2%) is effective in killing piglets, probably through the effects of
hypoxia rather than N2O per se. Death by hypoxia for pigs using argon or nitrogen gas mixtures is considered acceptable (AVMA, 2013, p.24). Time to death (based on isoelectric EEG) using 90% N2O is slightly longer than when using 90% CO2 but because piglets do not show an aversive reaction to N2O gas it is likely more humane. Nitrous oxide use at 90% concentration may be a useful tool for humane euthanasia as evidenced by the piglets’ mild reaction to the gas and its relatively quick mode of action.
13
Acknowledgements The investigators thank Nikki Kells, Dr. Craig Johnson and Dr. Mhairi Sutherland for their help on conducting Experiment 2 and collecting, analyzing and interpreting the EEG data. Literature Cited: American Veterinary Medical Association (AVMA) 2013. AVMA Guidelines for the euthanasia of
animals: 2013 Edition. American Veterinary Medical Association: Schaumburg, USA. https://www.avma.org/KB/Policies/Documents/euthanasia.pdf
Anton F., Peppel P., Euchner I., and H. Handwerker. 1991 Controlled noxious chemical stimulation: responses of rat trigeminal brainstem neurones to CO2 pulses applied to the nasal mucosa. Neurosci. Letters 123: 208-211.
Danneman P.J., Stein S., and S.O. Walshaw 1997. Humane and practical implications of using carbon dioxide mixed with oxygen for anaesthesia or euthanasia of rats. Lab. Anim. Sci, 47:
376-385.
Lay D.C, et al. 2012. Innovative scientific techniques to evaluate alternatives to the use of carbon dioxide euthanasia procedures. NPB #10-141, Final report.
Murrell J.C., and C.B. Johnson. 2006. Neurophysiological techniques to assess pain in animals. J. vet. Pharmacol. Therap. 29: 325-335.
Peppel P., and F. Anton. 1993 Responses of rat medullary dorsal horn neurons following intranasal noxious chemical stimulation: effects of stimulus intensity, duration, and interstimulus interval. J. Neurophysiol. 70: 2260-2275.
Poletto R., Janczak A., Marchant-Forde R, Marchant-Forde J., Matthews D., Dowell C., Hogan D., Freeman L. and D.C. Lay Jr. 2011. Identification of low and high frequency ranges for heart rate variability and blood pressure variability analyses using pharmacological autonomic blockade with atropine and propranolol in swine. Physiol. Behav. 103: 188-196.
Rault J-L., McMunn K.A., Marchant-Forde J.N., and D.C. Lay Jr. 2013. Gas alternatives to carbon dioxide for euthanasia: A piglet perspective. J. Anim. Sci. 91(4):1874-83.
Sutherland M., et al. 2011. The use of different gases and gas combinations to humanely euthanize young suckling pigs. NPB #09-199, Final report.
Velarde A., Cruz J., Gispert M., Carrion D., Ruiz de la Torre J.L., Diestre A., and X. Manteca. 2007. Aversion to carbon dioxide stunning in pigs: effect of carbon dioxide concentration and halothane genotype. Anim. Welf. 16: 513-522.
Von Borell E., Langbein J., Despres G., Hansen S., Leterrier C., Marchant-Forde J., et al. 2007.
Heart rate variability as a measure of autonomic regulation of cardiac activity for assessing stress and welfare in farm animals – A review. Physiol. Behav. 92: 293-316.
Weiskopf R. B., and M. S. Bogetz. 1984. Minimum alveolar concentrations (MAC) of halothane and nitrous oxide in swine. Anesth. Analg. 63:529–532.
14
Table 1: Experiment 1, Ethogram used for behavioral observations.
Category Behavior Definition
Location Treatment Side When piglet’s two ears are in the plane of the test chamber side Control side When piglet’s front two ears are in the plane of the control, medical air,
side
Behavior Normal Behavior Initial "baseline" behavior and condition of piglet when placed in box Stressed Heavy breathing, lethargy, can be standing, laying, or kneeling Disoriented Loss of stability, swaying of head or limbs with lethargy and heavy
breathing; can transition between standing, laying or lateral recumbency. Flail Erratic, uncontrolled movements, including sudden reversals of behavior,
uncoordinated jumps and thrashing Non-responsive Lie in lateral recumbency, loss of righting reflex and absence of response
to palpebral reflex and toe pinch
Table 2: Experiment 1.b., Correlations of behavioral measures with the concentration of CO2 (7, 15 and 21%) and N2O (25, 50 and 75%) in air.
CO2 N2O
r value P value r value P value
Total Test Time -0.68 0.0002 -0.68 0.0002 Time on gas side -0.19 0.356 -0.31 0.134 Time on control side -0.20 0.330 -0.38 0.061 Time spent engaging in normal behaviors -0.54 0.007 -0.40 0.052 Time spent disoriented -0.07 0.760 -0.18 0.406 Time spent flailing 0.40 0.060 0.28 0.191 Body Weight 0.10 0.624 0.06 0.774 (Time Spent on gas side/Total Test time) 0.08 0.691 0.03 0.868 (Time spent on control side/Total Test time) -0.08 0.691 -0.03 0.868 (Time spent disoriented/Total test time) 0.16 0.476 0.06 0.780 (Time spent in normal behaviors/Total test time)
-0.36 0.087 -0.31 0.141

15
Table 3. Experiment 2, Mean (± SE) latency (sec) to the onset of transitional and isoelectric EEG in piglets (n=5) following exposure to either 90% N20 in air (90N), 90% CO2 in air (90C) or 90% CO2 subsequent to 15 min exposure to 60% N2O/30% O2 in air (60NC).
60NC 90N 90C
Transitional EEG 41.82 (5.175) 62.10 (4.800) 45.49 (5.230)
Isoelectric EEG 48.83 (8.066) 71.49 (7.474) 58.66 (8.147)
16
Figure 1. Experiment 1.a., Mean (± SE) duration that piglets spent in the test (maximum 600 s), and on either the gas or control side of the chamber for N2O (90%) and N2O/O2 (60%/30%).
Figure 2. Experiment 1.a., Mean (± SE) duration of behaviors occurring after exposure to N2O (90%)
and N2O/O2 (60%/30%).
Figure 3. Experiment 1.a., Mean (± SE) heart rate (bpm) of piglets before exposure ("Air") to N2O
(90%), after exposure ("Gas Exposed"), and 30 sec before becoming disoriented after exposure ("30s before Disoriented").
0
100
200
300
400
500
600
700
Total Time Treatment Side (s) Control Side (s)
Du
rati
on
(s)
N2O
N2O/O2
0
20
40
60
80
100
120
140
Normal Behavior (s) Disoriented (s) Flail (s)
Du
rati
on
(s)
N2O
N2O/O2
17
Figure 4. Experiment 1.a., Mean (± SE) heart rate (bpm) of piglets before exposure ("Air") to N2O /
O2 (60:30), after exposure ("Gas Exposed"), and 30 sec before becoming disoriented after exposure ("30s before Disoriented").
150
155
160
165
170
175
180
185
190
195
200
Air Gas Exposed 30s beforeDisoriented
He
art
Rat
e (
bp
m)
150
160
170
180
190
200
Air Gas Exposed 30s beforeDisoriented
He
art
Rat
e (
bp
m)
18
Figure 5. Experiment 1.b., Mean (± SE) duration that piglets spent in the test (maximum 600 s), and on either the gas or control side of the chamber for each concentration of gas tested. Data for the CO2 treatments are represented with striped bars and data for the N2O treatments are represented with dotted bars. a,b Bars with different superscripts differ (P < 0.05).
Figure 6. Experiment 1.b., Mean (± SE) duration during the test that the piglets spent in one of
three states: normal, disoriented, or flail. Data for the CO2 treatments are represented with striped bars and data for the N2O treatments are represented with dotted bars. . a,b Bars with different superscripts differ (P < 0.05).
Figure 7. Experiment 1.b., Mean (± SE) number of times that piglets crossed between the gas and
control side of the chamber relative to gas treatment. Data for all three gas concentrations (tests) were averaged. a,b Bars with different superscripts differ (P < 0.01).
0
100
200
300
400
500
600
700
Total Time Time in Gas Side Time in Control Side
Tim
e (
s)
CO2 7%
CO2 14%
CO2 21%
N2O 25%
N2O 50%
N2O 75%
a a
b
a a
b
ab
a
b
ab
a
b
0
50
100
150
200
250
300
350
400
450
500
Normal Disoriented Flail
Tim
e (
s)
CO2 7%
CO2 14%
CO2 21%
N2O 25%
N2O 50%
N2O 75%
aa
ab
b
b
b
a
ab
a
abb
b

19
Figure 8. Experiment 1.b., Mean (± SE) heart rate of piglets while on the air side and gas side of the chamber as well as for the 30 s prior to becoming disoriented. Data for the CO2 treatments are represented with striped bars and data for the N2O treatments are represented with dotted bars.
Figure 9. Experiment 2, Mean change in median frequency (F50), spectral edge frequency (F95) and
total power (PTOT) of the piglet EEG, expressed as percentages of baseline, during 15 min
exposure to 60% N2O/30% O2 in air
0
1
2
3
4
5
6
CO2 N2O
(#)
b
a
0
50
100
150
200
250
Average (Air Side) Average (Gas Side) Disoriented
(bp
m)
CO2 7%
CO2 14%
CO2 21%
N2O 25%
N2O 50%
N2O 75%
20
Figure 10. Experiment 2, Mean (SEM) values for F50 and PTOT in piglets (n=5) after 0, 5, 10 and
15 min exposure to 60% N2O. * Indicates designated mean differed to baseline (time 0) mean
0
20
40
60
80
100
120
140
160
Me
an
F5
0/
F9
5/
Pto
t (%
ba
seli
ne
)
Time (minutes)
Changes in EEG summary variables during exposure to 60% N2O
F50
F95
Ptot
21
Figure 11. Experiment 2, Mean change in the median frequency (F50) of the piglet EEG over time, relative to baseline, following exposure to 60% N2O in 30% O2 (60N), 90% N20 in air (90N), or 90% CO2 in air (90C)
Figure 12. Experiment 2, Mean change in the spectral edge frequency (F95) of the piglet EEG over
time, relative to baseline, following exposure to 60% N2O in 30% O2 (60N), 90% N20 in air (90N), or 90% CO2 in air (90C)
0
20
40
60
80
100
120
0 0–15 15–30 30–45 45–60
F5
0 (
% b
ase
lin
e)
Elapsed time (seconds)
60N
90N
90C
85
87
89
91
93
95
97
99
101
103
105
0 0–15 15–30 30–45 45–60
F9
5 (
% b
ase
lin
e)
Elapsed time (seconds)
60N
90N
90C
22
Figure 13. Experiment 2, Mean change in the total power (PTOT) of the piglet EEG over time, relative to baseline, following exposure to 60% N2O in 30% O2 (60N), 90% N20 in air (90N), or 90% CO2 in air (90C)
Figure 14. Experiment 2, Mean change in the median frequency (F50), relative to baseline, of the
piglet EEG over time following exposure to either 90% CO2 subsequent to 60% N2O in 30% O2 (60 NC), 90% N20 in air (90N), or 90% CO2 in air (90 C)
Figure 15. Experiment 2, Mean change in the spectral edge frequency (F95), relative to baseline, of the piglet EEG over time following exposure to either 90% CO2 subsequent to 60% N2O in 30% O2 (60 NC), 90% N20 in air (90 N), or 90% CO2 in air (90 C)
0
20
40
60
80
100
120
0 0–15 15–30 30–45 45–60
PT
OT
(% b
ase
lin
e)
Elapsed time (seconds)
60N
90N
90C
10
30
50
70
90
110
130
150
170
0 0–15 15–30 30–45 45–60
F5
0 (
% b
ase
lin
e)
Elapsed time (seconds)
60NC
90N
90C
23
Figure 16. Experiment 2, Mean change in the total power (PTOT), relative to baseline, of the piglet
EEG over time following exposure to either 90% CO2 subsequent to 60% N2O in 30% O2 (60 NC), 90% N20 in air (90 N), or 90% CO2 in air (90 C)
85
87
89
91
93
95
97
99
101
103
105
Base 0–15 15–30 30–45 45–60
F9
5 (
% b
ase
lin
e)
Elapsed time (seconds)
60NC
90N
90C
0
20
40
60
80
100
120
140
160
0 0–15 15–30 30–45 45–60
PT
OT
(%
ba
seli
ne
)
Elapsed time (seconds)
60NC
90N
90C
24
Figure 17. Experiment 2, Mean change in mean heart rate, relative to baseline, of the piglet ECG over time following exposure to either 60% N2O in 30% O2 (60 N), 90% N20 in air (90 N), or 90% CO2 in air (90 C)
Figure 18. Experiment 2, Individual changes in mean heart rate, of the piglet ECG over time
following exposure to 90% CO2 in air (90 C)
0
50
100
150
200
250
3000 1 2 3 4 5 6 7 8 9
10
11
12
13
14
15
Be
ats
pe
r m
in
Elapsed time (minutes)
60N
90C
90N
0
50
100
150
200
250
1 2 3 4 5 6 7 8 9 10 11 12 13 14 15
Be
ats
pe
r m
in
Elapsed time (minutes)
Pig 3
Pig 5
Pig 8
Pig 9
Pig 12