nps-68-87-001 naval postgraduate school · descentspeed 0.2c greaterof4.6m and2%ofdepth sea-bird...
TRANSCRIPT

NPS-68-87-001
NAVAL POSTGRADUATE SCHOOL
Monterey, California
^
HYDROGRAPHIC DATA FROM THE OPTOMA PROGRAM
OPTOMA2L7-20 July L986
by
Paul A. WittmannMelissa L. Ciandro
Arlene A. Bird
Christopher N. K. Mooers
January L987
Approved for public release; distribution unlimited,
Prepared for:
Office of Naval ResearchEnvironmental Sciences Directorate (Code L122)
Arlington, VA 22217
FEDDOCS,
D 208. 14/2NPS-68-87-001
nPs -(dS-£1-0&|
NAVAL POSTGRADUATE SCHOOL
Monterey, California 93943
RADM R. C. AustinSuperintendent
David A. SchradyProvost
This report is for the research project "Ocean Prediction ThroughObservation, Modeling and Analysis" sponsored by the Physical OceanographyProgram of the Office of Naval Research under Program Element 61153N.Reproduction of all or part of this report is authorized.
This report was prepared by:
UNCLASSIFIED
lECURlTY ClASS F.CA^'ON OF ThiS =AG£
REPORT DOCUMENTATION PAGE
DUDLEY KNOX LIBRARYNAV - -VrGRADUATE -SCHQQIMUN i bHfcV &A 939**^1 fli
la- REPORT SECURITY CLASSIFICATION
Unclassifiedlb RESTRICTIVE MARKINGS
la SECURITY CLASSIFICATION AUTHORITY
fb DECLASSIFICATION /DOWNGRADING SCHEDULE
3 DISTRIBUTION /AVAILABILITY OF REPORT
Approved for public release;distribution unlimited.
\ PERFORMING ORGANIZATION REPORT NUMBER(S)
NPS-68-87-001
5 MONITORING ORGANIZATION REPORT NUMBER(S)
ia. NAME OF PERFORMING ORGANIZATION
NAVPGSCOLDept. of Oceanography
6b OFFICE SYMBOL(If applicable)
68
7a NAME OF MONITORING ORGANIZATION
ic. ADDRESS (City, State, and ZIP Code)
Monterey, California 93943-5008
7b ADDRESS (City, State, and ZIP Code)
a NAME OF FUNDING /SPONSORINGORGANIZATION
Office of Naval Research
8b OFFICE SYMBOL(If applicable)
(1122 PO)
9 PROCUREMENT INSTRUMENT IDENTIFICATION NUM8ER
N000146WR24027
c. ADDRESS (City, State, and ZIP Code)
Arlington, VA 22217
10 SOURCE OF FUNDING NUMBERS
PROGRAMELEMENT NO.
61153N
PROJECTNO
RR0310309
TASKNO
WORK UNITACCESSION NO
1 TITLE (Include Security Classification)
Hydrographic Data from the OPTOMA Program, 0PT0MA21, 7-20 July, 1986;
Approved for public release; distribution unlimited.
2. PERSONAL AUTHOR(S)Paul A. Wittmann, Melissa L. Ciandro, Arlene A. Bird, Christopher N. K. Mooers
3a. TYPE OF REPORTProgress
13b TIME COVEREDfrom May 86 to Jul 8 6
14 DATE OF REPORT (Year, Month, Day)
87 Jan 12
15 PAGE COUNi
66
6. SUPPLEMENTARY NOTATION
COSATI CODES
FIELD GROUP SUB-GROUP
18 SUBJECT TERMS (Continue on reverse if necessary and identify by block number)
9 ABSTRACT (Continue on reverse if necessary and identify by block number)
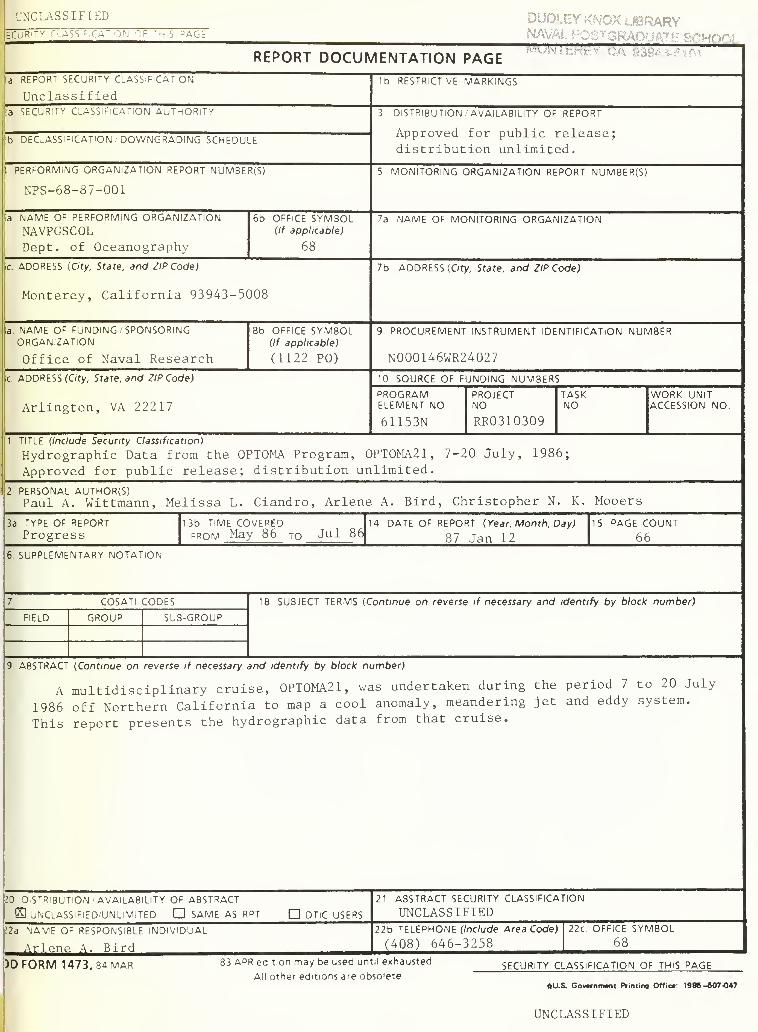
A multidisciplinary cruise, 0PT0MA21, was undertaken during the period 7 to 20 July
1986 off Northern California to map a cool anomaly, meandering jet and eddy system.
This report presents the hydrographic data from that cruise.
20 distribution /availability of abstract
s unclassified/unlimited same as rpt dtlc users
21 ABSTRACT SECURITY CLASSIFICATION
UNCLASSIFIED
>2a NAME OF RESPONSIBLE INDIVIDUAL
Arlene A. Bird
22b TELEPHONE (Include Area Code)
(408) 646-325822c OFFICE SYMBOL
68
5DFORM 1473, 34 mar 53 APR edition may be used until exhausted
All other editions are obsoleteSECURITY CLASSIFICATION OF THIS PAGE
AU.S. Government Printing Office: 1986-607-047
UNCLASSIFIED


Hydrographic Data from the OPTOMA Program.
0PT0MA217 - 20 July, 1986
by
Paul A. Wiftmann
Melissa L. Ciandro
Arlene A. Bird
Christopher N. K. Mooers
Chief Scientist:
Christopher N. K. Mooers
The OPTOMA Program is a joint program of
Department of Oceanography Center for Earth and Planetary Physics
Naval Postgraduate School Harvard University
Monterey, CA 93943. Cambridge, MA 02138.

DUDLEY KNOX UBRARYTABLE OF CONTENTS ^VALPOSTGRA^TESCHI
MONTEREY CA 93943-5101
PAGE
LIST OF TABLES ii
LIST OF FIGURES iii
INTRODUCTION 2
DATA ACQUISITION 2
DATA PROCESSING 3
DATA PRESENTATION 3
ACKNOWLEDGEMENTS 53
INITIAL DISTRIBUTION LIST 54

LIST OF TABLES
Table No. Caption Page
1. Scientific instruments aboard R/V POINT SUR. 5
2. OPTOMA21 Station Listing 9
ii

LIST OF FiGURES
Figure No. Caption Page
1. The NOCAL and CENCAL subdomains of the 1
OPTOMA Program. Isobaths are shownin meters.
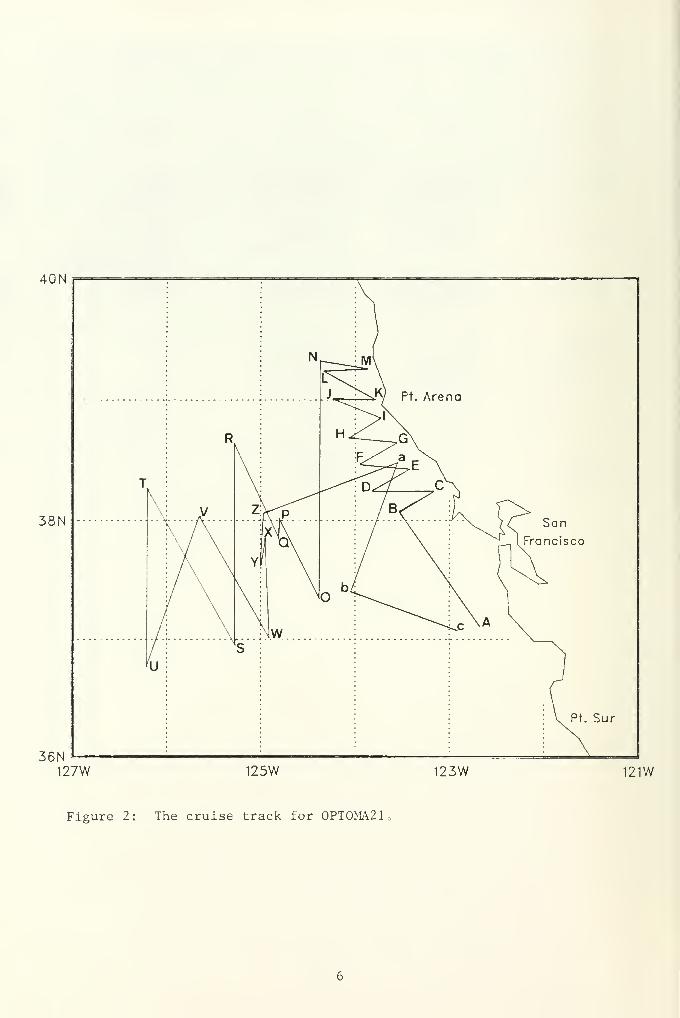
2. The cruise track for OPTOMA21. 6
3. XBT and CTD locations for OPTOMA21. 7
4. Station numbers for OPTOMA21. 8
5. (a)-(i) XBT temperature profiles, staggered by 14
multiples of 5C.
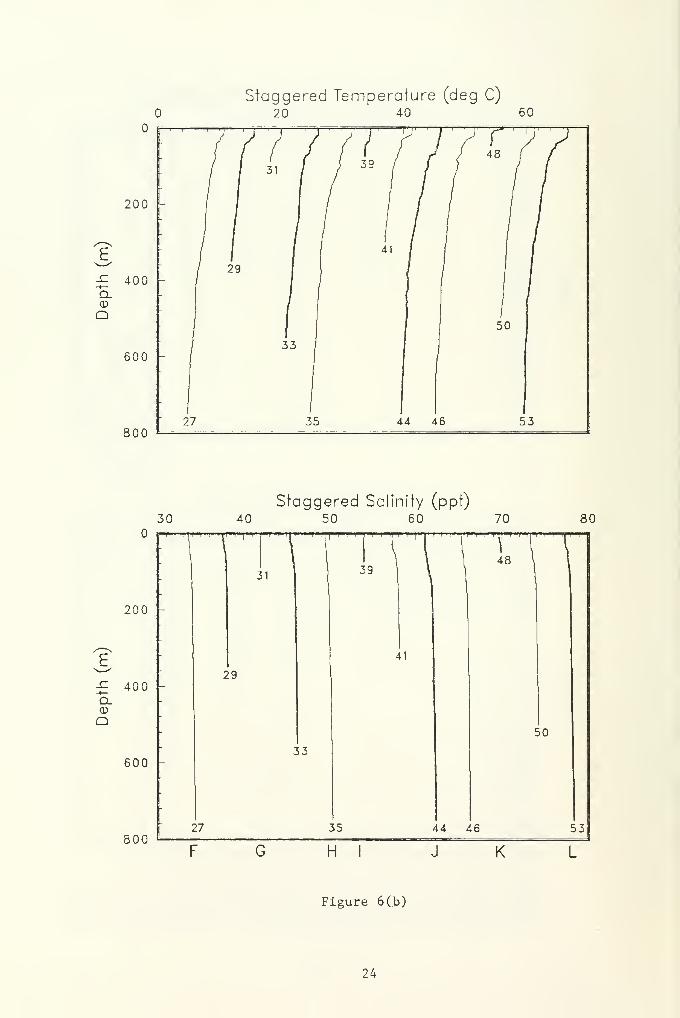
6. (a)-(q) CTD temperature profiles, staggered by 23multiples of 5C, and salinity profiles
staggered by multiples of 4 ppt.
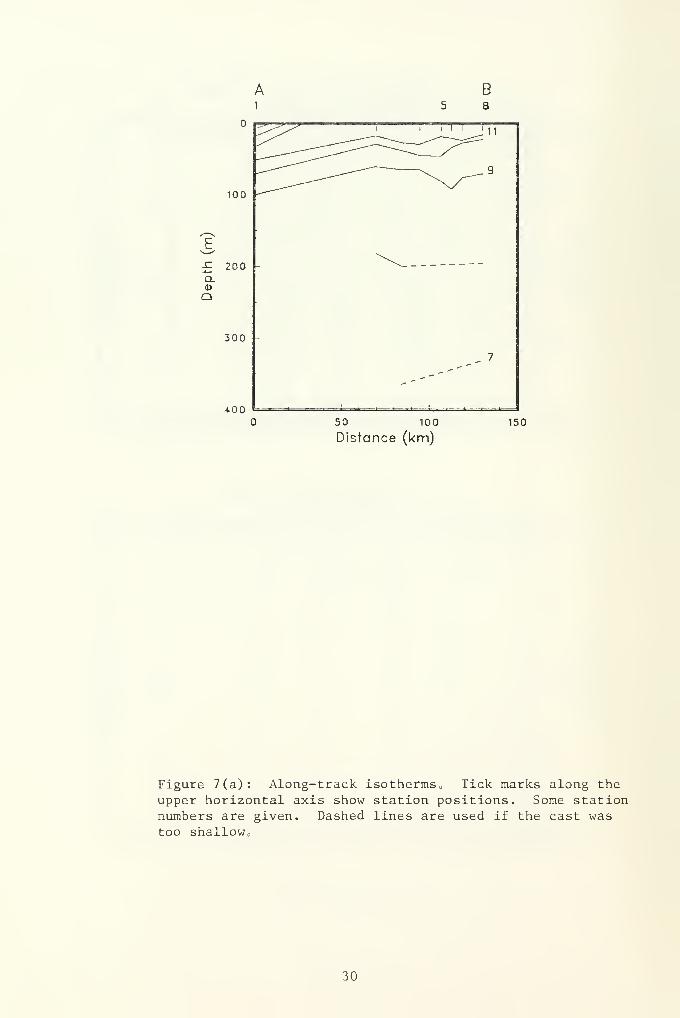
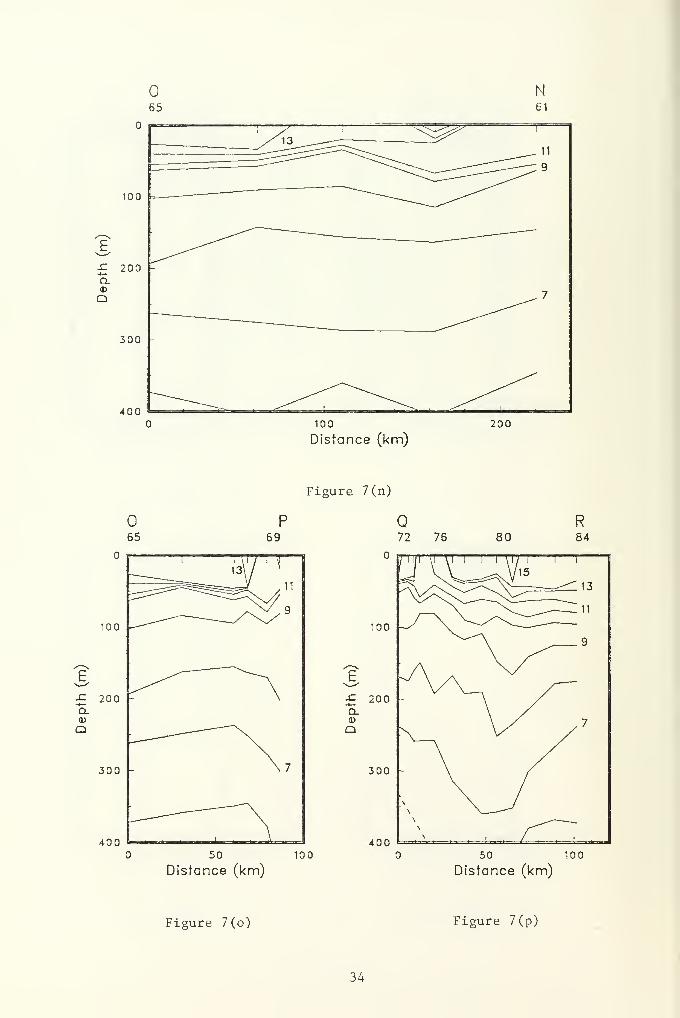
7. (a)-(z) Along-track isotherms. Tick marks along 30the upper horizontal axis show station
positions. Some station numbers are given.
Dashed lines are used if the cast was too
shallow.
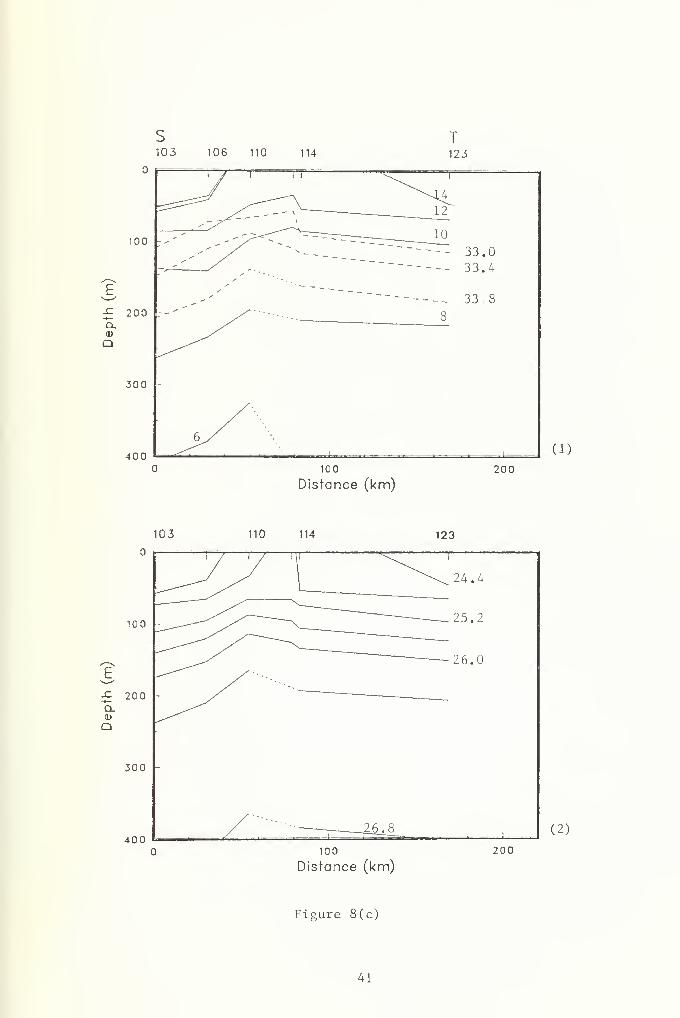
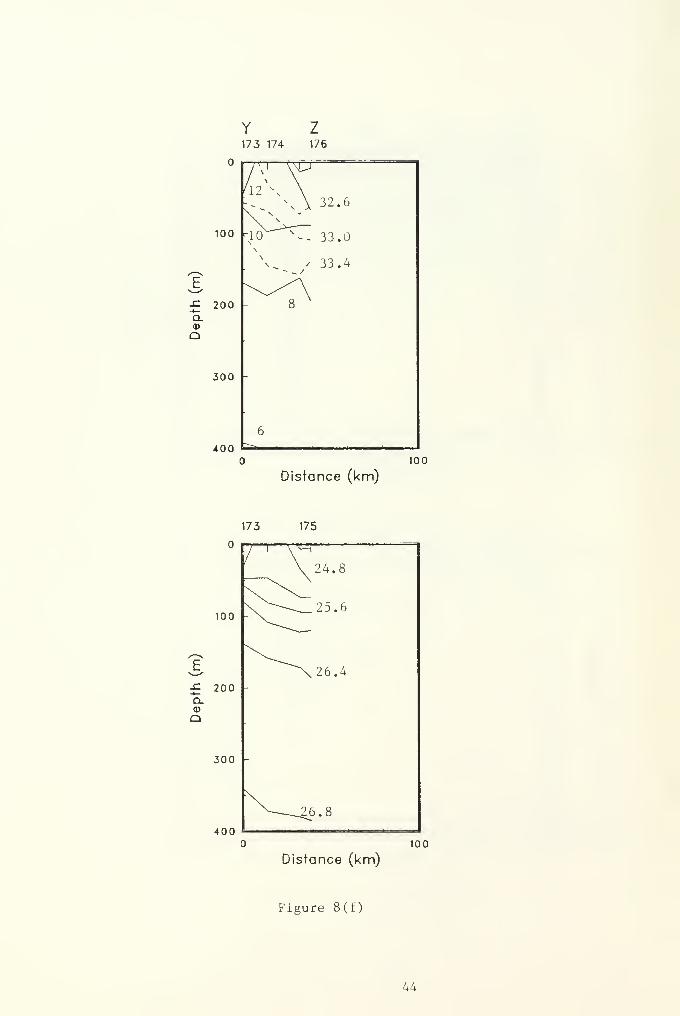
8. (a)-(f) Isopleths of (1) temperature and salinity 39
and (2) sigma-t from the CTDs.
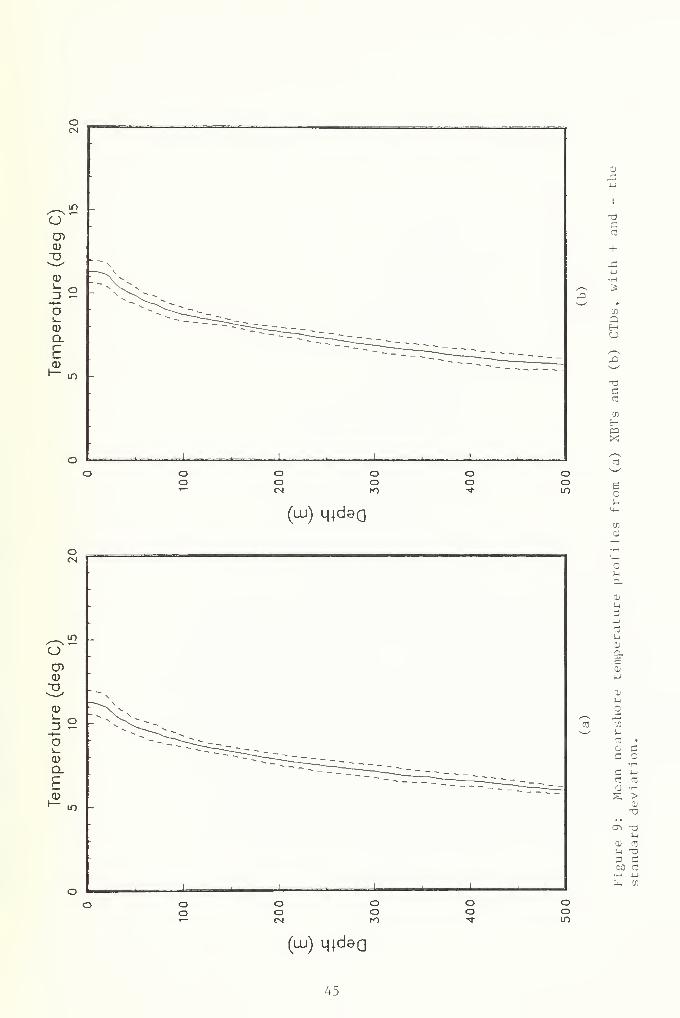
9. Mean nearshore temperature profiles from 45
(a) XBTs and (b) CTDs, with + and - the
standard deviation.
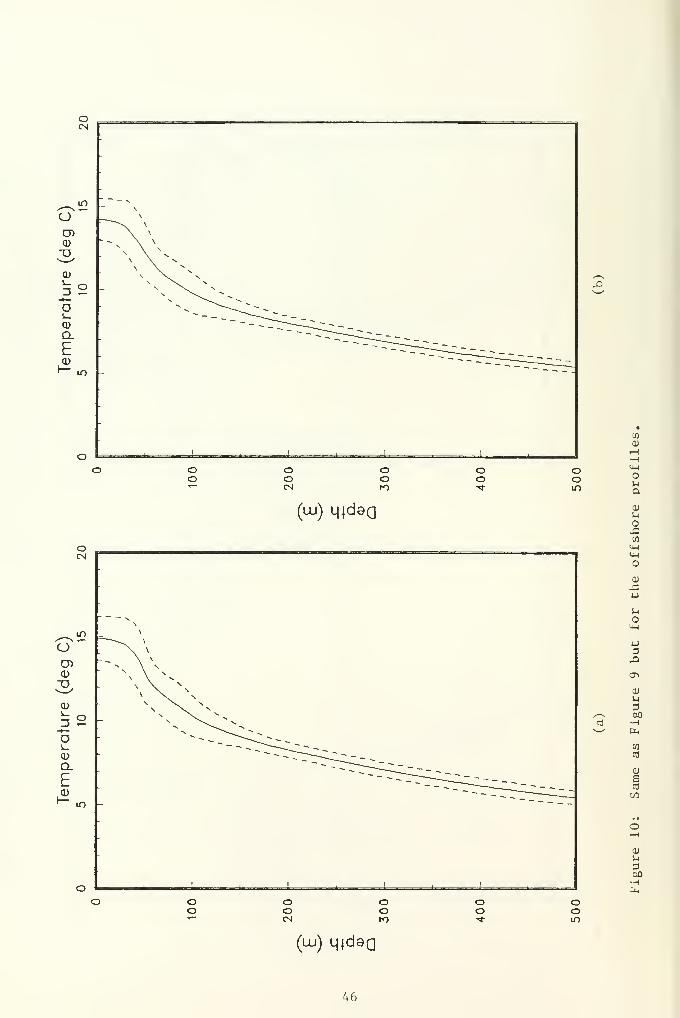
10. Same as Figure 9, but for the offshore 46profiles.
11. Mean profiles of (a) salinity and (b) 47
sigma-t. with + and - the standarddeviations, from the nearshore CTDs.
12. Same as Figure 11, but for the offshore 48
CTDs
13. (a) T-S pairs and (b) mean T-S relation, 49
with + and - the standard deviation, from
the nearshore CTDs. Selected sigma-t
contours are also shown.
14. Same as Figure 13, but from the offshore 50
CTDs.
15. Mean N 2profile ( ). from the nearshore 51
CTDs, with + and - the standard deviation
( ). The N 2profile from T(z) and S(z)
is also shown (• • ••).
16. Same as Figure 15, but from the offshore 52
CTDs.iii

THIS PAGE INTENTIONALLY LEFT BLANK

41N
39N
37N
35N
Eureka
Cape Mendocino
rena
San\Francisco
12SW 126W 124W 122W 120W
Figure 1: The NOCAL and CENCAL subdomains of the OPTOMA Program.
Isobaths are shown in meters.

INTRODUCTION
The OPTOMA (Ocean Prediction Through Observation, Modeling and Analysis)
Program, a joint NPS/Harvard program sponsored by ONR, seeks to understand the
mesoscale (fronts, eddies, and jets) variability and dynamics of the California
Current System and to determine the scientific limits to practical mesoscale ocean
forecasting. To help carry out the aims of this project, a series of cruises has been
planned in two subdomains, NOCAL and CENCAL, shown in Figure 1.
OPTOMA21 was a multidisciplinary study which took place from 7 to 20 July,
1986 aboard the R/V POINT SUR in the NOCAL domain (Figure 2). In addition to
conducting a quasi-synoptic CTD/XBT mapping of a cool anomaly, meandering jet,
and eddy system, measurements were made to determine:
- the fine scale variability of the upper ocean mass and velocity fields
- the upper ocean nutrient, optical and phytoplankton fields
- the structure of the zooplankton population.
In this report, the CTD/XBT data are presented.
DATA ACQUISITION
Data acquired during OPTOMA21 include profiles from Sippican XBTs and from
a Neil Brown CTD, with accuracies as given in Table 1. The XBT data were digitized
using a Sippican MK9 unit. All data were recorded, using an HP200 series
computer, on data disks. Station positions were determined by LORAN C fixes and
are claimed to be accurate to within about 0.1 km. Bucket surface temperatures and
water samples for salinity were taken at 73 CTD stations and used for calibration
purposes. The surface salinities from bottle samples were determined ashore by a
Guildline Model 8400 "Autosal" salinometer, with accuracy given in Table 1.
Continuous 2m thermosalinograph measurements and continuous
meteorological data, such as atmospheric pressure at a height of 2m and wind
speed and direction at a height of 20m, were also acquired. These data were
digitized, using an HP5328 frequency counter and a 40 channel digital voltmeter, and
then averaged over two-minute intervals.
All data were transferred to the IBM 3033 mainframe computer for editing and
processing.

DATA PROCESSING
Data processing, such as estimating depth profiles for the XBT temperature
profiles based on the descent speed, and conversion of CTD conductivity to salinity
using the algorithm given in Lewis and Perkin (1981), was carried out on the IBM
3033 at the Naval Postgraduate School. The data were then edited by removing
obvious salinity spikes and eliminating cast failures that were not identified during
the cruise. Approximately 99% of the casts were retained in the data set. From a
comparison of the CTD salinities with the salinity samples from the bottles, it was
determined that the average salinity offset was -.044 ppt. Since this offset value was
small, no correction was made to the salinities. The CTD data were interpolated to
5m intervals and then up and down casts were averaged.
The data have been transferred on digital tape to the National Oceanographic
Data Center in Washington, DC.
DATA PRESENTATION
The cruise track, station locations (with XBTs and CTDs identified) and station
numbers are shown in Figures 2, 3, and 4, respectively. On the cruise track figure,
transect extremes are identified by letter to aid in cross-referencing the data
presented in subsequent figures. These figures are followed by a listing of the
stations with their coordinates, the date and time when each station was occupied,
and the surface information obtained at the station.
Vertical profiles of temperature from the XBT casts are shown in staggered
fashion. The location of these profiles may be found by reference to the various
maps of the cruise tracks. Transect extremes are identified as nearly as possible.
The first profile on each plot is shown with its temperature unchanged; to each
subsequent profile, an appropriate multiple of 5C has been added. Vertical profiles
from the CTDs follow. Profiles of temperature are staggered by 5C and those of
salinity by 4 ppt.
Isotherms for each transect are shown in the next pages, followed by isopleths
of temperature, salinity and sigma-t, from the CTDs, when four or more casts were
acquired along a transect. Based on instrument accuracy and the vertical
temperature gradient, it is estimated that depths of isotherms in the main
thermocline are uncertain to ±20m. The tick marks identify station positions and,
again, the transect extremes are shown on these plots.
Mean profiles of temperature from the XBTs and CTDs are given for the
nearshore stations (1-61, 182-186) in Figure 9, and for the offshore stations (62-181,
187-196) in Figure 10. Salinity and sigma-t profiles from nearshore and offshore
CTDs are shown in Figures 11 and 12, followed by scatter diagrams of the T-S pairs
and the mean S(T) curves for the nearshore and offshore data, with the ± standard
deviation envelope. The data presentation concludes with plots of the nearshore
and offshore mean N~ (Brunt-Vaisala frequency squared) profiles, with ± the
standard deviations. On the sigma-t and N~ plots, the appropriate profiles derived
from the mean temperature and mean salinity profiles are also shown.

Table 1: Scientific instruments aboard the R/V POINT SUR
Instrument Variable Sensor Accuracy Resolution
Neil BrownCTDMark lllb
pressuretemperatureconductivity
strain gaugethermistorelectrode cell
1.6 db0.005 C0.005 mmho
0.025 db0.0005 C0.001 mmho
SippicanXBT
temperaturedepth
thermistordescent speed
0.2 Cgreater of 4.6mand 2% of depth
Sea-BirdSensors
temperatureconductivityat 2 meters
thermistorelectrode cell
0.003 C0.003 mmho
0.0005 C0.0005 mmho
Genera!EasternTemperatureSensors
air
temperaturedew pointtemperature
thermometer
condensationtemp.sensor
0.01 C
0.2 C
R.M. YoungWind Sensors
wind speedwinddirection
anemometervane
0.15 mph2.5 degrees
InternavLC 408LORAN C
position two chainLORANreceiver
100 meters 10 meters
40N
38N
36N127W 125W 123W 121W
Figure 2: The cruise track for 0PT0MA21

40N
38N
36N127W 125W 123W 121W
Figure 3: XBT and CTD locations for 0PT0MA21.

40N
38N
36N127W 125W 123W 121W
Figure 4. Station numbers for 0PT0MA21.

Table 2: 0PT0MA21 Station Listing
STN TYPE YR/DAY GMT LAT LONG SURFACE SURFACE BUCKET BOTTLE(NORTH) (WEST) TEMP SALINITY TEMP SALINITY(DD. MM)(DDD. MM)(DEG C) (PPT) ( DEG C) (PPT)
1 CTD 86188 1607 37.07 122.41 14.3 33.522 CTD 86188 2105 37.39 123.05 11.9 33.63 11.63 XBT 86188 2220 37.45 123.13 11.44 CTD 86188 2319 37.48 123.18 11.3 33.235 XBT 86189 132 37.53 123.23 11.26 XBT 86189 216 37.56 123.25 11.87 XBT 86189 254 37.58 123.28 11.98 CTD 86189 357 38.04 123.31 11.5 33.179 XBT 86189 509 38.07 123.24 10.6
10 XBT 86189 539 38.10 123.19 10.311 XBT 86189 611 38.13 123.14 11.212 CTD 86189 646 38.15 123.12 10.7 33.8413 XBT 86189 728 38. 15 123. 19 10. 1
14 XBT 86189 800 38.15 123.26 9.915 CTD 86189 841 38.14 123.30 9.8 33.67 9.816 XBT 86189 1030 38.14 123.39 10.917 XBT 86189 1059 38.14 123.44 12.118 CTD 86189 1151 38.14 123.49 12.6 33.01 12.419 XBT 86189 1308 38.17 123.45 11.820 XBT 86189 1343 38.19 123.40 11.021 CTD 86189 1422 38.21 123.34 10.4 33.66 10.322 XBT 86189 1516 38.24 123.30 10.423 CTD 86189 1546 38.26 123.27 10.1 33.78 9.924 XBT 86189 1636 38.26 123.35 10.325 CTD 86189 1750 38.27 123.30 10.2 33.6525 XBT 86189 1714 38.26 123.30 10.226 XBT 86189 1906 38.27 123.50 11.127 CTD 86189 2003 38.28 123.56 10.8 33.5528 XBT 86189 2157 38.32 123.48 11.529 CTD 86189 2246 38.34 123.43 10.7 33.57 33.5530 XBT 86189 2354 38.37 123.36 9.931 CTD 86190 32 38.39 123.32 10.1 33.8632 XBT 86190 132 38.40 123.40 10.233 CTD 86190 253 38.40 123.48 11.2 33.3534 XBT 86190 414 38.41 123.56 12.135 CTD 86190 515 38.42 124.03 11.5 33.4736 XBT 86190 630 38.44 123.57 12.037 XBT 86190 753 38.46 123.55 11.838 XBT 86190 837 38.49 123.49 11.039 CTD 86190 912 38.51 123.45 9.7 33.8940 XBT 86190 1029 38.54 123.52 11.341 CTD 86190 1110 38.55 123.56 11.5 33.32 11.842 XBT 86190 1208 38.57 124.02 12.043 XBT 86190 1243 38.58 124.08 11.044 CTD 86190 1339 39.00 124.14 11.2 33.07 11.4

STN TYPE YR/DAY GMT LAT LONG SURFACE SURFACE BUCKET BOTTLE(NORTH) (WEST) TEMP SALINITY TEMP SALINITY(DD.MM)(DDD. MM)(DEG C) (PPT) (DEGC) (PPT)
45 XBT 86190 1507 39. 01 124. 07 11. 8
46 CTD 86190 1553 39. 00 124. 01 11. 6 33. 26 11. 9
47 XBT 86190 1712 39. 00 123. 54 11. 6
48 CTD 86190 1804 39. 00 123. 48 11. 3 33. 59 11. 449 XBT 86190 1908 39. 03 123. 53 11. 9
50 CTD 86190 2003 39. 04 124. 01 11. 4 33. 33 11. 7
51 XBT 86190 2130 39. 09 124. 09 12.
52 XBT 86190 2217 39. 12 124. 13 11. 6
53 CTD 86190 2316 39. 14 124. 19 11. 7 33. 31 12.54 XBT 86191 26 39. 14 124. 12 12. 1
55 XBT 86191 103 39. 15 124. 07 11. 956 CTD 86191 159 39. 15 123. 59 11. 6 33. 25 11. 857 CTD 86191 331 39. 16 123. 52 10. 8 33. 56 11.
58 XBT 86191 422 39. 16 124. 00 11. 3
59 CTD 86191 531 39. 17 124. 05 11. 7 33. 26 11. 9
60 XBT 86191 707 39. 19 124. 16 12.61 CTD 86191 931 39. 19 124. 21 11. 6 33. 35 11. 6
62 CTD 86191 2016 38. 49 124. 26 14. 32. 71 14. 3
63 CTD 86192 400 38. 20 124. 24 12. 1 33. 28 12. 464 CTD 86192 1315 37. 54 124. 23 13. 5 32. 87 13. 865 CTD 86192 2119 37. 20 124. 22 13. 1 32. 80 13. 5 32. 8466 CTD 86193 330 37. 35 124. 32 13. 9 33. 2267 CTD 86193 922 37. 49 124. 42 13. 9 33. 12 14. 3
68 XBT 86193 1158 37. 52 124. 46 14. 1
69 XBT 86193 1306 37. 57 124. 48 11. 870 CTD 86193 1415 38. 01 124. 51 12. 6 32. 79 12. 871 CTD 86193 1724 37. 51 124. 47 14. 1 33. 13 14. 3
72 XBT 86193 1741 37. 51 124. 49 14. 3
73 CTD 86193 1843 37. 54 124. 47 13. 9 33. 11 14. 1
74 CTD 86193 2020 37. 55 124. 48 13. 4 33. 17 13. 875 CTD 86193 2131 37. 56 124. 50 11. 2 32. 88 11. 676 CTD 86193 2354 38. 01 124. 50 12. 7 32. 76 12. 9
77 CTD 86194 238 38. 05 124. 54 14. 7 32. 64 14. 878 CTD 86194 530 38. 08 124. 57 14. 7 32. 64 14. 979 CTD 86194 812 38. 13 124. 59 14. 7 32. 62 14. 980 XBT 86194 934 38. 17 125. 03 14. 981 XBT 86194 1023 38. 21 125. 05 15. 1
82 CTD 86194 1128 38. 25 125. 09 14. 6 32. 63 14. 8 32. 6483 XBT 86194 1327 38. 33 125. 12 14. 9
84 CTD 86194 1452 38. 39 125. 17 14. 5 32. 68 14. 885 XBT 86194 1616 38. 33 125. 17 15.
86 XBT 86194 1647 38. 28 125. 17 15. 1
87 CTD 86194 1741 38. 23 125. 17 14. 8 32. 65 15. 1
88 XBT 86194 1843 38. 18 125. 18 15. 2
89 XBT 86194 2016 38. 08 125. 17 15. 3
10

STN TYPE YR/DAY GMT
90919293949595979899
100101102103104105105107109110111112113114115117118119120121122123124125126127128129130131132133134135
XBTXBTXBTXBTXBTXBTXBTXBTXBTXBTXBTXBTXBTCTDXBTXBTCTDX5TXBTCTDXBTXBTCTDCTDXBTXBTXBTXBTXBTXBTXBTCTDXBTXBTCTDXBTXBTCTDXBTXBTCTDXBTXBTCTD
8619486194861948619586195861958619586195861958619586195861958619586195861958619586195861958619586195861958619586195861968619686196861968619686196861968619686196861968619686196861968619686197861978619786197861978619786197
210622242316
3
145239345500603708805911
102511371332141815241659183519582207230523552053487188571004110412101322150517251825201721552323
3
202251408525608715
LAT( NORTH
)
(DD. MM)
38. 0337. 5837. 5337. 4937. 4237. 3837. 3337. 2837. 2237. 1737. 1337. 0737. 0136. 5837. 0237. 0837. 1137. 1437. 2037. 2337. 2837. 3237. 3537. 3737. 4137. 5037. 5437. 5938. 0338. 0838. 1238. 1738. 1138. 0838. 0237. 5637. 4837. 4737. 4337. 3837. 3337. 2837. 2337. 19
LONG SURFACE(WEST) TEMPDDD. MM)(DEG C)
SURFACE BUCKET BOTTLESALINITY TEMP SALINITY( PPT) (DEG C) ( PPT)
125. 18125. 19125. 18125. 20125. 20125. 18125. 16125. 17125. 17125. 17125. 16125. 17125. 17125. 17125. 22125. 26125. 28125. 29125. 32125. 35125. 39125. 42125. 43125. 45125. 48125. 55125. 57126. 00126. 03126. 07126. 10126. 13126. 14126. 13126. 13126. 13126. 12126. 12126. 14126. 12126. 12126. 14126. 13126. 11
15. 415. 3
15. 3
14. 7
12.
14.
14.
14.
13.
13.
14.
16.
16. 9
16. 6
17.
17.
16. 7
17.
14. 413.
14. 2
12. 3
12. 413. 7
14. 8
15. 2
15. 3
15. 3
15. 3
15. 2
14. 9
15. 2
14. 9
15.
15.
15. 1
14. 8
14. 8
15.
14. 9
14. 816. 3
16. 416. 6
32. 94
32. 89
32. 82
32. 8832. 69
16. 8
16. 9
13. 2
12. 6
13. 9
32. 73
32. 71
32. 72
32. 70
32. 85
15. 4
15.
15. 1
16. 8
11

STN TYPE YR/DAY GMT LAT LONG SURFACE(NORTH) (WEST) TEMP(DD. MM)(DDD.MM)(DEG C)
SURFACE BUCKET BOTTLESALINITY TEMP SALINITY(PPT) (DEG C) (PPT)
136 XBT 86197 848 37. 13 126. 13 17.
137 XBT 86197 931 37. 06 126. 12 17. 1
138 CTD 86197 1018 37. 03 126. 12 16. 7 32. 97 16. 9
139 XBT 86197 1151 36. 55 126. 13 16. 7
140 XBT 86197 1233 36. 50 126. 12 16. 7
141 CTD 86197 1328 36. 47 126. 11 16. 4 32. 81 16. 7
142 XBT 86197 1437 36. 51 126. 10 16. 7
143 XBT 86197 1515 36. 54 126. 08 16. 8145 XBT 86197 1649 37. 04 126. 03 17.146 XBT 86197 1731 37. 08 126. 00 17. 3
147 XBT 86197 1820 37. 13 125. 57 16. 8148 XBT 86197 1904 37. 17 125. 55 16. 2
149 XBT 86197 1956 37. 21 125. 52 15.
150 XBT 86197 2038 37. 26 125. 51 13. 6
151 XBT 86197 2123 37. 31 125. 50 13. 9
152 XBT 86197 2216 37. 36 125. 49 14. 7
153 XBT 86197 2304 37. 42 125. 47 14. 7
154 XBT 86197 2349 37. 45 125. 46 14. 9
155 XBT 86198 44 37. 51 125. 46 14. 9
156 XBT 86198 136 37. 56 125. 42 15. 3
157 XBT 86198 233 38. 00 125. 39 15. 3
158 CTD 86198 309 38. 02 125. 39 14. 9 32. 70159 XBT 86198 456 37. 56 125. 37 15. 8
160 XBT 86198 612 37. 51 125. 36 14. 8161 XBT 86198 727 37. 47 125. 33 14. 5162" XBT 86198 904 37. 39 125. 29 13. 7
163 XBT 86198 1203 37. 32 125. 27 13. 9
164 XBT 86198 1345 37. 26 125. 20 14. 2
165 XBT 86198 1520 37. 20 125. 13 14. 7
166 XBT 86198 1809 37. 09 125. 01 13. 8167 CTD 86198 2026 37. 02 124. 55 14. 2 32. 77 14. 4168 CTD 86198 2305 37. 13 124. 56 14. 8 33. 15 15. 3
169 CTD 86199 128 37. 25 124. 56 14. 5 33. 28 14. 6170 CTD 86199 350 37. 37 124. 57 14. 33. 08 14. 5
171 CTD 86199 559 37. 47 124. 58 13. 33. 04172 CTD 86199 822 37. 52 124. 57 12. 9 33. 30 13. 3
173 CTD 86199 1027 37. 42 124. 57 13. 9 33. 11 14. 3 33. 08174 CTD 86199 1230 37. 50 124. 57 11. 8 32. 96 32. 96175 CTD 86199 1427 38. 00 124. 57 14. 6 32. 74176 CTD 86199 1611 38. 03 124. 57 14. 6 32. 80177 XBT 86199 1810 38. 05 124. 45 14. 7
178 XBT 86199 2124 38. 08 124. 32 13. 7
179 CTD 86200 47 38. 15 124. 17 13. 7 33. 12180 XBT 86200 208 38. 19 124. 09 13.
181 XBT 86200 310 38. 22 123. 58 12.
12

STN TYPE YR/DAY GMT LAT LONG SURFACE SURFACE BUCKET BOTTLE(NORTH) (WEST) TEMP SALINITY TEMP SALINITY(DD.MM)(DDD. MM)(DEG C) (PPT) (DEGC) (PPT)
33. 90
33.00 12.3
32.97 13.3
32. 81
33. 55
182 XBT 86200 425 38. 26 123. 45 11.
183 CTD 86200 557 38. 29 123. 34 10. 4
184 XBT 86200 827 38. 18 123. 37 10. 9
185 XBT 86200 919 38. 09 123. 39 12. 2
186 CTD 86200 1006 38. 05 123. 40 11. 8
187 XBT 86200 1201 37. 53 123. 43 11. 2
188 CTD 86200 1330 37. 37 123. 49 13.
189 XBT 86200 1543 37. 32 123. 52 14. 2
190 CTD 86200 1703 37. 25 124. 01 14. 3
191 XBT 86200 1952 37. 20 123. 47 14. 1
192 XBT 86200 2207 37. 14 123. 35 14. 1
193 CTD 86200 2306 37. 13 123. 33 13. 8
194 XBT 86201 55 37. 10 123. 17 13. 6
195 XBT 86201 154 37. 07 123. 05 14.
196 XBT 86201 254 37. 05 122. 54 13. 6
13

oCM
Q f | | | |I I I I -i-
o oo
111 I.
i i i I i i i i
I i , , ,
ooCM
OO
OO
oom
ooCO
oo
oo00
•H
3s
T30)
S-l
01
&0&0CO
o
OJ
u3•uca
n<u
aS01
4-1
H«
CO
00•H
(lu) M|daa
14

oCI
o
oo
u-
H
o I I
'I I i
'
1 I
' 'I
' I ''
I I I II I i I I I I I
oo
oocs
oo
OO
ooID
(lu) Mjclaa
15
oo
OO
oooo

oo
oo
o o oo o oro -+ m
(LU) L||d8Q
16
oo
Oo
oo00

o o O o o CD O oo o o o o O o o*- r^ fO «t Ul tD hs oo
m
u
M•HP*
(uj) qjdaQ
17

oCN
OO
O
QJ
m0)
u
•H
in
O '' ' ' I ' '
I ''
' ' 'I I I -t-t—4--+-
o o o o oo o o o o*- (N ro -+ m
(LU) L||d9a
oo
oo
ooCO

o
o
oo
o _CD
o i i i i i i i i i i i : i i i , i i i iI l l I I l l l loooooooooooooooo
(lu) Mjdaa
19
a)
uz-xH

o o O O o o o oo o O O o o o oCN K) ^ m to r-N 00
01
S-i
o60•Hfa
(iu) Ljjdaa
20

T3 aa; LOk_
Q)
eneno o
-i— Tf(/)
oto
o o O o o o o oo G o o o o o o"~ CN hO ^- m <£) rv 00
LO
-
—
(w) mdea
21

o
OO
OCD
O ' ' ' ' ' I I ' I I ' ' ' ' ' 'I ' ' ' Iooooooooooooooooo
"— CslrO^tLOcOI^oO
QJ
u300H
(lu) M|d9Q
22

200 -
400
0)
Q
600
Staggered Temperature (deg C)20 40 60
800
80
200
£ 400Q.
Q
600
800
_...,...."]
\
"'j!
'I
l ! ( 1 ... 1
' '
12-
123
1iI
'I
-
1 5
I3»1
t>5
<
8
B C D
Figure 6(a): CTD temperature profiles, staggered by multiples
of 5C, and salinity profiles staggered by multiples of 4 ppt.
13
Staggered Temperature (deg C)
20 40 60
800
30
Staggered Salinity (ppt)
40 50 60 70 80m200
3139
48
41
£ 400
Q
600
29
50
33
80027 35 44 46 53
F G HI J K L
Figure 6(b)
24

Staggered Temperature (deg C)20 40 60
o p
200 -
400Q.
a
600
800
30
Staggered Salinity (ppt)
40 50 60 70
200
£ 400
Q
600
800
Ti if i r i 7 i i i y l i
i' i
57
56
80
59 61 62 63 64 65 66 67 70
M N
Figure 6(c)
2 5

Staggered Temperature (deg C)
20 40 60
200
£ 400"q.
Q
600
800
-i 1 1 r-
77 78 79 82 84
Staggered Salinity (ppt)
30 40 50 60 70'T-T-fl T ! 'M P
1
! I'll T ' ! | I 'I ' IM'I I ! H"
71
200
£ 400"o.
a
600 -
73 74 75 76
80
800Q
77 78 79 82 84
"R
Figure 6(d)
26

Staggered Temperature (deg C)20 40 60
200
£ 400"a.
a
600
30087 1C3 106 110 "* 123 126 129 132 135
30
Staggered Salinity (ppt)
40 50 60 70 80T I ! II
II I'll \ TTl
200
£ 400
03
Q
600
113
87 103 106 110
800
114 123 126 129 132 13?
T
Figure 6(e)
27

Staggered Temperature (deg C)
20 40 60
200 -
-P 400 -
CL
600
800
30
Staggered Salinity (ppt)40 50 60 70 80
200 -
400 -
a
600
800'38 141 158 167 168 169 170 171 172 173
U V W ™"
~
Figure 6(f)
28

Staggered Temperature (deg C)20 40 60
200 -
400
<D
Q
600 -
800
30F^
200 -
£ 400a.
Q
600
800
Staggered Salinity (ppt)
40 50 60 70 80
Ti t i "r— :—r- p t—r —<—ri-i—i—i—i
—
f r' i r i i i
—
r t- t
133
! I
174 175 176 179 186 188 190 193
a
Figure 6(g)
29
Q
B8
50 100
Distance (km)150
Figure 7(a): Along-track isotherms „ Tick marks along the
upper horizontal axis show station positions. Some stationnumbers are given. Dashed lines are used if the cast wastoo shallow.
30

B8
c12
^11 ''
I'
100
£ 200
0)
Q
300 -
^00 '<
'' ' '
50
Distance (km)
-C 200 -
Q-
Q
50
Distance (km)
Figure 7(b)
40050
Distance (km)
Figure 7( c)
F E27 23
CL
a
100
200 -
300 -
40050
Distance (km)
Figure 7(d) Figure 7(e)
31

F27
G31
100 -
£ 200
Q
300 -
40050
Distance (km)
Figure 7(f)
H 1
35 39
100
£ 200 -
300
400 f' '
50
Distance (km)
H35
G31
100 -
-C 200 -
Q.
Q
300 -
40050
Distance (km)
Figure 7(g)
43 39
100
£ 200 -
<D
Q
300
400 ' ' ''
50
Distance (km)
Figure 7(h) Figure 7(i)
32

J
44K48
-C 200Q.
Q
50
Distance (km)
52
K4 8
-C 200 -
Q-
300
400 f i i i i i I
50
Distance (km)
L53
Figure 7(j)
M57
u y1
~7"
I
,9
100
T
"a.
Q
200
300
Ann 1
s_7
i 1
1
i ' i
50
Distance (km)
N61
Figure 7(k)
M57
aQ
100
200 -
300 -
400 r'
m '
50
Distance (km)
Figure 7(1) Figure 7 (m)
33
65
100
£ 200CL
Q
300
400100
Distance (km)
N61
200
Figure 7(n)
65
400
69
40050 100
Distance (km)50 100
Distance (km)
Figure 7(o) Figure 7(p)
34

103 100 96 92R
88 84
Q_
Q
100
200
300
400100
Distance (km)200
Figure 7(.q)
400100
Distance (km)
200
Figure 7(r)
3 5

u139
400
135 131 127
T123
100
Distance (km)200
Figure 7(s)
u141
Cla>
Q
100
200
300
400
146 150 154
V158
100
Distance (km)200
Figure 7(t)
36

w V165
100
200 -
Q.
Q
300
400
162
100
Distance (km)200
Figure 7(u)
w167
a.a>
Q
X171
50 100
Distance (km)
40050 100
Distance (km)
Figure 7(v) Figure 7 (w)
37

z176 180
a183
-£= 200 -
Q
50 100
Distance (km)
b190
200 -
a.
Q
300
400
187
Figure 7(x)
a183
b190
50 100
Distance (km)
194
50 100
Distance (km)
Figure 7(y) Figure 7(z)
38

B3
Dis
F27
H5 b
J
4 4
L N5361
100 -
-C 200 -
Q.
300
400
\y/ i i
\
N.
/
\
\
\
\33.4^^'—~ *~
—
r-^
'
33.8 ,,''
10
/~—8
-
^s^
\r- 6
100
Distance (km)200
(1)
200 -
300
400100
Distance (km)
200
(2)
Figure 8(a): Isopleths of (1) temperature and salinity
and (2) sigma-t from the CTDs.
39

65 66
100
£ 200
Q
300 -
400
67 70 7174 76 78 79 82R84
100
Distance (km)200
(1)
65 67 7174 76 78 82
a
100
200
300 -
400100
Distance (km)
200
(2)
Figure 8(b)
40
103 106 110 114
T123
Q.
Q
100 -
200 7~
300 -
400100
Distance (km)200
(1)
103 110 114 123
100
200a.0)
a
300 -
400100
Distance (km)
200
(2)
Figure 8(c)
U\

U THI 138 135 132 129 126 123
Q.
a
uI I / I I I 1
/ 14
_- 1
33,0
33,8
_. _L_
—-—el' b-—
' 1 2_-^"~"~^"~
100
200
^>C ------ - -^£"
-----------8
300
^Ann /^ ^\.
100
Distance (km)200
(1)
141 138 135 132 129 126 123
Q.<D
Q
100
200 -
300 -
400
I
-
I I
—-i r"
—— I—'
24.4
25,2
-
26
26.4
26,8-i ~~~n -—
. ,,l .
100
Distance (km)200
(2)
Figure 8 (d)
42

w X167 168 169 170 172
CL0)
Q
100
200 -
300
400100
Distance (km)
167 169 171
100
£ 200
a
300
400
^ss£<1 1
- 25.6
/"/"^^\ 26.4
*,—
^
-— 1
>. 26.8
. 1—. ._—
_
100
Distance (km)
Figure 8(e)
43
Y Z173 174 176
Q.<1>
Q
100
200
300
400
/lJ \U
fl2\\ \\ A 32 .6
-10 \33 .0
s
\/ 33 .4
8X
6
100
Distance (km)
I73 175
/'
\ 24.8
100 -N. \_25.6
? ^X26.4"q.
a>
Q
200
300
mn—^26.8
Distance (km)100
Figure 8(f)
44
(UJ) q|d9(]
01
c
c
+—
T.
a—
-
en
Hx;
eo
'—
en
01
c-
0)-
CO
01
ex
0)
Cfi
S-i
oi cC O
•HC J->
03 «01 -H
s >0)
T3
M0) 03
^ -od c00 03
•H -U
X X
(lli) LjjdaQ
o
oCN
O *~
U)Q>
CD
^2
CD
CL
CD
m
-
\
\
~"^v^ \
\ \
*"\\\\ \ v
-x
, 1 , 1 , 1 , 1
oo
ooCN
OOto
Oo
oo
(LU) mCJGQ
oCN
o *"
C7>
CD
TO,
CD
CD
CL
E.CD
in
\
V
r~^\ \"^ \ s
V \ X
V x. x\ x. Xx X. s
X ^^-^^^ ^ ^" - - ,. ,. jr~~~~^~r - - >.
-
_ , 1 , 1 _L. 1 , 1 L _
oo
ooCN
OOm
oo
oom
(LU) md9Q
46

(lu) q|d8a
>n"3
-3
uCO
crj
cfl
+
->
H3
~3
C
>11-1
•HcHHca
en
H-l
-/I
D •— X•H Q
!-^H Ho U•-
PL, 0)'-
c o"1 rCu CO
S IM-3
1>
• c—
i
,—
i
-J
43j *J
M3 5c£H !-J
J- M-l
(LU) L|{d9Q
47

CN
C7>
D CN
rOCN
•__---
-^T^"-""
--^^^^=^r===^^== r̂^ r̂^'
•
' s 'f / /
/ / // / /
/ / '
/ /_/ /
—-— /
//
__ _ •
1
—
L u 1 1,.— L, - ... ,
oo
ooCN
OOro
oo
oom
(iu) q|d9Q
fO
K)
CN
-
- _ *—
S J^ j *
' / '' / '
S / y/ / /
t / /' / '
' / /•- — -" jS f/ /— ^^^ f—*^ s
/s
, 1— —_ 1 , J l_ 4 ii
oo
ooCN
OOK)
Oo
ooIT)
(hi) qjdaQ
48

9'e
*e
9a
(3 §ap) ajn^Bjaduisj,
m CT r^
X '""••-..
'•.,
'•"•'•'^^S^^&&&"m**r'>' ''•-...,
'%...
""*<?
'•-.'%...
,_ _L_X 1 , J 1 ''-.I 1-. 1 1 , ,-1 !
O-1" •Hen 4-1
—>
+J 0,
ft -a
ft —O -
>^ C cd
+-> ^ ~z•^ -^^ r-
C cd1
4 -J
.15to
yj—4-1 •
o cN 1 3m o
cd
O+ Cfl
.—1
o4-J
CO•H 0)
3 U03
C oi
O l-i
•H 34-1 OCd 4-1
<u oO u om CO 4-1
CJ
mean
T-
sigma-
o ^ 0)
<* -Q 4-1
CO03
T3 --H
-4->
Oh
C 03
cd CO
a 03
S-i •
o •H CO
co >^ o - —-i_) cd a H
L j -i—i *~^ a- r-l 1 03
i 1 H S-J
cd o
CO cd en
Ocd
N Oy
CO • • cCO-4 0)
0J 4-1
u3 So r-0 oH Vj
n Pn 4-1
(^ §9p) ajn^Bjadujax
49

or?
1/ A 1 M'fA'.'VlIk ' /I h .1 <
*&
1 ^i u
Sfc
(3 §sp) ajni^jaduiaj,
a,
C/3
QHacu
5-1
o
CO
0)
aJ3
0)
S-i
300•H
CO
co
CO
<r
01
s-i
300•H
r- cn
(3 §sp) ^jn^iejaduia^
50

0.0 1.0
104
x N2
(sec-2
)
2.0 3.0 4.0 5.0 6.0
100
200
Cl03
Q300-
400-
500
l I1 , 1 .
1
T-T
s
s /
I / y
1
/1
1
;
\
\
1
/
\
i /
' / >
i
l
/
l/
i
)
J
\
1
1
\ \
1 \
l / '
i'
\ 1'
i
j
'
')
'
'1
'
l '
/
'
i
l
i
1
1
\
!
1
1
It
IK
1 /
Figure 15: Mean N 2 profile ( ) from the nearshore CTDs, with
+ and - the standard deviation ( ) . The N 2 profile from TTT)
and S(z) is also shown (•'•')•
51

104
x N2
100
200
300-
400
500
6.0
Figure 16: Same as Figure 15, but from the offshore CTDs,
52

ACKNOWLEDGEMENTS
This research was sponsored by the ONR Physical Oceanography Program.The success of the fieldwork was strongly dependent on the competent, willing
support of the crew of the R/V POINT SUR. Members of the scientific cruise party
were:
Prof. Christopher N.K. Mooers, Chief Scientist, NPSMr. Jim Stockel, Party Chief, NPSMr. Tim Stanton, NPSDr. Burt Jones, USCDr. Libe Washburn, USCMr. Eric Olson. USCMr. Terry Garrett, USCMr. Dennis O'Neill, USCDr. Ann Bucklin, SIODr. Richard Bohrer, SFSU (Tiburon Center)Dr. Russ Flegal, UCSCMr. Phil Mote, Harvard Univ.
REFERENCE
Lewis, E.L. and R.G. Perkin, 1981: The Practical Salinity Scale 1978: conversion of
existing data. Deep Sea Res., 28A, 307-328.
53

INITIAL DISTRIBUTION LIST
Naval Postgraduate SchoolDepartment of OceanographyMonterey, CA 93943
Ms. Arlene A. Bird 33Mr. Paul A. WittmannMs. Melissa L. CiandroMr. Timothy P. StantonDr. Mary L. BatteenLCDR J. Edward Johnson. USNDr. Steven R. RampDr. David C. Smith. IV
LTJG Russell Brainard. NOAALT Michael Beasley, USN
Institute for Naval OceanographyBldg 1100 Room 311
NSTL, MS 39529
Dr. Christopher N.K. Mooers 1
Dr. Michele M. Rienecker 1
Harvard University
Division of Applied SciencesPierce Hall, Room 100DCambridge, MA 02138
Prof. Allan R. Robinson 1
Mr. Phillip Mote 1
Office of Naval Research (ONR)800 N. Quincy St.
Arlington, VA 22217
Dr. Thomas W. Spence 1
Dr. Thomas B. Curtin 1
Dr. Alan Herman 1
Dr. Eric Hartwig 1
College of OceanographyOregon State University
Corvallis, OR 97331
Prof. Robert L. Smith 1
Dr. Adriana Huyer 1
54

6. Jet Propulsion Laboratory (JPL)California Institute of Tech.4800 Oak Grove RoadPasadena, CA 91109
Dr. Mark Abbott (also at Scripps)
Commanding Officer
Fleet Numerical Oceanography Center (FNOC)Monterey, CA 93943
Mr. R. Michael Clancy
8. Sandia National LaboratoriesDiv. 6334Albuquerque, NM 97185
Dr. Mel Marietta
NOAA Ship CHAPMANNational Ocean Service, NOAAP.O. Box 1207Pascagoula, MS 39567
LCDR Craig S. Nelson, NOAA Corps
10. Scripps Institution of OceanographyUniversity of California, San DiegoLa Jolla. CA 92093
Dr. Ann Bucklin 1
Prof. Russ E. Davis 1
Dr. Jerome A. Smith 1
Mr. Phillip Bogden 1
11. Princeton University
Geophysical Fluid Dynamics ProgramP.O. Box 308Princeton, NJ 08540
Prof. George L. Mellor
12. Woods Hole Oceanographic Institution
Department of Physical OceanographyWoods Hole. MA 02543
Dr. John A. Spiesberger 1
Dr. Kenneth H. Brink 1
Dr. Robert C. Beardsley 1
35

13. Naval Ocean Research andDevelopment Activity (NORDA)NSTL Station. MS 39525
Dr. Dana A. Thompson 1
Dr. Alexander Warn-Varnas 1
14. Department of OceanographyUniversity of Hawaii2525 Correa RoadHonolulu. HI 96822
Prof. Lorenz Magaard
15. Div. of OceanographyRSMASUniversity of Miami4600 Rickenbacker CausewayMiami. FL 33149
Dr. Otis Brown
16. Applied Physics LaboratoryUniversity of Washington1013 NE 40th Street
Seattle, WA 98105
Dr. Thomas B. Sanford
17. School of OceanographyUniversity of WashingtonSeattle. WA 98195
Dr. Steven C. Riser
18. California Space Institute
MS-A021Scripps Institution of OceanographyLa Jolla, CA 92093
Dr. Robert L. Bernstein
19. Marine Sciences Research CenterState University of New YorkStony Brook. NY 11794
Prof. Dong-Ping Wang
56
20. Applied Physics LaboratoryJohns Hopkins University
Laurel, MD 20707
Dr. Jack Caiman
21. Pacific Marine Environmental LabNOAABldg. 3
7600 Sand Point Way. NESeattle, WA 98115
Mr. James R. Holbrook
22. Graduate School of OceanographyUniversity of Rhode Island
Kingston. Rl 02881
Dr. Everett F. Carter
23. Dept. of MeteorologyUniversity of MarylandCollege Park, MD 20792
Dr. James A. Carton
24. University of Southern California
Los Angeles, CA 90089
Dr. Burton H. Jones 1
Dr. Libe Washburn 1
25. San Francisco State University
Tiburon Center for Environmental StudiesP.O. Box 855Tiburon, CA 94920
Dr. Richard Bohrer
26. Institute of Marine SciencesUniversity of California, Santa CruzSanta Cruz, CA 95064
Dr. Russ Flegal
27. Defense Technical Information CenterCameron Station
Alexandria, VA 22314
57

28. Dudley Knox Library
Code 0142Naval Postgraduate SchoolMonterey, CA 93943
29. Research Administration (Code 012)Naval Postgraduate SchoolMonterey, CA 93943


3 2768 00347461