nr.7 1972 - tu/ealexandria.tue.nl/tijdschrift/ipo 7.pdf · l.p.a.s. van noorden, netherlands...
TRANSCRIPT

IPO ANNUAL PROGRESS REPORT
Nr.7 1972
EDITOK : D.BOUwHUIS
ADVISEK: H.J.A. VAN BECKUM
161 166 164 162 157 164 158 1~5 166 166 153 152 147 133 159 155
162 161 165 163 145 149 149 164 170 129 160 164 138 f49 134 153
166 136 166 161 134 138 167 165 167 165 145 163 165 126 125 133
162 163 159 163 161 143 149 166 165 165 154 154 144 141 153 129
136 168 165 122 164 139 165 165 137 134 143 136 166 150 149 141
137162162133161126163163169165169143152166138129
lSI 4 153 150 o o 2 166 142 16 o 3 0131153
1 61 155 1:34 o 139 130 6 88 65 14 167 137 126 o 143
158 2 lSI 142 o 165 161 5 I 15 5 126 139 138 144 o 148
145 2 148 125 o 4 2 19 169 5 115 168 150 140 o 173
I 51 4 142 152 o 166 166 144 126 58 6 130 130 90 2 154
164 7 149 127 5 163 168 136 169 140 51 o o 8 157 137
150 158 161 168 167 172 156 142 124 154 162 148 135 135 140 144
174 169 175 159 172 148 159 175 153 173 175 144 156 130 1LiO 176
193 186 183 148 143 162 172 174 165 172 132 130 136 142 173 149
198 172 193 160 192 ISO 172 177 158 139 146 177 150 137 137 159
THE NUMBEHS ABOVE kEPkESENl THE HELATIVE LUMINANCE LEVELS ON APHOTOMATkIX WHEN THE LEITEKS "IPO" AkE SUPEKIMPOSED ON n. SEE:"PHOIOMAlkIX COMPU"IEK INTEkFACE" COWlkIBUTED BY P.VEkHAGEN ANDM.ALEWIJNSE ON PAGE 115.
INSTITUTE FOH p[KCEPTION kESEAkCH INSIIIUUT VOOk PEkCEPIIE ONDEHZOEKINSULINDELAAN 2 EINDHOVEN TELEPHONE 040-756605/040~472485

ORGANISATION
supervisory board i.p.o
Ir. K. Kooij (chairman)Drs. J.H. BannierProf. Dr. J.F. SchoutenDr. Ir. K. TeerProf. Dr. J. Wemelsfelder
scientific board i.p.o.
Prof. Dr. H.B.G. Casimir (chairman)Prof. Dr. M.C. ColenbranderProf. Dr. J. Drooglever FortuijnProf. Dr. N.H. FrijdaProf. Dr. L.B.W. JongkeesProf. Dr. J. KoekebakkerProf. Dr. S.L. KweeProf. Dr. Ir. H. MolProf. Dr. A.J.B.N. ReichlingProf. Dr. R.J. RitsmaProf. Dr. P.C. VeenstraProf. Dr. A.J.H. VendrikProf. Dr. Ir. C.J.D.M. VerhagenDr. Ir. P.L. WalravenProf. Dr. P.J. WillemsProf. Dr. Ir. A. van Wijngaarden
director i.p.o.
Prof. Dr. C.A.A.J. Greebe
research associates
Eindhoven's-GravenhageEindhovenEindhovenEindhoven
HeezeUtrechtGroningenAmsterdamAmsterdamLeidenEindhovenAmsterdamAmsterdamGroningenEindhovenNijmegenDelftSoesterbergTilburgAmsterdam
Eindhoven
D.J.H. AdmiraalJ.J. AndriessenDr. H. BoumaDrs. D.G. BouwhuisDrs. B.L. CardozoDr. H. Duifhuis, for one year at Massachussetts Institute of Technology U.S.A.Dr. J.P.M. EggermontIr. F.L. EngelJ. 't HartDrs. A.F.V. van KatwijkIr. W.G. KosterF.F. LeopoldG.J.J. MoonenH.F. MullerDr. F.L. van NesDr. S.G. NooteboomI.H. SlisIr. J.A.J. RoufsJ.C. ValbrachtIr. L.L.M. VogtenJ. VredenbregtIr. L.F. Willems
research staff
M.A. AlewijnseH.J. BleilevenP.B.W. BoonstraTh.M. BosJ.J.A.M. van DunTh.A. de JongC.A. Lammers
II
{PO annual progress report 7 {972

G.H. van LeeuwenH.J. MeulenbruggeJ.J.M. NeelenA.C. van NesW.H. NoordermeerA.L.M. van RensR. van SchuurH. de Vries
s,ecretaries
Mrs T. Bennebroek-TesserMiss L.J. ClignettMrs M.J.J. Hougardy-VerbugtMiss J.W. Tielemans
library
Mrs J.M. HoogervorstMrs J.P.M. Swinkels-Kool
workshop
M.A. van den BanC.G. BastenJ.H. BolkesteinP.A.N. BroekmansC.Th.P. GodschalxG.C. JonathanH.E.M. MHotteJ.H. de VroomeD.J. van der Wees
advisers
Prof. Dr. A. Cohen (University of Utrecht)Dr. G.J. Fortuin
guest researchers
Mrs J. ten Have-de Labije, 4/9-19/9/1972. Laboratory of PsychophysiologyJan Swammerdam Institute, Amsterdam.
Miss C.M.J. Hulst (part-time) Occupational Medical Dept. of the Nederlandse Spoor-wegen (Netherlands Railways), Utrecht.
Th. Letowski, The Academy of Music, Warsawa, Poland 3/10-16/12/1972.L.P.A.S. van Noorden, Netherlands Organisation for the Advancement of Pure Research.C.J.W. Schiepers, Netherlands Organisation for the Advancement of Pure Research.Mrs Dr. N.N. Tsavena, 7/3-30/4/1972 Research Institute for Labour Protection and
Occupational Diseases, Sofia, Bulgaria.H. Verstralen, 15/8 - 30/9/1972. 0Cpt. of Experimental Psychology. University of
Nijmegen.
student assistents
H.G. Ligtenbarg, 1/2/1971 - 5/5/1972.A.H. de Voogd, 27/8/1971 - 24/11/1972.P.W. Verhagen, 1/12/1971 - 24/11/1972.
I I I
IPO annual progress report 7 1972

This report or any part thereof may not be reproduced in any form without the
written permission of the Institute for Perception Research. Reprints of the
separate contributions are available. Illustrations may be reproduced only
with explicit mentioning of source; copies will be appreciated.
IV
IPO annual progress report 7 /972

INTRODUCTION
The retirement of Dr. Schouten on August 31st, 1972, should constitute the maintheme of this introduction to the seventh issue of the I.P.O. Annual Progress Report.He has led the Institute from its foundation in 1957 until that day.To all those who regularly read this publication it will be clear that what he left
to his successor is a well equipped laboratory where a wide variety of subjectsranging from prosodic phenomena in human speech to the ergonomical aspects of oscilloscopcsis studied in an ambiance of not only interdisciplinary co-operation butalso fertilisation.
It is obvious that various styles are required for doing relevant research in suchwidely different fields.
These can in general not be expected to ensue from the mind of one single personas iS,of course, also to be seen from the striking differences in personality displayed by the various people who work on all these subjects in the I.P.O. The oneand outstanding exception to this has always been Dr. Schouten who continuouslyshowed an extremely keen and very often creative interest in everything that wenton in the Institute.
Personally I am in particular very grateful to him for his guidance during theperiod of six months preceding the date of his retirement, during which the shiftof the various responsibilities which together constitute the directorship of alaboratory was gradually effected.
This year's Annual Progress Report has been constructed along largely the same linesas the previous issues, being intended to serve the same general purpose.The major change which we made is the introduction of a few papers of a review character which should provide the reader with a context in which the more specificcontributions to this Report as well as other publications from the Institutecan be placed.
C.A.A.J. Greebe.
v
/PO annual progress report 7 /972

CONTENTSpage
organisation
introduction
contents
1 auditory perception
B.L. Cardozo
Topics in Audition
L.L.M. Vogten
Pure-Tone Masking of a Phase Locked Tone-Burst
2 speech
ii
v
vi
5
S.G. Nooteboom
A Brief Survey of some Investigations into the Temporal Organisation 17
of Speech.
S.G. Nooteboom
The Interaction of some Intra-Syllable and Extra-Syllable Factors
Acting on Syllable Nucleus Durations.
LH. Slis
On Coarticulation of Articulatory Effort and Syllable Boundaries.
3 visual perception
H. Bouma
Introduction I.P.O. Research on Vision 1972.
H. Bouma, F.L. Engel, H.E.M. Melotte
Technological Devices for the Visually Handicapped: Gap Between
Research Effort and Available Aids.
F.L. Engel, H.G. Ligtenbarg, T.M. Bos.
Conspicuity and Colour.
II. Bouma, A. L.M. van Rens
Reflection Problems of a Passive LX Display Provided with a Flat
Mirror.
J.J. Andriessen
Preferred Viewing Distance and Size of the TV Picture.
J.J. Andriessen
On the Optimal Luminance Transfer Function in Television.
4 perceptual and motor skills
W.G. Koster
Introduction.
VI
IPa annual progress report 7 /972
30
40
45
46
55
63
65
68
71

perceptual and motor behaviour
P.L. van Nes, R. van SchuurSpeed and Errors of Well-learned Verbal Response Sets.
medical physics
W.G. Koster, R. van Schuur
On the Origin of Physiological Tremor.
W.G. Koster, R. van Schuur
A Note on Parkinsonian Tremor
R. van Schuur, Th. Burema
On Controlling the Heartrate.
J. Vredenbregt
EMG Application in Low Back Pain
J. Vredenbregt
Electromyophone
5 instrumentation
D.J.H. i\dmira::tl
Introduction I.P.O. Instrumentation 1972.
M.A. Alewijnse
A Pulse-Width Light Modulator.
M.A. Alewijnse. J. Vredenbregt
A Six-Channel Electro-Myographic Measuring System.
73
80
88
92
98
104
105
107
1 1 2
P.W. Verhagen, M.A. Alewijnse
Photomatrix Computer Interface, 115On-Line Registration of Optical Configurations for Visual PatternRecognition.
6 i.p.o. publications 1972
IPO annual progress report 7 1972
VII
121

1 AUDITORY PERCEPTION

TOPICS IN AUDITION
B.L.Cardozo
It is intended to present in this article a general view of auditory work carried
out in the Institute for Perception Research and to give a brief account of inves
tigations in progress not reported in separate contributions. First, however, a
few rather generalizing remarks will be made about auditory research as a whole.
It is our belief that it is valuable to try and combine psychoacoustic and physiological data, even though our grasp of the hydromechanics of the cochlea is quiteweak, even though we have only sampled knowledge of the coding in the auditorypathway and even though, in particular, there is up to now virtually no physiological access to the connectivity and cooperation of auditory neurons. This belief doesnot imply that physiology is to become part of our research programme. But it doesform an argument for a good contact with workers in the field of physiology.In line with this, a Symposium on Hearing Theory was held at the Institute on June22 and 23, 1972, during which both theoretical an~experimental work was presentedon such problems as : the hydromechanics of the c02hlea, the coding of frequencyinformation and time information in the auditory pathway, inferences from the fre
quency and time characteristics of masking, and relations between dichotic hearing
and the perception of pitch, in particular the pitch of absent fundamentals.We come now to our research programme. One of the centres of standing interest has
been, and still is, auditory frequency selectivity. This has been investigated inthe past by measuring the audibility of harmonics in periodic pulse trains as well
as in periodic noise (Duifhuis 1970a, 1971 and Duifhuis and Tomesen, 1970). The
notion that a masking curve can be measured without interference from beats was
described by Cardozo (1967). Recently Vogten (1972) found an elegant method forscanning the masking curve of a continuous sinusoid with a phase locked probe,
which is free from beats proper. A thorough insight into the masking process is ofbasic importance for our understanding of the critical band. Ultimately it should be
possible to explain why the critical ratio happens to be of the order of - 4 dB,
a value which is so basic to the design of communication systems that one is inclined to take for granted that it will also hold in impaired ears - which probablyis often not true (cf De Boer, 1961).
It is evident that the critical ratio does not depend only upon the filter characteristic of the cochlea but involves also whatever device is operating at the output of this filter. Modelling of such devices with due regard to physiological datais one way of scanning the many possibilities and of concretizing intuitive notions.(cf Duifhuis, 1972).
Fortunately there are other phenomena than masking that shed some light upon audi
tory frequency selectivity, be it in a more general sense. The investigations of
Van Noorden (1972) into rhythmic fission and fusion should be mentioned here.Rhythmic fusion proper is confined to frequency jumps that corresponded rather wellwith the critical bandwidtil. But the fusion band may be widened by the listener
when he is consciously shifting attention to the different frequencies involved.
For these shifts a certain amount of time, not infinitely small, is needed. A secondvital finding of Van Noorden is that fusion is not perceived between pitches evokedbycomplex tones, whose band spectrums are sufficiently separated in frequency, eventhough the pitches of the tones are quite closely together.
IPO annual progress report 7 /972
2
These findings may once more warn us for simplifying theories in which the entire
process of pitch perception would be reduced to a purely mechanical operation in thecochlea. Rather, they seem to call for a hierarchy of processing stages of stimulieven as simple as pure tones.The intricacies of pitch perception have been brought out in recent years by theelegant experiments of Houtsma and Goldstein (1972), showing that listeners withgood musical ability perceive pitch (in terms of musical intervals) correspondingto a frequency g when presented with components ng and (n+1)g, irrespectively ofwhether these components are presented to the same ear or to opposite ears. Theirconclusion that "the pitch of complex tones is mediated via a central processoroperating on neural signals derived from those effective stimulus harmonics thatare tonotopically resolved" refutes the idea that unresolved components are essentialfor the perception of absent fundamentals. Experiments of Houtsma and Goldstein typeIIA (identification of musical intervals) have been repeated in this laboratory byour guest Letowski and Van Leeuwen.
They asked 8 subjects whether a given musical interval was a full tone up, a semitone up, a semitone down or a full tone down. The fundamental frequency g was chosenin the neighbourhood of 400 Hz, the components ng and (n+1)g were always presenteddichotically and n was either 2 or 3. Of course, n was randomized, so that listeningto the components would produce correct answers only in a fraction of the trials.5 subjects (4 of them with musical training) performed nearly perfectly as if theyheard the absent fundamental.
Within the experimental error performance was shown to be independent of the sensation level of the tones in the range 15 dB SL to 90 dB SL. At the high levels, abackground of white noise was necessary that would mask (crosstalk-)sinusoids up to35 dB SL. Subsequently the experiment was given a slight variation by introducingdifferent levels into the right and into the left ear. As is shown in Fig. 1 theperformance drops rather abruptly to chance level when the difference in sound levelsbetween the ears exceeds about 20 dB.
Our experiments measuring the interaural difference in the arrival time of clickseliciting lateralization have been repeated in order to find a better estimate ofthe internal (neural) jitter in the auditory system. In this series, the pulse rate
was taken to be 200 Hz in stead of 50 Hz as was the case in the earlier experiments(cf Neelen & Van Leeuwen, 1971). The general result is a confirmation of the earlierconclusion that the binaural lateralization system is characterized by an internaljitter of the order of 25/~s. The accuracy of the later measurements, unfortunatelyis not better than those already described. No attempt has been made to asses thisvalue for separate frequency regions in order to see whether jitter in the lateralization system is a function of frequency like was found in the pitch extracting
system (cf Cardozo, Rijckaert & Neelen, 1969). The measurements are quite laboriousand a considerable improvement in the technique would be needed.
Of a less theoretical nature is our interest in audiometry. Our efforts here are di
rected towards two goals. The first is to try and introduce techniques and strategieswhich have been developed in the laboratory towards finding thresholds or, moregenerally, measuring perception performance, into audiometrical practice. In the second place it is felt that there is a need for a better understanding of processesthat determine intelligibility of speech. Although we are aware of the extreme complexity of the problem, we think that even certain basic factors have not been explored sufficiently. For one thing, the differences in perceived loudness betweenvarious speech segments are not too well known. But the experiments of Van Nierop

3
RA 10cr-e--\X
0/0
o
.IH
x"'-...15:--------------
LV
50 dB60
i .,o~ ------ - - ---
O'---_--'--_----'-_----...J"'--_-'--_----'--------'"'--o 10 20 30 40
~-~ ~---------
50
5
LN
50 d8604030
50
50
o'::-_"'-::-_:"-:-_=-":'--_~-~~~ 0 I:-_:'-=-____:~____:~.....,...-_:_'::_-_:::!=_~::::'o 10 20 30 40 50 dB60 0 10 20 30 40 50 dB60LEVEL DIFFERENCE BETWEEN EARS
Fig. 1 Performance in recognizing one out of four musical intervals as a function
of the sound level difference right ear (constant) minus left ear (variable).
The heavy lines (open circles) refer to 90 dB SL at right ear; at a difference
of 55 dB, the left ear stimulus would disappear in a masking noise, applied
equally to both ears. For the thin lines, these figures 're 40 dB SL and
30 dB respectively.
(cf Cardozo & Van Nierop, 1970, and Slis & Van Nierop, 1970) have shown that soundintensity of one speech segment may well affect the perception of a word.
This problem may also be phrased in the following way : what is the effect of the
consonant-to-vowel power ratio upon the intelligibility of speech? This has led tomeasurements of the dynamic range in speech as a function of vocal level. And thishas in turn inspired de Jong to measure the static pressure in the mouth duringocclusion with Ipl and It I in combination with the sound pressure produced duringthe release of the plosives and also during the adjacent vowel (Cardozo & de Jong,1970, de Jong 1971). These measurements have been repeated and extended recently.The overall result was a confirmation (of the previous finding) that the sound levelof the plosives is directly proportional to the intraoral pressure before release,
but that the sound level of vowels is directly proportional to (an estimate of) thesubglottal pressure in the power 1.6 approximately.

4
references
Boer, E. de (1961) Measurements of the Critical Band-Width in Cases of PerceptionDeafness, Proc. III Int. Congress Acoust., Elsevier, Amsterdam, p. 100-102.
Cardozo, B.L. (1967) Ohm's Law and Masking, I.P.O. Annual Progress Report l, 59-64.
Cardozo, B.L. (1970) The Perception of Jittered Pulse Trains; in: Plomp and Smoorenburg, editors: Proc. of the Int. Symposium on Frequency Analysis and PeriodicityDetection in Hearing, Sijthoff, Leiden. p. 339-349.
Cardozo, B.L. and Jong, Th.A. de (1970) Some Measurements of Dynamic Range in Speechas a Function of Vocal Level, I.P.O. Annual Progress Report ~, 6-10.
Cardozo, B.L. and Nierop, D.J.P.J. van (1970) Some Psychoacoustic Measurements ofForward Masking Relevant to the Perception of Speech, I.P.O. Annual ProgressReport ~, 1-5.
Duifhuis, H. (1970) A Tentative Firing Model for the Auditory Receptor, I.P.O. AnnualProgress Report 2, 18-24.
Duifhuis, H. (1970a) Audibility of High Harmonics in a Periodic Pulse.I, J. Acoust.Soc. Amer. ~, 888-893.
Duifhuis, H. (1971) Audibility of High Harmonics in a Periodic Pulse .II, J. Acoust.Soc. Amer. ~, 1155-1162.
Duifhuis, H. (1972) Perceptual Analysis of Sound; doctoral thesis, University ofTechnology, Eindhoven.
Duifhuis, H. and Tomesen, H.H. (1970) Audibility of Harmonics in 'Periodic WhiteNoise', I.P.O. Annual Progress Report 2, 15-17.
Houtsma, A.J.M. and Goldstein, J.L. (1972) The Central Origin of the Pitch of ComplexTones: Evidence from Musical Interval Perception, J. Acoust. Soc. Amer. 2!,520-529.
Jong, Th.A. de (1971) The Influence of Subglottal Pressure on the Vowel-to-ConsonantRatio, I.P.O. Annual Progress Report ~, 35-37.
Neelen, J.J.M. and Leeuwen, G.H. van (1971) Lateralisation Accuracy as Affected byInteraural Jitter, I.P.O. Annual Progress Report ~, 5-8.
Noorden, L.P.A.S. van (1971) Rhythmic Fission as a Function of Tone Rate, I.P.O.Annual Progress Report ~, 9-12.
Slis, I.H. and Nierop, D.J.P.J. van (1970) On the Forward Masking Thresholds of Vowelsin VC Combinations, I.P.O. Annual Progress Report ~, 68-73.
Vogten, L.L.M. (1972) Pure Tone Masking of a Phase Locked Tone-Burst, this issue.

5
PURE-TONE MASKING OF A PHASE-LOCKED TONE BURST
L.L.M.Vogten
introduction
In literature a large number of auditory masking experiments have been reported, in
which the threshold shift of a masked signal (the probe) is investigated owing to thepresence of a pandom or pseudo random masker, e.g. a band of noise.Substantially fewer results have been published about simultaneous masking with narrowband detepministic stimuli, particularly with a stationary sinusoidal masker.In general, the use of narrow-band stimuli results in more complicated masking patterns,
owing to the detection of interferences or beats, combination tones and harmonics(e.[. Egan 1950, Zwicker 1967, Ehmer 1959 and Greenwood 1971). If, however, we takean entirely deterministic stimulus, it will be possible to give an exact physicaldescription of the interaction between probe and masker, also for unequal frequencies.Mainly within the frequency region where bsats affect the masking results, the interaction and cross correlation between masker and probe is determined by the differencein frequency as well as by the mutual phase relation. Fixing this phase relation,even when probe-carrier and masker frequency are not exactly equal, allows of determining which part of the threshold shift must be attributed to changes in the stimulus.In the present masking experiments we use, for systen-theoretical reasons, a stationarysinusoidal masker. The masking of a probe with a fixed carrier frequency f p will be
studied as a function of the masker frequency f m and~of the masker level Lm, especiallyin the ~~-ion where beats occur.
Before presenting the results concerning a probe with a smoothed envelope, we shall
calculate expressions of several basic physical :'crameters, like envelope, instantaneousfr~quency and energy, for a stimulus with a rectangular probe.For the present we shall not go into detailed measurements on the detection of combinationtones and harmonics.
literature
Experiments with a stationary sinusoidal masker are described by Egan (1950), Ehmer(1959), Small (1959), Green (1969), Greenwood (1971) and McFadden (1972). Table Ishows the most important data. All authors use as the probe a tone burst, with aduration varying from 10 up to 500 ms, except Small, who takes a stationary sinusoid.
Only McFadden and Green mention a fixed phase relation between probe and masker (viz.zero), however, only for the case of equal frequencies. Simple comparison of the results
is not possible, owing to the different probe durations and to the different c"oice ofthe variables plotted in the figures. Nevertheless, some remarks can be made:
(a) Details of the masking curves show large discrepancies. In the curves of Egan andMcFadden relative minima for f f are clearly discernible, while such minimam pare absent in Ehmer's curves. The other authors (Green, Small) present too fewdata points or avoid f = f at all (Greenwood). It is not clear whether thesem pdifferences are caused by differences in intensity, probe duration, instruction
of the subject or by an unfixed phase relatio~.
(b) As far as masking curves are given for more than one intensity, the relation betweenmaximum masking and the masker level is not a linear one.
IPO annual progress report 7 /972

average of 6
average of 3
no
no
method ofprobe
15, 30,dBSL
stationarysine wave
indep.variable
maskerstationary sine wave
dependentvariable
Small 1959
Egan 1950
hnumberp ase
----,-- --~ measure-Ilk d of, • I oc e .level L frequency f type level L If (carrler
f) I ment subJects
m m p I requency ~
PI40,60, I tone burst l \ adjustment individual80 dBSPL 0 kH ! 0.7 Hz i dependent!1 indep. II (detection curves I
o dBSL:: .4 z Ii T = 500 ms I variable variable I of no and, I '15 dBSPL II L = 100 ms i I I anything) average of 5 'I
iI-! IItone burst ! ' I
2 0, 4 0 , a . 2 5, O. 5 , 2 . 5 Hz I ddt!' d Ii B ~ k ~60 80 1 2 4 T = 200 ms ep~n en I ln ~p. 'i e es~
, d S'L 'k" " . h varlableL'varlable ill tracklng100 B 8 Hz Wlt out I,transient's"! II I I I
I II II I l--j10.4.0.8, !I adjustm:,nt '11.6,3.2, II (~etectlonl
16 . 4 kHz II ~nything)
I
IEhmer 1959
-0
Green 196970 dBSPL
I
I indep.! variable
1
'1 tone burstT = 9.5 ms
, "lightlyfiltered"
de pen den to. 2 5, :; 1 , IIvariable 2.8 kHz I
I
two-alt.forcedchoice
only forf = f :
m , p~ '" 0
average of 3
1no
45 tone burst I I IIGreenwood II ~~' 85 II 0.3, 0.6, 3 I'" I dell'endent I indep. ! modified
19 7 1 J 9 0 . d~ S P L I 1, 2 kHz ~ ~ 1 ~ ~ :: I vari a b 1 e I va r,_i_a_b_1_e -IIII_,_B_e_k_e_s_y__-+ -+ _
I tone b~~ : . ~wo- only for ~Mc 11 20 dBSPL I 0.4 kHz II T = 100 ms I dep:,ndent Ilnd:,p. lnterval f = f: avera e of 3 IFadden 1972 = 55 dBSL '1 varlable varlable forced m p g I
L = 0 ms ' . A-i cholce 'I' = 0 I I
Table I.
Review of some masking experiments with a stationary sinusoidal masker. T is the effective duration and T is t~e
rise/decay time of the probe. For more details the reader is referred to the original papers.

7
(c) The masking curves with the masker level kept constant are almost symmetrical ona logarithmic frequency scale up to 40 dB SL masker level (Greenwood, Ehmer).Beyond 40 dB SL the curves are asymmetrical; the slope of the steepest side remainsalmost constant while the other slope varies widely.
(d) For medium levels, notches in the masking curves for f < f can be attributed tom pthe detection of combination tones (Greenwood, Small), and for hig;1 levels to the
detection of harmonics (Egan, Ehmer, Greenwood).
envelope, instantaneous frequency and energy
The total energy content of the stimulus (probe + masker) depends largely on the difference in frequency and phase. In this section we shall ela~orate this dependence.Although a smoothed probe is used in the experiments, in this section the expressionsare, for simplicity, given for a rectangular tone burst, see Fig. 1.
14------To
Fig. 1. The stimulus as used in the calculations. Masker (upper curve): stationarysine wave with amplitude M and frequency f . The probe (lower curve) has anamplitude P and a carrier frequency f = 1mkHz. The probe duration T is anintegral number of probe carrier p periods. T is an integral number ofmasker periods and depends on f . a
m
The probe with a duration of T s is given by
for 0 < 1- < T
for T < t < To
( 1)
with Wo = 2nfp the carrier frequency, To the repetition time of the (quasi) periodi
cally presented probe (about 500 ms), and T = k/fp with k an integer.
For the masker we may write
M sin (rlt + ¢) M sin (wot + 6wt + ¢), (2)
in which 6w = 2n6f is the difference between the masker frequency ~ = 2nfm and theD!'Ore frenuencv wo ' and ¢ is the phase shift for t = 0, the time at which the probestarts (see Fig. 1).
After some calculations for the stimulus in the interval 0 < t < T, addition of (1)
and (2) yields:
8
(4)
MVf+P2+2p cos ([,wt+<j> ) i sin (wot+l/J(t)), (3)sin 6wt+<j>
with p = P!M and 1jJ(t) = arctan p+cos lIwt+¢)
from which it can be seen that the stimulus is modulated in both amplitude and
frequency (phase) since both are time dependent.
For O~t~T the instantaneous amplitude or stimulus envelope A is given byA(t)= M~p2+ 2 P cos (~wt+¢)
and the instantaneous stimulus frequency wmom ' defined as ~ (wot+¢(t)) ,by
(5)
may, to
l+p cos(lIwt+¢)w0 + lIw1+p2+Zp cos(lIwt+<j»
Wi th p« 1 (if M is not too low, P is smaller than 0.05), (4) and (5)a good approximation, be replaced by
and
A(t)= M + pM cos(lIwt+¢)
wmom(t)= n - pllw cos(lIwt+¢).O~t~T
( 4a)
(Sa)
The probe energy is E = fT(pP 0
Ep
= ~ p1 T (1
sin wot)2dt
_ sin Zwo1)2woT .
or(6)
Since the probe contains an integral number of carrier periods (T=k/fp)' (6) becomes
In the same way
E = Ip 2 TP 2 •
we obtain for the masker energy E = fTO(Mm 0sin
(7)
TO= £/fm and £ an integer:
Em = ~M2To·
The total stimulus energy Es in the interval O~t~To is
E = fTO{P sin Wot + M sin(lIwt+wot+~)}2dts 0
(8)
or Es
= E + E + ZMPwo {sin(lIwT+¢) - sin <j>}.m p lIw(2wo+lIw)
Hence, the energy difference between the stimulus with and without probe is given
by liE = E -E = 21p2T + MPT 2wo sin !lIwT cos(ll1wT+~)s m Zwo+lIw !lIwT 2 'f',(9)
being the sum of Ep and the cross correlation of probe and masker.
Special cases: (a) equal frequencies: liE = ~p2T + MPT cos <j>(lIw=O)
(9a)
(b) unequal frequencies,2wo sin lIwT
<j>=0 liE ~p2T + MPT Zwo+lIw lIwT (9b)
¢=1T/2 liE ~p2T + MPT 2wo cos lIwT - 1 (9c)2wo+lIw lIwT
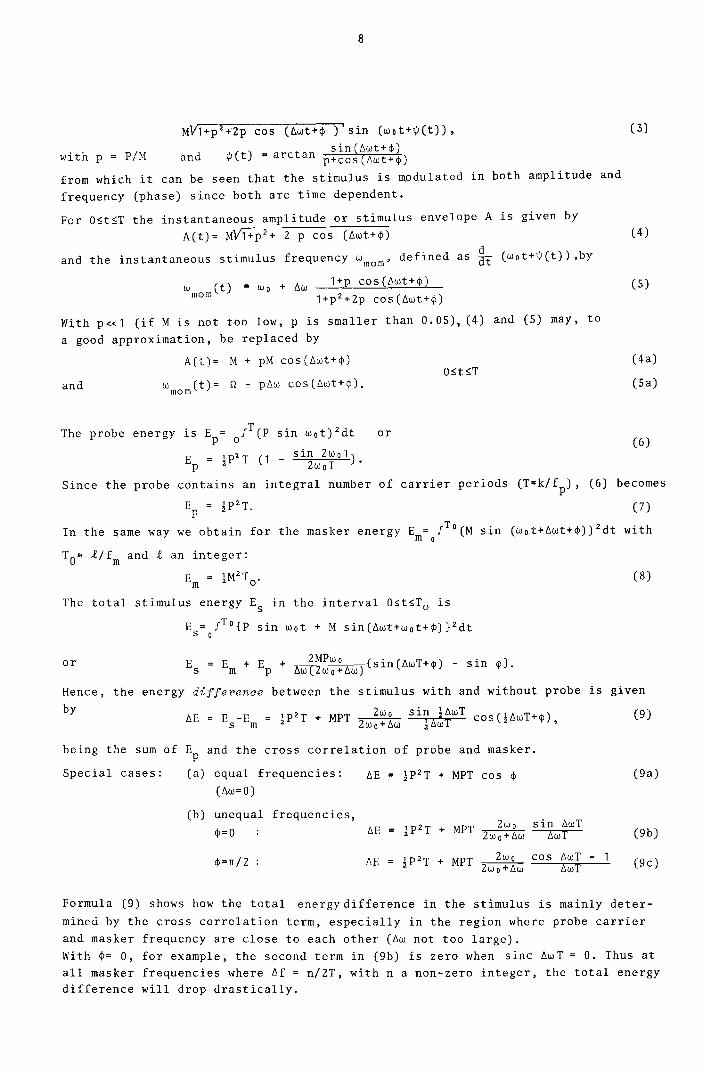
Formula (9) shows how the total energy difference in the stimulus is mainly determined by the cross correlation term, especially in the region where probe carrierand masker frequency are close to each other (lIw not too large).With ¢= 0, for example, the second term in (9b) is zero when sinc lIwT = O. Thus atall masker frequencies where ~f = n/2T, with n a non-zero integer, the total energydifference will drop drastically.

0.25·!O-9 Ws
10 Hz (the
O.
T: lOms
9
Example: for T = 50 ms, M = 2.5 mV and P = 0.1 mV it follows that !P2Tand MPT = 12.5.10- 9 Ws. So with <1>= 0 the 'energy difference llE for llffirst zero of sinc llwT) is 10 log 0.25 + 12.5 = 17 dB lower than at llf
0.25Therefore, interpreting masking results, it has to be realized that the alterationsin energy difference of the stimulus as a function of llw and <1>, play an importantrole in the detection of the probe.In the section on results we shall return to this point.
method
STIMULUS
The probe we used in the experiments is smooth shaped as shown in Fig. 2a. For aneffective probe duration of 10 ms and 50 ms the measured amplitude spectrum isplotted in Fig. 2b.
~=3ms
~T~Fig. 2a. The smooth-shaped probe as used in the experiments.
0.8 1.0 1.2 kHz 1.,.FREQuENCY
Fig. 2b. The measured (relative) amplitude spectra for probe durations of 10 ms and50 ms.
The stimulus is the sum of the quasi periodically repeated probe and a stationary
sinusoidal masker. During the experiments the amplitude M, the frequency f and themphase shift ¢ are variable. The probe is only variable in amplitude P and in effec-tive duration T. Probe carrier frequency f , rise and decay time T and the repetition frequency are kept constant at 1 kHz,P3 ms and about 2 Hz, respectively.

10
APPARATUS
A simplified block diagram of the equipment is given in Fig. 3.
A
B
MASKER
PROBE
Fig. 3 Block diagram of the equipment.
Oscillator A generates the sinusoidal masker of variable frequency f m.From this voltage short impulses are derived in the circuits PHASE and SYNC, having
the same frequency as the masker and a phase shift that is adjustable from 0 to 2n.
Together with a 2 Hz square voltage, providing partly the repetition frequency ofthe probe, these impulses produce a rectangular voltage whose leading edge coincideswith one of the impulses. Hence, the time interval between two probe presentationsis restricted to an integral number of masker periods.The leading edge of the rectangular voltage starts both the 1 kHz generator C forthe probe carrier and the envelope generator (PWM-gate, Admiraal 1971). Multiplication of carrier and envelope (Vario-S-gate, Admiraal 1971) provides the tone burst,serving as the probe.In this way the phase relation between probe and masker is identical for everyparticular probe presentation.
PPOCEJ1URE
The subject, seated in a sound-insulated booth (lAC) is listening to the stimulus
diotically bySennheiser HD 414 headphones.
During one trial he adjusts either (a) the masker frequency or the probe level at aconstant masker level, or (b) the masker frequency or level at a constant probelevel, so that the probe becomes just inaudible. The frequency is continuouslyvariable and the levels can be adjusted in steps of 1 dB.The subject is instructed to use as criterion of detection: anything with a repetition frequency of 2 Hz; he is not obliged to identify the probe in terms of a 1 kHztone burst. In the regions where the curves are rather flat the measurements arecarried out at a fixed masker frequency by adjusting the ampZitude of the maskeror the probe. In the steeper parts the masker frequency is adjusted at fixed maskerand probe levels. Each data point is the result of 5 adjustments. The 2a-intervalis estimated by taking the product of the range (maximum minus minimum) and 2Anwith n = 5 and As = 0.43.

11
results
The masking or threshold shift of a probe with a fixed carrier frequency is a function of two main variables: the masker level Lm and the masker frequency f m. So wecan distinguish three methods of measuring the "masking surface" shown in Fig. 10.(a) measurement of the iso-L curves. The subject adjusts the masker frequency or
the masker level so thatPthe probe of a fixed level is just inaudible.(b) measurement of the iso-L curves. Here the subject varies either the masker.
frequency or the probe l~vel to make the probe inaudible.(c) measurement of the iso-fm curves. At a fixed masker frequency the subject varies
the masker or probe level to mask the probe.Neither the iso-L curves nor the iso-L curves are "masking curves" ·in the conventional sense, bec~use the masker frequeEcy is variable and the probe carrier frequency is not. Iso-fm curves have been determined for the case in which f m is equalta the probe carrier frequency f and will be discussed afterwards. Although thedata are based upon only one subject (LV), some preliminary experiments with fourother subjects showed the same trend.It should be noted that until now only the frequency region where f m is close to f
phas been investigated in detail. So no conclusions can be drawn about detection ofcombination tones or harmonics.
masking for zero phase shift
In I igs. 4 and 5 the iso-L and iso-L curves are shown for a probe duration of 10 ms.The probe starts at zero p~ase shift ~f the masker. It is striking that for increasing intensity the curves shift towards lower frequencies. One would expect thatthe extremum occurs at a masker frequency f equal to the probe carrier frequency f .
h . m).. pHere, owever, lt appears that at low levels (10 or 20 dB 5L maXlmum masklng occurswhen f m is 50 to 80 Hz above f p ' whereas at levels above 60 dB SL the masking ismaximum at a masker frequency of 100 to 200 Hz beZow f .
POnly at masker levels below 40 dB SL the iso-Lm curves are almost symmetrical, al-though round a frequency that is shifted with respect to f
p' see Fig. 4.
At higher masker levels asymmetry appears; consequently the iso-L curves of Fig. 5Pare also asymmetrical even at a low probe level, except in a small region round the
extremum.
The flanks on the high frequency side in Fig. 4 have a slope of roughly 80 dB/octand in Fig. 5 of 190 dB/oct. On the low frequency side the slope varies from 20 to40 dB/oct in Fig. 4 and from 10 to 100 dB/oct in Fig. 5.
Results of measurements with other probe durations are presented in Figs. 6 and 7for T = 50 ms and in Fig. 8 for T = 200 ms. For the latter case the complementarygroup of iSO-Lm curves has not yet been measured.
Very striking is the fact that for increasing probe duration, and thus for decreasing
spectral width, the width of the curve increases. Comparison of Figs. 5, 7 and 8
clearly shows a gradually increasing frequency region between the flanks of the iSO-Lpcurves, the extremes becoming less "sharp".
masking for a phase shift of rr/2
Above, we have presented the formal expressions of the stimulus energy difference6E for a rectangular probe. On account of these results, (9b) and (9c), one wouldexpect very pronounced peaks in the curves for not too large frequency differences,also when using a smoothed probe. Therefore we carried out more detailed measurementsof the iso-Lp curve for a probe of 20 dB SL and 50 ms duration at ¢ = 0 and ¢ ="/2,
see Fig. 9. In fact, the ¢ = 0 curve of Fig. 9 is a detail of the 20 dB SL iSo-Lpcurve of Fig. 7.

12
100
dBSL
80 L m
i60
!"m .20dBSL60.40
.60 Lp .lodBSLdBSL x70 - --. i .20
Lp -80 ,30
40 i 40.40
T=lOms
T = 10ms
20 20
-1m0 00.1 0.2 0.5 1.°kHl5 0.1 0.2 0.5 1.0kHz 1.5
Fig. 4. Masking of a 10 ms prope (1 kHzcarrier) as a function of themasker frequency fm. for severalmasker levels Lm (iso-Lm curves).The estimated 95% confidenceinterval is indicated by thehorizontal bars.
Fig. 5. Masker level necessary to maska 10 ms probe as a function ofthe masker frequency for several probe levels L (iso-Lcurves). p pBars indicate the 95% confidenceinterval.
60
d8S!,.
20
o0.1
100
dBSL
i60
L p • 10l;iB~L·20.40·50
40
T = 50ms
20
Fig. 6. Iso-L m curves for a probeduration of 50 ms.
Fig. 7. Iso-L p curves for a probeduratlon of 50 ms.

13
100I
dBSL I
80 L m I
i I
lT = 50ms
60 60 Lp=20dBSL
L p .,0dBSL dBSL.20• 40 Lm •
40 t T~
50----f"~T=200ms
20 x 't' =- 0
• ?:: "h
40_1m
0 80 20 40 60 80 1100 Hz0.1 0.2 0.5 1.°kHz1.51000 _1m
Fig. 8. Iso-L r curves for a probeduration of 200 ms.
Fig. 9. A detail of the Iso-L r curveof Fig. 7 with Lp = 20 dBSL.Estimated 95% confidenceintervals are indicated byvertical bars.
Im = 1kHz /
.A tdBSL //
50 T = 50 ms/
Lp/
/ )jC/ ..40 i
//
/ •/
30 // +/
20//.
///+ X 9=010
1 + • 11'= Teh,, _.,
- -'- - / /
/,,, 0
f * * _Lm-10,,80 dBSllOO, , -fn 0 20 40 60
0.25 0.5 I 2 kHz--.--- 1m
/
o80,'
dBSl,L 6O,,<----J---;.--'i
m,L'__I--_-+-___I_'
14~"Lt----''---+---f--
,20"LI---,!..-----t---;.---,
I
0.125
O,~I_--,'-'_--,~_-+-_---,, ;
dBSL40
L p
Fig. 10. Interrelationship between iso-L ,iso-Lp and iso-fm curves. mPlotting the probe threshold shiftas a function of both masker frequency f m and masker level Lresults in the "masking surf~ce"as sketched.
Fig. 11. The probe threshold shift asa function of the masker levelfor equal probe and maskerfrequencies (iso-f curve).The solid line cor~esponds toa just noticeable amplitudein~rement of 4% or 1/3 dB.Theoretical probe thresholdfor ¢ = ~/2 are given by thedotted line. Vertical barsindicate the 95% confidenceinterval.

14
For ¢ = 0 no clear dips occur at 1010 Hz and 990 Hz. The difference with respect tothe level at 1 kHz is only 4 dB instead of the 17 dB calculated in the section onenergy, for a rectangular probe. Moreover, the difference between the ¢ = 0 curveand the ¢ =rr/2curve is much smaller than would follow from (9b) and (9c). Except forf m = f p it is even insignificant.
masking at fm =fp
In this section we shall go further into the masking as a function of the maskerlevel Lm at equal frequencies, f m = 1 kHz.For a probe duration of SO ms the measured iso-fm curves are plotted in Fig. 11 for¢ = 0 and ¢ =rr/2 Proportionality to Lm holds for ¢ = 0 between 30 and 70 dB 5L maskerlevel and the data can be fitted by a straight line with slope 1. The iso-fm curvefor ¢ = 0 also represents (implicitly) the just noticeable relative amplitudedifference P/M as a function of Lm. Between 30 and 70 dB 5L this relative differenceis independent of the masker level and has a value of 4% or 1/3 dB, shown as thesolid line in Fig. 11. Deviations from the 4% line occur for low as well for highmasker levels. They will be treated in the discussion.
From the known probe thresholds for ¢ = 0, the thresholds for ¢ =rr/2can be predictedif we assume that the rr/2 thresholds are determined by the same amplitude or energyincrement of the stimulus as necessary for probe detection at ¢ = O.For ~w = 0 the amplitude difference ~A between the stimulus with and without probeis given by (4) as
The difference in energy ~E is
~E = (~p2+p cos¢) M2T
with P P/M. (10)
(9a)
Let Po be the just audible probe-to-masker ratio for ¢= O. Then from (9a) as well asfrom (10) follows ~p2+ P cos¢ ~P~±Po; so the relative threshold p as a function of¢ is given by
p = ±VcOS 2¢+p2±2p i-coS ¢, (11)o 0
in which the plus signs hold for -¢ ~¢~¢ (increment of amplitude and energy) andg gthe minus signs else (decrement) .
The transition between the two cases takes place at the "boundary angle" in thesecond or third quadrant, given by
COS¢g = -V2p _p2o 0
or sin¢ =±(l-p )g 0(12)
From (11) follows the threshold difference between ¢=rr/2 and ¢= 0 as
10 log (1 +2/p o) dB (13)with Po the just noticeable relative amplitude increment.
Plotting the rr/2 - thresholds calculated with the aid of (13) then leads to the theoretical rr/2 - curve as given by the dotted line in Fig. 11. Only at low masker levelsthe correspondence with the measured rr/2 - thresholds is good. Beyond Lm = 30 dB 5Lthe measured values are considerably lower than one would expect on account of energychanges in the stimulus. In the discussion we shall go further into this discrepancy.
discussion
All experiments reported upon above have been carried out with a probe of fixedfrequency. The classical term "masking curve", however, is used when masking, causedby a fixed-frequency masker, is plotted as a function of the probe frequency.

15
From now on the reader should be aware of the fact that the probe frequency is fixedand the masker frequency variable. For not too large frequency differences our isoL curves can be transformed into the classical masking curves. Th~ wording used is
mapplicable to both situations.
Qualitatively the data from literature on masking at large frequency differences between masker and probe are corroborated. For small frequency differences, however, wefind that, generally, masking is maximum when the probe carrier frequency is not equalto the masker frequency. This phenomenon can be summarised as follows.I At low levels thE' masking is maximum for a probe frequency definitely below the
masker frequency. A deviation of SO to 80 Hz has been measured in the f m ~ 1 kHzregion. As the level is raised, the deviation becomes smaller, that is:
II There is an intermediate intensity at which the maximum masking occurs when probeand masker frequencies are equal.
III Increasing the intensity further, we find maximum masking for a probe frequencydefinitely above the masker frequency. Here deviations of 100 to 200 Hz have beenfound.
While most investigators of masking take it for granted that maximum masking occurswhen probe and masker frequency coincide, one can find a few indications of case IIIin the literature. One such indication is found in Zwislocki's (1968) paper, where,however, central masking is described. He found that a loud tone in one ear has amaximum masking effect when the probe in the contralateral ear has a frequency whichis slightly above that of a loud tone.
A second indication stems from Plomp (1971) who performed experiments on forward masking. He found a deviation similar to case III.
Scrutinising the literature, we find some further indications for a top shift in thedata of Small (1959 : Figs. 2 and 4) and Greenwood (1971 : Figs. 3, 4 and 5).In their texts, however, this phenomenon goes unmentioned.It seems interesting to try to find a relation between known asymmetries in thecochlear excitation pattern and the phenomena mentioned above.Two types of asymmetry are well known.
First we know that the excitation pattern is organized along an approximately logarithmic frequency scale (the Bark scale, Zwicker 1967). At low levels the excitationpattern of the probe is steeper on the high frequency side, owing to the spectralwidth of the probe, whereas the masker excitation is symmetrical. If it is assumedthat the probe is detected when the excitation by addition of the probe exceeds acritical amount, this detection will be the most difficult at a probe frequencyslightly above the masker frequency. At high levels the excitation pattern of themasker is less steep on the high frequency side, whereas the probe excitation thenbecomes more symmetrical. So in both cases one would expect maximum masking when theprobe frequency lies slightly above the masker frequency. This is what we find incase III (high levels), but this trivial argumen~ cannot explain the results quantitatively. With a 200 ms probe, for instance, a shift of 100 to 200 Hz is clearlyat variance with any reasonable spectral width of the probe.
Secondly, there is the top shift in amplitude of the cochlear microphonics towardshigher frequencies when the intensity of a pure tone of constant frequency is increased (Honrubia 1968). Now, if probe and masker do not excite simultaneously oneand the same cochlea, one might explain case III qualitatively from this top shift.However, for high intensities the probe excitation would shift in the same directionwhen masker and probe excite one cochlea simultaneously. So this would result in noshift at all. Summing up, these explanations based upon some asymmetry of the cochlear excitation pattern do not fit quantitatively the observed deviations.

16
At low levels they even point in the wrong direction for the observed phenomenon I.
Varying the probe duration, we find that the masking area broadens for increasingduration and thus for decreasing spectral width. It is not clear what role the spectral composition of the probe plays in its off-frequency detection and how theprobe duration affects the shape of the masking curves.
The masking as a function of the masker level at equal masker and probe carrier frequencies shows the same trend as found by Leshowitz (1971 : Fig. 2) for a 10 ms rectangular probe. For medium levels and ¢ = 0 the probe threshold is proportional to
the masker level.The deviations at low sensation levels ("negative masking") can be attributed to aphysical change in the stimulus. Addition of the masker then leads to a decreasingprobe threshold because of the increasing energy difference ~E in (9).For high levels the detection of the probe is apparently facilitated, probably bythe dominating spectral side lobes.A phase shift of TI/2 between probe and masker results in a probe threshold shiftthat only for a masker level below 30 dB SL corresponds to the expected value.For medium and high levels the measured threshold for ¢ = TI/2 is much lower thancalculated from the in-phase situation on the basis of energy considerations.Leshowitz (1971) showed that in cases where off-frequency detection is obstructedby filtering of the probe, the proportionality region is considerably extended.So especially for a TI/2 phase shift the detection of side lobes seems to have animportant influence on the probe threshold.
summary
Masking of a 1 kHz tone burst by a stationary sine wave as a function of the maskerfrequency for various sensation levels is investigated. The probe is phase lockedto the masker, also for unequal frequencies. Two methods of measurement are used:(a) direct determination of the probe threshold shift at a constant masker level, and(b) measurement of the masker level necessary to mask a probe of a constant level.At low levels masking appears to be maximum for masker frequencies up to 8% abovethe probe carrier frequency. For increasing levels, the masker frequency at whichmasking is maximum decreases systematically.
references
Admiraal, D. (1971)105 - 1l3.
A Review of Signal Gates, I.P.O. Annual Progress Report ~,
Egan, J. flake, P. (1950)J.Acoust.Soc.Amer.
On the Masking Pattern of a Simple Auditory Stimulus,~, 622 - 630.
Ehmer, R. (1959) Masking Patterns of Signals, J.Acoust.Soc.Amer. 21, 1115 - 1120.
McFadden, D., Russel, W., Pulliam, K. (1971) Monaural and Binaural Masking Patternsfor a Low-Frequency Tone, J. Acoust. Soc. Amer. ~, 534 - 542.
Green, D. (1969) Masking with Continuous andPulsed Sinusoids, J.Acoust Soc. Amer.~, 939 - 946.
Greenwood, D. (1971) Aural Combination Tones and Auditory Masking J.Acoust. Soc.Amer. ~, 502 - 543. '
Greenwood, D. (1~61) Auditory Masking and the Critical Band,J.Acoust. Soc. Amer.21., 484 - 502.
Honrubia, V., Ward. P. (1968) Longitudinal Distribution of the Cochlear !1icrophonicsinside the Cochlear Duct (Guinea Pig.),J. Acoust. Soc. Amer. 44,951 - 958.
Leshowitz. B., Wightman, F. (1971) On-Frequency Masking with Continuous Sinusoids,J. Acoust. Soc. Amer. ~, 1180 - 1190.
Plomp, R. (1971) Personal Communication.
Small, A. (1959) Pure Tone Masking, J.Acoust. Soc. Amer. 21. 1619 - 1625.
Zwicker, E., Feldtkeller, R. (1967) D Oh 1 N h . h ..as r a s ac rlC ten Efupf~nger, 2nd edition,Hirzel, Stuttgart.
Zwislocki, J., Buining, E Gl t J (19 )., an z,. 68 Frequency Distribution of CentralMasking, J. Acoust. Soc. Amer. ~, 1267 - 1271.

17
A SURVEY OF SOME INVESTIGATIONS INTO THE TEMPORALORGANISATION OF SPEECH
S.G.Nooteboom
introduction
In nur Institute experimental phonetics was introducted as a research activity in
1959. At that time the major effort in many speech laboratories was directed towards
the spectral organisation of speech. In contrast to this it was deli~erately decided
that in the IPO one of the main lines of phonetics research should be the study of the
temporal organisation of speech. In the research done since that time a strong lin
guistic bias has always been present in that the phonetic investigations were inspired
by a desire to make explicit the relation between the linguistic code and the speech
event, both in the production and the perception of speech. The explicitation of thisrelation may guide us in investigating how, on the one hand, the production and perception of speech are controlled by the mental structures of language, and how, onthe other hand, the organisation of language structure is constrained by the productionand perception mechanisms.
At present we are still very far away from formulating any extensive theory of the
mutual interaction between language structure and the production and perception mecha
nisms. In fact, it must be admitted that this domain of research is still largely in
the data gathering stage, although in the past twenty years a great deal of knowledge
has been gainsd in a num~er of laboratories allover the world.
The lack of a coherent theory leaves us with a number of rather isolated interestingfindings, which may perhaps ultimately help in formulating such a theory, but which
as yet cannot be related to each other in a meaningful way. This also has the effect
that experimental data do not rapidly lose their actuality. Data obtained quite a
long time ago keep staring at us, asking for an explanation. We also have to be care
ful not to forget them as long as they have not lost their potential capability ofinspiring new and interesting hypotheses. It is for this reason that an attempt willbe made here to give a survey of the main findings concerning the temporal organisation
of speech, as obtained in our Institute. From this survey the work on intonation,
constituting a major part of the speech research in the IPO, will be omitted. Even soit will not be possible to give, within the frame of this rather brief survey, theresults of each particular investigation the attention they deserve. The main purposeof this paper is to be a reminder. For those who wish to know more particulars a rather
extensive list of references is provided. The interpretations and speculations given
are my own responsibility.
sUbjective analysis and simple synthesis
In the early stages of phonetics research in the IPO much use has been made of elec
tronic gating devices (Cohen and 't Hart 1964, Admiraal 1971). One of the purposes
was to analyse perceptually complexes of speech sounds with a view to determiningconstituent parts. This involved establishing segments of speech which are more orless perceptually homogeneous, finding perceptual boundaries, tind assessing the roleof the amplitude envelope in speech perception. These phenomena were studied by vary
ing the width, position and amplitude control function of the gate, and judging theperceptual results. From these investigations hypotheses were derived concerning relevant aspects of the time structure of simple sequences of speech sounds. The time
structure of speech appeared to be extremely important for perception.
IPO annual progress report 7 1972

18
This was demonstrated convincingly with a simple form of speech synthesis. It turned
out to be possible to synthesise understandable speech with a reasonable quality from
spectraZZy homogeneous segments, if the durations and amplitude envelopes were carefully controlled. This naturally does not show that formant transitions are not impor
tant for speech perception, but they do demonstrate that transitions are dispensable
if the temporal €omposition is optimally shaped (Cohen, Schouten and 't Hart 1962,
Schouten, Cohen and 't Hart 1962~ .(Fig. 1).
perception of synthetically generated isolated vowels
In order to test whether users of a particular language have a "built-in pattern",
which enables them to identify certain acoustic signals as sounds of their language
and to reject others, a number of perceptual experiments with synthetically generated
isolated vowel-like signals was performed. In one of these experiments the subjects
had the task to adjust both the duration of that part of the signal tbat had uniform
intensity and the decay time. The results showed that the preferred durational cj;~rac
teristics of a vowel depend on the linguistically given vowel quantity category to
which this vowel belongs (Cohen, Slis and 't Hart 1963).
the serial ordering of linguistic units in the brain
Lrrors of speech give as it were a window on the linguistic organisation of messages
in the brain, and bear on the temporal organisation of speech in a quite different
way from the earlier mentioned experiments. In such errors as "to colerate quite a
lot" (instead of "to tolerate quite a lot"), we see that phoneme-like units change
positions like the letters of a compositor in printing errors. Some studies of regu
larities in errors of speech (Cohen 1966, 1968, Nooteboom 1967, 1969, 1972 b) give
empirical support for the psychological reality of some aspects of linguistic des
criptions, and provide new data as to the stragey of language users in handling lin
guistic information in the programming of speech.
,~0G\.~o 200 400 600 800 ms
Fig. 1. Time pattern required for building the synthetic word:phonetics (English). Amrlitudes are normalized.
40
30 N =787
20
PERSEVERATIONS ANTICIPATIONS
10
510
oo 5 10
SYlLABLES BETWEEN CAUSE AND EFFECT
Fig. 2. Relative frequency distribution of spontaneous phonemicspeech errors in Dutch as a function of the number ofsyllables betw~en origin and target.

19
Units frequently involved in speech errors are phonemes, consonant clusters, syllables,
morphemes, words. The distributional constraints of the language are very rarely vio
lated when such units shift from one position to another. The chance of two units inter
fer with one another in a speech error (by anticipation, perseveration or transposition)
increases when the two units become more similar in phonetic form, stress level, dis
tributional properties and/0r meaning, (Fig. 2).
In speech errors anticipations are far more frequent than perseverations, whereas
transpositions are rarest. The abundance of anticipations shows that a speaker's
attention is more directed to what is yet to come than to what has been said. The
amount of language material. intermediate between two units involved in a speech error
generally does not exceed seven syllables. Of particular interest is that units shifting
from on~ position to another in a speech error do not take with them the c~articulation
features of their original position, and prosodic features such as stress, intonation
and duration. For example in such lapses as the earlier quoted "to colerate quite a
lot" the li.p rounding in the /k/ of "qUite" was found not to be present when this /k/
is anticipated and intrudes in the position of the /t/ of "tolerate". There the /k/
adapts itself to the coarticulation requirements of the new position. This shows that
the mental level of speech programming where phonological errors occur in some way
is separate from and presumably precedes a lower level where coarticulation is pro
grammed. In another slip, "how things bad were" (instead of "how bad things were" ,
the slip is quoted from Boomer and Laver 1968), we see that two words are interchanged,
leaving the stress pattern, intonation pattern and durational pattern of the sentence
intact. (See also ·Fromkin 1971). We have to assume that prosodic features are in some
way programmed separately from segmental units (although stress levels do affect the
chance of occurrence of segmental errors). In t:1is respect it may be interesting to
note that phonological quantity, often regarded as a prosodic feature (e.g. Lehiste
1970), behaves as a segmental feature in errors of speech. Long and short vowels may
replace each other, taking the quantity feature with them.
the special role of the vowel onset in the temporal organisation of speech
It has been shown by Huggins (1964) that the intelligibility of interrupted speech is
minimal when the rate of interruption is such that the syllable structure is most
affected. Howeve~, Huggins' interruptions were not related to each individual syllable,
but periodical. If indeed the syllable has any special significance to intelligibility,
it would be worth while to know whi·ch {I}rrt ~f the syllable and what properties of\,' "" .'
sequences of sy'bl~ble5 are most relevant to .:intelligibil i ty. Therefore, an experiment
was designed (Van K~twijk and 't Hart 1967 a:and b, 1970), in which the intelligibility
of speech with syllable-tied interruptions was assessed by shadowing. In each syllable
either 110 ms were acoustically suppressed or 110 ms were left audible, the remainder
being suppressed. The position of the audible or suppressed interval with respect to
the vowel onsets was varied. There were two main divisions of the stimulus material,
one being the presence or absence of the CV-junctions in the audible parts of the syl
lables, the other the fixed time relation between the vowel onset and the beginning
of the audible part of the same syllable versus the situation in which this time rela
tion was disturbed.
It was found that if CV-junctions are suppressed, intelligibility is low, and if the
pattern of onsets of audible parts of syllab~es is the same as that of vowel onsets
in the original speech, intelligibility is better than if this patterQ is disturbed.

20
70 %
(2 (1 V ~(2(1 V (2 (1 V (2(1 V
~~,-~~~~~SIGNAL
AUDIBLE .• ...........
AUDIBLE .
SUPPRESSED , .J...~--'
SUPPRESSED..
Fig. 3. Schematic representation of two interruption situations.In the upper gating function the CV-junctions are audible,and the time relation between audible portions and CVjunctions are fixed. In the lower situation the CV-junctionis suppressed and the time relation is disturbed.Percentages are intelligibility scores for the two situations.
These results indicate that the perceptual cues relevant to the decoding of speech are
not evenly distributed along the time axis, but rather show peaks of concentration
round the CV-junctions.
Furthermore, it seems that the CV-junctions playa special role in the temporal orga
nisation of speech. The distribution of vowel onsets along the time axis apparently
constitutes some sort of "rhythmical" patterns, having perceptual relevance. This is
confirmed by a number of other experiments in which the role of the vowel onset as
consti tuting a "syllable beat" (Allen 1967) is investigated by having subj ects syn
chronise finger taps with audible syllables, audible clicks with audible syllables
(Van Katwijk and Van der Burg 1968), a routine scansion of a Dutch poem with audible,
equidistant clicks, equidistant audible clicks with audible metrically spoken poem,
and on finger taps with audible metrically spoken poem (Eggermont 1969). In all these
cases the point of synchronisation was the vowel onset.
We may speculate that the temporal patterns in the sequences of vowel onsets constrain
the range of possible interpretations of the speech wave form, and thus constitute
valuable aids in the perceptual decoding of speech.
some details in the temporal organisation of speech
One of the linguistic distinctions in the production and perception of which temporal
details appear to be very important is the voiced-voiceless distinction.
At first sight this distinction seems to be a very simple one. In articulation it
seems to be made by the presence or absence of periodicity in the lower parts of the
spectrum, and in perception by the corresponding perceptual correlates. This view
appears far too simple. It has been shown that in production and perception there
is more to this distinction than the correlates of vocal fold vibratiol. alone (Slis
1966, 1967, Slis and Cohen 1967, Slis 1970 b). In measurements of the articulation
and the acoustic signal a number of attributes of the voiced-voiceless distinction
were found, of which, in perceptual experiments with mutilated real speech and syn
thetically generated speech materials the following was shown to be relevant perceptual
cues:

21
(1) acoustical duration of the consonantal segment
(2) acoustical duration of the preceding vowel
(3) duration and spectral extensiveness of the vowel formant transitions
(4) presence or absence of vocal vibrations during the consonantal closure(5) acoustical duration of the noise burst of plosives
(6) sound pressure of the noise burst of plosives and friction noise of fricatives(7) peak value of the fundamental frequency of the surrounding vowels and the contour
of the fundamental frequency in the following vowel.
f
1
~,\ I I: II- ~ ~i 'J
,\"I If II
- 'i ~~~ ".1 ~ ,1'~'
1111111 ... ' i I!!IIIIII:, t"r : II~ lEI !~ Il
I I '. IIII!I' • nil!, • ,111,1 -,
PETAL DURATION t GAP FORMANT GLIDES
,
~I~
~ ~, ,I
II
II
-I I I Fo
I ,.i'
", ,I
I'" I I,iK" 11111!llllIi, I'I!!ii ~:ii'
~ i~~~·ihi' l'l, ;;I:',q,- ' lii("il! " II' . , I ~II~.. ftlll1"lii .- i' .. ·HH~III'illltliln", '. ""H,/IImiIlF ~",,,'''''"i1ii'
DURATION tId LOUDNESS d VOICE BAR INTONATION PEDAL
Fig. 4. Steps invplved in changing an unvoiced into a voiced consonant.Sonagrams of the synthetic word "petal" gradually transformedinto "pedal".
These perceptual cues are given in arbitrary order. One may notice that 4 of these
cues are durational. Whereas in word initial position the presence or absence of
the voice bar seems to be more important than the other cues, this appears not tobe the case in intervocalic position. There is no problem in inducing "voiced" judgements to synthetic stimuli without a voice bar. In intervocalic position the voiced
voiceless distinction seems to be carried mainly by the durational and intensity cues.
The durational cues do not seem to be individually controlled in production, but may,
at least partly, be explained by the physiological mechanisms involved in the imple
mentation of the linguistic voiced-voiceless opposition. Thus on the control levelof speech this distinction seems to be less complex than in production and perception.
One of the differences between voiced and voiceless plosives is the greater articulatory
effort in voiceless as compared to voiced plosives. This greater effort, as shown by
higher electromyographic activity, is also present in stressed versus unstressed syl
lables, in identical plosives after short vowels versus long vowels, and, at least for
the Dutch /a:/-/a/ pair, in identical plosives preceding long vowels versus short ones
(Slis 1968, 1970 b, 1971, this issue). In all these cases the stronger electromyographic
activity appears to be correlated with an advancement in time of the articulatory gesture,
which does not affect the total duration of the word of which it is part.

22
We thus may assume that the durational correlates of differences in articulatory
effort are not controlled individually but are rather physiologically conditioned
side-effects of stronger neural commands, needed for other purposes. In measurements
of the time structure (Slis 1968) and elecfromyographic activity in the orbicularis
oris muscle (Slis 1970 a) in isolated nonsense words, it was shown that both articula
tory durations and muscle activity in the realisation of a consonantal closure may be
affected by properties of a consonant belonging to a different syllable. Such influence
may take place over a vowel articulation. This suggests that the temporal integration
of articulatory commands may extend over stretches of speech greater than a syllable.
In Dutch, and many other languages, an important linguistic factor in the temporal
organisation of speech is phonological vowel quantity. In Dutch not all vowels, how
ever, take part in phonological quantity oppositions. Data obtained in articulatory
measurements on vowel durations in three syllable nonsense words (Slis and Nooteboom
1969, Nooteboom and Slis 1970 b, Nooteboom 1972 b) can be convincingly explained by
assuming two quantity categories, one containing the ,genuine phonologically short
vowels plus the monophthongs having no long counterparts, the other containing the
genuine long vowels plus the diphtongs (Three of the generally short monophtongs
have long allophones in certain distributional positions).
A difficulty in studying quantity oppositions in the actual speech event is that the
measurable durations are affected by many other effects as well, such as stress,
position, consonantal environment, etc. Most of these factors can be kept constant
in the experimental situation, but inherent properties of the vowels" such as rounding
and vowel height cannot. This leads to durational differences within one quantity
category, also in positions which are made as similar as possible. For a complete
account of the temporal details in speech such physiologically conditioned durational
differences should be explained by quantitative models of speech production.
In this respect the 2ffect of vowel height has perhaps been studied best. This effect
has been attributed to the sluggishness of the lower jaw in speech, which has to open
further for low vowels than for high vowels (Lindblom 1967, Lindblom and Sundberg 1971),
although the ~ctive control of tongue height also appears to be used in differences
in vowel height, anJ subjects may differ as to their strategy (Ladefoged, DeClerck,
Lindau and Pap<;un 1972). In bilabial environment the active control of lip opening
may also be involved. In some simple measurements, in which the durational effect of
vowel height in "pipe speech" (produced with a pencil clenched between the teeth)
and normal speech (both in bilabial environment) was compared, it was found that this
durational effect does not differ significantly in the two situations. This implies
that the sluggishness which is responsible for the durational difference is probably
not of a mechanical nature. Evidently the lower jaw is a far heavier mechanical struc
ture than the lips. The sluggishness should rather be attributed to neuromuscular
processes (Nooteboom and Slis 1970 a).
Another implication of the study op pipe speech is that the same vowel quality may be
brought forth with rather different command patterns for the control of the vocal
tract. These patterns cannot be explained by peripheral neural servo-systems such as
the gamma loop, as suggested by MacNellage (1970). The compensatory articulation,
which has been shown not to be dependent on time consuming feedback mechanisms
(Lindblom 1971), presupposes extensive reorganisation on a rather high level of

23
programming. It seems to be the case that the "targets'! in vowel production are of a
perceptual, auditory nature, and that these auditory targets are translated into arti
culatory movement patterns, given the current state of the vocal tract (Nooteboom 1971
Lindblom 1971, Ladefoged et al. 1972).
articulatory and perceptual accuracy in the time domain
The standard deviations of such articulatory segments as closure durations and vowel
durations as measured from consonantal release to consonantal closure, in repetitions
of the same word in one test series, generally lie between 5 and 10 ms, in some cases
they' are below 5 ms (Nooteboom 1972 b). This may give an impression of how accurately
articulatory timing may be controlled.
To see how accuracy in articulatory timing relates to accuracy in the internal repre
sentation of speech forms, a simple perceptual experiment was performed (Nooteboom
1972 a, b, 1973). Three phonetically non-naive subjects were asked to repeat 20 times
as accurately as possible the preferred setting of a stressed vowel in a synthesized
word. The standard deviations found ranged from 1.7 ms (for a short vowel /a/, mean
duration 70 ms, one subject) to 9 ms (for a long vowel /a:/, mean duration 104 ms,
another subject). This shows that the internal representation of a vowel duration
may be at least as accurate as the articulatory timing, and more accurate than one
would expect on the basis of difference limens for the duration of simple auditory
stimuli as tones or noise bursts, which are in the order of 10%. In some cases the
internal representation of vowel durations is definitely more accurate than the spec
trographic measurements of it.
prosodic patterning in vowel durations
Tile timing of opening and closing movements of the mouth in speech, as reflected in
meas'1rable vowel durations, shows wide variations due to prosodic patterns. The ana
lysis of the durational structure of simple nonsense words with varying stress place
ment, varying number of syllables and both long and short vowels, and no differences
in the phonemic make-up of syllables, has given rise to a quantitative description of
prosodic patterns for vowel durations in isolated words (Nooteboom 1972 a, b). The main
characteristics of these patterns are at the stressed vowel is shortened as a function
of the number of syllables following in the word,the shortenipr, following approximately
a power function.
The stressed vowels are only slightly shortened by the number of syllables preceding
in the word. Unstressed vowels are affected by a moderate lenghtening in initial syl
lables, strong shortening in medial syllables, and lengthening in final syllables
(also in embedded words). Furthermore, an unstressed vowel in initial syllable is
shortened if the next vowel is stressed.
To test the perceptual reality of such prosodic temporal patterns some perceptual ex
periments were performed (Nooteboom 1972 a, b, 1973). In these experiments a method
of internal matching was used, the main characteristic of which is that subjects are
asked to give preferred durations to vowels in different conditions. The vQ~els belonged
to synthetically generated common Dutch words with differing stress patterns, and ~if
fering number of syllables. It was shown that the preferred durations could be fairly
accurately predicted from the quantitative description of prosodic patterns based on
the earlier mentioned articulatory measurements of nonsense words. The articulatory
and perceptual experiments on prosodic durations together show that there exist gener
alized prosodic temporal patterns, governing the control of articulatory timing on the

24
one hand, and restricting the set of perceptually acceptable speech forms on the other.
m
m
m
m
o 200 400
0:
0: z
600
5
a
800 ms
Fig. 5. Durational build-up of four synthetic words as adjusted by three subjects.
The prosodic factors in temporal patterning interact with each other (for example
the number of syllables in the word with the number of syllables in the foot) and with
intra-syllable factors (such as the effect of the following consonant in vowel duration)
in a quantifiable way. The study and quantitative description of such interactions may
help in finding a set of rules describing the temporal patterns of speech (Nooteboom,
this issue).
forward masking and the temporal organisation of speech
In some psychoacoustic measurements (Cardozo and Van Nierop 1970) the forward masking
effect exerted by a preceding stimulus on a noise burst has been studied. In these
experiments the spectral composition of the noise burst was varied (white or band
filtered noise), and different kinds of sound were used as the preceding masker, viz.
white noise, band filtered noise, formant filtered noise with lal, Iii and lui colour,
and synthetic vowels /a/, Iii, lui. The masking effect was studied as a function of
the interval of time between back slopes of masker and maskee, and as a function of
the loudness of the maskee.
The masking effect decreases when the masker goes through the stages of white noise,
via coloured noise, to a synthetic "whispered" and finally to a synthetic "voiced"
vowel, but is greater when masker and maskee have approximately the same spectral
composition than when this is not the case. The masking effect is greatest immediately
after the masker, and may be 1S to 20 dB. It expires in about 1S0 ms.
In a follow-up experiment (Slis and Van Nierop 1970) the forward masking effect of
vowels on the noise burst of voiceless final plosives in real speech was studied, by
attenuating the noise burst, and by advancing the noise burst in time, shifting it
closer to the vowel.
IIAt~200m5~20ms
Schematic illustration of the masking of a white noiseburst. Masker consisted of white noise, cQlQure~ noiseor synthetic vowels. Masking was measured as a functionof time interval ~t and center-frequency difference.
The subjects were asked to identify the consonant. The results show that shortening
of the silent interval leads to "fricative" perceptions arid the combination of the two
may lead to IIno consonant" judgements. The consonant had to be attenuated 1S dB before
the results showed marked masking effects, and the silent interval had to be decreased
60 ms before masking clearly began to manifest itself.

25
In interpreting these results it must be kept in mind, though, that in the test mate-rials chosen, both the loudness of the noise burst (30-45 dB above threshold) and the
duration of the silent interval (90 to 130 ms) were considerably greater than normal
in connected speech, because they were spoken optimally in final position. Furthermore in normal listening conditions reverberance may further enhance masking.In view of this it does not seem unreasonable to assume that c~rtain factors in thetemporal organisation of speech are more or less trimmed to temporal constraints ofthe hearing system. This should be kept in mind when studying the perception of fast
speech, for example by speeding up speech by machine. It may also throw some light on
the origin of some universal temporal regularities. Especially with respect to the
distinction between voiced and voiceless plosives we should not eliminate the possibility that the durational difference in oral closure is not solely due to physio
logical mechanisms in speech production, as suggested earlier in this paper, but may
find its origin in temporal constraints of the hearing system. These constraints do
not necessarily work in an absolute sense. It may be that the internal criteria foraccepting a speech sound as a fricative or as a voiced plosive are partly controlled
by an overall idea of the speaking rate the listener can make himself. It may be im
portant, though, as a limiting factor, or in some special situations.
rhythmic fusion and fission
It is by now well-known that, if we listen to a speech utterance and a spurious noiseburst is inserted somewhere in the speech continuum, it is very difficult to locate
this noise burst perceptually, as a part of the auditory stimulus pattern. This obser
vation may give rise to the question how it is that we have no difficulty in interpreting speech as a definite sequence of speech sounds, which are temporally integratedin meaningful patterns in perception. Slis of our Institute prepared a demonstrationtape (not reported upon elsewhere) which may have some interest in this respect.The words of a short sentence were all spoken optimally in isolation by the samespeaker, then cut out from the tape and so spliced together in the correct order for
a meaningful sentence are not understandable at all. It is as if the words were spoken
by different speakers, in different corners of the room, and the order of the words
cannot be determined. This effect, and the difficulty in perception, disappear, how
ever, when pauses of about 100 ms are introduced between the words. The version with
out pauses apparently lacks the properties which would enable a listener to fuse thesubsequent words in one perceptual pattern, suitable for decoding. The main difficultyseems to be caused by the extensive jumps in voice pitch at the beginnings and endings
of the words.
With stimuli which are much less complicated than real speech Van Noorden (1971) madean attempt to tackle the problem of rhythmic fusion (and its opposite, rhythmic fission)
in some psychoacoustic experiments with tone sequences. He used tone sequences of the
form ABA ABA .. " A and B being pure tones of equal duration and amplitude, and different
pitch. Such tone sequences may be heard as recurring patterns of three tones (in fusion
state) or as separate continuous tone sequences, one running twice as fast as the other
(in the fission state). f B was chosen 1000 Hz, fA ranged from one octave below to oneoctave above f B, The interval duration between the onsets of two successive tones was
varied from 50 to 150 ms. In the results three different ranges of fA-fB were distinguished. In one range, with great differences, there was no fusion at all, in another,
with small differences, there was always fusion, and in a third, intermediate range,it depended on the psychological set of the subject whether he heard fusion or fission.

26
The interval duration had only a significant effect on the intermediate range, the
fusion range increasing when the interval duration became longer than 100 ms. This may
have to do with the subject getting more time to concentrate on the perceptual pattern,when interval durations increase.
More recently similar experiments (Van Noorden 1972) both diotically (both tone sequences
on both ears) and dichotically (one tone sequence on each ear) were carried out. There
appeared to be a great difference between the two situations. In the dichotic situation
integration into perceptual patterns was found to be much less than in the diotic situation. Furthermore, the subjective nature of the perceptual patterning in the dichotic
situation is so different from the rhythmic fusion in the diotic situation that one may
doubt whether the term "rhythmic fusion" should be used for both situations.
The implication of the differences between diotic and dichotic situation is that perceptual integration of tone sequences into rhythmic patterns is, at least to a certain
extent, dependent on peripheral properties of the hearing system.Tone sequences are one thing, speech a quite different thing. We cannot be priori cer
tain that Van Noorden's results can be applied to the perceptual integration of speech
into meaningful patterns. It seems tempting, though, to compare Van Noorden's results
with dichotic listening to the results of Huggins (1964), who showed that switchingspeech from one ear to another at a rate which interfered most with the syllable rateof speech, decreased the intelligibility of speech. Apparently, alternating between
ears interferes with the mechanisms for perceptual integration. This supports the ideathat non-central properties of the hearing system are involved in the perceptual inte
gration, and also exert constraints on the temporal organisation of speech. The role
of the physiological properties of the hearing system in the perceptual integration
of speech has yet to be investigated.
some speculations
The mental structures of language control the temporal organisation of speech in a
number of different ways. In the phonology of the language the quantity feature leads
to durational differences which are programmed as such, and which constitute major cues
to the recognition of long versus short phonemes. The prosodic temporal patterns of thelanguage modulate articulatory timing in a well-defined way, so tha~ the resulting durational regularities provide the listener with cues for the perception of word stresses
and word boundaries. The implementation of distinctive features in the production ofspeech leads to temporal regularities, which often appear not to be programmed as such,
and are not part of the abstract phonology of the language, but nevertheless can function
as perceptual cues to the recognition of higher order linguistic units. An example isprovided by the durational attributes of the voiced-voiceless distinction.
All these factors, and many others not mentioned here, together very strictly control
the temporal organisation of speech and thus put heavy constraints on the class of
acceptable interpretations to speech wave forms. This may well be the most important
function of the temporal patterns of speech. It is only when we accept that a listener
has a rather limited amount of freedom in generating possible interpretations to in
coming speech signals, that we can understand that small durational differences such
as those due to the voiced-voiceless distinction can function as perceptual cues, in
spite of the enormous variability in realisations of identical phonemes. The overall
temporal patterns serve as a background, as it were, against which temporal detailsmay function properly.

27
It is not only so that the mental structures of language control the production and
perception of speech, but the language structures themselves appear to be affected by
the temporal constraints of the production and perception mechanisms. The possibilitiesand limitations of the production and perception systems provide boundary conditionsfor the organisation of language. The accuracy in the control of articulatory timingand in the internal representation of temporal aspects of speech forms may be considereda precondition for languages to use both, and at the same time, phonological quantityoppositions and prosodic temporal patterns. It also serves as a precondition for smalldurational regularities, due to temporal constraints of the production system, to functionas perceptual cues. On the other hand the temporal constraints of the hearing system
limit the amount of temporal details which may function in speech, and thus limit the
raw materials from which language may extract the abstract patterns of phonology, both
segmental and prosodic.
The interaction between the possibilities and limitations of the production and per
ception systems on the one hand and the organisation of language on the other has to
be taken into account by any serious theory of abstract phonology and by any serioustheory of speech performance. This interaction may also provide explanations for his
torical changes in the phonology of languages. Again an example is ~rovided by the
voiced-voiceless distinction. The difference in vowel duration before voiced and
voiceless consonants in many languages is small and appears to be physiologically
conditioned. In English, however, this difference is great and is part of the phonologyof the language. The origin of this phonological feature of English can be explained
by assuming that the small, physiologically conditioned difference, of which we knowthat it functions as a secondary perceptual cue, and thus must be part of the internalrepresentation of speech forms, has become exaggerated and incorporated in the phonology of the language. The distinction between a mental representation of speech forms,which is rather close to the acoustic wave form, and which reflects rather narrowly thetemporal constraints of the production and perception mechanisms, and a more abstractphonological representation of speech forms, in terms of a sequence of non-overlappingphonemes, appears to be very usefull in explaining naturalness conditions on phonologicalsystems and historical changes.
references
Admiraal, D.J. (1971) A Review of Signal Gates, IPQ Annual Progress Report ~, 1-5.
Allen, G.D. (1967) Two Behavioural Experiments on the Location of the Syllable Beatin Conversational American English, Studies in Language and Language Behaviour,The University of Michigan, Progress Report ~, 2-179.
Boomer, D.S. and Laver, J.D.M. (1968) Slips of the Tongue, British Journal of Disorders in Communication 1, 2-12.
Cardozo, B.C., Nierop, D.J.P.J. van, Some Psycho-acoustic Measurements of ForwardMaski~b ~elevant to the Perception of Speech, IPQ Annual Progress Report ~, 1-5.
Cohen, A. (1966) Errors of Speech and their Implication for Understanding the Strategyof Language Users, IPQ Annual Progress Report 1, 44-46.Also in: (lSSS) Zeitscbrift fUr Phonetik, Spra~hwissenschaft und Kommunikationsforschung 21, 177-181.
Cohen, A. and Hart, J. 't, (1964) Gating Techniques as an Aid in Speech Analysis,Language and Speech ~, 22-39.
Cohen, A., Schouten J.F., Hart, J. 't (1962) Contribution of the Time Parameter to thePerception of Speech, Proe. IVth Intern. Congr. of Phonetic Sciences, Helsinki 1961,Mouton, the Hague, 555-560.
Cohen, A, Slis. I.H. and Hart, J. 't (1963) Perceptual Tolerances of Isolated DutchVowels, Phonetics ~, 65-78.

28
Eggermont, J. (1969) Location of the Syllable Beat in Routine Scansion Recitations ofa Dutch Poem, LEO. Annual Progress Report :±" 60-64.
Fromkin, V.A. (1971) The Non-Anomalous Nature of Anomalous Utterances, Language andSpeech :±,2, 27-52.
Huggins, A.W.F. (1-64) Distortion of the Temporal Pattern of Speech, J. Acolist. Soc.ArneI'. ~, 1055-1064.
Katwijk, A. van (1966) On Perceptual Units in Speech, LPQ Annual Progress Report;, 51-55.
Katwijk, A. van, and Burg, B.L.S. van der (1968) Perceptual and Motoric Synchronisationwith Syllable Beats, LPO. Annual Progress Report 1,35-39.
Katwijk, A. van, and Hart, J. It (1967) Intelligibility of Syllable-Tied InterruptedSpeech, IPO Annual Progress Report 2, 1967, 99-102. also in: Proc. of Vlth Intern.Congr. of Phonet. Sciences, Prague 1967, Mouton, The Hague 1970, 471-473.
Katwijk. A. van, and Hart, J. It (1970) A Complex Unit of Intelligibility: the Syllable,Actes du Xe
Congr~s Intern. des Linguistes, Bucarest 1967, ed. de l'Acad~mie de laRepublique Socialiste de Roumanie, Bucarest 1970.
Ladefoged, P., DeClerk, J., Lindau, M. and Pap9un, G. (1972) An Auditory-Motor Theoryof Speech Production. UCLA Working Papers in Phonetics ~, 48-75.
Lindblom, B.E.F. (1967) Vowel Duration and a Model o~ Lip Mandible Coordination, R.I.T.,STL-QPSR :±" 1-29.
Lindblom, B.E.F. (1971) Numerical Models in the Study of Speech Production and SpeechPerception. Some Phonological Implications, Proceedings of the Vllth InternationalCongress of Phonetic Sciences, Mouton, The Hague 1973.
Lindblom, B. and Sundberg, J. (1971) Acoustical Consequences of Lip, Tongue. Jaw, andLarynx Movements, J. Acoust. Soc. ArneI'. ~, 1166-1179.
MacNeilage, P. (1970) Motor Control of Serial Ordering in Speech, Psychol. Rev. 22,182-196.
Noorden, L.P.A.S. van (1971 a) Rhythmic Fission as a Function of Tone Rate, IEQ AnnualProgress Report ~, 9-12.
Noorden, L.P.A.S. van (1972) Personal Communication
Nooteboom, S.G. (1967) Some Regularities in Phonemic Speech Errors. LP.Q Annual ProgressReport ~, 65-70.
Nooteboom, S.G. (1969) The Tongue Slips into Patterns, Nomen, Leyden Studies in Linguistics and Phonetics. Mouton, The Hague. 114-132.
Nooteboam. S.G. (1970) The Target Theory of Speech Production, I.P.O. Annual ProgressReport ~, 51-55.
Nooteboom, S.G. (1972 a) Some Timing Factors in the Production and Perception of Vowels.University of Essex, Language Centre, Occasional Papers ll, 49-76.
Nooteboom, S.G. (1972 b) Production and Perception of Vowel Duration, Philips ResearchReports Supplements ~.
Nooteboom, S.G. (1972 c) The Interaction of Some Intra- and Extra-Syllable Factors inSyllable Nucleus Durations, this issue.
Nooteboom. S.G. (1973) The Perceptual Reality of Some Prosodic Durations. Journal ofPhonetics l, 25-45.
Nooteboom. S.G. and Slis, I.H. (1970 a) A Note on th~ Jegree of Opening and the Durationof Vowels in Normal and ;:Pipe" Speech. I.P;,:. [.nnual Progress Report ~. 55-58.
Nooteboom, S.G. and Slis, I.H. (1970) The Phonetic Feature of Vowel Length in Dutch,I.P.O. 1!anuscript lB.§., to be published in Language and Speech (1973).
Schouten, J. F., Cohen, A.• and Hart, J. It (1962) Study of Time Cues in Speech Perception.J. Acoust. Soc. ArneI'. l:±., 517-518.
Slis, I.~. (1966) A Model for the Distinction between Voiceless and Voiced Ccnsona~ts.
r.P.Q Annual _~~ress Report l, 40-44.
Slis, I.H. (1967) What Causes the Voiced-Voiceless Distinction, LP.Q Annual ProgressReport ~, 71-76.
Slis. I.H. (1968 b) Experiments on Consonant Curation Related to the Time Structure ofIsolated Words, LPO. Annual Progress Report 1. 71-88.
Slis, I. H. (1969) Electromyographic Correlates of Force of Articulation. LPO. AnnualProgress Report :±,. 47-52.

29
Slis, I.H. (1970 a) Repetition of Articulatory Gestures and their Durational Consequences, I.P.O. Annual Progress Report ~, 65-67.
Slis, I.H. (1970 b) Articulatory Measurements on Voiced, Voiceless and Nasal Consonants, Phonetica 2:, 193-210.
Slis, I.H. (~971) Articulatory Effort and its Durational and Electromyographic Correlates, Phonetica ~, 174-188.
Slis, I.H. (1972 a) The Influ~nce of Articulatory Effort on the Timing of Speech,University of Essex, Language Centre, Occasional Papers 11, 128-150.
Slis, I.H. (1972 b) this issue.
Slis, I.H. (1969) and Cohen, A. On the Complex Regulating the Voiced-Voiceless Distinction, La~guage and Speech ~, 80-102 and 137-155.
Slis, I.H. and Nierop, D.J.P.J. van (1970) On the Forward Masking Threshold of Vowelsin VC-Combinations, I.P.O. Annual Progress Report ~, 68-73.
Slis, I.H. and Nooteboom, S.G. (1969) The Relevance of Vowel Length Categories forthe Articulatory Timing in Dutch Stressed Words, I.P~. Annual Progress Report 4,44-47. -

30
THE INTERACTION OF SOME INTRA-SYLLABLE AND EXTRA-SYLLABLEFACTORS ACTING ON SYLLABLE NUCLEUS DURATIONS
S.G.Nooteboom
Until very recently most statements to be found in the literature on the durational
behaviour of syllable nuclei concerned single effects. Such statements run for example
as follows: the durations of syllable nuclei in stressed monosyllables are somewhat
shorter before voiceless plosives than before fricatives. Or: the durations of syllable
nuclei in stressed syllables tend to be longer than those in unstressed syllables.
Or: the durations of syllable nuclei (and other acoustical segments) decrease with
increasing word length.
Such statements do not reveal the intricate interactions which may exist between dif
ferent factors acting on syllable nucleus durations in words and word groups. This has
been recognized for example by Klatt (1971), who stated "Syllable lengthening coulJ
not be established until most of the other factors involved in determining segmental
length were identified and quantified, which is why I believe that the regularities
in this pause system have not been noted previously". And: "The generative rule system
that has been described is sufficiently involved that it is not possible to predict
rule effects and interactions without explicitly programming the entire rule system".
The strong interaction between many factors acting on syllable nucleus durations has
been a major obstacle to research on the temporal organization of speech. Most tem
poral factors have been studied in isolation, but the quantitative results of such
studies do not show how the various factors interact quantitatively with one another
in connected speech. The solution to this predicament advanced by Klatt is the con
struction of an entire rule system, which can be tested and changed until its predic
tions are satisfactory, but Klatt does, in fact, not show how, heuristically, we are
to proceed in order to obtain reasonable hypotheses for the rule system.
In this paper I will propose that one possible way of doing this is to start from the
study of very simple nonsense words, in which single factors are studied in optimal
conditions, and then, combining these factors in nonsense words whi~h are gradually
becoming more complex and closer to real words in the language, see how these factors
interact quantitatively. The same approach may also extend over word groups.
I will first give an example of the effect of some intfa-syllable factors on syllable
nucleus durations in monosyllables, secondly, an example of some -extra-syllable factors.
Thirdly, I will present some data on the internal, auditory representation of syllable
nucleus durations, in order to ensure that the kind of phenomena we are studying is
perceptually real. Fourthly, I will present some data on the interaction between dif
ferent factors. Some of the results presented in this paper have been published earlier
and discussed more extensively in Nooteboom (1972,1973).
some intra-syllable factors in syllable nucleus durations
In a series of measurements on monosyllables of the form /mVC/. each syllable type
being spoken 6 times within a randomly ordered list by one speaker, data were obtained
on regularities in syllable nucleus durations due to intra-syllable factors. The syllable
types used can be derived from Fig. 1. The spoken monosyllables were tape-recorded
in optimal recording conditions, and high quality normal and duplex oscillograms were
made. The syllable nucleus durations were measured by hand, and the mean syllable nucleus
durations for each monosyllable type are presented in Fig. 1.
IPO annual progress report 7 1972

31
•••100 • •••••
50 a
k t p s f X 9 n m
• ••
k p t
• ••
X f s
• ••
IJ n '
• • •
p k t
• ••
I
s X f
•• •
m IJ nFig. 1. Syllable nucleus durations for monosyllables of the form ImVC/, for 51
different VC-combinations, each spoken 6 times by one native speaker ofDutch within one test series. Top: long vowels; bottom: short vowels.
Besides the great differences due to phonological vowel quantity we recognize the
well-known effect of vowel height, the effect of the plosive, fricative or nasal char
acter of the following consonant, and some other effects of specific vowel-consonant
interactions. The differences due to intra-syllable factors in the case of monosyllables
spoken in isolation may apparently be of the order of 40 ms for long vowels and 25 ms
for short vowels, or 25% of the mean values for both long and short vowels. There is
no doubt that such differences may playa role in the perception of speech. In fact,
it is known that in Dutch differences in syllable nucleus durations due to the voiced
or voiceless character of the postvocalic consonant, which are of the order of 25 ms,
may contribute to the perception of the voiced character (Slis and Cohen, 1969).
some extra-syllable factors in syllable nucleus durations
Some data on extra-syllable factors acting on syllable nucleus durations were obtained
in articulatory measurements with a lip contact, from the same speaker as in the above
measurements. The test materials consisted of simple nonsense words of the form /ma:m/,
/ma:ma:m/, etc. with different numbers of syllables and different stress placements.
The durations of consonants and vowels were measured as the intervals during which the
lips were closed and open respectively. The phonemic structure of the nonsense words
was chosen as simple as possible in order to eliminate differences in segment durations
due to intra-syllable factors. This has the disadvantage that these nonsense words may
hardly be called acceptable phoneme sequences to native speakers of Dutch.

32
For example four syllable words containing a long vowel in each syllable either do not
occur or are very rare loan words (Fischer-J¢rgensen).
However, I feel that l-ccis;::ly tis kind of simple nonsense words may reveal the effect
of generalized underlying timing patterns more clearly than more realistically struc
tured words would do. In this way reasonable hypotheses may be obtained which at a
later stage may ~e tested as to their generality.
Some of the data on these nonsense words are presented in Fig. 2.
m
m
\\\\1,-----
m m Q m Q m Q m
o 200 msFig. 2. Schematical durational build-up of simple nonsense words with word stress
on the initial syllable and varying number of unstressed syllables.Closecand open periods of the mouth have been measured by lip contact.

33
In this case all words were spoken with the stress on the first syllable. The stressedsyllable nucleus duration decreases as the number of syllables following in the wordincreases. It is as if the articulatory system is looking forward and increases itsrate of action as a function of the amount of work to be done in the programme.As pointed out by Lindblom and Rapp (1972) this durational behaviour of the stressedsyllable nucleus can be described as follows (at least for initial syllables):
(1)
Syllable nucleus durations forstressed initial syllables inthe words presented in Fig. 2,together with values calculatedfrom rule (1) (see text), withD=200 ms for long vowels, 100 msfor short vowels, and a=O.5and 0.4 for long and short vowels respectively.
Fig. 3.a
4 m----+
X a:
Xr---~
3
Calc.
spoken
1 2
100
ms200
in which V is the duration to be calculated, D is a standard duration; which has to
be chosen differently for phonologically long and short vowels, m is the number ofsyllables in the word from the beginning of the syllable concerned, and a a factorsmaller than 1, restricting the effect of m. The data presented in Fig. 2 can becompared to values calculated from rule (1) in Fig. 3. Quantitative rules for unstressed
vowels will not be discussed here(See Nooteboom 1972 b, 1973).
The example given may suffice to showX that there exist rather outspoken
prosodic timing patterns in the temporal organization of words whichgovern the measurable durations ofindividual syllable nuclei. It may beasked whether such differences inarticulatory timing are perceptuallyreal.
the perceptual reality of some prosodic durations
In order to study the perceptual reality of some prosodic durations some perceptualexperiments were carried out using a method of matching to internal criterion. Theexperiments and their results were discussed extensively elsewhere (Nooteboom 1972,1973). Here I will confine myself to presenting some examples of the results.The examples given concern long and short stressed vowels in initial syllables ofsynthesized versions of common Dutch words, differing in the number of syllablescoming later in the word. Two test series of words were used, viz.:
(a) maat, mate, mateloos, mateloze
(b) pan, panne, pannekoek, pannekoeken
The stressed initial syllables contain a long vowel la:1 in series (a) and a shortvowel lal in series (b).

34
from (1). The standard durations D
were the same as in the description
of the earlier mentioned articulatory
data on nonsense words, namely 200 msfor long vowels, and 100 ms for short
ones. The power exponent ~ however,
was made to fit the new data. Below
I will return to this discrepancybetween the two sets of data. In Fig.4 the vertical axis gives the syllable
nucleus durations in ms, the horizon
tal axis the number of syllables in
the word counted from the beginning
of the syllable concerned.
These results, and similar results for
unstressed vowels show that the prosod
ic timing patterns, found in articu-
latory measurements. of simple nonsense
words, are of more general validity
and perceptually real.
mPreferred adjusted, spoken and calculated durations of stressed la:1 anilal as a function of the number of syllables in the word counted from the beginning of the syllable concerned.Calculated values were obtained fromrule (1) with D=200 ms and 100 ms forlong and short vowels respectively,and G = 0.2 for both.
1000
x~o---x- xcalc.
C> 0
0 spoken
x adjusted
ms
Fig. 4.
200
Three naive subjects were asked to so adjust the durations of these syllable nuclei,
that the words as a whole sounded as natural as possible. For each individual adjustment the word in question was made audible to the subject over headphones as many timesas he wished. Each subject made 10 adjustments for each word. The duration could bealtered by turning a knob. The relation between the knob position and the duration wasnon-linear and changed randomly after each trial. The same words were spoken two monthslater by the same subjects, each word twice by each subject. These spoken versions were
recorded on tape, spectrograms were made and the durations of the stressed syllablenuclei measured. The results of these experiments are presented in Fig. 4. The ad-
justed durations averaged over all
settings of all three subjects are
indicated by crosses, the spokendurations by circles. The solid lines
indicate calculated values as obtained
interaction between some factors in syllable nucleus durations
Above, a discrepancy was noticed between t;1e quantitative effect of the number ofsyllables in the word on stressed syllable nucleus durations as measured articulatorily in simple nonsense words and as found in perceptual adjustments of syllablenucleus durations in synthesized common words. The ca'Jse of this discrepancy appearsto be the different stress patterns of the words used in the two situations . Thenonsense words had only one word stress, on the initial 5yllable, the three and foursyllable words in the perceptual experiments had two stresses, a primary stress onthe initial syllable, and a secondary word stress on the third.
One may notice that the unit within which the duration of the stressed syllable

35
nucleus durations is determined has until now been assumed to be the word. There is
some controversy, however, in the phonetic literature whether the word or the foot
(defined as a stressed syllable plus all the following unstressed ones) is the relevant unit for the description of the timing phenomena under discussion (See e.g.
Abercrombie, 1964). It has been pointed out by Elisabeth VIdal I that the data present-ed earlier in this paper could also be explained in terms of foot isochrony. If we
now assume that a word like /ma:talo:za/ consists of two feet, each two syllableslong, we would not expect to find the same syllable nucleus durations in the initial
syllables. To study this question further, some simple measurements were performed onthe following words:
/ma:tat/
/ma:tata:tat/
/ma:tatatat/
/matat/
/matatatat/
/matatatat/
These words are somewhat closer in their phonemic structure and stress pattern to
normal Dutch words than the nonsense words used earlier. They were spoken by one
speaker, the present author, each word six times, in a quasi random order, under optimal recording conditions. A tape recording was made and high quality normal andduplex oscillograms were made. The durations of all acoustic segment durations weremeasured by hand. The standard deviations were generally between 5 and 10 ms.The results are presented schematically in Fig. 5. These results are relevant to the
controversy between word and foot isochrony. If the word was the relevant unit within
which the compensatory adjustment of syllable nucleus durations took place, one would
expect the durations of the stressed initial syllable nuclei in the second and thirdwords to be equal, just as the durations in the fifth and sixth words, because in thosefour words the number of syllables in the word is equal. If, on the other hand, the
foot would be the relevant unit for compensatory adjustment, one would expect the du
rations of the stressed initial syllable nuclei in the first and second words to beequal, and those in the fourtii and fifth ~ords, because in those four cases we have
feet of two syllables. The results rather indicate that both the word and the foot are
appropriate units for the description of timing phenomena. We may express this formally
by changing the formula (1) used earlier in the following way:
(2)
in which V is again the duration to be calculated, D is a standard duration being
different for long and short vowels, m is the number of syllables in the word counted
from the beginning of the syllable concerned, and p is the number of syllables in thefoot counted in the same way. a and 8 are positive and smaller than 1 and restrict
the effects of m and p respectively. The dotted lines in Fig. 5 connect values cal
culated from formula (2) with appropriate values for the parameters (see caption to
Fig. 5). The above example showed an interaction between two prosodic factors acting
on stressed syllable nucleus durations. The following example concerns a case of
interaction between intra- and extra-syllahle factors.Test m~terials were constructed from four syllable types, viz. /ma:m/, /me:p/, /mam/and /mIp/, followed by a varying number of unstressed syllables, in the following way:
/ma:m8tatat/. These syllable types were found to show extensive differences in syllable
nucleus durations from type to type when spoken as monosyllables in isolation (Cf. Fig.1). The test words obtained were spoken six times each by the present author in optimal
recording conditions, and high quality normal and duplex oscillograms were made. The
stressed syllable nucleus durations were measured by hand. The standard deviations
were generally between 5 and 10 ms.

36
m
a
/
a t
100
t
300
a t
500
t
ms700 900
Fig. 5. Schematic durational build-up of Dutch nonsense words with .different stresspatterns. Acoustic segment durations were measured in oscillograms, eachpresented duration being the mean over six individual measurements. Thedotted lines connect values calculated for the stressed initial syllablenuclei. These values were obtained from rule (2), with D=200 and 100 ms forlong and short vowels, a and 6 are 0.25 and 0.13 for long vowels, and 0.2and 0.1 for short ones.
The results are presented in Fig. 6. It may be seen that the effect of growing number
of syllables coming later in the word decreases as the duration of the syllable nucleus
in the case of the monosyllable decreases. This is not only true for the absolute effect
(in milliseconds)~but also for the relative effect (in percent). In the case of the very
short syllable !mIp! the shortening effect has nearly vanished.
We may interpret this as a greater resistance against prosodic shortening for inherent
ly shorter syllable nuclei than for longer ones. To describe these data quantitatively
an algorithm has been constructed that takes at its input a sequence of phoneme symbols,
word boundaries and stresses being indicated. The algorithm for each stressed vowelcomputes the number of syllables in the word end and to the next stress. It determines
the character of the following consonant and assigns an inherent syllable nucleus dura
tion to the vowel. Then the power exponents of rule (2) are appropriately determined asa function of the inherent syllable nucleus duration.

37
Syllable nucleus durations for stressedinitial syllables of varying phonemicstructure as a function of the numberof unstressed syllables remaining to beproduced in the word. Each mark givesthe mean of six measurements. The curvesconnect values calculated from an algorithm described in the text. calc.
---at
1mv
expo
• a:m~ a: t
A e: m0 am
Finally, the actual syllable nucleus
duration is calculated from rule (2).
The inherent syllable nucleus duration
is obtained from the data presented
in Fig. 1. In Fig. 6 the solid lines
connect values calculated from this
algorithm, with a correction for a
difference in tempo applied to the
inherent syllable nucleus durations
as obtained from Fig. 1.
To see whether the algorithm has any
more general validity, a new series
of measurements was carried out in
the same way as the preceding ones,
this time with the syllable types
/ma:m/, /ma:t/, /me:m/, /mam/, /mat/
and /mIm/, and a considerably faster
tempo. Again an appropriate correc
tion for tempo was applied to the
inherent syllable nucleus durations.
Nothing else was changed in the
algorithm. The results of these mea
surements together with the calculat-
ed values are presented in Fig. 7.
The fit seems to be quite satisfac
torily.
ms
50
150
200
100
mVCatatmVCat mVCatatat
mVC
~ .........• "'!oo..
~ '--... A_.~9JA 0__~ A A
------
expo calc.
• aLm)A e(: p) -'-'
o am
A 1p ---
As Fig. 6 for new testmaterials. Calculatedvalues were obtainedfrom the sawe algorithm.
o
50
ms
150
100
200
rig. 7.
Fig. 6.
omVC mVCatat
mVCat mVCatatat

38
discussion
The main point of the present paper is to demonstrate that a possible way of achieving
a rule system for the description of quantitative interactions between various factorsacting on syllable nucleus durations in real speech, is to start from very simple nonsense words and then to proceed gradually to more realistically structured words.This naturally is a step-by-step procedure and only some minor steps have been taken.Even the results found in these first steps are not very well established becausethe amount of data on which they are based is rather limited. The results may suffice,however, to show that this kind of procedure works satisfactorily and may lead touseful quantitative rules, which can be subjected to further tests, and can be extended to cover new findings. A clear advantage of the present procedure is that it firstleads to the description of factors in syllable nucleus durations in isolated andpresumably optimal conditions, so that the underlying patterns are revealed mostclearly, and only then shows how the quantitative effect of these factors interactswith that of others. Thus in the resulting rule system the various factors are presented in an abstract, non-polluted form. This may help in phrasing new and interestingquestions concerning the origin, and the universality or language specificness of thevarious factors.
Many problems arise with respect to the perceptual functioning of the temporal factors in syllable nucleus durations. The strong interaction of many factors seems toobscure the perceptual identity of each of them. On the other hand, the interactingfactors together put rather heavy constraints on the number of possible temporalpatterns in the language. It may be hoped that the explicitation of these constraintsin the form of a rule system for the temporal patterning in speech may help tofurther future investigations into the perceptual functioning of these temporal patterns.
summary
Research into the temporal organization of speech is hampered by the strong interaction between many factors acting on measurable durations. In this paper a possibleway is proposed for approaching a rule system for the temporal organization of speech.This may be done by starting from the study of very simple nonsense words, in whichsingle factors in nonsense words are studied in optimal conditions, and then, combining these factors in nonsense structures, gradually becoming more complex andcloser to real linguistic structures in the language, see how these factors interactquantitatively. The approach is exemplified in a series of measurements on syllablenucleus durations.
The durational effect of the following consonant on a stressed syllable nucleus
duration is studied, and it is shown how this effect interacts with that in position
in word and foot. Also some data are presented on the perceptual reality of some
prosodic syllable nucleus durations. The quantitative interaction between the variousfactors can be described quantitatively in the form of a simple algorithm.
references
Abercrombie, D. (1954) Syllable quantity and Enclitics in ~nglish. In : In Honour toDaniel Jones, Paper contributed on the occasion of his eightieth birthday, 12september 1951. Ed. D. Abercrombie, D.B. Fry, P.A.D. MacCarthy, N.C. Scott,J.L.M. Trim. London, Longman Green and Co. Ltd.,215-222.
Fischer-J~rgensen, E. Personal Communication.
Klatt, D.H. (1971) A Theory of Segmental Duration in English. Paper presented at the82nd Meeting of the Acoustical Society of America, Denver, Colorado, October 1971.

39
Lindblom, B. and Rapp, K. (1972) Reexamining the Compensatory Adjustment of VowelDuration in Swedish Words, Occasional Papers 13, Language Centre, Universityof Essex, 204-225.
Nooteboom, S.G. (1972) Production and Perception of Vowel Duration, Philips Re~.Rep.
Suppl. 5.
Nooteboom, S.G. (1973) Perceptual Reality of some Prosodic Durations, J. Phon. !,25-45.
Slis, I.H. and Cohen, A. (1969) On the Complex Regulating the Voiced-Voiceless Distinction, I and II. Language and Speech ll, 80-102 and 137-155.
Uldall, E. Personal Communication.

40
ON COARTICULATION OF ARTICULATORY EFFORTAND SYLLABLE BOUNDARIES·
IHSlis
In previous reports we proposed a model on the relation between effort and the timing
of articulation. In this model it was assumed that speech sounds, articulated withmore effort compared to those articulated with less effort, are advanced in time with
respect to the innervation of the muscles that perform the initial closure. (Slis,1969,1970,1971,1972).In the literature, tendencies can be found that higher muscle activity is not restricted to the closing gestures of the vocal tract, but it can be shown also to be presentin other muscles involved in the production of that particular speech sound.Literature on this point reviewed in Slis, 1969, 1971 and 1972 indicates a 'wave' ofhigher innervation affecting the complete set of muscles in op~ration. If the effortradiates spatially to other muscles, one might wonder whether effort radiates in timejust as well. In other words, is it possible that indications of higher effort can befound in gestures belonging to other speech sounds in the temporal environment?If the latter is the case, it may be asked whether this effect is restricted to thegestures of the same syllable or whether it is stopped by syllable boundaries.We specifically ask ourselves whether traces of e:fort are to be found in preceding
sounds or syllables with regard to an advancement of the timing of articulatorygestures.
Before trying to find an answer to this question, we think it useful to define the
syllable, since it is a point of discussion in the present literature. Three differentcategories of speech production models can be distinguished with respect to the roleassigned to syllables:
need for syllables. We think we can incorporate the model ofby Daniloff and Moll, 1968) in this category. This model des-
•ms
pa:
jpa:pa: pa:pj
p
boundaries.
(po po p opj
~. .,. , ., « !
a:pa:p
popopop
() 200 400 600, , , ,
a process that is independant of syllable
~, I
1 ; Ga:I : ----, I, ,. .I •
1. Models which have noHenke (as describedcribes articulation as
2. The second group of models can be represented
by the view of Chistovich and Kozhevnikov (1966).
They assume that speech is programmed in termsof consonant-vowel (CV) groups.
3. The last category is derived from a more tradi
tional view of the syllable, which is based
mainly on intuitive and distributional data.
In it we find open syllables (CV or V) with
long vowels on the one hand and closed sylla
bles (CVC or VC) with short as well as long
vowels on the other .
In line with our attitude held in our previous re
ports on effort oppositions, where we tried to account for the intuitive concept of effort, we as
sume that the third category, which is based,
among other things, on intuitive grounds, is a
good working hypothesis. In accordance with thismodel the word jpa:pa:pa:pj can be divided into
* This report is part of a paper read at theSecond Annual Essex Phonetics Symposium(Slis, 1972).
Fig. 1. Schematic representationof the build-up of a wordof open (upper part) andclosed (lower part) syllables.
IPO annual progress report 7 1972
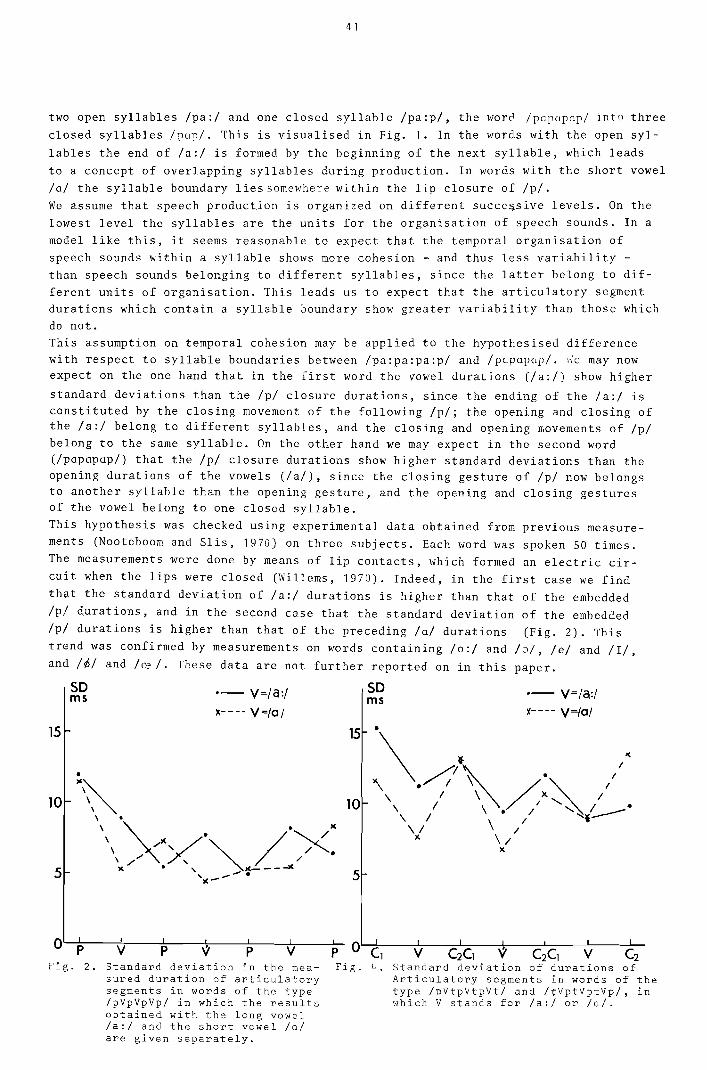
41
two open syllables Ipa:1 and one closed syllable Ipa:p/, the word Ipapapapl into threeclosed syllables Irau/. This is visualised in Fig. 1. In the words with the open syl
lables the end of la:1 is formed by the beginning of the next syllable, which leadsto a concept of overlapping syllables during production. In words with the short vowellal the syllable boundary lies somewhere within the lip closure of Ip/.We assume that speech production is organized on different succe~sive levels. On thelowest level the syllables are the units for the organisation of speech sounds. In amodel like this, it seems reasonable to expect that the temporal organisation ofspeech sounds within a syllable shows more cohesion - and thus less variability than speech sounds belonging to different syllables, since the latter belong to different units of organisation. This leads us to expect that the articulatory segmentdurations which contain a syllable boundary show greater variability than those whichdo not.This assumption on temporal cohesion may be applied to the hypothesised differencewith respect to syllable boundaries between Ipa:pa:pa:pl and Ipapapap/. We may nowexpect on the one hand that in the first word the vowel durations (/a:/) show higher
standard deviations than the Ipl closure durations, since the ending of the la:1 isconstituted by the closing movement of the following Ip/; the opening and closing ofthe la:1 belong to different syllables, and the closing and opening lliovements of Iplbelong to the same syllable. On the other hand we may expect in the second word(/papapap/) that the Ipl closure durations show higher standard deviations than theopening durations of the vowels (/a/), since the closing gesture of Ipl now belongsto another syllable than the opening gesture, and the opening and closing gesturesof the vowel belong to one closed syllable.
This hypothesis was checked using experimental data obtained from previous measurements (Nooteboom and Slis, 1970) on three subjects. Each word was spoken 50 times.The measurements were done by means of lip contacts, which formed an electric circuit when the lips were closed (Willems, 1970). Indeed, in the first case we findthat the standard deviation of la:1 durations is higher than that of the embedded
Ipl durations, and in the second case that the standard deviation of the embeddedIpl durations is higher than that of the preceding lal durations (Fig. 2). Thistrend was confirmed by measurements on words containing 10:1 and IJI, /el and III,and I¢I and lre/. These data are not further reported on in this paper.
SOms .- y=/a:/
x- - -. Y'=10 I
SOms .- Y=/a:/
x---- Y=/ol
15
10
5
15
10
5
'\ . .)\ "/?~ /"~ 1/
\ I \~ x....... I\ I \. // ....... / __"\ / \ / "4--\/ /
x. \ /x
Standard deviation in the measured duration of articulatorysegments in words of the typeIpVpVpVpl in which the resultsobtained with the long vowella:1 and the short vowel lalare given separately.
O'---*p;------;-Y';------=:p-----:-1\~..-------~p----fY;---P~ O~(-1---;-':----::::-'-:=------;-;;------::-'-:;:---;'":----=-y Y (2(1 'it (2(1 Y (2
Fig. 4. Standard deviation of durations ofArticulatory segments in words of thetype IpVtpVtpVtl and ItVptVptVp/, inwhich V stands for la:1 or la/.
Fig. 2.
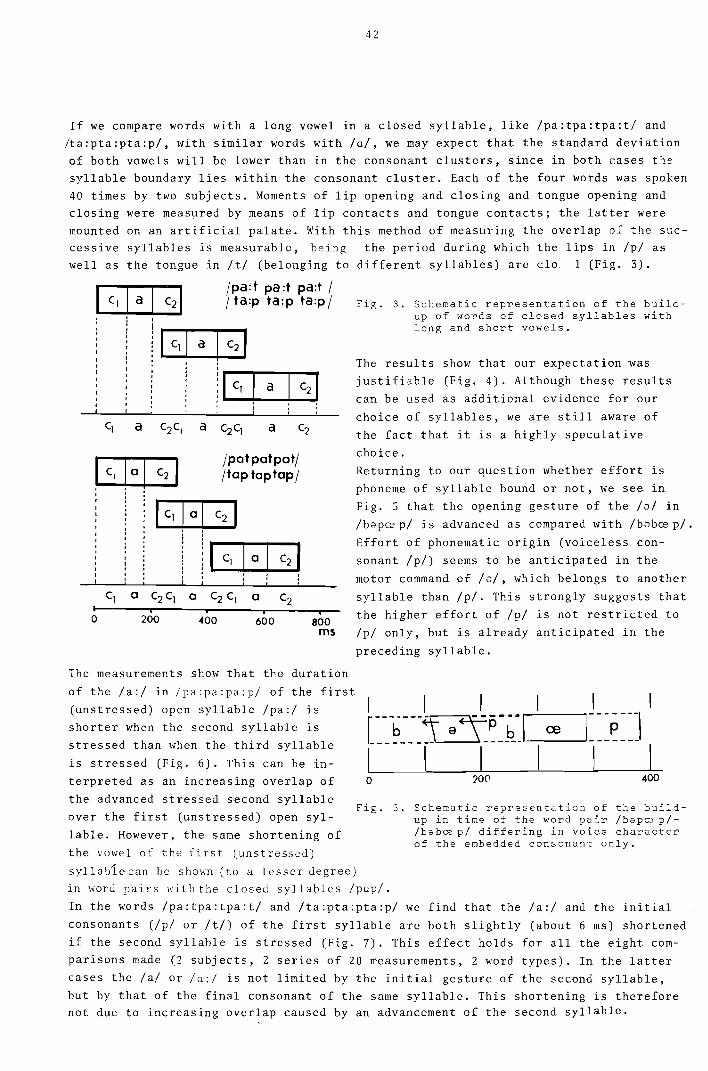
42
If we compare words with a long vowel in a closed syllable, like /pa:tpa:tpa:tl andIta:pta:pta:p/, with similar words with /u/, we may expect that the standard deviationof both vowels will be lower than in the consonant clusters, since in both cases t'lesyllable boundary lies within the consonant cluster. Each of the four words was spoken40 times by two subjects. Moments of lip opening and closing and tongue opening andclosing were measured by means of lip contacts and tongue contacts; the latter weremounted on an artificial palate. With this method of measuring the overlap of :he successive syllables is measurable, being the period during which the lips in /pl aswell as the tongue in It I (belonging to different syllables) are clo i (Fig. 3).
Fig. 3. Schematic representation of the buildup of words of closed syllables withlong and short vowels.
The results show that our expectation wasjustifiable (Fig. 4). Although these results
can be used as additional evidence for our
choice of syllables, we are still aware of
the fact that it is a highly speculative
choice.
Returning to our question whether effort isphoneme of syllable bound or not, we see in
Fig. 5 that the opening gesture of the /d/ in
/b8pce p/ is advanced as compared with /b8bce p/ .
Effort of phonematic origin (voiceless con
sonant /p/) seems to be anticipated in the
motor command of /d/, which belongs to another
syllable than /p/. This strongly suggests thatthe higher effort of /p/ is not restricted to
/p/ only, but is already anticipated in the
preceding syllable.
800ms
a
600
jpa:t pa:t pa:t j/ ta:p ta:p ta:p I
i
400200
GEG~, ,
!!~"~: : : : :
, ! • j
~ Ipatpatpatj~ jtaptaptapjI I:, "GEGJ
~,,
o
The measurements show that the duration
70('
Schematic representation of the buildup in time of the word pair /bapre p//bab~p/ differing in voice characterof the embedded consonant only.
o
Fig. 5.
of the /a:/ in Ipa:pa:pa:pl of the first
(unstressed) open syllable /pa:1 isshorter when the second syllable is
stressed than when the third syllable
is stressed (Fig. 6). This can be in
terpreted as an increasing overlap of
the advanced stressed second syllableover the first (unstressed) open syl
lable. However, the same shortening of
the vowel of the first (unst ressed)
syllable can be shown (to a lesser degree)in word pairs with the closed syllables /pap/.
In the words /pa:tpa:tpa:t/ and /ta:pta:pta:p/ we find that the /a:/ and the initial
consonants (/p/ or /t/) of the first syllable are both slightly (about 6 ms) shortenedif the second syllable is stressed (Fig. 7). This effect holds for all the eight comparisons made (2 subjects, 2 series of 20 measurements, 2 word types). In the latter
cases the /a/ or /0:1 is not limited by the initial gesture of the second syllable,but by that of the final consonant of the same syllable. This shortening is thereforenot due to increasing overlap caused by an advancement of the second syllable.

43
I I I I stress I I Il~-~~~j a:~_~~~L£Z~Z~a-:7~ ~
stress
stress
\~~~~~_\ a ~-~~@_-!~8~~~]
_I 1 I I 'r 1 1-- 200 0 200 400 ms
Fig. 6. Schematic representation of words of the type !pa:pa:pa:p!(upper part) and !pupapap! (lower part). In each block thetime structures of words with stress on the second and thaton the third syllable are compared. The arrows in the figureindicate an advancement intiming.
-200 o 200Lms
Fig. 7. Schematic representation of words of the type !pa:tpa:tpa:t! and!ta:pta:pta:p!. In this figure words with the stress on the secondsyllable (upper traces) and on the third syllable (lower traces)are compared with respect to their timing of articulatory events.
These data show an influence of stress on the timing of the unstressed syllable pre
ceding the stressed one. Therefore we think it justifiable to assume that the higher
effort of stress is anticipated in the preceding syllables. On the basis of the data
presented we would propose a model in which an increase in effort of phonematic ori
gin as well as of prosodic origin is translated into an advancement of the articulatory command. The increase in effort is not restricted to the speech sound or syl
lable that causes the effort increase, but is anticipated in a coarticulation-like
manner in the preceding commands.
summary
A syllable model with closed (YC or CYC) and open syllables (Y or CV) is proposed.
=losed syllables may contain long as well as short vowels, open ones may contain long
ones only. It is assumed that two articulatory gestures belonging to one syllable are
more closely related in the time programme of articulation than two gestures belonging
to different syllables. Moments of lip- and tongue opening and closing were measured.
44
Intervals between two of these articulatory events show larger standard deviations
when they belong to different syllables, than when both take place in one syllable,
which is in accordance with the assumption. Previously we have shown that linguisticeffort is correlated with an advancement in time of the initial gesture of a speechsound with effort. It is shown that this advancement is not restricted to the initialgesture of the speech sound at issue, but that it extends to preceding gestures as well.Syllable boundaries impose no constraints on this effect.
references
Daniloff, ~. and Moll K. (1968) Coarticulation of Lip Rounding,J. Speech and HearingRes. 11, 707--721.
Kozhevnikov, V.A. and Chistovich, L.A. (1966) Speech: Articulation and Perception,2nd ed., Washington.
Nooteboom, S.G. and Slis, I.H. (1973) The phonetic feature of vowel length in Dutch,Language and Speech (in press).
Slis, I.H. (1969) Electromyographic Correlates of Force of Articulation,I.P.O.AnnualProgress Report ~' 47-52.
51is, I.H. (1970) Articulatory Measurements on Voiced, Voiceless and Nasal Consonants:A Test of a Model,Phonetica ~' 193-210.
Slis, I.H. (1971) Articulatory Effort and its Durational and Electr~myographic Correlates,Phonetica l2, 171-188.
51is, I.H. (1972) The Influence of Articulatory Effort on the Timing of Speech,Occasional Papers (University of Essex, Language Centre) l2, 128-150.
Willems, L.F. (1970) Measuring Circuit for Tongue and Lip Closure Duration,I.P.O. AnnualProgress Report ~' 185-187.

3 VISUAL PERCEPTION

4S
INTRODUCTION I.P.O. RESEARCH ON VISION 1972
H.8ouma
This introduction intends to augment for the reader the structure of our 1972 researchon vision by briefly sketching its perspective, also of research not explicitly dealt
with in the present progress report.
In VISUAL DYNAMICS, the beautifully simple relationships between deLange flicker-fusioncurves and flash thresholds have now been published in Vision Research in one paper onexperiments and one on theory. Shortly, a third paper will appear in which thresholdsfor double flashes are shown to fit nicely the proposed theory. The low frequency portions of deLange curves, representing differentiating processes, still contain someunsolved problems and a rather fundamental difference between the dynamics of brightness vision (slow) and the dynamics of flicker vision (fast) will perhaps have to bemade. If so, it should be concluded that the essentials of brightness dynamics are stil
rather obscure.
SLANT
PERCEPTION
SLANT
PERCEPTION
READING processes, as approached from the side of research
on vision, can roughly be divided in eye saccade control,
form recognition, and central integration. Saccade measure-
ments carried out this year have failed to reveal substan-tial correlations between durations and sizes of successive reacing saccades. L2S~
year, we reported that~henjumps of retinal images are under experimental control,reading is quite possible. It seems to follow that individual saccades are not con
trolled by proceeding recognition, but, less critically and more rapidly, at a lower
level. Assuming word recognition to be a constituent of rending, we have an activeinterest in those perceived word properties which trigger word perception. Certainletters may perhaps function as such, particularly initial and final letters (paperforthcoming in Vision Research), but also globe.l Dropert~es of words, whatever thesemay be. We are interested in what these may be and are studying the factor of wordlength. It has become clear by now that recognition of words slightly off fixationis not limited by visual acuity but by adverse interactions between (line?) stimuli.It is conceivable that certain reading difficulties find their basis in a high degreeof such interference.
On SLANT PERCEPTION, a 19 minute movie has been finished,which intends to bring to a wider audience the reality ofa piece of research, without becoming inaccurate by undue
popularizing.In eccentric vision, masking interactions occur between
parallel lines, as reported in the 1971 issue of our An
nual Progress Report, and these data have been corroborated this year. At the boundary of neuro-physiology and
psychology of perception there are intriguing problemson how the multitude of excitations, produced by a singleretinal stimulus, converges towards a single perceivedobject, such as a single line. A few years ago we builta hard-ware slant detector for this purpose, and for continuing the work in soft-ware for more complex configurations, we have completed an apparatus which links a16 x 16 matrix of phototransistors to our P 9202 computer.
IPO annual prol!ress report 7 1972

46
Visual CONSPICUITY, or prominence, of objects in their background seems to us an im
portant factor in normal vision, since it can be assumed to be a determinant of the
line of regard. The complex, or at least in,lomogeneous, background is essential, and
this is where research on conspicuity deviates from most of the visual experiments
described in the literature. The influence of the back~round can be described as an
adverse interference. Sy experimenting with a number of different subjective criteria
of noticing c test object, it has now become cleBr that part of this interference is
specific for the perceptual dimension involved: luminance-specific interference and
size-specific interference have been demonstrated. Apart from this, there is also
interference to which no clear-cut specificity can be attributed so far.
For coloured stimuli at rather low luminances, we have found that chromaticity
contrast is seconc~ry to luminance contrast. In that colour widens the so-called
conspicuity area only if luminance differences are low.
The world of the VISUALLY IMPAIRED held our attention this year, since we had ana
lyzed a close mutual cont~ct as a prerequisite for the fruitful development of tech
nological devices for improving adaptability and independence of those whose vision
is poor or absent. We describe separately the factual progress made with two such
devices, viz. a TV magnifier 5-25 X, now in production, and a drawing board for em
bossed relief figures. Also, we try to analyze the gap between research effort and
devices actually available.
As in earlier years, many problems of directly APPLIED nature came to our attention
in which visual perception of i~dustrial products or tasks was critically involved
(legibility, detail visibility, TV flicker, etc.). A few of these are reflected in
separate contributions. It is fortunate that a number of these problems, often too
complex for theoretical analysis, can be satisfactorily solved by direct experimen
tation, on the basis of existing knowledge.
TECHNOLOGICAL DEVICES FOR THE VISUALLY HANDICAPPED:GAP BETWEEN RESEARCH EFFORT AND AVAILABLE AIDS
H.Bouma, F.L.Engel and H.E.M.Melotte
introduction
There is a general awareness that technology should come to the aid of people handi
capped with perceptual or motor deficits. If such a handicapped individual happens
to find his way to a technological research institute, he is typically met by inventive
enthousiasm and after many hours or days of hard work, a useful apparatus may result
which is put at his disposal free of cost. In addition to this, quite a few institutes
manage to run a project aimed at constructing certain devices on their own initia~ive.
Despite of this, the majority of such handicapped people have only limited profit
from advanced technology. Catalogues of available aids certainly do not reflect much
research effort. As seen from the side of the research, reports and conference papers
typically concern "prototypes under construction" or "prototypes to be tested shortly".
This would suggest improvement of the situation in the near future, were it not for
IPa annual progress ret>ort 7 /972

47
the fact that this research situation seems rather stable over the years with a few
notable exceptions. In the wake of this illusory progress some reflection on the gapbetween research effort and available aids may be useful.
In fact,we entered the problem area much in the way described. Over the years, a number
of devices have been constructed in our Institute, most of them for a single handicappedperson only. Ex~ples are a guiding plate and an automatic sheet-inserter both for a
typewriter (Vredenbregt, Van den Ban, and Melotte, 1968), and a Braille punch for label-ing tape. A few projects of a somewhat wider scope, such as a punched-tape controlledBraille writer, did not reach a stage of sufficient reliability. One notable exception,for people with motor-handicaps, was a nerve stimulator for drop-foot patients, which
is now commercially available (Vredenbregt and Noordermeer, 1967).
When, in 1971, we improved a relief-drawing technique for the blind and put together aclosed circuit television set for enlarging print ("TV-Magnifier"), we realized theregrettable inefficiency of testing the usefulness of the apparatus for a certain individual only rather than the usefulness for the general category of people concerned.
In consequence, we discontinued a long term project on tactile image perception and
spent the available time on testing two potential aids on a larger scale, on adapting
them for a more general use, and on pulling them towards general availability.These projects concerned the above TV-Magnifier and a drawing system for embossedrelief figures. Before describing our 1972 efforts in more detail, we shall firstbriefly survey the field for the visually handicapped, and outline some of the problemsin a more general way.
visually handicapped: needs and aids
The term "visually handicapped" is understood to mean those persons whose V1Sl0n isfunctioning below normal. Such deficiencies may range from total blindness to a levelat which, with optical aids, still some reading remains possible. Broadly speaking,these visual impairments can be more or less characterized by a low visual acuity and/or a diminished visual field. The causes of impairment are manifold, congenital deficiences, (traffic) accidents and (neural) diseases among which many concomitan ofold age.
Two major aspects of present day life which cause difficulties for those with grosssight deficiencies are mobility and reading. Both involve an obvious loss of independence for the individual. The most relevant developments in visual aids are thereforerelated to these two abilities. In 1970, Nye and Bliss published a very informative
survey on these topics. We shall indicate briefly recent developments in this field,with special emphasis on those that crossed the gap between prototype and generallyavailable aid.
For reading and writing the braille code has been in use for about 150 years. A goodbraille reader, using (contracted) Braille II, can read at speeds of 200 words perminute. This illustrates that information can be transmitted through the tactile senseat rather high rates. More usual speeds are however 75 words/min. for Braille Grade Iand 125 words/min. for Braille Grade II. For comparison: speeds of normal (silent)reading are 200-800 words/min., whereas e.g. talking book5 are recorded at an averagespeed of about 180 words/min. A speed below 20 words/min. or so is considered insufficient for interested reading and acceptable only for certain special tasks, such asreading bank cheques.

48
It should be noted that not all visually handicapped can read braille effectively.
According to a survey of Grey and Todd (1968) covering the registered blind of Eng
land and Wales, only 40% of those aged between 16 and 64 could read braille effective
ly. Moreover, less formal materials like notes, letters and newspapers are generallynot available in Braille. A typewriter-adaptor, supplying a simultaneous Braille copyhas recently been announced (Phylab Brailler).Ideas and efforts on direct conversion of inkprint text into audio or tactile signals
date from the beginning of this century. Only recently has one of those devices, the
"Optacon" (Linvill and Bliss, 1966), become commercially available. With this promising
reading aid, producing an enlarged tactile facsimile display on a single finger, reading
rates ranging from 20 to 70 words/min. have been achieved. By means of a small optical
probe the Optacon translates an area of about the size of a letter space into a similar
tactile image produced by a 24 x 6 array of small piezoelectrically driven rods.
Teaching programs, further applications, and possibilities for financial support, are
currently under study (Optacon Newsletter no. 3, November 1972). Other reading aidsfor direct audible or tactile translation including reading machines based on more or
less refined print recognition giving (spelled) speech output, are only at the labora
tory stage. The possibilities of a relief drawing technique in which characters drawn,immediately appear embossed at the working side, will be described elsewhere in this
contribution.
Situations for which mobility aids are required are considerably more variable than
those which confront a reading aid. Major requirements for a mobility aid are adequate
varning and reliable service. In this respect the cane can hardly be surpassed by an
electronic aid as to simplicity, effectiveness and reliability. Therefore the devices
currently under development aim at supplementing the cane. In general these devices
are based on the emission of light or ultrasonic radiation and the detection of the
reflected energy.
The ultrasonic torch developed by Kay (1963), which is in fact the only OP~ commerciallyavailable, transmits during short pulses an ultrasonic beam, with frequency sweeps
from about 90 kHz to 40 kHz. The echo received is mixed with the transmitted signaland the resulting difference frequencies in the audible range are supplied to an ear
phone. Within a radius of a few meters, direction, distance and structure of surrounding
objects can thus be estimated. In spite of the enthusiastic response of users of the
torch, this aid does not yet seem to be in general use. Further developments, such assimilar ranging devices in spectacles or in the cane, which leave the hands free,are" under development".
A general problem in designing sensory aids is to achieve an intimate interface, audi
tory or tactile, between the user and his aid .':'J:8 work of Starkiewicz and Kuliszewski
(1965) in improving these interface aspects should also be mentioned. They built a
portable optical to tactile image conversion system with 144 tactile stimulators on
the forehead, for scanning the environment, as did Bach y Rita et al. (1969) with 400stimulators on the subjects back. However, these devices are not commercially available.
Direct electrical stimulation of the visual cortex, causing electro-phosphenes, hasrecently been tried by Brindley and Lewin (1968), which research is in fact far from
a practical realization.

49
So far, we described some of the most promising devices. However, one should be awareof the large number of developments that failed in spite of the technological ingenuityinvolved. In fact problems of a different nature must be solved as well, such as evaluation, training, distribution and financing. These will now be discussed.
from laboratory model to industrial product
The motive for p'ushing a certain apparatus towards general availability is its usefulness which should therefore first be assessed. In the stage of a laboratory model,
a serious though subjective assessment by one or two people may suffice. If, however,
production is considered, a more general and objective test is needed for assessing
the usefulness of the apparatus in regard to the various categories of handicapped
people who might profit from it. Also, information on the drawbacks of the laboratory
model is needed for finding a good ergonomic design.
Therefore, a substantial number of potential users should tryout the apparatus
seriously, and sufficiently long to pass through a possible initial learning phase.It will be clear that contacts with a few handicapped persons cannot fill this need.Closer contacts are necessary with institutes and organizations of the handicappedand with the medical profession involved. In case of a loose organizational structure,this may prove to be a time-consuming activity. Let us assume that the prototype turnsout useful in such a test, and that a number of shortcomings are revealed. Then, animproved prototype must be built. If, however, this prototype is actually intended to
be produced, quite different requirements should be met as well. Materials to be usedmust be inexpensive, labour minimized and tools for the production must be available
in the actual production unit. At this stage it should be known where the production
will take place, especially since the rather small number of devices may lead to
rather small production units with restricted possibilities. So contacts with a production unit come relatively early. Prior to production, the financing problem shouldbe solved. This is in fact the task of a distributor, who should order the production,asses series-size and price, organize delivery and service, and distribute information.In case of a small potential market, commercial eagerness will perhaps have to besupplemented by social zeal. Needless to say that testing, development, production anddistribution need efficient coordination, which of course is rather timing consuming.
nature of the gap
The observation that a number of technical instruments do not pass the stage of a
laboratory prototype, can now be understood. The construction of a laboratory model
constitutes only a fraction of the work necessary for making a device generally avail
able. Moreover, the remaining work is of a much different nature, and falls outside
the walls and usually beyond the scope of most research institutes. What is needed are
strong contacts with the wider world of the handicapped involved, with producers andwith distributors. Also needed is an appropriate industrial competence for the development of a suitable prototype. This comes as no surprise to those involved in industrial
production. The problem is, in fact, that the drives which ordinarily lead to new
products, are much weaker if the number of possible "consumers" is small, their purchasing power restricted, and most importantly, their "market" difficult to reach.
In such a situation, there seems a pressing need for an initiative by the government,the industry or others, aimed at organizing professional activities of competent people
to this end, in order not to let the disabled being unnecessarily charged with extra

so
loads in our society based as it is on making profit through mass production. A frame
work should be created, within which devices can be constructed, tested, developed,produced, and distributed through smooth channels. Developments in other countriescan then be noticed early and followed up at short term, evaluated along existing path
ways, adapted to local circumstances, and, where necessary, accompanied by suitabletests and training. Grateful as one should be for the present initiatives and financialcontributions of individuals and organizations, a firmer base is necessary if handicappedpeople are to be served by technical aids to a degree acceptable for a human-directed,and wealthy society.
i.p.o. activities in 1972
TV-Magnifier 5-25 x
In the previous issue of the IPO Annual Progress Report, we described a laboratory
model of a Closed-Circuit Television set for enlarging print (Van Dun, Bouma and Alewijnse, 1971). Advantages of such a system over conventional optical magnifiers are a
higher magnification, a large field of view, sufficient brightness, acceptable image
quality, and uncritical eye position. Early in 1972, we established contacts with institutes for low-vision people and during 1972 a prototype was tested in three of these
institutes for periods of 2 - 4 weeks. Reactions were generally favourable. In April,we had the good fortune of coming into contact with a possible producer and a possibledistributor. Starting in May, we had regular meetings with them. In the same month,an industrial prototype incorporating as many suggestions from users as possible,
was constructed in our workshop.
In particular, controls were much simplified, dimensions optimized, sturdiness increasedand less expensive materials used. In early summer, production of a first series of 10TV Magnifiers started and in October the first production apparatus was finished.
In December, it was demonstrated at a meeting of Dutchophthalmologists and a press re
lease was issued. The apparatus is now commercially available in the Netherlands fromPhilips. (hg. 1,2).
On the basis of a questionnaire, we have now reports of over a hundred low-vision
people, most of them with visual acuity below 0.2. From this, we derive that the TVMagnifier is a useful aid in reading for the majority (80%) of people with acuity be
tween 0.015 - 0.15 or so, unless there are large deficits in the retinal center.For about 10 people it was a unique aid in a sense that they could read with theTV Magnifier only. These few may perhaps now shift from Braille to normal text.In case of very low acuity, a large 24" screen is to be preferred. Contrast reversal
was preferred by some 10%, relatively more often for ocular opacities than for retinaldiseases. A demand which we could not fulfil satisfactorily so far is a window throughwhich only one line of print would be visible, so as to eliminate confusion caused by
adjacent lines. So far we have not tested the usefulness for elderly people, but recentliterature suggests it to be a useful apparatus for them as well (Genensky et aI, 1972).As we learned in the course of the year an approach similar to ours had been taken
earlier by others, in particular by Genensky in USA and by the Heidelberg Clinique inGermany (Blankenagel and Jaeger, 1972).

S1
7
Fig. 1. (le:t) Final prototype ofTV Magnifier.
Fig. 2 (below) Scheme of TV Magnifierwith controls. Focussing occursthrough shifting the camera,magnification can be adjustedvia a motor-driven zoom objec-.tive.1) contrast reversal2) power switch3) mirror4) magnification5)· Focus6) x-y platform7) height platform.
••••••

52
As a test for knowing if a certain individual is helped by the apparatus, we follow
Sloan's advice (1972) to let her or him read highly enlarged print, letter height be
tween 10 and 50 mm. Next, a potential user should try the TV Magnifier at ease, using
his own type of text. For this purpose, we were visited by some 15 low vision people
during 1972.Governmentalsocial agencies have already provided financial provisions
in a number of instances.
relief drawing system
Basically this aid consists of a rubber-coated drawing board with special plastic
writing-sheets. The drawings immediately are embossed on the working side of the sheet
when writing with an ordinary ball-point with some pressure, so that no reversing is
required. This technique is not new, the American Foundation for the Blind mentioned
a "Raised line drawing Kit" in theircatalogue(Clark, 1963). We discovered however,
a better writing material with an imprinted texture, which did not stick to the fingers
sensing the drawings (Engel and Van den Ban, 1970).
This material was received rather enthusiastically. Thereafter,it was decided to im
prove the accompanying drawing board as well. The major applications of this drawing
board were thought to be:
- as an educational aid emphasizing abstract functioning e.g. to be used for drawing,
mathematics and geography;
- as a means for exchanging written messages between those with normal vision andpeople with visual impairments;
- as a computer programming aid, where flow charts can be illustrated with the helpof a regular Braille writer;
- as a scratch pad for the elderly blind who find it difficult to learn Braille.
Our prototype was outfitted with an easy to handle magnetic clamping frame as the sheets
should remain fixed during drawing. Tactile cm-divisions were made on the edges of the
board. Together with additional sheets, a T-square, a triangle and a ball-point, the
drawing board coule be accommodated in a regular A4-writing case.
During 1972 we contacted a number of institutes for visually impaired in the Nether
lands and tested the prototype at two primary schools for the blind, a rehabilitation
center for visually handicapped adults and at a library for the blind. Since their
responses were generally positive, a second prototype was constructed at the end of
1972 (see Fig. 3,4).
Improvements suggested during the testing have now been realized in this second proto
type of a more simplified construction. Negotiations on production and distribution
are presently in progress.
conclusion
In conclusion we propose that more emphasis be put on the pursuit of promising research
projects with suitable testing, development, production, and distribution. In 1972 we
have utilized our limited capacity for this type of work completely to these ends.
It is our opinion that modern technology should be deliberately organized for bridging
the gap between research efforts and available aids.

53
Fig. 3. Relief-drawing System, final prototype. A regular A4-writing case accommodates the drawing board together with additional writing-sheets, aT-square,a triangle and a ball-point.
Fig. 4. The easy to handle magnetic clamping frame. Owing to the tactile cm - divisions and a complemental provision in the T-square, this T-square can beshifted in discrete steps along the edges of the board.

54
references
Bach-y-Rita, P., Collins, C.C., Saunders, F.A., White, B. and Scadden, L. (1969)Visual Substitution by Tactile Image Projection, Nature 2.21, 963--964.
Blankenagel, A. and Jaeger, W. (1972) Erste Erfahrungen mit dem Fernseh-Lesegeratfur hochgradige Sehbehinderte, Klin MBL Augenheilk. 160, 723.
Brindley, G.S.and Lewin, W.S. (1968) The Sensations Produced by Electrical Stimulation of the Visual Cortex, J. Physiol 196, 479-493.
Clark, L.L. (ed.) (1963) Proc. Int. Congr. on Technology and Blindness !' catalogappendix, New York: ArneI'. Foundation for the Blind, 4-8.
Van Dun, J.J.A.M., Bouma, H. and Alewijnse, M.A. (1971) TV Magnifier as an Aid forReading, I.P.O. Annual Progress Report ~, 95-96.
Engel, F.L. and Van den Ban, M.A. (1970) New Relief Paper for the Blind, I.P.O.Annual Progress Report ~, 219-220.
Genensky, S.M., Petersen, H.E., Moskin, H.L., Clewet, R.W. and Yoshimura, R.I. (1972)Advances in Closed Circuit TV Systems for the Partially Sighted, Santa MonicaRand Corp. R-1040-HEW/RC.
Gray, P.G. and Todd, J.E. (1968) Mobility and Reading Habits of the Blind, London,Her Majesty's Stationary Office SS 386, 82.
Kay, L. (1963) Active Energy Radiating Systems; Ultra Sonic Guidance for the Blind,Proc. Int. Congr. on Technology and Blindness l, 137-156.
Linvill, J.G. and Bliss, J.C. (1966) A Direct Translation Reading Aid for the Blind,Proc. IEEE ~, 40-51.
Nye, P.W. and Bliss, J.C. (1970) Sensory Aids for the Blind: A Challenging Problemwith Lessons for the Future, Proc. IEEE ~, 1878-1898.
Sloan, L.L. (1972) Optical Magnification for Subnormal Vision - A Historical Survey,J. Opt. Soc. ArneI'. ~, 162.
Starkiewicz, W. and Kuliszewski, T. (1965) Progress Report on the ElectroftalmMobility Aid, Proc. Rotterdam Mobility Res. Conf., L.L. Clark (Ed.), New YorkAmerican Foundation for the Blind, 27-38.
Vredenbregt, J. and Noordermeer, W.H. (1967) The Treatment of Hemiplegic Patientsby Functional Stimulation of the Lateral Popliteal Nerve, I.P.O. Annual ProgressReport ~, 171-173.
Vredenbregt, J., Van den Ban, M.A. and Melotte, H.E.M. (1968) Functional Adaptationof an Electric Type-Writer to Motor Disabled Persons, I.P.O. Annual ProgressReport ~, 127-128.

55
CONSPICUITY AND COLOUR
F.L.Engel, H.G.Ligtenbarg and T.M.Bos
introduction
In general only a small fraction of what can be seen during an ttye fixation is actually perceived. Some objects attract attention and are consequently perceived, mostothers are overlooked unless attention is directed to them. So attention can be takento perform a certain selective task.The factors influencing selective attention can be divided into object and subjectfactors. We consider visual conspicuity to be an object factor, while, e.g. expectation can be conceived as a subject factor. In a previous paper (Engel, 1969) we proposed as a measure of conspicuity the size of the 50 called "Conspicuity Area", the
retinal field in which the object can be discovered from its background during asingle brief presentation. With structured backgrounds, advance information on objectlocation generally increases the retinal field in which it can be perceived.Therefore, peripheral visibility and conspicuity appeared to be linked by directedattention (Engel, 1970, 1971).Exploring object factors influencing the size of the conspicuity area, we reportedpreviously on the combined influence of size and luminance contrast of a test diskamong a number of mutually identical background disks (Engel and Bas, 1971).In these experiments no additivity was observed between the two factors. Dependingon their relative magnitude , one of the two factors appeared dominant. This contribution reports on the effect of colour on the size of the conspicuity area.
experimental
Experimentally it was convenient to use surface colour standards for the test disk,actually the chips of the Munsell Color System. In this system the samples are orderedsubjectively into uniformly graded series of hue, saturation (Munsell Chroma) andbrightness (Munsell Value). Fig. 1 shows the arrangement of chips and the Munsellnotation.
White
YELLOW
CHROMA-
5R RED
5BG
HUE
BLUE 5B
0/Black
Hlli
Fig.l. The Munsell Color System, specifying object colors on scale of Hue, Value(brig~tness) and Chroma (saturation). The Hue scale contains 5 principaland 5 intermediate hues, the Value scale contains 10 steps from black towhite and the Chroma scale shows up to 16 steps from the equivalent grey.
/PO annual progress report 7 /972

56
The background of the test disk was a black sheet measuring 92 x 62 cm (brightness:
Munsell Value 2.5) with randomly located identical white disks of 5 mm in dia(brightness: Munsell Value 9.5).The minimum center to center distance between the latter was 7.5 mm. One of the disks represented the test disk by inserting the relevantMunsell chip. Fig. 2 gives an impression of this test-disk/background combination.
I®
The test field containingthe test disk and part
(40 x 50 cm) of the background was presented tachistoscopically to theobserver by means of asemi-reflecting mirrorfor 100 ms, see Fig. 3.
The test disk could be
located at any point in
the test field by movingthe test-disk/backgroundcombination.The luminance of the back
ground disks as measured
through the semi-reflec
ting mirror corresponded
with 2.9 cd/m 2 , while the
black background part
equalled 0.3 cd/m2 .
The colour temperature of
the tachistoscopic illu
mination, again Qeasured
through the semi-reflec
ting mirror, was 3100 0 K,which is somewhat higher
than that of the C.I.E.standard source A
(2854°K).The luminance of the rest
2field (0.65 cd/m ), pre-
sented for the purpose of
adaptation when no test
field was shown, corres
ponded with the average
luminance of this field.
A viewing distance of 47
cm was maintained by means
of a head rest, which simultaneously occluded theleft eye of the observer.ConseqJently, the diameterof the 5-mm disks corres
ponded with 0.6 0 visualangle, while the size of
the test field equalled~
• ••• •••
•
•• 1° •.• • VI~GLE •
• •••••••• • •
• •••• • •••• •••.. '
• •••• •• • ••••• • • •• ••
1 ) Test field 4 ) Light projector
2 ) Semi-reflecting mirror 5 ) Torque magnet shutter
3 ) Grey filter with 6 ) Observer's right eye
declining transmission 7 ) Rest fi e:Cd
Fig. 2. The test-disk/background combination used inthe experiments. The actual size of the blackfield was 92 x 62 em, containing about 4000white 5-mm background disks and one test disk(grey in this figure).
Fig. 3. Outline of the tachistoscopic apparatus. A neutral filter with declining transmission, providedfor homogeneous illumination (within 8% of thecentral value) of the test field. Either thetest field or the rest field was visible at atime.

57
The procedure corresponded to previously described conspicuity area experiments (e.g.
Engel and Bos, 1971). The observer was informed in advance about the test-disk proper
ties and had to discover it in a single trial. In the centre o£ the tachistoscope
field, in front of the observer's right eye, a fixation spot was provided. When ready
while fixating this spot, the observer controlled the moment of e~posure. When he dis
covered the test disk, he indicated its location as a check. A training session pre
ceded each area determination. In some instances the observer was also asked to men
tion the perceived chromaticity of the test disk. The size of the conspicuity area
was expressed by R, the mean eccentricity of the border in 8 directions (horizontal,
vertical and diagonal).
The results to be presented were obtained from the observers T.B. and H.L. Both had
adequate visual acuity and colour vision. No spectacles were worn and no artificialpupil was used.
influence of brightmtSS
First of all we determined the conspicuity areas as a function of the brightness
(Munsell Value) of the test disk with the achromatic chips of the Munsell Color
System. These chips divide the brightness scale into 10 subjectively equal intervals
from black (Munsell Value: 0) to white (Munsell Value: 10), see Fig. 1.
The results obtained are plotted in Fig. 4. The results of the two observers agreed
well. Self-evidently, the size of the conspicuity areas became zero when the bright
ness of the test disk equalled either that of the background disks or that of the
black area. The size of the conspicuity area appeared to be maximum at MunsellValue 5.
6
R
[d~grees] 100vIsualangle 8
I Valueblackarea
\\\~
Valuewhitedisks
2
oo 2 '" 6 8 10
- brightness [ Munsell Value]
Fig. 4. Size R of the conspicuity area as a function of bright
ness of the test disk, using the achromatic chips of the
Munsell Color System.
observer T.B.
observer B.L.
I standard deviation
influence of chromaticity
Fig. 5 represents, for several hues and 3 brightnesses of the test disk, the size of
the conspicuity area as a function of saturation (Munsell Chroma). As the results of
the two observers agreed reasonably well, only the averages are presented here.

58
12 12 12_A_A-~RS
A-A_Ii< .A_A /SR7 V A- A- A.---.._.
..........8 V /. 8 . /. 8 'x.~-_.-- '.j.-. '--A .-+ 5G• SR SY .//.5R8
4 4
R4 ........./. /
[degreeS1 0vIsual 0 0angle 0 4 8 12 0 4 8 12 0 4 8 12
12A/"
12 12
/.-. ... --A-A ---...- ...- ..-.- ./ .-- .--.
8 _.8 -.~
8 ---.------.../. 58 ./ 5YR SGY
4/.
4 .t 4 --.-.0 0 0
0 4 8 12 0 4 8 12 0 8 12
12 12
--..- ....- ... A-A._A----- --.......- ........-8 8 .-----.--'
/. S8G 5P
4 4 _.--.-.0 0
0 4 8 12 0 4 8 12
Saturation [Munsell Chroma]
Fig. 5. Influence of saturation of the chromatic test disk for several hues and3 brightnesses (Munsell Value 5 = ., 7 = ., 8 =.) on the size R of theconspicuity area. The plotted points represent averaged results of theobservers T.B. and H.L.
At Munsell Value 3 no reliable conspicuity areas could be obtained ?ecause the chro
maticy of the test disk was hardly perceivable. At Munsell Value 5, where R (V) is
maximum (see Fig. 4), the influence of colour appeared to be small. Only with the
Munsell Hues 5B, 5R and SG, did R increase somewhat with saturation. At MunsellValues 7 and 8, where brightness contrast relative to the background disks is less,
the effect of saturation on R is more pronounced. At Munsell Value 9 the available
number of chromatic chips was too small to produce significant results.
The saturation steps (Munsell Chroma), which in foveal presentation are subjectively
equal for all ;lues, were not equally effective in eccentric vision. The saturation
steps in Munsell Hues SB and SR yielded larger increases in conspicuity area than,
e.g. SP and 5GY. This corresponded with the less saturated colour perception expe
rienced with 5P and 5 GY with increasing eccentricity. The hues SB and SR remaindedchromatic practically up to the borders of the conspicuity area, while SP and SGYdid not. Slight changes in hue were also perceived with increasing eccentricity;
red, for instance, became yellowish.To explore the desaturation effect more closely, retinal fields were also determinedin which the observer perceived the test disk as coloured. Fig. 6 gives the size ofthese fields for the principal Munsell Hues SR, SY, SG, and 5B, again averaged overboth observers.

59
12 12Fig. 6. Size of the retinal
~~ .---a:;;.1field at Value 5, in
R which the test disk~~r ._
perceived col-.~_.r ./ was as
[degrees]8 '.~ .-. 8 ,.... ....-- ...? oured Ce) and the cor-
visual / • responding conspicuityangle • 5R5 / 5Y5 area C-) • The plotted
4 4 p6ints represent aver-0 aged results of the
/ observers T. B. and H. L.
0 0 The borders of the retinal0 4 8 12 0 4 8 12
fields in Fig. where6, colour12 12 perceived, diffi-
~1?could be were
............---. cult to establish and, according-8 ' • __e
8 ly, relatively inaccurate....... ' ..// 5G5 585 The results give nevertheless
4 4 • an indication of the influence
• of perceived chromaticity on R./
0 00 4 8 12 0 4 8 12
I Saturation [Munsell Chroma]
interpretation
For achromatic test disks (Fig. 4) the conspicuity areas are mainly based on two dif
ferent luminance contrasts, viz. relative to the white background disks and relativeto the black area of the background. With luminance on a logarithmic scale, a symmetric function can be obtained (Fig. 7), in line with previous results of Engel andBos (1971).
luminancewhitedisks
20.50.2o
0.1
2
5 10
-Luminance [cC¥m2]
Fig. 7. Size R of the conspicuity area as a function ofthe test-disk luminance on a logarithmic scale,using the achromatic chips.

60
The colorimetric specifications of the Munsell chips are known under several illuminants including tungsten light (Nickerson and Wilson, 1950). The chips provide nearlyuniform interval scales under day light illumination. Applying tungsten light, as wedid, the resultant colour shifts are relatively small (Judd, 1956), becausethecolorimetric
shifts are largely counteracted by chromatic adaptation. No simple relation exists,however, between the colorimetric specification of the chips and the subjective colourattributes hue and saturation. We therefore preferred to express our results in theindependent variables of the Munsell Color System.
The interaction between contrast in brightness and in saturation of the test diskrelative to the background disks is in principle additive since R = 0 only when bothcontrasts are zero. As a first approximation we assume here that a logical summationapplies: R (V,C) = R (V) ® R (C).This means that the variable leading to the largest conspicuity area determines R (V,C),i.e. the size R of the conspicuity area as a function of Munsell Value (V) and Chroma(C). This suggests the possibility of selection between the two factors in the visual
12
5GY
8o
o
8 .-. - •.
12
12
12
12
5P
8
8
8
--.
o
.4
o
12
8
.4
,,0
0 .4
12
8
.4
00 .4
12
12
12
12
58
58G
8
8
8
system.
12
8
R .4
r~'''Jvisual 0angle 0 4
12
8
.4 ,•
00 .4
12 _.8
.4
00 .4
-------.~ Saturation [Munsell Chroma]
Fig. 8. Th: experimental data of Fig. 5 approximated by R (V,C) = R (V) @ R (C)belng a hue dependent logarithmic function.
In Fig. 8 the logical summation has been applied, using the data of Fig. 4 for R (V).
In Fig. 8 we assumed R (C) to be a function of log C, with a hue-dependent weightingfactor, see also Table I. The weighting factors were determined by straight-linefitting of the R (V,C) data as a function of log C.

61
No precise weighting factors could be determined for 5 GY
and 5P, because for these colours no influence of saturation was found. As a cross-validation, the functionsfor R (C) in Table I appeared also to apply to the datain Fig. 6, which shows the retinal fields in which the testdisk appeared coloured (see Fig. 9). The fit of thesedata is reasonably accurate.
-Hue R (C)
5B 13 log C
5G 11 log C
5YR 11 log C
5R 11 log C
5Y 8 log C
( 5BG) (13 log C)Table I. Approximations of R (C) applied in Fig. 8.
The weighting factors reflect, for example,thatblue (5B) was a more conspicuous colour in ourexperiments than e.g. yellow (5Y). Owing to thesmall ~umber of 5BG samples, the correspondingweighting factor is inaccurate.
8 12
1284oo
12 Fig. g. Comparison of the reti-nal fields in which thetest disk was perceived
8 /e as coloured, with thelogarithmic approxima-
r 5Y tions of Ii: (C) appliedin Fig. 8 •
4
00 4 8 12
12
8
58
4
12
5G
5R
8
12
R[de
greej8vl$ual
angle
.(
00 .(
12
8
4
~0
0 4
______•• Saturation [Munsell Chromo]
discussion
The luminances applied were rather low (between 3 and 0.3 cd/m2) , nevertheless suffi
cient for photopic vision. For instance, Smith - Kinney (1958) established at as low
as 0.03 cd/m2 a regular foveal photopic luminosity curve, while at an eccentricityof 10 0 visual angle the shift from scotopic vision (with a peak-sensitivity near 510n.m.) towards photopic vision (with a peak sensitivity near 540 n.m.) had been completed at 0.3 cd/m2 . In spite of this shift the periphery remains still more sensitive to the short and less sensitive to the long wave lenths than the fovea.According to Weale (1953) this difference still exists at 300 cd/m 2 •
Since his spectral sensitivity curves, determined at several eccentricities, remainedpractically unchanged between about 5 and 300 cd/m2 , it is expected that our resultsalso apply at higher luminance levels.With respect to the conspicuity areas, blue, green, and red (orange) were the mosteffective hues.
Weale (1953) also demonstrated relatively higher sensitivity to these colours ineccentric vision. In line with our experiences with pigment colours, he reportel,

62
even for monochromatic lights, hue changes and desaturation effects with increasing
eccentricity of presentation.
summary
Explorative results have been obtained concerning the conspicuity of coloured test
disks among white background disks. The size of the conspicuity area was taken as
a measure for this porperty.
The results indicate that:
When brightness contrast of the test disk relative to the background of white disks
on a black surface is chosen optimally (viz. mid"grey, Munsell Value 5), the in
fluence of test disk colour is slight. The colour influence is more pronounced when
brightness contrast is low.
Although the Munsell Chroma steps are subjectively equal for all hues in direct
vision, their effectivity is different with respect to the size of the conspicuity
area. Relatively most effective are blue, red (orange) and green, while no effect
at all has been established for purple and yellow-green.
The experimental data are interpreted in terms of a feature selection model.
references
Engel, F.L. (1969) In Search of Conspicuity; Att~mpts to Measure and ComprehendVisual Conspicuity, I.P.O.Annual Progress Report ~' 89-95.
Engel, F.L. (1970) Visual Conspicuity and Directed Attention, I.P.O. Annual ProgressReport 2, 123-128.
Engel, F.L. (1971) Visual Conspicuity, Directed Attention and Retinal Locus; VisionResearch ll, 563-576.
Engel, F.L. and Bos, T.M. (1971) Size and Luminance Contrast in Visual Conspicuity,I.P.O. Annual Progress Report ~' 45-49.
Judd, D.B. (1965) Color Appearance, die Farbe ~' 2-26.
Nickerson, D. and Wilson, D.H. (1950) Munsell Reference Color now Specified for nineIlliminants, III. Eng. ~' 507-517.
Smith-Kinney, J.A. (1958) Comparison of Scotopic, Mesopic and Photopic SpectralSensitivity Curves, J.Opt.Soc.Amer. ~' 185-190.
Weale R.A. (1953) Spectral Sensitivity and Wave Length Discrimination of the Peripheral Retina, J.Physiol. 119, 170-190.

63
REFLECTION PROBLEMS OF A PASSIVE LX DISPLAY PROVIDEDWITH A FLAT MIRROR
H.Bouma and A.L.M. van Rens
A passive display offers the advantage of beingvisible under almost any prevailing illuminationwithout special lamps, just as, for example,this text. However, the mirror behind the LXlayer superimposes part of the outside worldon the symbols displayed, and makes the valueof the contrast and even its sign, dependenton circumstances as accidental as room illumination, wall reflection, window position andsunshine. We describe here a shield which pre
vents the reflection from degrading the contrast.
For ensuring legibility, all light reflectedby the mirror towards the eye should originateeither from the symbols or from a black surface,and under no circumstances from the outsideworld. Of course the black surface shields thedisplay from being visible from certain directions. Design should be such thata) the angle under which the display is visible (display angle) is large and the angleshielded from view small.
Fig. 1. Relative positions of reflecting displayand screen.a) the most backward part of the screenshould send its rays in horizontal direction after reflection.b) the front edge of the screen shoulddo the same at the highest viewing angleB. However, the situation as drawn permits a roughly perpendicular viewing direction with uncontrolled light reflection.c) by relocating of the front edge topoint C, perpendibular viewing directionsare shielded from view.d) combination of a and c in one figure.For a = 70 0
, B = 50°.
LX-display
screen
forbidden viewingdirection
la
lc
lb
In a passive liquid crystal (LX) display, application of a certain voltage causesa local separation in a thin LX layer. At these positions, ligh~ from outside sources is now scattered, mainly in forward directions. For sufficient contrast, it is
necessary that the eyes receive these forwardly scattered rays. This can be realizedeither by illumination of the transparent display from the back (transillumination),or by illumination from the front if the light is reflected by a mirror immediately
behind the LX layer. The LX layer will now bepassed twice. We restrict this contributionto the reflecting LX display provided with aflat mirror.
ld
IPO annual progress report 7 1972

64
b) within the display angle, no part of the outside world is reflected towards theeye.
A solution is depicted in Fig. la - d. LX is the reflecting display with height a,at an angle a with the vertical. If the lowest viewing direction is the horizontal,the most backward part of the screen should produce the rays in horizontal direction(Fig. la). At the highest viewing direction, at an angle a with the horizontal, thefront part of the screen should produce the reflected rays (Fig. lb). However, thearrow in Fig. lb indicates that the observer can look at the display from an anglelarger than S and then he will see part of the outside world superimposed on thesymbols. This is not conform the second reQuirement, and, consequently, it should beprevented that the display can be viewed from angles larger than S, i.e. from directions perpendicular to the display. Therefore, we shift the front part of the screento point C (Fig. lc). The front part of the screen should therefore be located atthe intersection of the direct ray from the upper edge of the display and the reflected ray from the lower edge, both at viewing directions closest to perpendicular.In fact, C is located right above the display center at a height h = !a cotg (a-a).Fig. ld combines Figs. la and lc for a = 70 0
, S = 55 0• If a = 20 mm. C is loca-
ted at a distance of h = 38 mm from the screen centre.
Since the display cannot be viewed from perpendicular directions, the symbols appearlower, by a factor cos (a - y) if y is the viewing direction. This can be compensatedby a corresponding increase of actual symbol height at constant symbol width.For a = 70 0 and y = 40 0
, height should increase by 15%. The front edge of the screenshould have the indicated position C. The back edge should intercept the indicatedrays (Fig. la). Otherwise, there are no reflection requirements and sufficient freedom is left for a handsome design. The space between LX display and screen should beused for a suitable background.
permitted
111 light
~==:f~=-
If a large display angle is not a requirement, light may well enter from above(Fig. 2 : a = 30 0
, S = 20 0).
In case the display can be given a slightly concave form, a smaller screen will do.
We have tried out the solutions of Figs. 1and 2, in a laboraty set-up* and foundsatisfactory legibility under a wide varietyof outside illuminations. We could alwaysmaintain a luminance ratio between displayedsymbols and background of a factor of 10.
Fig. 2. If only a small viewing angle is needed, illumination may come from behind
the screen. a = 30°, a = 20°.
*The LX display was provided by Messrs Engelman and van Houten (Philips Research
Laboratorie;s).
65
PREFERRED VIEWING DISTANCE AND SIZE OF THE TV PICTURE
J.J.Andriessen
introduction
Viewing distance is an important parameter in watching television or judging tele
vision picture quality. Literature often relates viewing distance to the visualangle of a separate line of the TV frame. With a sufficiently large viewing distance, the line structure of the picture is no longer visible on account of thelimited resolution of the eye (Bodeker, 1962). At large viewing distances, however, the presented pictures are small, which is usually considered to be a dis-
advantage.A question hardly discussed in literature is whether the common viewer perhaps hasa subjective preference for a definite viewing distance. The viewer is perhaps notso critical as to the line structure being visible, in favour of a somewhat largerpicture. The question of th~ preferred viewing distance in watching television hasbeen investigated in the following for a number of picture sizes.
method
Experiments were carried out with 7 (monochrome) TV monitors of different size(62S-lines). The height of the pictures varied between about 8 cm and 41 cm. Sometimes the diagonal of the picture is used. With the usual height-width ratio of
3a : 4a, the diagonal is Sa.The TV monitors were lined up before a homogeneously illuminated background. Thecentres of the picture tubes were at eye-height of the seated subject. During eachsession only one TV monitor was visible at a time. The 7 TV monitors were presentedin random order. They were so adjusted that their pictures were of correspondingluminances and contrasts. The luminances were between about 1 cd/m2 ("black") and50 cd/m2 ("white"). The luminance of the background was 5 cd/m2. These luminancesagree well both with the usual values in domestic television viewing and those asapplied in experiments on picture quality (Balder, 1957; Grosskopf, 1966; Prosseret al., 1964). The TV pictures were of five different types, including movingscenes ("Film"), stationary scenes ("Static") and lettertexts.The lettertexts were of two types, viz. periodical text printed in Mercator 10 andTV display letters according to a design of Bouma and Van Rens (1971).All letters were in lower case, except for a few initial letters of sentences in theperiodical text. The short letters (for instance a, 0, etc.) had a height of 5 linesof the TV frame. The pictures were recorded on a video tape recorder under identical
conditions. Hence it was possible to present the pictures reproducibly to the subjects. The order of presentation was always the same. The subject was seated on awheel-chair for an easy adjustment of the preferred viewing distance.The distance between the picture tube and the subject's eye, the viewing distance,was measured with an accuracy of 2 cm.The experiments were carried out by 30 subjects, aged between 20 and 55 years.No television experts were among them. The subjects wore their spectacles, if necessary.
results
The results have been averaged over the 30 subjects. For each picture size, it appeared that no significant difference in viewing distance existed for the situation"Film" and "Static".
IPO annual progress report 7 /972

66
Neither was there a substantial difference between the results of the two experiments on lettertexts. As a result of this the experimental results of picture type"Film" and "Static" were pooled, just like those for the lettertexts.Abbreviated as results on "Picture" and on "Text".
CM*=9,5
/ PICTUREw 300uZ TEXT~
5<.'~~ 200w:>
+./,-
t,/> 100 ~;r
,-,-
10 20 30 40 50 CM- H PICTURE HEIGHT
Fig. 1. Preferred viewing distance as a function of picture height of 7 TV monitors,
for two main types of pictures denoted as "Picture" and "Text".
Vertical bars indicate 95% confidence levels.
In Fig. 1 the average of the preferred viewing distance V is plotted as a functionof the picture height H of the applied TV monitor, for both "Picture" and "Text".With vertical bars, 95% confidence levels have been indicated. It appears from Fig.1that a linear relationship exists between viewing distance V and picture height H,both for "Pi~ture" and for "Text". The standard deviation of the preferred viewingdistances turns out to be relatively low. Mathematically, the relationship for"Picture" can be described with (V and H in em):
V
For "Text" holds: V
discussion
6.75 H + 40
6.75 H
From a quantitative point of view the relationships found agree fairly well withliterature. In C.C.I.R. report 405 - 1 (1970) a summary is given of viewing conditions for the subjective judgment of TV picture quality. The ratio viewing distance over picture height is recommended here as between 6 and 8, for so-callednon-experts. Experts choose somewhat smaller distances. Jesty (1958) mentions6 times the picture height as the preferred viewing distance, for TV pictures of3 - 7 MHz bandwidth.

67
From the present experimental results the "viewing angle" can be determined, i.e. thevisual angle of the TV picture, based on its height. The viewing angles appear to bebetween 5 and 7.5 degrees for the situation "Picture" and between 7 and 10 degreesfor the situation "Text". These viewing angles are somewhat smaller than those foundin the experiments on the preferred viewing conditions of projected Rontgenograms,which came out at about 12 degrees (Andriessen and Bouma, 1971). ~he main reason forthe larger viewing distances with TV pictures might be their disturbing line structure. As in the experiments of Jesty (1958) with pictures of low bandwidth « 3 MHz),the subjects choose larger viewing distances for acceptable pictures.Yet, on being asked, our subjects generally choose viewing distances at which they~robably still could perceive something of the line structure of ~he TV pictures.From the experiments of Bodeker (1962) it appears that the ratio H has to be about9.5 at a minimum for the line structure to be below the visual acuity threshold.
The viewing conditions during his experiments are well comparable with ours.
The line for ~ = 9.5 is shown in Fig. 1.So in choosing the preferred viewing distance with TV pictures a compromise was madebetween" a scanty visibility of the line structure" on the one hand and,for instance,"a picture as large as appears optimal", or "legible text" on the other.In the experiments on "Text" viewing distances were chosen which were somewhat smaller than those found in the experiments on "Picture", probably because of the smallheight of the letters in the used text. At the preferred viewing distances a shortletter subtends about 5 minutes of arc, roughly the threshold at which text can b~
read.
summary
This article deals with the preferred viewing distance of monochrome TV pictures.Experiments were carried out with 7 different monitor types, the height of the TVpictures ranging between 8 cm and 41 cm. Different types of pictures were used,including moving scenes, stationary scenes and lettertexts. Thirty subjects took partin the experiments.The preferred viewing distance turns out to be roughly 7 times the picture height.Generally, it appears that the preferred viewing distance is a compromise betweena distance at which some of the line structure of the TV picture still can be perceived and a distance at which a picture as large as appears optimal can be watched.In the case of text the preferred viewing distance appears to be somewhat smaller,probably as a result of the relatively small letter height.
references
Andriessen, J.J. and Bouma, H. (1971) Visual Ergonomics in Viewing 70-mm Rontgenograms,I.P.O. Annual Progress Report ~, 89-91.
Balder, J.J. (1957) Illuminated Borders to Picture Screens, Light and Lighting 50,245-250. -
Bouma, H. and Van Rens, A.L.M. (1971) Completion of an Alpha-Numeric Matrix Displaywith Lower-Case Letters, I.P.O. Annual Progress Report ~, 91-95.
Bodeker, H. (1962) Zur Frage des Gunstigsten Betrachtungsabstandes beim Fernsehen,Elektronische Rundschau ~, 464-465.
C.C.I.R. Report 405-1 (1970) International Radio Consultative Committee, Xllth PlenaryAssembly, New Delhi.
Grosskopf, H. (1955) Experimentelle Analyse der Halbton-Wiedergabe im Fernsehen, Rundfunktechn. Mitteilungen ~, 226-246.
Jesty, L.C. (1958) The Relation between Picture Size, Viewing Distance and PictureQuality, The Institution of Elec. Eng., 425-434.
Prosser, R.D. Allnatt, J.W. and Lewis, N.W. (1964) Quality Grading of Impaired Television Pictures, Proc. lEE 111, 491-502.

i
68
ON THE OPTIMAL LUMINANCE TRANSFER FUNCTION IN TELEVISION
J.J.Andriessen
introduction
In television the luminance transfer function is defined as the relationship betweenthe luminances in the scene to be transmitted and the luminances of corresponding
points in the TV picture. In designing the camera and monitor (receiver) system alinear relationship for a wide range of luminances is aimed at. Hence the luminance
transfer function is a straight line with a given slope (Fig. 1).The coefficient of slope is defined as y tan a.One would assume the most logical value to be y = 1, i.e.
the luminance relations in the scene are reproduced identically on the TV picture tube. There are a few aspectsof watching television necessitating a somewhat largervalue of y. One important factor is the relatively small
luminance range attainable on the picture tube. Anotherimportant factor is the fact that watching televisionoften occurs at night with a relatively low surround
luminance.In the following these aspects will be discussed brieflyon the basis of literature. The discussions are only re
lated to stationary pictures.
-logL SCENE Fig. 1. The relationship between the luminance in the
TV picture and that in the scene.
monochrome television
In a number of publications the value of y is discussed. Grosskopf (1963) states
that a 1 : 1 relative luminance transfer of the "middle greys" is essential in order
to get optimal TV pictures. So for this range of luminances y = 1. His TV pictureswere watched within a light surround of, on the average, equal luminances as that
in the picture. Bartleson and Breneman (1967a, b) concluded from their experimentsthat y~1.2 for TV pictures watched in a relatively dark surround. Indeed, a y > 1seems to be plausible because of the fact that the luminances on the picture tubegenerally will be lower than that in the original scene. As a result of this, some1055 of brightness contrast can result. This 1055 of contrast can be compensatedby a higher luminance contrast on the picture tube, achieved with a y > 1.
luminance level of the surround
Grosskopf (1963, 1966) and Bartleson and Breneman (1967a, b) discuss the influenceof the luminance level of the surround to the picture tube. The luminance of thesurround is an important factor, because the state of adapt ion of the retina islargely influenced by it. The state of adaption of the retina has significantconsequences for the brightness perception of details on the picture tube. From theexperiments of Bartleson and Breneman (1967a) it appears that the brightness estimates of image points in photographic reproductions with a light surround follow asteeper function than those with photographic reproductions in a dark surround.The experiments of Jameson and Hurvich (1961) show corresponding results.
/PO annual progress report 7 /972

69
Here, the subject had to adjust the luminance of a matching field in order to match
the brightness of a testfield the surround of which could have a number of luminancelevels. At a high level of surround luminance the adjusted matching field luminancesfollowed a steeper function than at a low level of surround luminance. Consequently,
watching television with a dark surround requires a larger value of y than with alight surround to compensate for the then resulting limited contrast range.A value of y ~ 1.2 as found by Bartleson and Breneman (1967 a, b) is certainly accept
able. For TV pictures with a light surround y ~ 1 may be sufficient. An important con
dition is here that the optical density of the monitor screen is such that incident
light scarcely affects the luminance contrast in the picture (Grosskopf, 1963; 1966).
colour television
In colour television perception problems are still slightly more complex. As a result
of the generally somewhat lesser sharpness of colour pictures compared with that of
monochrome pictures, the brightness contrasts appeared to be lower (Bartleson, 1968).Secondly, the maximum luminance which can be realised on the picture tube is smaller
than that of the monochrome picture tube, which may involve some loss of brightnesscontrast. In order to counterbalance these aspects the value of y for colour television should be somewhat larger than that for monochrome television. A value of
y ~ 1.3 appears to satisfy (Wood and Sproson, 1971).An essential point here is the similarity of the three colour channels with respectto luminance output. Any dissimilarity will be particularly of influence in the lowerrange of luminances with the effect of a more or less colouring of the dark greys(Grosskopf, 1967).
summary
The luminance transfer function of a television system is generally represented by
a straight line in a log-log plot of luminance in the original scene and luminanceon the picture tube. The coefficient of slope is y. The value of y is discussed on
the basis of literature. An important parameter appeared to be t~E luminance of thesurround to the picture tube. For monochrome television and a Qim surround y ~ 1.2.For colour television y has to be somewhat larger, y ~ 1.3 seems satisfactory.
references
Bartleson, C.J. (1968) Color Perception and Color Television, Journal of the SMPTE7.2, 1-11-
Bartleson, C. J. and Breneman, E. J. (1967 a) Brightness Perception in Complex Fields,J.O.S.A. ~' 953-957.
Bartleson, C.J. and Breneman, E.J. (1967 b) Brightness Reproduction in the Photographic Process, Photcgraphic Science and Engineering 11, 254-262.
Grosskopf, H. (1963) Richtwerte zur Einstellung optimaler Bedingungen fur die Betrachtung von Fernsehbildern, NTZ, Heft !, 35-39.
Grosskopf, H. (1966) Experimentelle Analyse der Halbtonwiedergabe im Fernsehen, Rundfunktechn. Mitteilungen lQ, 226-246.
Grosskopf, H. (1967) Vergleich der Elektro-Optischen Ubertragungseigenschaften beiSChwarzweiss und Farbe. Rundfunktechn. Mitteilungen !!, 286-294.
Jameson, D. and Hurvich, L.M. (1961) Complexities of Perceived Brightness, Science 133,174-179.
Wood, C.B.B. and Sproson, W.N. (1971) The Choice of Primary Colours for Colour Television, BBC Engineering ~' 19-36.

4 PERCEPTUAL AND MOTOR SKILLS

71
PERCEPTUAL AND MOTOR SKILLS
W.G.Koster
perceptual and motor behaviour
The studies on stereotyped responses as described earlier (Van Nes, 1970) have been
continued, and several aspects have been investigated, viz. (a) Learning, by mea
suring reaction times and error score, (b) retention after two years, (c) influence
of emphasizing response speed or error score, and (d) effect of order of learningone code and its reverse with various degrees of stimulus - response compatibilities
(Van Nes and Van Schuur, this issue).
In a previous issue the effect of advance information in a visual synchronisation
task (Koster and Boonstra, 1971) was studied. These studies have been extended toauditive stimuli. Two ways of presenting advance information have been tested, viz.,
a continuously increasing signal intensity that suddenly returns to its original
value and then increases again, and the same procedure carried out with the pitchof the signal. These continuous ways of presenting advance information failed because
they were very awkward for the subjects. Only a discrete way of presenting advanceinformation appeared to be successful. Before the presentation of the stimulus tosynchronize with, three weak and short signals were given with equidistant time intervals. The intervals I between the stimuli were varied (240, 480, 720, 960, 1440and 1920 ms) as well as the intervals between the advance information signals ( 60,120, 240, and 480 ms). As a control no advance information was provided. As with thevisual signals, the help of advance information was greatest with maximum I. For I
greater than 480 ms the best results were obtained with Iii = 4, i.e. the total interval is subdivided into four equal parts. As the best performance is obtained at
I = 480 ms, a value of i = 480 ms will probably be the optimum value for interstimulus intervals greater than 2 seconds.
The studies on handwriting have been hampered by lack of an automatic device for
analyzing displacement-time curves. A computer programme on the P 9202 computer
which makes such an analysis possible, is nearly ready. In the mean time the study
of writing-errors, as reported in the previous issue (Van Nes, 1971) has been con
tinued by determining error frequencies for various letters of a written word andby making a comparative analysis of typing errors.
medical physics
In a previous volume (Rau and Vredenbregt, 1970) studies on the M. biceps have been
reported relating the EMG of the muscle to the force and the endurance time. As such
measurements might have interesting applications, the studies have been extended to
the back muscles (Vredenbregt, this issue).
The development of a tremometer as described two years ago, has been the impetus forsome basic studies on tr'emor (Rau and Vreden1:iregt, 1971).
These have been continued, and extended to pathological tremor (Koster and Van Schuur,this issue).
In 1966 Schouten and Koster reported about high-frequency analysis (100-1000 Hz) of
electrocardiographic (ECG) signals. In a more extended study, some years later, the
ECG signals of a group of healthy subjects were compared with those of a group ofpatients with a myocardial infarction. No clear difference could be established.The ECG signals were picked up at the extremities. As the choice of the leads may
IPO annual progress report 7 /972

72
influence the high frequency components in the ECG, a new experiment was carried out.
Three groups of eight subjects each participated.
(1) Patients with a myocardial infarction. The mean age of the group was about 60
years.
(2) Subjects of the same age without any diagnostic indication of an infarction.
(3) A control group of subjects of about 25 years without any diagnostic indication
of an infarction.
Again no clear differences in high-frequency activity could be established.At the request of the Medical Systems Division of Philips an appliance has been de
veloped and tested. On the basis of the actual heart rate of the subject, it enables
information on the task performance to be fed back to the subject. This can be
achieved either through an indication of the required speed of task performance, or,
more directly ,by altering the load of the task as a function of the heart rate. Such
a device can be used for training cardiac patients (Van Schuur and ~urema, this issue).
ergonomics
A highly importan fact in the ergonomics practice is the moment within the develop
ment of a product or system at which the ergonomist is consulted We have experi
enced that in an increasing number of cases the ergonomists of the IPO have been
consulted at a very early stage of development. This is especially true for profes
sional equipment and systems. Examples are the videophone project, telephone keying,
and medical systems.
In the videophone project important contributions have been made tG the trial network
and its evaluation.
In behalf of the International Consulting Committe on Telegraphy and Telephony
experiments have been carried out in various countries to study the effect of an addi
tional column of four keys (for data transmission or facilities) next to the existing
three columns of four keys each. In the Netherlands these experiments have been
performed at the IPO and at the Netherlands PTT administration. The performance in
keying conventional telephone numbers appears to be not adversely influenced by the
four additional keys.
In 1972 a co-operation was established between the Medical Systems Division of
Philips and the ergonomics team of the IPO. Studies have been made in co-operation
with designers and clients. A simple technique that proved very useful is video
recording. In a hospital a recording is made of a system in operation. Comparison
of the recordings of several existing systems often reveals various undesirable
situations. This knowledge is used in the development of new systems.
references
Koster, W.G. and Boonstra, P.B.W. (1971) On the Effect of Advance-Information in aSynchronisation Task, I.F.O. Annual Progress Report ~, 58-72.
Nes, F.L. van (1971) Errors in the Motor Programme for Handwriting, I.P.O. AnnualProgress Report ~, 51-53.
Nes, F.L. van (1970) On learning Stereotyped Responses, I.P.O. Annual ProgressReport ~, 154-157.
Rau, G..and Vredenbregt, J. (1970) The Electromyogram and the force during StaticMuscular Contractions, I.P.O. Annual Progress Report ~, 174-178.
Rau, G. and Vredenbregt, J. (1971) Finger Tremor and Electromyographic Activity,I.P.O. Annual Progress Report ~, 81-85.
Schouten, J. F. and Koster, W.G. (1955) Electrocardiography, I.P.O. Annual ProgressReport 1, 101-102.
Schuur, R. van and Burema, Th. (1972) On Controlling the Heartrate, this issue.

PERCEPTUAL AND MOTOR BEHAVIOUR
SPEED AND ERRORS OF WELL LEARNED VERBAL RESPONSE SETS
F.L.van Nes and R.van Schuur
introduction
The method of paired associates has been used to study verbal learning since the endof the nineteenth century (Calkins, 1894). In these experiments a number of pairs,e.g. consisting of two words, is presented to the subject. Upon later presentationof the pair members which serve as stimuli, he has to respond with the associatemember. His learning score is essentially determined by the percentage of associatesrecalled correctly, e.g. as a function of trials.
When attention is given to speed of responding, the paired-associate paradigm can beused to investigate a type of motor learning: the development of stereotyped responding to often repeated stimulus presentation. Such stereotyped responses may welloccur in a variety of rout.ine activities. The processes involved, from discriminationof the relevant stimulus to selection of the ultimate response, can, with repeatedstimulus presentation, gradually become integrated and carried out under the control
of "neural subroutines". Learning thus will be reflected in more efficient neuralprogramming, which we will suppose to result in (i) faster responding, (ii) fewererrors.
An example of a stimulus-response association (S-R) of stereotyped character is tobe found in reading, i.e. producing the letter-name responses R1 to visually presented letter shapes S. Speed and correctness of this stereotyped association S - R1provide means to judge the development of a sterotype S - RZ to be learned, althoughwith the possibility of negative transfer from the existing S - R1(Gibson, 1941).Negative transfer would, in this case, cause slower responding and/or more errors.The amount of negative transfer from S - RZ to learning another "new" stereotypedresponse, S - R3 , may be a criterion for the degree of development of a neural subroutine controlling the association S - RZ' Another criterion may be the amount ofretention, since motor skills are known to be largely retained for a long time(HOVland, 196Z).
In a previous communication (Van Nes, 1970) the time needed for reading lists ofletters vs. coding them with number names was reported. The present paper dealswith paced presentation of letters from the set S = {A, B, C, D} and verbal reactiontime (RT) as well as error rate as dependent variables.
method
Stimuli consisted of capital letters, projected as luminous characters in the sameplace by a rear-projection read-out. The letters subtended visual angles of about1° horizontally and 11° vertically. The 5timuli were presented for about 100 msthrough a mechanical shutter which opened fUlly in about 10 ms.
The subject was seated in a sound-proof box, viewing the stimuli through a window.He could start or stop stimulus presentations by means of two buttons. His verbalresponses were recorded on tape. This facilitated their classification in (1) correctresponses, (Z) "full errors", i.e. fully pronounced wrong responses, (3) "halferrors", such as the response "thr .. two" when it should be "two". Actually, allresponses were given in Dutch. Verbal RT's were measured with a voice key operatedfrom a throat microphone.
IPO annual progress report 7 1972

74
An experimental session consisted of 3Z0 trials, in which each stimulus was presented
80 times; all possible consecutive stimulus pairs occurred about equally often. Withsome exceptions, stimulus presentation was machine-paced, with an interstimulus interval of one second. Three response sets were used: (a) the letter names {A,B,C,D},(b) the number names {1 ,Z,3,4}, and (c) the number names {4,3,Z,1}. The first responseset employed, R1 , was that of the letter names, (a). The second response set RZ' whichsubjects learned first and the third set R3 , which they learned after R2 , were either(b) or (c).
results
Experiment I : Development of stereotyped responses.
Three subjects participated. The only instruction to them was which response set theyhad to use. Figs. 1 and Z show the data of the most extensively trained subject, VS.
In Fig. 1 RT's, averaged over the four responses, are plotted as a function of thenumber of sessions for the three response sets, used in the order A-A, A-4, A-1. Fordifferent stimuli, no large differences in RT's were found. Fig. 2 shows the corresponding error rates. Although the data in Figs. 1 and 2 were obtained under selfpaced conditions, further sessions under machine-paced conditions showed no significantdifferences. All other experiments were carried out under machine-paced conditions.
In 10 to 15 sessions RT's for A-4 had reached the RT-level for A-A. However, evenafter the response set A-4 had been learned during 69 sessions, i.e. some 5500 trialsfor each of the four stimuli, the error rate was still slightly above that for A-A.
After these 69 A-4 sessions, the subject responded according to A-1. In Fig. 1 RT'scan be seen to remain virtually constant during 20 sessions, so, as regards responsespeed, no learning seems to occur. The error rate for A-1, howeyer, in Fig. 2 isshown to decrease to the level for A-A in about 10 sessions.
Subject VS received no feedback on his RT's, neither during nor after a session. Asto errors, no feedback was given during a session, but the subject was informed ofhis error percentage after each session. For that matter, he usually had a ratheraccurate impression of number and kinds of error he had made. The exclusive feedback
on errors as well as a dislike to making them probably induced subject VS to try tominimize his error rate.
The two other subjects, DJ and KE, who used the response sets R1 , R2 and R3 , showedthe same trend in their RT's: (i) after some learning, the average RT's for R2 andR1 were equal, (ii) the average RT's for R3 were higher than for RZ' although thisdifference was smaller than in the case of subject VS. In contrast to subject VS,the other subjects made consistently more errors at R3 than at RZ. Subject DJ, withthe same learning sequence as VS, made 65 full errors in the first 21 sessions with
R2 , the set {4,3,Z,1}, _ompared with 264 full errors, i.e. 4 times as many, in thecorresponding sessions with R3 , the set {1 ,Z,3,4}.
Subject KE made 8 full errors in the first Z1 sessions with his RZ' being the set{1 ,2,3,4}, and 130 full errors, i.e. 16 times as many, in the corresponding sessionswith R3 , the set {4,3,2,1}. Subjects DJ and KE also tried to minimize their errorrates for the same reasons as subject VS.
After the second learning process, A-1, subject VS once more used the response setR2 : A-4, during four sessions. The incr~ase in RT's and errors of sessions 7Z and73 shown in Figs. 1 and 2, can be interpreted as retroactive inhibition from thesecond learning process, A-1.

7S
- A-AA-I.
A - 1
Reaction time lms)
\
\\
A I.~\ ~ ~\ I
1\ 1\ 1\/\ I\.J \ / \ /..J "
\.-J.... ' ... J
400A'" ! I~/_....&._01....--.........--1.L.0--.......--2...L.O--...I.----3....0--....I...---1....l.:0~11 75
Number of session
500
600
700
Fig. 1. Average reaction times against number of sessions, Experiment I. Three response sets were used, viz. A-A, A-4 and A-l successively. The data for A-4from sessions 72-75 were obtained after the 20 sessions with A-i.
Error ra te 1%) A-AA-I.A - 1
7520Number
10
\\\\\
\\
\". '" A. ,..., '--...... ...,----' 'voo
5
10
Fig. 2. Error percentages against number of sessions, Experiment I. The error scoresare made up of "full errors" and "half-errors", two half-errors contributingas much to the score as one full error.

700
600
500
Reaction time (ms)Q.. DA..
o 'Q.. J><).~ .0.0'I:i \ P ,
\ / \l'i
76
A - 4A - 1
9f\I \
~\ I \ \)/ ~ i
400=<o 10 20 30
Number of session40
Fig. 3. Average reaction times against numb~r of sessions, Experiment II. Full symbolsand solid lines pertain to the first response set A-4; empty symbols and dotted lines to the second response set A-l. Differences in shape of the symbolsdenote differences in the subject's instruction for the session concernedcircles = "minimize errors"; squares = "give equal attention to speed and correctness"; triangles = "minimize RT".
15
10
5
Error rate (%)
?1
10 20 30Number of session
A - 4A - 1
Fig. 4. Error percentages against number. of sessions, Experiment II. The error scoresare made up of "full errors" and "half-errors" as in Fig. 2. The various symbols and lines have the same meanings as in Fig. 3.

77
Experiment II : Retention and influence of instruction.
Retention. Almost two years after subject VS participated in Experiment I, his reten
tion of the stereotyped response A-4 was tested. The data from the instruction-lesssessions 1 to 4 in Figs. 3 and 4, as compared with sessions 1 to 4 in Figs. 1 and 2,show some retention, not in terms of RT, but in error rates.
Instruction. For the other sessions of Experiment II, subject VS was either instructed:
(i) to try to minimize his error score, or(ii) to give equal attention to speed and correctness of his responses, or(iii) to try to minimize RT, regardless of making errors.
First, the influence of these different instructions on responding according to A-4was investigated. In Figs. 3 and 4 the results regarding the instructions '~inimize
errors" and "minimize RT" can be clearly differentiated. Equal attention to bothaspects of responding yielded results that were hardly different from those underthe instruction "minimize errors".
After 24 sessions of A-4, the subject had to respond according to A-l again. Apartfrom an initial five sessions with high error rates, it seemed that the relationsfrom Figs. 1 and 2 still applied: equal error rates, but considerably higher RT'sfor A-l than for A-4. However, from the last group of data for A-l under the"minimize errors"instruction (session 3S to 40), it is apparent that, after a
learning process in which progressively more attention was given to speed of re
sponding (session 9 to 34), the subject was able to respond equally fast, with aboutthe same error rate, to both the first-learned set A-4 and the secondly-learned setA-l.
When, however, the triangular symbols in Figs. 3 and 4 are compared, it appears thatunder the "minimize RT" instruction the subject was also able to respond equally fastac~ording to A-l as according to A-4, but this at a somewhat higher error rate.
Analysis of errors. Almost all "full errors" that were made by subject VS in Experiment II are classified in the confusion matrices of Table I and Table 11. "Halferrors" (see Method) followed similar confusion patterRs. Correct responses belongin the main diagonal, but have been omitted for the sake of clarity.
4 3 2 1 It 3 2 1 4 3 2 1
A 1 3 A 3 4 12 A 5 5 26
B 2 3 B 2 11 7 B 4 20 18
C 2 1 C 2 9 2 C 6 14 4
D 1 3 D 4 22 4 D 10 43 6
Table Ia. Errors from A-4 Table lb. Errors from A-4 Table Ie. Errors from allsessions under "minimize sessions under "minimize A-4 session.s. The 161 fullerrors" instruction. The RT" instruction. The 82 errors represented -16 full errors represented fllll errors represented out of a total of 205 -- out of a total of 2l~ - - out of a total of 110 - relate to 1920 trials perrelate to 640 trials per relate to 480 trials per stimulus.stimulus. stimulus.
Tables la, Ib and Ic contain the errors made while responding to the first-learned
association A-4. The full errors made in sessions under the "minimize errors" instruction are summarised in Table la, those made under the "minimize RT" instructionin Table Ib, and the errors made in all the A-4 sessions in Table Ie.

78
The negative diagonals contain the errors "A-1" , ".3-2", "C-3" and "D-4". This
category represents 50% of the errors in Table Ia and 44% of those in Table lb.
The errors of this category may be brought about by the wrong set of associations
A-1. The errors "B-1" and "D-3" together cover 38% of the errors in Table Ia and
35% of those in Table lb. They may result from confusion of the responses to Band D,
due to the visual, acoustical and/or phonetical similarity of these stimuli. Further,
the frequently occurring error "D-3", especially under the "minimiz,:= RT' instruction,
may be induced by the fact that of the Dutch names for the numbers 1 to 4, only "3"
begins with !d!.
1 2 3 4
A 1 19
B l- 37 4
C 33 1
D 26 4
Table IIa. Errors fromA-I sessions under"minimize errors l1 instruction. The 127full errors represented - out of a totalof I44~ - relate to1120 trials perstimulus.
I 2 3 4 1 2 3 4
A 3 1%-
A 4 1 67
B 1 30 25 B 4 85 30
C 1 85 8 C 1 141 10
D I 38 24 11 D 82 29 13,
Table rIb. Errors from Table IIc. Errors from allA-I sessions under A-I sessions. The 467 full"minimize RT" instruc- errors represented - outtion. The 263 full of a total of 626 - relateerrors represented - to 3200 trials perout of a total of stimulus.36 6 ~ - relate to 1120trials per stimulus.
The full errors made in the A-1 sessions are tabulated in the confusion matrices of
Table II. Table IIa contains the errors from the sessions under "minimize errors" in
struction, Table IIb those from the "minimize RT" sessions and Table IIc those made
in all A-1 sessions together. The negative diagonals now comprise errors that belong
to the first-learned set of associations, A-4. They represent 91% of all errors in
Table IIa, and 72% of those in Table lIb. The errors "B-4" and "D-2", of equal fre
quency within each of the tables IIa, lIb and IIc, now cover 6% of all errors in
Table IIa, and 19% of those in Table lIb. Again, these errors may result from con
fusion of the responses to the stimuli Band D.
The confusion matrices for subject VS and subject DJ in Experiment I show the same
trend as in tables I and II. Subject KE of Experiment I first learned the set A-1.
The majority of errors in his first learning process was made up of the types "B-4"
and "D-2". During his second learning process, of the set A-4, the errors belonging
to the first set, i.e. A-1, also became predominant.
conclusions
1) The two response variables that were chosen to monitor the learning processes,RT's
and ulrorrate, are interdependent and must be considered together. This is demon-
strated best by the effect of giving different instructions to a subject, as shown
in Figs. 3 and 4. The two variables together can, indeed, be used to study the de
velopment of a stereotyped response along the lines described in the introduction.
It is possible that other variables, not studied in the present experiment - like
smoothness of a response or mental load caused by responding - would provide a bet
ter means of studying such stereotypes. However, such variables appear considerably
more difficult to quantify.
2) Errors are of different kinds and therefore bear more information than RT's.

79
The type of errors made can tell something about the original (in)compatibility of
an association which is learned, or about associations which subjects have learnedearlier, as shown in Table I and Table II.
3) Negative transfer from a recently learned association S-RZ to learning anotherassociation S-R3 , resulting in longer RT's and/or higher error rates, may be oneof the best criteria to judge the development of a stereotype for S-RZ' EspeciallyFigs. 1 and Z show to what extent learning the A-l associations is hampered by theA-4 stereotYr~d responses already developed, even though the A-l associations canbe considerea as more compatible than the A-4 associations.
summary
The paired-associate paradigm is used to study the development of stereotyped responses by measuring reaction times and error rates of verbal responses to visualstimuli. Letters are used as stimuli, S, letter and number names as responses, R.A well-learned or stereotyped set of associations S-RZ inhibits learning of another set S-R3 "
references
Calkins, M.W. (1894) Association, Psychol. Rev. !' 476-483.
Gibson, E.J. (1941) Retroactive Inhibition as a Function of Degree of Generalizationbetween Tasks, J.Exp.Psychol. ~, 93-115.
Hovland, C.I. (1962) Human Learning and Retention, Handbook of Experimental Psychology (Ed. by S.S. Stevens), 4th printing, p.650.
Van Nes, F.L. (1970) On Learning Stereotyped Responses, I.P.O. Annual ProgressReport ~, 154-157.

MEDICAL PHYSICS
ON THE ORIGIN OF PHYSIOLOGICAL TREMOR
W.G.Koster and R. van Schuur
The various parts of the human or animal body exhibit small movements even when the
individual is completely relaxed. In case the hand is resting on a table the most
distal part of the extended forefinger vibrates with an amplitude of 0.1 to 1.0 mm
and with a frequency of 10 to 25 Hz depending on the individual and on the experimen
tal situation. This phenomenon is referred to as tremor. A distinction is made be
tween physiological tremor which is observed in normal individuals and pathological
tremor (cerebellar or intention tremor and parkinsonian tremors) as observed in pa
tients.
In the literature a great many studies on tremor have been published since the work
of Schafer et al. (1886). The mechanical properties of a limb-muscle system can be
described with an underdamped second-order system. This system is activated through
signals, the origin of which is the source of much discussion in the literature.
Several hypotheses have been put forward:
1. The alpha motoneurons hypothesis assumes some pacemaker in the brain to make the
motoneurones discharge synchronically (Jasper and Andrews, 1938, Marshall and~alsh, 1956, Gatev and Ivanov, 1971).
2. The ballistocardiographic hypothesis states that the impact of the blood ejected
from the heart shakes the body, resulting in a trembling of all limbs (Brumlik,
1962) .
3. The servomechanism hypothesis holds that a movement of a limb is activating the
stretch reflex, resulting in activity of the antagonist muscles and thus revers
ing the movement, and vice versa.
(Halliday and Redfearn, 1956, Lippold, Redfearn and Vuco, 1957, Lippold,1970,1971).
4. The mechanical filter hypothesis emanates from the idea that the limb-muscle
system is activated through a broad band noise signal (Stiles and Randall, 1967,
Fox and Randall, 1970, Rau and Vredenbregt, 1971).
The resulting tremor is only dependent on the mechanical properties of the filter.
The contribution of each of tJ1ese causes may depend upon the experimental conditions.
Lindqvist (1941) provices evidence against the first hypothesis as far as the cortexis concerned.
The first as well as the second hypothesis fails to explain the results of Marsden
et al. (1969) indicating that the tremor of the two hands of a subject are not related.
In recent literature emphasis is laid most on the last two hypotheses. The available
data, however, are not consistent enough to choose either of these hypotheses or to
quantify the contribution of each source in a particular experimental set-up.
A possible way to discriminate between the servomechanism explanation and the mechan
ical filter hypothesis is by loading the limb with various weights. The mechanical
filter hypothesis predicts the tremor frequency to decrease with added weights without a shift in the lower frequencies of the EMG spectrum.
Such results have been in fact obtained by Fox and Randall (1970) and Rau and Vreden
bregt (1971). The servomechanism hypothesis predicts the peak in the tremor spectrum
and the low frequency peak in the EMG spectrum to be the same, both shifting tolower frequencies with added weights.
The experiments to be described here are an extension of the study of Rau and Vredenbregt (1971).
IPO annual progress report 7 /972

81
methods
The pronated forearm and hand rested in a relaxed position on the table; only theindex was extended. The tremor oscillations were picked up via a specially developed
accelerometer with a weight of 4 g, which was attached to the phalanx distalis. In
the range of 5 - 40 Hz the instrument operates as a real acceler~meter (Pacela, 1968).Only the vertical component of the oscillations was recorded. As additional weights,pieces of lead were attached to the phalanx distalis. Six additional weights wereused (30,60, .90, 120, 150 and 180 g). The EMG signals were picked up with surfaceelectrodes (8 mm diameter) from the extensor muscles (M.extensor digitorum and M.extensor indicis). Ea~h measurement lasted about one minute.The EMG amplifiers have a band-pass characteristic which is flat between 15 and 1000Hz (Vredenbregt, 1971). The tremor oscillations and the EMG signals were simultaneously recorded on an instrumentation tape recorder (Philips Analog 7). The EMG signalswere fed into a high-pass filter (24dB/oct, 50 Hz) to eliminate zero-line shifts,a full-wave rectifier and a low-pass filter (24 dB/oct, 50 Hz) ,the result being the
envelope of the EMG signals (Fig. 1).
EM:;
~ I U /\--AEMG r 0 EMG rectified 1 f-E-M:;-en-v-e-to-p-e-
FFT- ANALYZER
power spectrum
50 Hz
24 dB/oct50 Hz
24dBJoct
TREMOR
Fig. 1. Diagrammatic representation of the apparatus.
The envelope of the EMG signal is used to reflect the low-frequency activity of theEMG signal. The tremor signal, the EMG signal and the EMG envelope were fed into ahardware spectrum analyser (General Radio FFT Analyzer Time/Data). x Two subjectsparticipated in the experiment.
results
The results obtained with the two subjects appeared to be very simular. In Fig. 2the power spectra of the tremor oscillations, the EMG signal from the M. extensor
indicis and the EMG envelope are shown for one subject with four different loads.
The spectrum of the tremor 0scil lations (Fig. 2a) clearly changed with the addition
al loads. With the minimum load (4 g) the spectrum shows a slight peak at about 20 Hz.Increasing the total load up to 184 g makes the peak to shift to a lower frequency,about 5 Hz. The total energy is about ten times the energy with minimum load. The
bandwidth decreases linearly with decreasing frequency. The spectra of the EMG
~We would like to thank Mr. E.van Walwijk and Mr. E.F. van Looy of the Eindhoven
University of Technology for their permission to use the apparatus and for their
help during the analyses.

ENERGY [arbitrary units)
o 60 120 180lg1
TREMOR
-~~. ;0.2~.3 :v-A..o 40 50
~ ;1
_ i
N - EMG envelope : I :I~ - :1 :II~
_ i -I
. . -"'" .o 10·;0· 3~. , .•~--:_._~ :~44050 . ,~~-. , • i • 1 - ----
EMG
~~
o 50 100 150 200 250
~l!/~~FREQUENCY [Hz)
:J~ Ii I ''"''-_ :.>L -===__
fig, 2. Power spectra of the tremor signals (a), the EMG envelope (b) and the total EMG-signal (c),
The energy is represented in arbitrary units. The gain of each of the signals (a), (b) and (c)
was kept constant,

83
envelope are shown in Fig. 2b. With small loads, a slight maximum is noticed at about15 Hz. With increasing load more activity at lower frequencies appears. The totalenergy increases about five times. The EMG spectrum is given in Fig. 2c. No shift inpeak frequency with increasing load is noticed. The bandwidth exhibits a slight decrease, whereas the energy increases in a very pronounced way; it becomes about fivetimes as large.The tremor signals were sampled with a frequency of 100 Hz; 8 replications of 5 seconds each were made. The EMG env~~ope was sampled with a frequency of 100 Hz and16 replications of 2.5 seconds each were analysed. The EMG signals were sampled witha frequency of 500 Hz and 128 replications of 0.5 second each were made.
discussion
The most striking effect in the data is the decrease in tremor frequency and the
relative stability of the frequency of the EMG envelope as a function of the addi
tional weights. This effect points in the direction of the mechanical filter hypothesis. The EMG signal may be considered as white noise filtered in a frequencyband of 10 - 200 Hz (Fig. 2c). In case of a white noise signal the amplitude vari-ations will be completely random. This will result in a flat envelope spectrum.In the EMG signals measured here the envelope spectrum is slightly peaked (Fig. 2b),which is an inJication that there is some periodicity in the amplitude variation ofthe original EMG signal.
In static condition there exists a very stable relation between the size of the EMGsignals and the force exerted by the muscle (Vredenbregt and Koster, 1966b, Rau and
Vredenbregt, 1970). The very tiny movements during tremor makes the conditionpseudo-static.
EMGrms
4
3
2
oo 50 100 150
Fig. 3. The size of the
EMG signals (rms in
arbitrary units) as
a function of the
total load in g, i. e .
equivalent weight of
the finger plus the
weight of the accel
erometer plus addi
tional load.
mtotal [g]
200
84
In Fig. 3 the square root of the energy of the EMG signals is plotted against theload. The shape of the curve is remarkably similar to that presented in the articlesmentioned. Therefore, in this tremor situation, too, the condition can mainly beconsidered as a static one. The curve is slightly bent towards the EMG axis. Thecurvature is slight as the maximum load is only 10% of the maximum load the fingeris capable of supporting. The curve does not pass through zero.A relation, identical to that in Fig. 3,is found between the square root of theenergy of the E~IG envelope and the load. Thus the energy of the EMG envelope is aconstant percentage, about 50%, of the energy of the total EMG signal.
As a first approximation we assume the shape of the energy spectrum of the EMG envelope to be constant. Its shape is broad in relation to that of the tremor signal.
The mean EMG signal reflects the constant force with which the finger is extended.
The EMG envelope reflects the variations in that force.
We may now try to make a more quantitative analysis of the mechanical filter hypothesis. The input signal may be written as:
F.1
F.1
c(m)F c + c(m)LFv (w)sin(wt +¢)
c(m)F{a + Lb(w)sin(wt + ¢)}
or
(1)
where Fi is the input force that is linearly related to the total load m, Fc
is theconstant force and Fv (w) are the amplitudes of the variable forces.The hand-finger system will be assumed to be a mass-spring system with damping, forwhich the following differential equation holds:
mx + dx + sx = c(m)F{a + Lb(w) sin(wt + ¢)}
where m is the equivalent mass, d the damping factor, s the stiffnes, w the angularfrequency and x represents the displacement.
From (1) we may calculate at what frequency the maximum output will be found, viz.:
sm
As a first approximation, equation (2) may be written as:w2 ~
x mmax
(2)
(3)
As w 2rrf,
f2X max
equation1
(2rr) 2
(3) may be written as:
(4)
In case s remains constant, this means that
mf 2 = constant. (5)
Or, with additional masses attached to thethe square root of the mass. With equationmay be estimated when
finger, the frequency will decrease with(5) the equivalent mass m of the fingero
where rna is the mass of the accelerometer and mw the mass of the added weight. Inthe same way the natural frequency f o can be estimated. In table I the experimentaldata are compared with the calculated values which are based on the estimated valuesof mo and f o for each of the two subjects.

85
Subject Kmo = 7.9 g
f o =32.5 Hz
Subject VSmo 11.7 gf o = 24.0 Hz
f calculatedf experimentalf calculated
27 26.5 20 20.7
13 14.1 13 12.210 10.8 9.5 9.4
8.5 9.1 8.0 8.0
8.0 8.0 7.0 7.07.5 7.2 7.0 6.4
7.5 6.6 5.0 5.9------- -~----------
f experimentalweight(g)
4
34
6494
124
~54
184------'------
Table I. Experimental values represent the frequency of the maximum peak in the power
spectra of the tremor signals. The calculated values are based on equation(5)
with m and f estimated from the data.o 0
from the good agreement between the experimental and the calculated resultsconstant, see eq. (5), gives a rather good description of the experimental
It appearsthat medata.
The frequencies found in this experiment are of the same value as "the die-away oscillations following a sharp tap to the finger" obtained by Halliday and Redfearn(1956) .These results together with the fact that the peak frequency of the EMG spectrum andthat of the EMG envelope spectrum are independent of the load, suggest that tremoris nothing but the mechanical response to a random forcing signal. In cases in whichthe muscle is not completely relaxed, the forcing will result from asynchronous firingof the individual muscle fibres or from synchronic discharges of alpha motoneurons(Hamoen, 1962). The rather stabile peak in the EMG envelope spectrum (Fig. 2b) supports the latter process. In the completely reLaxed muscle the ballistocardiogram
could produce the forcing (Stiles and Randall, 1967).
There is, however, some evidence against the mechanical filter explanation:- The stiffness. In completely static condition ( x is constant) the only way a mus-
cle can increase its force is by increasing its stiffness.In the experiments described above the EMG signal increases by a factor three whenthe load is increased. Thus we must assume that the driving force has increased.From other studies (Wilkie, 1956; Granit, 1958; Vredenbregt and Koster, 1966a) it isknown that there exists a positive correlation between force and stiffness. Thereforewe must assume that stiffness increases with load. We observe in these experimentsthat the tremor frequency decreases inversely with the square root of the load.In terms of equation (5) this means that the stiffness remains approximately constant.These two results are in contrast with each other.To avoid that problem Stiles and Randall (1967) instructed their subjects to keep theEMG signal constant (i.e. on the level of the maximum load). The rationale was to keepthe stiffness independent of the load. In fact, the same quadratic relation betweenfrequency and load was found.
The bandwidth. Another aspect in which the model deviates from the data is thebandwidth. The model predicts the bandwidth to decrease linearly with m and thus to
increase linearly with f2. In fact the bandwidth increases linearly with f.

86
- The envelope spectrum. A more detailed analysis of the EMG envelope spectrum showsthat the shape is not independent of the load. The results for both subjects show
that with small loads (4 and 34 g) a peak in the envelope spectrum is noticed whichis different from that in the tremor spectrum. With increasing load a low frequencypeak in the envelope spectrum becomes visible; the peak appears to coincide withthe main tremor frequency. This might be an indication that the stretch reflex becom~s
active, the more so as the low frequency peak decreases in frequency with increasingload, but increases in amplitude. Apart from this "tremor" peak, others appear inthe envelope spectrum. The data are not accurate enough to analyse these peaks inmore detail. Although the frequency response renders a mechanical filter explanationplausible, some other data made us reject the simple filter hypothesis. Withincreasing load the stretch reflex, too, probably plays an important part.
summary
In two subjects the acceleration caused by tremor in the vertical plane of theindexfinger have been measured as well as the electromyographic (EMG) signals ofthe extensor muscles under various loading conditions (up to 180 g).The tremor frequency decreases reciprocally with the square root of the weight. Theamplitude increases with load.
With small loads the spectrum of the EMG envelope is broad without clear peaks.Above 90 g its spectrum exhibits a peak at the tremor frequency. It is argued thatthe tremor normally is caused by random activation of the limb-muscle system, whereas with increased load the stretch reflex becomes active.
references
Brumlik, J. (1952) On the Nature of Normal Tremor, Neurology ll, 159-179.
Fox, J.R. and Randall, J.E. (1970) Relationship between Forearm Tremor and theBiceps Electromyogram, J.appl. Physiol. ~, 103-108.
Gatev, V. and Ivanov, I. (1971) Role of Neuromuscular Activity in the Genesis ofPhysiological Postural Tremor,Agressologi2 ll, 119-124.
Granit, R. (1958) Neuromuscular Interaction in the Postural Tone of the Cat'sIsometric Soleus Muscle, J. Physiol. 143, 387-402.
Halliday, A.M. and Redfearn, J.W.T. (1955) An Analysis of the Frequencies of FingerTremor in Healthy' Subjects, J. Physiol. 134, 500-511.
Hamoen, A.M. (1952) Uber das Wesen des Physiologischen Tremors der Hand, Psychiat.Neurol. Neurochir. ~, 109-115.
Jasper, H.H. and Andrews, H.L. (1938) Brain Potentials and Voluntary Muscle Activityin Man, J. Neurophysiol. l, 87-100.
Lindqvist, T. (1941) Finger Tremor and the a-waves of the Electroencephalogram,Acta Med. Scand. ~, 580-585.
Lippold, O.C.J. (1970) Oscillation in the Stretch Reflex Arc and the Origin of theRhythmical 8-12 cis Component of Physiological Tremor, J. Physiol. 205, 359-382.
Lippold, O.C.J. (1971) Physiological Tremor, Scient. Am. 224UL55-73.
Lippold, O.C.J., Redfearn, J.W.T. and Vuco, J. (1957) The Rhythmical Activity ofGroups of Motor Units in the Voluntary Contraction of Muscle, J.Physiol. 137473-487. ---'
Marsden, C.D., Meadows, ,J.C., Lange, G.W. and Watson, R.S. (1959) The Relation between Physiological Tremor of the two Hands in Healthy Subjects, Electroence~h.clin. Neurophysiol. 12, 179-185.
Marshall, J. and Walsh, E.G. (1955) Physiological Tremor, J. Neurol. Neurosurg.Psychiat. ~, 250-257.
Pacela, A.F. (1958) Measurement of the Body Surface Physiologic Tremor or "Microvibration", Behav. Res. Meth. & Instru. l, 50-70.
Rau, G. and Vredenbregt, J. (1970) The Electromyogram and the Force during StaticMuscular Contractions, I.P.O. Annual Progress Report ~, 174-178.

87
Rau, G. and Vredenbregt, J. (1971) Finger Tremor and Electromyographic Activity,I.P.O. Annual Progress Report ~' 81-85.
Schafer, E.A.,Canney, E.L. and Tunstall, J.O. (1886) On the Rhythm of MuscularResponse to Volitional Impulses in Man, J. Physiol. 2, 111-117.
Stiles, R.N. and Randall, J.E. (1967) Mechanical Factors in Human Tremor Frequency,J. appl. Physiol. ~' 324-330.
Vredenbregt, J. and Basten, e.G. (1971) A Modified Small Electromyograph, I.P.O.Annual Progress Report ~' 130-131.
Vredenbregt, J. and FUbini, E. (1969) Small-Size Electromyograph, I.P.O. AnnualProgress Report ~' 161-162.
Vredenbregt, J. and Koster, W.G. (1966a) A Method for Measuring the Passive ForceLength Relationship of the Human Biceps Muscle in Vivo, I.P.O. Internal Report83.
Vredenbregt, J. and Koster, W.G. (1966b) Some Aspects of Muscle Mechanics in Vivo,I.P.O. Annual Progress Report !' 94-100.
Wilkie, D.R. (1956) The Mechanical Properties of Muscle, Brit. Med. Bull. ~'177-182.

88
A NOTE ON PARKINSONIAN TREMOR
W.G.Koster and R. van Schuur
introduction
In the preceding article a method has been described of discriminating between possible causes of physiological tremor. It consists in loading the subject's finger
with various weights and measuring the tremor oscillations as well as the electromyographic (EMG) signals of the relevant muscles. There is strong evidence thatphysiological tremor is caused by local, i.e. peripheral, sources. In the present
*article the same method is used in a pilot study of patients with Parkinsonism.It is generally accepted that the so-called Parkinsonian tremor is of central origin(Wachs and Boshes, 1961; Stuart, Eldred and Wild, 1966). From this and other sourcesit can be concluded that a tremor registration of patients seriously affected byParkinsonism exhibits a pattern completely different from normal physiological tremor. Its amplitude is high and a clear periodicity of low frequency ( 4 - 8 Hz ) isobserved. The EMG signals also differ from the normal ones, high amplitudes beingobserved together with clear periodic bursts of activity.
methods
The methods and apparatus were the same as those described in the previous article(Koster and Van Schuur, this issue). The tremor is measured with an accelerometer
attached to the back of the hand near the Articulatio carpometacarpea. Two patients
participated in the experiment, which comprised three t~sts.
The tests were carried out in three loading conditions, one unloaded and two withdifferent weights on the hand. For one patient weights of 3S and 60 g were used.The other patient exhibited such a strong tremor that proper fixation of the lower
arm appeared to be impossible. Thus the mass of the lower arm also participatedin the movement. It was decided to use heavier loads, viz. 65 and 330 g. The electromyographic (EMG) signals of the hand flexors were picked up with surface electrodes.
The EMG signals were fed through a high-pass filter to eliminate zero-line shifts,then full-wave rectified, and finally fed into a low-pass filter to eliminate high
frequency activity.The result was the EMG envelope. These signals, tremor,EMG, andEMG envelope were fed into an FFT analyser to obtain power spectra. The duration
of each recording was about 60 seconds. The tremor signals were analyzed with aresolution of 0.1 Hz, unless otherwise indicated, the EMG envelope with 0.1 Hz andthe EMG signals with a resolution of 1.6 Hz.
results
In Fig. la a hand-copied recording of patient Sch. is shown. A clear periodicity in
the EMG signal is obvious. The tremor exhibits an almost sinusoidal pattern. The
suppresion of the zero-line shift is clearly noticed. In Fig. lb the results of
patient Van W. are represented. The duration of the bursts is somewhat longer and
the tremor shows a periodic, but less sinusoidal, character.
Figs. 2a, band c show the power spectra of the tremor signals, the EMG envelopes,and the EMG signals of patient Sch. under three loading conditions. For each of
* We would like to express our gratitude to Professor Dr. J. Droogleever Fortuyn
and Dr. J. van Manen (Department of Neurology, University of Groningen) for the
opportunity to do this study and for their help in the performance of the experi
ments.
IPO annual progress report 7 /972

EMG
EMG rectified
EMG envelope
89
Fig. la and lb.
A hand-copied recording
of the results from
two patients.
The vertical scale is
arbitrary.
The hand was not loaded.
TREMOR
Sub. Sch. 0 9 time 100 ms
EMG
EMG rectified
EMGenvelope

ENERGY [arbitrary units)
TREMOR o 65 330(9)
o 10 20 30 40 50
om
EMG envelope
L=._.__~__I • I • , I • • ~ • I
o
- !
o
10
50
20
EMG
100
30 40
150
50
200
, .'
FREQUENCY [Hz)I •••• I
i
- II
- iI
~ I~J
Fig. 2. Power spectra of the tremor signals (a), the EMG envelopes (b), and the total EMG signals (cl
of patient Sch. under various loading conditions. The energy is represented in arbitrary units.
The ~ain of each of the signals a, band c was kept constant.

91
the signals the gain was kept constant. The most conspicuous phenomenon in the curvesof Fig. 2 is the nearly discrete character of the spectra. The power spectra of the
tremor signals and of the EMG envelopes show clear "spikes" with no activity in between. The frequencies of tremor and EMG envelope coincide. The sinusoidal characterof the tremor of patient Sch. is shown even better in Fig. 3. A recording of about60 seconds was analyzed with a resolution of 0.02 Hz. The resolution appeared to benot high enough for this kind of tremor. The restricted length of the recording madea higher resolution impossible. From spectra like that in Fig. 3 the peak frequencyof the tremor can be measured with high accuracy. Such measurements show that thefrequency decreases somewhat with increasing load (4.85 Hz unloaded; 4.65 Hz with65 g and 4.50 Hz with 330 g). The EMG envelope closely satisfies the same description.The "high"-frequency activity of the EMG signal (20-150 Hz) decreases somewhat withloading.The data of patient Van W. are virtually the same. The tremor frequency was 6.5 Hzand it did not change when loaded. A strong decrease in high-frequency activity inthe EMG signal was remarkable.
discussion
The data presented her must be considered as indications rather than as final results.As the tremor movements were very strong, proper fixation could not be achieved.Thus, the recorded signals cannot be ascribed solely to hand tremor. This is in par
ticular true for patient Sch. The low-frequency cut-off of the EMG amplifier is6 dB/oct from 5-Hz downwards, causing the 5Hz bursts to be reduced in size. Thestrong periodicity in the EMG signals and, hence, in the EMG envelope points to anorigin of Parkinsonian tremor that is different from that of physiological tremor.From the four possible sources mentioned by Koster and Van Schuur (this issue) onlythe alphamotoneuron hypothesis and the stretch reflex hypothesis remain plausible.The slight shift in tremor frequency when loaded makes a pure alphamotoneuron hypothesis unlikely, as the "tremorogenic" centres will not be influenced by changes inconditions at the periphery. More emphasis can be laid on the stretch reflex thatmight be activated through some "central nervous system pacemaker" in the motor tract.In that hypothesis the movement is seen as the cause and the muscle activity as theresulting action. More systematic studies must be made to test the stretch reflexhypothesis.
summary
From the right hand of two patients with Parkinsonism the acceleration caused bytremor in the vertical plane and the electromyographic (EMG) signals of the relevantmuscles have been measured under various loading conditions. The power spectra showthe tremor signals to exhibit an almost sinusoidal pattern. The frequencies of thetremor signal and of the EMG envelope coincide. For one subject the tremor frequencyas well as that of the EMG envelope decrease inversely with loading . The dataprovide evidence that the tremor originates from a stretch reflyx activated throughsome central nervous pacemaker in the motor tract.
references
Koster, W.G. and Schuur, R. van (1972) On the Origin of Physiological Tremor,I.P.O. Annual Progress Report, this issue.
Stuart, D.G., Eldred, E. and Wild, W.O. (1966) Comparisons between the Physiological,Shivering, and Parkinsonian Tremors, J. appl. Physiol.~, 1918-1924.
Wachs, H. and Boshes, B (1961) Tremor Studies in Normals and in Parkinsonism.Arch. Neurol. ~, 66-82.

92
ON CONTROLLING THE HEART RATE*
R.van Schuur and Th.Burema**
introduction
Physical stress of the human body causes a load of the heart. The energy needed forthis stress is supplied by the blood. More muscle activity is attented with more needof blood per time unit and the heart realizes this by adjusting the heartrate. Intraining for a better physical condition the limiting of the heartrate may be of greatimportance. Too strong a physical stress may lead to fatal increase in the heartratein people who have had some heartdisease.Another reason for controlling the heartrate may lie in the training schedules whichare often made up so as to load the heart increasingly. Therefore it is desirableto control the stress. With this end in view we have investigated on theoreticalgrounds three fundamental control systems. The system which turned out to be the mostpromising was applied in an experiment.
For this purpose we consider the human organism as a controlled system, with as theinput the amount of power the subject has to supply and as the output the heartrate.For this kind of system Wigertz (1970) found the following transfer function:
H(jw) = F(output)F(input)
+
According to this function it appears that the system consists of two parallel firstorder systems.For this system holds T2-ST 1 . The first-order system with T2will playits part only for signals which, in comparison with the other first-order system,vary slowly. As it is essential that during training a specified value of the heartrate should not be exceeded rapidly, the rapid part of the system plays the majorrole. Therefore the transfer function is simplified to:
HUw) = Ho .••.......•••...•.••..••....•....•••.•.... (1 )
with T H = Tl,
The limiting process is such that the acting power is controlled as a function of theheartrate. An ergom8ter-bicycle is used to supply the power. The subject has to cycle
in the rhvthm set by the controller. A higher tempo corresponds with a heavier load.The task may also be controlled in an electric way, viz. by varying the resistancethe subject has to overcome during cycling at the same tempo.The controle circuit is representeJ diagrammatically in Fig. 1.
iH
u~
-R
++
Fig. 1 Diagrammatic representation
of the control circuit.
f
* The research was performed on request of the Department of Medical Systems and
Devices of Philips.
**Student of the Eindhoven University of Technology.

93
The heartrate (u) of the subject is compared with the ultimate heartrate (f). The
difference specifies the heaviness of the load (i) imposed by the controller R.By changing the task the heartrate (u) of the system H will also change, until asteady state is reached. The choice of controller is the subject of this article.
choice of controller
The influence of each of the elementary controllers on the system will be checkedsuccessively. The relation between heartrate (u) and the established heartrate (f)will be considered on the basis of Fig. 1. The notation used here will be applied
during the rest of this article.In general u = i H (2)
i = (f-u) R (3)
Eliminating the heaviness of the task (i) leads to
u = 1~~R f · ...• ··············· ( 4 )
If both Hand R are assumed to be positive, the established heartrate (f) will beapproached better according as HR is greater than 1.
proportional controller
By proportional controlling is understood that controller in which the heaviness ofthe task performed is linearly proportional to the difference between output value
and established value.
For this control applies:R=R
p...•••.••••.•••.•..•.••••••.•••••••••••• (5)
This gives the relation between u and f as
u =~ f (6)1+HR
PThe product HRp defines how near the established level is approached. From a pilotstudy we found H to be about 0.7 (beats/min)/W. The value Rpis also limited becauseone is not able to perform an infinitly heavy task. A non-trained subject can hardlyyield a load of 500 W for some time. Starting the controlling, the difference betweenthe heartrate and the established value will be about 50 beats/min. With te maximumload of 500 W the value of R will be : R = 500/50 = 10 W/(beats/min). The product
p pHR is about 0.7x10 = 7, which value does not suit the condition HR»1, needed tomake u = f. For this reason the established value will not be reached when using theproportional controller. Besides the level reached depends on H with a specified R
. 0 pvalue, and SInce the Ho value depends on the subject this type of control is not apractical one for the purpose in view.
differential controller
With the differential controller the heaviness of the task depends on the changes in
the difference between u and f. In case of a big change the task will be heavierthan with a small one. When there are no changes no task should be performed.As the established value of f does not change during the session, the control onlyreacts on changes in the value of the heartrate u. Whenever a steady state isreached this equilibrium will be maintained in spite of the value of u. This valuethen has no relation to the established value of f. Therefore this controller cannotbe used either for our purposes.

94
integrating control
In the integrating controlling process the heaviness of the task depends on the
vatue peaehed before and on the differenee between u and f. If the difference be
tween the momentary value (u) and the established heartrate value (f) is positive,then the heaviness of the task will decrease owing to the controller, and increaseif the difference is negative. If there is no difference the task will be maintainedon the level reached at the preceding moment.During controlling, the heaviness of the task will increase until the heartratereaches the established value, after which the task will maintain that level.For this type of control one has
.•....••....•.•...•.••.•..••.••. (7)
With (4) this relation givesHR/jw'i
u = 1+HR. 7j w,. . (8)1 1
Reaching the required equilibrium means that changes round this situation take placeso slowly that they are not recognized ~s disturbances. In the ideal case the disturbance has an infinitely long period (T). This corresponds with w = 2n/T = 0 rad/sand makes R of (7) infinite. In the practical situation R»1. Since the value of H isabout 1, the product HR will be much greater than 1, so that with (4)
HRu = 1+HR f 'V f
The established value will be approached very closely, so that this type of controlsuits the demands.
The parameters 'i and Ri ~ill be so chosen that the established value of f is notyet exceeded.
optimal control
Optimal control is obtained when:
(a) the established value is not exceeded;
(b) the established value is reached as rapidly as possible.
When both requirements are met the system is on the point of the oscillation.Oscillation may appear when the system is damped too little; then the establishedvalue is exceeded. On the other hand, if the system is damped too strongly, theestablished value is reached after a longer period than in the system with optimaldamping. In the integrating system damping depends on the time constant , ..
1From (1) and (8) follows:
u =H R.o 1
f (9)
and ((jw)2'H,·+jW'.+H R.)u = H R.f.1 1 0 a 0 1
This is a special kind of Laplace transformation, for the harmonic functions, of asecond-order differential equation. The general differential equation reads:
'H'iil+'iO+HoRiu = HoRif (10)
The solution of (10) that satisfies the condition mentioned above is :
'~-4'H'·H R. = 01 1 0 1
hence:
Ticrit
This is called the critical adjustment.
4H R.'01H (11)

95
When Yi<Yi ~riT oscillation will occur and when Yj>Yi crit the system acts more slowlythan in optimal condition. To test whether this functional description holds in thehuman organism, an experiment was set up.
EXPERIMENT.
The purpose of the experiment was to consider whether the established heartrate isreached or not, and whether the integrating system controls the adjustment of the taskin an optimal way. With differently chosen integrating constants it was checked whetherand how the desired value is obtained. The subject used an ergometercycle to performthe task. By means of a pair of headphones clicks were presented to him. He had toadjust his rhythm )f cycling to the clicks. Because the heart rate was varied within
relatively narrow limits it is supposed that the power supplied is proportional to thecycling rhythm. During the experiment the heartrate was converted into a proportionalvoltage, which was subtracted from a reference voltage in a differential amplifier.The reference voltage corresponded with the established heartrate. After integrationthe difference voltage controlled the frequency generator, which gave the impulsesat a repetition frequency proportional to the controlling voltage. To choose the valueof Yi, the results of Wigertz (1970) were used so that in the critically damped situa-tion Yi=YH = 22 s with HaR i about .25. For Ho we took the value of.7 (beats/min)/Waccording to the pilot study. The heart rate ultimately to be obtained was establishedon 120 beats/min. Each of the sessions lasted 5 minutes. Fig. 2 shows the curve of theheartrate during these 5 minutes.
c 140
E-(Il 120....C1I(1).0......WI-« 1000::
I-0:: I«w I:J:
~80
aI
4
TIME (min)
Fig. 2 Heartrate as a function of time during controlled task. The time constant of
the integrating control is 22s and the closed-loop gain .25.

140c
E-1Il 120+-'CllQ)
..c
WI-« 100a:::I-a:::«lJ.J:c
80
2
96
4
TIME (min)Fig. 3 Heartrate as a function of time during controlled task. The time constant
of the integrating control is 4.7 s and the closed-loop gain .25.
140£E-1Il 120+-'CllQ)..c
lJ.JI- 100«a:::I-a:::«lJ.J:c
80
1:"o
I
2 4
TIME (min)Fig.4 Heartrate as a function of time during controlled task. The time constant
of the integrating control is 47 s and the closed-loop gain .25.

97
The established value was reached within 40 seconds without overshoot. The fluctuations round this value were less than 10%. They were probably due to lack of accuracy on the part of the subject.In a following condition, with a shorter integrating time constant, the curve of the
heartrate as a function of time was explored. The value of Ti was now 4.7 s. The result is presented in Fig. 3. The established value of 120 beats/min was reachedvery rapidly viz. within 20 s. This value, however, was exceeded by an overshootof 10%. Besides periodical fluctuations arose round the established value. The fluctuations had an oscillatory character, with a significant difference of those foundwith Ti = 22 s. As the established value was exceeded regulary, the integrating timeconstant of 4.7 s does not suit the demands.
In a third condition the integrating constant was 47 s. Fig. 4 shows that the established value was reached later then in the first condition (-200 s), while duringthe whole session there was no overshoot.
conclusion
On the basis of the preceding theoretical considerations and the results of the experiment the integrating controller seems to give good results when the heartrate iscontrolled by means of a task. If the closed-loop gain is .25 and the heartrate isto reach the established value critically the time constant of the controller shouldbe equal to TH, i.e. the time constant of the human system. The average value of THis 22 s according to the experiment of Wigertz. In our experiment we found a goodagreement with this value.
summary
In schedules for revalidation or condition training for sportsmen limiting the heartrate plays an important role. It is desirable that the various established valuesof the heartrate are reached rapidly without overshoot. On the basis of considerationsof control it apppears that the integrating controller gives the best results. Thisstatement was confirmed in an experiment. The time constant of the controller wasfound to be 22 s, with a closed-loop gain 0.25. This is in good agreement with thevalue expected by the results of Wigertz.
references
Burema, Th. (1973) Ontwikkeling van de Pulsergometer. I.P.O. Report 245.
Wigertz, O. (1970) Dynamics of Ventilation and Heartrate in Response to SinusoidalWork Load in Man. J. Appl. Physiol. ~, 208 - 218.

98
EMG APPLICATIONS IN LOW BACKPAIN
J.vredenbregt and C.M.J. Hul~t
introduction
Among factory people working at a conventional lathe, the number of them suffering
from low back pain is significa~tly gre~ter than the number out of any other groupof workers of various kinds of 4u,ties. Th'e main cause seems to be the long periodsof fixed bent posture of t~e bod);, when "at work, the muscles of the back,' especiallyof the low back, are constantly contrac~ed isometrically.In a case like this surface electromyography (EMG) of the back muscles might giveinformation on the load of the muscles involved for various positions of the backduring work, especially with regards to the posture when workifrg at the lathe.On this idea an EMG study was set up to find out whether the EMG can indicate differences satisfactorily when loading the back muscles during standing in a bent position;
Two criteria will be treated, namely the EMG-Ioad relation and the EMG-endurance
relation, the former of which is less complicated to establish than the latter.However, the latter has the advantage of studying the muscle behaviour during loadingover a long period of time.
method
Fig. 1. Back view of the body. At the
right side the muscles, studied in the
experiment, are drawn.
M.latissimusdorsi
)
Before starting the measurements, it was necessary to check whether the proposed
method offered reproducible data. This resulted in the following arrangements.
A rod with adjust~ble length was coupled to a bar in the form of a T. The bar was
to be held horizontally by the subject standing on a platform, his arms stretched
downwards. The end of the rod was fastened to the platform between the subject'sfeet. The rod was adjusted so as to force the subject to bend slightly forward.The subject was instructed to exert an upward force on the bar by stretching his
body. This action causes the backmuscles to be loaded. To enable this
load to be measured, the bar was provided with straingauges.
The EMG signals were .picked up fromthe M. trapezius left and right, M.
latissimus dorsi left and right, andM. erector spinae left and right (Fig.1)with the aid of miniaturized EMG amplifiers provided with sucti'on cup skinelectrodes (Vredenbregt, 1971).The signals were recorded on an instrumentation recorder (Philips Analog 7).After full-wave rectifying, the meanvalue of the rectified signal was taken,representing a measure of muscle acti
vity. Simultaneously with the EMG sig-
IPa annual progress report 7 1972

99
150o 50 1mExternal load (kgf)
EMS activity from<>-4 left AA .......... right),·..trapeZlus
o---"'left )M.latis.dorsi1--1 right)6··1> left )u .j,....~ righty·,·erect.splnae
Subject: Vr
0-..,;;;;;;;;;;;..--......-_......--_........_--.....
iii:~0.8:::J
>L-IVL-
:EO.6LIV
150o 50 100External load (kgt)
EMGac:tivity from
0----0 left )M .__ right) .trapeZIus
0- --0 left ~. .. ht M.latIS. dorsI"--I rig
<l.·..:.lett ) .•...• righnM.~rect.sptnae
SUbject: Vr
~ OBUl-C:::J
>..
~ 06l:;:.0L-t1l~
Fig. 2a and b. EMG-force relation of the muscles of one of the healthy subjects.
The curves are single trials. Fig. 2a refers to the first trial
and Fig. 2b to the second one.
~ 0.8III-C:::J
>..
~ 0.6l:;:.0L-IV~
150o 50 1mExternal load (kgfl
EMS activity from<>-4 left ~ ........ right .trapezlus
0---'" left ~M.latis.dorsi1--1 right
6·1> lett ~ . .-j, ...~ right Merect.splnae
V \ -\ a
/
Subject: Co
1/~Itf,j/
il.,4.
- /-...........
j .1
2 ~ .. .........,... ,~J.v .'
..··-I>~.t .,'y' ..•..~
~-4y'
- ..,...-0---a
>....>
·'BO.4IV
C!>~W
O.
iii''E0.8:::J
>L-
IVL-
:EO.6LIV
150o 50 100External load (kgfl
9
EMGactivity from /()-O left \M .....- right .trapezlus
~1//0- --0 left ~
""V. h MJatls. dorsia---I ng t
6 <l.lett ~ .-
/.
•...• right M.erect.splnae ~, //
Subject:Co I' \',"II \
,-0,I
.1>I,I.
I : . ....
Ii{: , ~I'
~.,'I ..4._.. .'
t7 ..-'1''''' --"~/:._ . ....."."..b·-:......,. 'I........ I
.. ~::.::~ ,-Q----~_-:::-:
,.:-- -I
°
~04> .·z
Fig. 2c and d. EMG-force relation of the muscles of one of the sUbjects
suffering from low back pain. The curves are single trials.
Fig. 2c refers to the first trial and Fig. 2d to the second
one.

100
nals the force exerted was measured and recorded. The latter was fed back visually
to the subject by an indicator in order to obtain a constant force (load).Using this method, the contractions were isometric and the posture well defined.The following conditions were applied:
- the body stretched, unloaded- the body bent forward, unloaded
- the body bent and variously loaded.
Six subjects participated in the experiment, three of whom were healthy and threewere suffering from low back pain.Under these conditions two trials were performed. Between the trials a time intervalof at least a few hours was inserted during which the electrodes were removed.
emg-Ioad relation
Fig. 2 presents the EMG-Ioad relation of the muscles mentioned, from z~ro to maximumeffort. Fig. 2a and b show the result of the first and second trial of a healthysubject, while Fig. 2c and d represent the results of a subject with low back pain.Fig. 2c refers to the first trial and 2d to the second.From the results of all subjects, of which Fig. 2 is an example, the following canbe concluded:
The EMG activity of each subject obtained in the first and second trial, is largely the same.
- The EMG-Ioad relation of the muscles involved differs from one subject to another.- For all subjects the EMG-Ioad relation of the M. erector spinae can, within the
reliability of the data, be represented by a straight line. This is not the casefor the M. latissimus dorsi and the M. trapezius. It is our experfence that forrelatively long muscles with long parallel fibres the EMG-Ioad relation seems tobe more linear than for relatively short ones.
- For some subjects the shape of the EMG-Ioad relation of the same muscle left andright differs reproducibly in both trials. This indicates that identical muscles,located symmetrically with respect to the spinal column, should not always beactive in the same measure. In this respect the healthy and the "low back pain"subjects did not differ systematically.
The linear EMG-Ioad relation of the M. erector spinae, obtained under the conditionof "body stretched" enabled a fictitious load at the bar to be extrapolated whichwould cause the same muscle activity as the weight of the trunk in the unloaded bentposition.
The results of the measurements of the individual EMG-Ioadr~latio~sare such thatno systematic difference between healthy and "low back pain" subjects could beestablished.
emg-endurance relation
In Fig. 3a, band c the EMG-endurance relation of the back muscles of one of thehealthy subjects is shown. Fig. 3a represents the relation of the M. trapezius,Fig. 3b that of the M. latissimus dorsi and Fig. 3c the relation of the M. erectorspinae.
The data have been obtained by instructing the subject to exert an upwards forceat the bar equal to a load of about 7S, SS and 30% of the maximum force that he was
able to exert and to keep the force constant as long as possible. To this end thevalue of the output was visualized by an indicator.

101
140120)00806020
+1 EMG activity from M.trapezius
l ' ...........--Ieft side~/ -+ -r-.86 J 1 ___.._right side
ilnQ.75 !,
I"./VrSubject: Co Parameter:P/Pmax
Jl-"
I
~f-*--+ .. , +~. "ltt •---+.-.
W\! t=r- -+1~, I
r-' I I I :.-,·t +---+ ---I--
V"-~vh.. 'A - M~-!
I
1.0
o
:§0.4~(!)
~0.2
1.2
~§0.8
~
~:e 0.6~
14012010080604020
IEMG activity from M.trapezius
i-;...--
2 ............... left sidek-
iI---- - _·-t .- .--....-Hight side
Ofl>L: r Subject: Vr. Parameter:P/Pmax
r-l-~8 1 ' , j f-- ._.f-- f--
;n.,l 1 i • I '
.6~i • I . i I'T'~ I~' T --
i
I-'olso f 'I
1.- tfj..... ,N 0.4b i i,
.4VV ~,J I ! i
I
2~.,-
II !
II 0.25.-.l .. .:.- I
Ic
1.
1.
EMG activity frcmMl.ltissimus dorsi
Q--O---lllef I sid e
~( .9&...........righl side
l/\.c-_
Subj ecl: Vr Parameter. PlPmax
r.r ,u.II
~ ..
~O~1- - i
'P-tI ... ----L-~I I
~~
-_. f--- -.--1-
-- i i 1
I- f---
i-
~~ .. ~. Q.4C' i I ,_.. - I---- - -- f-,
Iwi ./ I'k-< ::: b.25~
....... 'y~~
I
1--- I EMG activity from MJ.atissimus dorsi
I ~leftside
!...-..-right side
i I
11~,
Subject: Co Parameter, PI PmaxI
r't~ t-t I I I- i
~07Ji - f--t-- -
1 I i~ t + ---f-- f---- f- +---
fL:'l . I ,
-', , r + .. r-t-1
----'...-+I
, i ,
I,
II I i , I
f-- e---.. -- -~ I I
0.55 I
I I 1----i-----l--'Ii I 1 . , l~:
~'--' I1 1 I I j I _lv""1
12
1.0
:is 06~ .
~
.~ 04u
'"(!)
~02
a 20 40 60 80 100 120 140
1.2
1.0
~'c::>0.8~IIZ:e 0.6.!!!l:'] 0.4u
'"(!)
ai 0.2
o 20 60 80 100 120 1«l
!EMG aetivi ty from Merector sp' nae
•
~left side
i , .............. righl sidei
Subject Vr Parameter P/Pmax,
t I
-~ ~'~lt-~ f :~o.9!-.
, 1-' ~+-tt-L• 0.7! i ! ii, !
:.a \A I1 1 --r---
~: , ,
~ .... Ql,0,
1'-~" ~ . . , .... lI',~: .. Q25 ,,r.<: Dt-.T ....~. ..........~
~....... ....,. ~-P< ....~ -'.
ii I i
i 1 I I
Uli12010080604020
EMG activity fromM.erector spinae
6----6---4 left sideI
- .. ............... right side
r-J Subject: Co Parame ter: P/Pmax
H-I
I 1- t~+ I --t---
i I I i
!(\U1tlti I ! i i~ f---
~~:m • i i I :-I
M¥.. .", N....10<;<;' i .....-!t': IoN
,.--,.~.~. ..... _..,-..~.
.l- .33'...~
...... r~... ·..·l·· ....- '.-..... ..... ...
Io
1.0
12
140120100804020
1.2
~04u
'"(!)
~G.2
c"08
1.0
oEndurance time (sed Endurance time (seC>
Fig. 3. EMG-endurance relation obtained from t:12 Duck muscles dl::!:"'ing consi.::c.flt loac.ing.The curves are single trials and refer to the M. trapezius (Fig. 3a and d),the M. latissimus dorsi (Fig. 3b and e) and the M. erector spinae (Fig. 3cand f). The Figs. 2a, band c (left side) represent the results of a healthysubject while Figs. 2d, e and f represent the results of a subject sufferingfrom low back pain.

102
During each trial the EMG activity of the M. trapezius, M. latissimus dorsi and M.
erector spinae, as well as the actual force were recorded simultaneously. The pro
cessing of the signals was the same as mentioned under "EMG-load relation".
In Fig. 3d, e and f the EMG-endurance relation of the back muscles of one of the
subjects with low back pain is presented for the same muscles and in the same sequence
as mentioned above.
Comparing the results, it is obvious that the curves in Fig. 3a and d are in good
agreement, apart from the amplitude of the EMG. They are identical to those found by
various authors for a number of other muscle groups (Lippold, 1952; Morrioka, 1964;
de Vries, 1968; Vredenbregt et al., :973).
The S8DE a~]ceme~t can be established between Fig. 3b and 3e. However, between Fig.
3c and 3f there is a small discrepancy. While the healthy subject shows an EMG-rela
tion for the erector spinae muscle, which seems to be less dependent on a loss of
contractibility during the time period of observation, the subject with low back pain
shows a slight increase in the EMG activity, very well noticeable for low values of
the load. In this respect the two groups differs significantly. It ought to be mentioned
that in the "10\.' back pain" group only two subj ects participated in the EMG-endurance
experiments.
discussion
As can be seen in Fig. 1, the force exerted on the bar is transmitted to the spinal
column via the arms and shoulder girdle. The part of the M. trapezius that can trans
mit effectively the force from the shoulder downwards to the spinal column is rela
tively small, through which this part might show some indication of fatigue very soon.
It is this muscle group which shows for all subjects the greatest effect of increasing
EMG activity. Hence, it might be that for all subjects the total encurance time is
determined by the effective part of the trapezius muscle
In the body posture applied, the erector spinae muscles must transmit nearly the to
tal force from the trunk to the pelvis and further to the legs. However, the EMG ac
tivity of these muscles showed hardly any increasing activity for th~ group of healthy
subjects and only a small increase for the group of subjects with low back pain.
One of the functions of the erector spinae muscle is to keep the back in the proper
position rather than move the trunk with respect to the pelvis. So the M. erector
spinae has for an important part the functions of a postural muscle. It is known
that in postural muscles the number of slow fibres (C.fibres) is relatively high
compared with fast operating muscles (e.g. M. biceps) (Smalbruch, 1970).
These slo\\ fibres are less sensitive to loss of contractibility. This makes it possible
for the muscle to exert a constant force over a longer period than a comparable fast
muscle. Whether the relative number of slow fibres in the M. trapezius will be the
same as that in the M. erector spinae or not, is difficult to say.
Another possibility might be that, because in the M. trapezius the available fibers
in the direction of the force are much less numerous in comparison with those of the
M. erector spinae in which all fibres can contribute, the erector spinae muscles
are supposed to be underloaded. Then it is to be expected that, in the posture assumed,
the loss of contractibility during the available observation time (endurance-time)
will be very small.
In the case of the subjects with low back pain, it is to be expected that a number
of muscle fibres of the M. erector spinae are overstretched, owing to many years
of isometric contracting for keeping the trunk bent. This would cause a greater part
of the muscles to be active for compensating the load of the trunk and he~ce a faster
loss of contractibility.

103
The actual force contribution of the M. latissimus dorsi is to be expected to be
small because the direction of the muscle fibres is nearly perpendicular to thespinal column.
It would be desirable to verify the results with those to be obtained with a greaternumber of subjects.
At the same time experiments could then be carried out regarding a position of the
body in which only the M. erector spinae would be loaded.
summary
Electromyographic techniques were used to observe the activity of the back muscles
M. trapezius, M. latissimus dorsi and M. erector spinae, in subjects when standingwith bodies stretched, bent forward, and under various loads.Two small groups of subjects participated in the experiment. One group consistedof healthy people, the other of people suffering from low back pain.Two criteria were studied, viz. the EMG-Ioad relation and the EMG-endurance relation.From the data a linear relation between EMG activity and load was found for theM. erector spinae and a non-linear relation for the M. latissimus dorsi and M. trapezius. The results of the measurements of the individual EMG-Ioad relations are suchthat no systematic differences between healthy and "low back pain" subjects couldbe established. In the case of the EMG-endurance relation a slight difference inEMG activity of the M. erector spinae could be observed.
references
Morrioka, M. (1964) Some Physiological Responses to the Static Muscular Exercise,Rep. Int. Sci. Labour §.1., 6-24.
Lippold, a.c. (1952) The Relation between Integrated Action Potentials in a HumanMuscle and its Isometric Tension, J.Physiol. 117, 492-499.
Smalbruch, H. (1970) Die Quergestreiften Muskelfasern des Menschen. Ergebnisseder Anatomie und Entwicklung Bnd 43, Vol 1, Springer Verlag, Berlin.
Vredenbregt, J. and Basten C.G. (1971) A Modified Small Electromyograph, I.p.a.Annual Progress Report ~, 130-~31.
Vredenbregt J. and Rau, G. (1973) Surface Electromyography in Relation to Force,Muscle Length and Endurance. New Developments in Electromyography and ClinicalNeurophysiology, vol. 1,607-622, Karger Basel.
Vries, H.A. de (1968) Method for Evaluation of Muscle Fatigue and Endurance fromElectro Myographic Fatigue Curves; Am.J.Phys.Med. 1, 125-135.

104
ELECTROMYOPHONEIn the Annual Progress Report nr. 6, 1971 a miniaturized electromyographic (EMG)amplifier was reported which has been very valuable in our researoh work.Combined with a normal portable radio/cassette recorder (Philips Radiorecorder RR512),the amplifier proves to be a handy and simple electromyophone (Fig. 1).A small modification in the recorder allows the amplifier to be connected to it, thebatteries of which are also used to feed the amplifier. The combination enables theelectromyographic activity of the muscles to be made audible and a subject can observe his own muscle activity. This offers the following possibilities:
Fully relaxing of the muscle by minimizing the EMG noise, which, to our experience,is very difficult without any feedback. This is for example helpful in diminishingheadaches.
- Training of the muscle function when for some reason a muscle has been more or lessout of use. This will be achieved by repeatedly increasing the EMG noise of themuscle.
J. Vredenbregt.
/PO annual progress report 7 /972

5 INSTRUMENTATION

105
INTRODUCTION I.P.O. INSTRUMENTATION 1972
D.J.H.Admiraal
The arrival in 1970 of the computer type P 9202 has shown clearly that such a device
does not remove work; on the contrary it attracks work. The mot~vation to buy a com
puter was to be able to control experiments, its use for simulation purposes and fi
nally to carry out computations.For the first application a number of interfaces is necessary as owing to the variousexperiments which mostly make very specific demands of electronic devices. The specialization often goes so far that commercially available instruments do not meet therequirements or they are prohibitively expensive. Besides a computer can be so arrangedthat all the various experiments requiring on-line use of a computer can be carriedput in their respective rooms instead of in the computer room. For this purpose digitaldata transport from the computer to every laboratory room in the Institute and vice
vepsa is necessary. At the computer end the interfaces for data transmitter and re
ceiver were realized already in 1971, as mentioned by Muller in the IPQ Annual Progress Report No.6 - 1971.
The transmitter and the receiver in the experimenter's room is call~d MARIE, a Dutch
abbreviation of "Modulaire Aanpassing tussen Rekenmachine Interfaces en een Experiment",
in English, Modular Matching Unit between Computer Interfaces and an Experiment.
The design of MARIE is correlated to the requirements of the experiment itself, e.g.in an auditive experiment where tonebursts with a certain carrier frequency are presented, their number, their frequency and intensity can be controlled automaticallyand responses be recorded. The construction of MARIE is in its final phase and the
device will be described in the next Progress Report.
The well-known principle of Pulse Width Modulation has been used in our laboratoryfor linear modulators in the form of signal gates for auditive, phonetic, and visual
purposes. A survey of various gate systems and circuits has been described by Admiraal
in the 1971 issue of the Progress Report. Now the same principle has been applied in
driver devices for what are known as Sylvania Glow Modulator Tubes. Analogous circuits
have been used for the purpose as described by Alewijnse in the Progress Report No.4
- 1969. Because of the non-linear relation between light output and tube DC current,
a diode correction network in the feedback path was introduced for compensating pur
poses. The current of the tube is switched on and off by the PWM method according to
a fixed frequency of, e.g., 1000 Hz or more. The non-linear characteristic of the tube
as mentioned above is of no account with this 0-1 modulation method.
This results in a simple circuit without critical adjustments. The properties of the
device are adequate to most of the visual experiments done in the Institute.
If necessary a light feedback can be introduced, suppressing almost completely the
influence of the temperature of the tube on the light output. A description of this
apparatus is given elsewhere in this issue.
The employment of the electromyograph, described by Vredenbregt and Fubini in the
Progress Report No.4 - 1969 and in a more evaluated version by Vreden0regt and
Basten in Report No.6 - 1971, has assumed such large proportions in the study of
complex motoric activities that a processing device for 6 channels has been developed.
All provisions required for proper operation have been made such as a vacuum pump,
vacuum tubes for the suction of the electrodes, power supply etc.
/PO anlJual progress report 7 /972

106
There are two measuring methods:
a) lowpass filtering of the double-phase rectified signal,
b) integration of the same double-phase rectified signal.
The device is discussed in this issue.
An original design for specific requirements in pattern recognition studies, developed
in conju!lction with members of the IPQ visual group, is the Photomatrix Computer Inter
face. It is discussed in this issue and it aims at on-line registration of optical
configurations with the help of a 16 x 16 photomatrix.

107
A PULSE-WIDTH LIGHT MODULATOR
M.A.Alewijnse
Introduction.
In visual experiments where a modulatable light source is needed, often theSylvania Glow Modulator tube R1131C is employed. Its use, however, poses sometechnical problems in designing driving circuits because of the non-linearity ofthe light output versus the beam current of the tube. This non-linearity resultsfrom the following effects:- Non-linearity of luminance versus current.
Shift of spectral distribution causing additional and varying non-linearity ofluminance versus current , depending on the bandpass wavelength of monochromaticfilters, used to prevent colour shift of the stimuli presented to the eye.(Fig. 1a).
- Temperature drift of luminance, which is especially disturbing when switchingfrom low currents to high currents, or the reverse (Fig. 1b).
100%Sylvania R113lC
Glow Modulator Tubec
G> 'Ev .3ca 0c
IIE.3 Measured via:..,~
!ed, Qreen or0~ !Iue filters
00 -- Current 30mA o
!-2 minutes
Fig. la Relative luminance versus current measured via different monochromatic
filters.
b Temperature drift of luminance. Luminance may vary by about a factor 1.5
during the first minute after switching to another steady-state condition.

108
Experiments and accurate description of the stimuli are disturbed by these effects;therefore driving circuits have to be so designed that these effects are minimized.
A few years ago a purely analogue voltage-to-current convertor to drive Glow Modulator tubes was described (Alewijnse, 1969). Non-linearitieswere compensated eitherby means of non-linear feedback, or at choice, by means of light-feedback.Last year some experiments were carried out applying pulse-width modulation (PWM) ofthe tube current, initiated by some remarks in the literature (Troelstra, 1971).The principal advantage of PWM is that it diminishes greatly the difficulties associated with the non-linear characteristics and also the colour shift. The remainingtemperature effects can be fully compensated by means of a simple photodiode lightfeedback circuit.
>1 Tm I<
'"vCoc°e::l.....
-- Current
Current Pulses
30mA
light Pulses
Tm« Tp
o_-fv
Fig. 2 The principle of Pulse-width Modulation, applied to the Glow Modulator tube.
With PWM only two points of the characteristic of the tube are used (Fig.2) thezero-current point and a point in the high current region (3D-SOmA). The tube isswitched on and off between these points at a frequency of about 1kHz and the dutycycle of the switching process determines the mean light level seen by the eye.So low-frequency modulation of the pulse-width is interpreted subjectively as a modulation of the mean light level, while at analogue modulation a purely objective modulation of the luminance is presented to the eye. Nevertheless, it may be expectedthat the perceptual effects of PWM or analogues modulation are equivalent.Because of the restricted bandwidth of the Glow Modulator tube, the pulse-carrierfrequency can not be chosen much higher than 1kHz. Therefore, the modulation bandwidth is restricted to about one-tenth of 1kHz. But in visual researeh this bandwidthis sufficiently large.
operating principles
Fig. 3 shows the basic set-up of the PWM circuit. It consists of a free-runningsawtooth generator determining the PWM carrier frequency, an input amplifier, a comparator, a tube-driver transistor acting as an on-off switch, and a low-pass filterfor inspection of the modulation process. A feedback circuitry is incorporated toprovide a stable and linear PWM converting process.

109
R1131CSawtoothGenerator
1kHz
+200V
rc-----4Llt--;---<l> uV /W--r- -
t I I ;
~] iU ;l~~mA% h
~LJ--+-L-J---r-LJ-----_....!...l.l~-[S)--. '\ 2V: 0 2J I I L200Hz
t Light Feedback
Fig. 3 Basic set-up of the PWM circuit for the Glow Modulator tube.
The sawtooth generator is a simple operational amplifier integrator circuit, provided with automatic reset. The sawtooth frequency has been chosen about 1kHz.The maximum current through the output transistor is limited to about 3SmA. A pulsewidth range from 0.008 to 0.8ms corresponds to a mean current range from about0.3 to 30mA. At pulse-widths shorter than about 0.008ms the amplitude of the lightpulses decreases because of the restricted bandwidth of the Glow Modulator tube.At pulse-widths shorter than about 0.1ms the colour of the light tends to red.The comparator converts the sawtooth voltage and the output voltage swing of theinput amplifier into a PWM signal, driving the output transistor on and off.The PWM current through the output transistor produces a PWM voltage across theemitter resistor. The dc-component of this voltage is roughly filtered out by meansof network RC Z and fed back to the input amplifier via resistor R. Together withthe stronger integratory action of capacitor C1 across the input amplifier an overalllow-pass characteristic is obtained, identical to that of the active low-pass filtershown in Fig. 4.
4 N321.6.84.5
Uj = -6dBdB
0+--------1.-
-3
-6
fa =_1_27tRC2
n = Cl(2
N - .!.- fa
A= I~I =
Fig. 4 Active low-pass filter having the same characteristics as the PWM system.
The frequency response of the PWM system, however, not only depends on the RC timeschosen but also on the sensitivity of the PWM convertor. This sensitivity is inversely proportional to the amplitude of the sawtooth voltage. In the circuit of Fig. 4this sensitivity amounts to a certain amplification or attenuation, indicated by afactor'S'. It is possible to make S= 1 at a certain sawtooth amplitude. In this

" 0
case there is aoneto one relation between the swing of the dc-component of thePWM signal at the feedback point of the output stage and the input swing at the comparator. But at other sawtooth amplitudes S will be different from', thus influencing the frequency response curves in the samewayasachange of n=C,/C Z would do.Two useful low-pass characteristics were realized, shown in Fig. 4, one causing noovershoot in case of pulse modulation (80Hz,-3dB) and one maximum flat responsecurve (160 Hz,~3 dB), causing about 5% overshoot in case of pulse modulation. Thisflat characteristic is primarily intended for use with sine-wave modul~tion. The twocharacteristics are obtained only by switching another value of C, into the circuit.The intensity or mean current control is realized by means of an adjustable dc-levelfrom potentiometer P (3-decade thumbwheel switches with a netwDrk of resistors), fedinto the input circuitry.The whole circuit, together with a simple unregulated ZOO volt supply is built intoa small plug-in unit, intended for use in our modular frame systems. The 1Z voltregulated supply is already available in this frame.
light feedback
The light-feedback has to compensate the temperature effects on the light outputonly. Fig. 5 shows the set-up of the light-feedback system, placed in a small housingtogether with the Glow Modulator tube and some optical arrangements. A small part oflight is picked up by a silicon photo-diode provided with a blue filter to preventan overestimation of the red part of the light spectrum.
r- ----- - - - -----,I Len. I
:=II R1l31C 1,.----At --1 .
- i=Uugh,:~tJV1--_: r::I Photodiod~
I I
.. I Electronic. I: I
----------------~
Fig. 5 Light-feedback system.
Out
The PWM photo current generated by the photodiode is amplified and integrated to a
rough value of the mean light intensity by filter RC 3 . This signal is fed back intothe input circuitry of the PWM circuit. The internal current feedback factorof the PWM circuit is lowered by about a factor 7 to provide the same input sensitivity as without light-feedback. The RC time of the filter RC 3 is also adapted tosuch a value as to obtain the same overall low-pass characteristics. The lightfeedback fully compensate the temperature effects, shown in Fig. lb. The harmonicmodulation distortion, with or without light-feedback is below 1%.
conclusion
The PWM system can indeed compete with the analogous set-up as regards simplicityand technical features. Visual experiments will be carried out to find possibleperceptual differences between the two systems. Especially the aspect of the colourshift within the entire modulation range will be of interest in this experiments.If two or more PWM systems have to be used together in one experimental set-up, itis advisable to couple the carrier frequencies in the well-known master and slaveoperation to prevent visible low-frequency beats. The application of PWM will be alsouseful for driving Xenon compact sources.

1 11
technical features
PWM carrier frequency
Modulation rangeModulation bandwidth
Modulation input
Harmonic distorsion
Control filterLight-feedback
summary
ca. kHz
0.3 - 30rnA (0 - 35 rnA max.)o - 80 Hz,-3 dB 0% overshoot
o -160 Hz,-3 dB 5% overshoot
1 V peak to peak for 100% mod. depth at 15 rnA,across 600 Ohm or 50 kOhm. Phase or anti-phase.< 0.4% at 95% mod. depth
< 0.1% at 50% mod. depth
ZOO Hz,-3dB,18 dB/oct: Bessel characteristic.via silicon photodiode with blue filter.
The glow modulator light source used as the stimulus in visual experiments hasa non-linear light output characteristic. To reduce this nonlinearity the glow modulator tube may qe driven in a way known as Pulse Width Modulation. This 'principlehas been realized in the described instrument. It is supplemented by a light feedback system reducing temperature effects.
references
Alewijnse, M.A. (1969), A Modular Two-channel Light Modulator, I.P.O. AnnualPyogress
Report ~, 169-171.
Troelstra, A (1971), Harmonic Distorsion in the Frogs ERG, Vision Research,
Volume g, 394.

112
A 6-CHANNEL ELECTRO-MYOGRAPHIC MEASURING SYSTEM
M.A.Alewijnse and J.vredenbregt
The electro-myographic signals picked up at the skin from an active muscle are
very much like low-frequency noise with a spectral maximum at about 80 Hz.
To evaluate the relative amplitude of such an EMG signal a well-known representation is given by the integration of a rectified EMG signal. Another often usedtechnique is low-pass filtering of a rectified signal. Fig. 1 shows the two methodsof measuring technique and the resulting output signals.
!IEMGldt
-- 0Integrator
Rectifier
1-100x
IIIIII
: AmplifierI
~------------ -_.-:.- ------,
r-------- -- -- - - -----.,I Measuring Circuitl _. Law.pass
I FilterEMGl
r---------MYOGRAPH
! L __ -- ---1--'vacuum ·±6V
Fir. 1. Myographic :neasuring system. The output signals shol-ln Gorrespon::' to stc",
like EMG acti,ity bursts (qualitative).
Both measuring techniques only differ in the way of representation of the EMGactivity. In case of integration the slope of the output signal represents thedCGrcc of muscle activity, while in case of low-pass filtering the representationis given hy the amplitude of the output signal.
{PO annual progress report 7 /972

11 3
to be chosen as small
small variations in themucb ripple on the out-
the low-pass filter have
in the representation of
small RC times cause too
RC times, both of the integrator and
as possible to prevent too much loss
EMG activity. On the other hand, tooput signals.Especially with short step-like EMG activity bursts, integration may be more favourable than filtering, but in general both measuring techniques provide the same information. A disadvantage of the integration is that it needs more processing afterregistration.
At the lPO, small myographic units provided with vacuum suction cup electrodes anddifferential amplifiers are used for picking up the EMG activity from the skin (Vredenbregt, 1971). Especially for these 'myographs' a six-channel measuring system hasbeen constructed, in which use is made of the Philips modular frame system (see photograph). The measuring system makes possible simultaneous detection and processingof the EMG activities from different muscles in studying complex movements, for instance handwriting. The system contains the measuring circuit shown in Fig. 1 andalso provides the supply voltages and the vacuum for the myographs.
The main plug-in unit incorporates all general functions:- a membrane vacuum pump, regulated by a small variac,
- a battery pack of rechargeable NiCd batteries, plus and minus 6 volts,- a charging unit, and
- a measuring circuit and front panel meter enabling individual measurement of therms values of the EMG signals and battery check to be made.
Only the vacuum pump is connected to the mains supply. All other circuits includingthe myographs connected to the system are supplied by the battery pack to preventdanger to subjects.
The charging unit is connected only if charging has to take place, during which thesystem is not available for measurements.
The system also contains three small plug-in units, each provided with two indentical measuring circuits. Each channel has its own electrical and vacuum connectionto a myograph. Battery and vacuum supply can be switched on and off per channel toprevent vacuum leakage and loss of electric power. Fig. 2 shows a more detailedcircuit diagram of a measuring channel.
EMG llJo
IN -Ihr----t.tIx• 2 R
R=IOOk
Op.amps. \lA7~1
JllmsResetpllises _-...1.--
IEMGI
One
Shot
30Hz 18dB/oct
IEMGI
r-t-----/I EMGldt
oAV
RC=.05s
Fig. 2 Circuit diagram of an EMG measuring channel.

114
Each channel consist of:
- a variable amplifier, amplification 1-2-5-10-20-50-100 x at choice,
- a linear double-phase rectifier circuit,
- an active low-pass filter, cut-off frequency 30 Hz,18 dB/oct. (Butterworth
characteristic), and
- an 'ideal' integrator circuit, RC time 0.05 s, provided with automatic reset at
an output level of 4 volts.
All output signals as well as the reset pulses of the integrators are available
on the front panel connectors.
The rear panel of the frame contains the plug-in connectors for electric power and
vacuum supply. A vacuum buffer tank is also mounted on the rear panel.
In the set-up described all integrator circuits reset at random times, depending
on the individuel differences in EMG activities. In some cases it might be better
to apply the principe of the 'first arrival' in such a way that the integrator
which reaches its reset level first, resets all other integrator circuits, thus
providing a clearer picture on the recordings.
It is also possible to use the system on-line with the computer for direct analysis
and comparison of the output signals.
The front panel meter on the main unit is primarily used for calibration and align
ment of the overall sensitivity of the measuring channels.
summary
An apparatus is described for the derivation of electromyograms of several muscle
groups simultaneously. Up to six electromyographs may be connected to the unit,
which provides either integration or low-pass filtering of the signals.
In addition it supplies the vacuum needed for the suction cup electrodes of the
myographs. The unit may also be used in field work by means of a rechargeable
battery pack.
references
Vredenbregt, J. and Basten, e.G. (1971) A modified small electro-myograph,
I.P.O. Annc31Progress Report 6, 130-131.

11 5
PHOTOMATRIX COMPUTER INTERFACEon line registration of optical configurations for visual pattern recognition
P.WVerhagen"and M.A.Alewijnse
introduction
Research on human pattern recognition has led to several hypotheses on the analyzing
properties of the visual system. An important theory has been put forward by Hubeland Wiesel (e.g.1965) based on physiological experiments. They found cells in theanimal visual cortex that were sensitive to the orientation of a line or edge projected on a part of the retina connected to such a cell. Starting from further research,they supposed these direction-detecting cells to be a part of a hierarchically analyzing mechanisN. Bouma and Andriessen (1968, 1970) of our Institute supposed fromresults gained with psycho-physical experiments on human slant perception that, in caseof simultaneous excitation of many such cells, the cell with maximum excitation decidesthe perceived orientation of the stimulus. Research on human pattern recognition is,however, still in its initial phase. In this situation the need was felt for a modelmaking possible simulation of such hypothetical analyzing functions of the visualsystem. A few years ago Cosijn and Hoeks (1970) built a model in hardware, consis-ting of 16 light sensitive cells (LDR's) together with some electronics circuits.
" Student at the Eindhoven University of Technology.
/PO annual progress report 7 /972

11 6
Their apparatus essentially 'recognized' one out of 4 orientations of the stimuli
projected in the receptive field (horizontal, vertical, and + or -45 degrees), in
dependent of stimulus position in this fieldIn carrying on this kind of work, a choice had to be made between hardware and software models. Pure hardware models necessitate fairly complicated electronic circuits,the sheer number of which leads to voluminous constructions. These are not flexiblein the sense that modifications are difficult to realize.On the other hand a purely software model is not attractive because of the problemsencountered if complex stimulus patterns have to be programmed. So it was decidedto build a hardware receptive field consisting of many light sensitive cells,connected on-line to a computer through a special interface. The hardware part of thesystem is purely passive, it only converts light into voltages compatible with thecomputer system.
AnJlysis of the voltage patterns resulting from a certain stimulus configurationprojected on the receptive field will be performed by appropriate software programs.In this way it is possible to experiment in an easy and tangible way with manydifferent, simple or complex, stimulus configurations; in addition, the model itself,now being a software computer program, is easy to modify.The matrix input to a computer has, of course, a much wider application than just forthe detection of a slant.
practical design
The 1-'9202 computer in use at our laboratory is provided with a modular Input-OutputSystem (MIOS), described in the previous issue (Muller, 1971).It contains 16 analogue and digital input and output modules.
For our purpose only the 16 ~nalogue inputs (AISM) and the 16 ~igital Qutputs (DOSM)are of interest.
Because of the number of inputs available, the receptive field is built as a 16x16matrix, consisting of 256 silicon photo-transistors (BPX29).Each column of the matrix is connected - via the interface amplifiers - to one of theAISM inputs. By switching on row after row of the matrix by means of the digital outputinformation programmed, all matrix elements are successively connected to the AISMfor reading in the corresponding voltages of the column amplifiers.So the photomatrix and the interface have two general functions:
- Translation of the luminances on each receptor cell into appropriate voltage levelsfor the 16 analogue input channels of the MIOS.
- Translati~n of the 16-bit digital output information of the MIOS into operationalfunctions, e.g. switching the rows of the matrix, setting the amplification of theculumn amplifiers, displaying the detected presence or absence of certain configuration properties, etc.
Fig. 1 shows the set-up of the system in general.

1 17
DISCSP9202
MIOS COMPUTEfl
16 bit1-~_':::""-4:--"'"DOSM
516 x 16
MATfllX
16 16 anal.outputsI--~H-t--~7'>---...--__~---.. AISM
'----'__---J
PHOTOMATfllX UNIT
Fig. 1 General set-up of the system.
For practical reasons a part of the interface is incorporated close to the photomatrix. The photomatrix unit actually consists of 3 printed circuit boards, onecontaining the matrix on the front of the unit. The second contains 16 electronicswitches (FET's) together with a decoder circuit, and the third 16 column preamplifiers. Fig. 2 shows the lay-out.During the investigations we received information on commercially available integrated photomatrices from Reticon Inc. For our purpose however, these circuitsare unnecessarily small, and, moreover rather expensive.
Fig. 2 Close-up of the photomatrixand lay-out of the matrix unit.
For the conversion of luminance intovoltage we used the well-known linearphotometer circuit shown in Fig. 3a.Here, a silicon photo-diode is connected to the feedback input of a simpleoperational amplifier. The diode current produces an output voltage acrossthe feedback resistor, proportional tothe light intensity on the diode.Because the dc-voltage across thediode is approximately zero, influenceof temperature and leakage is negli
gible. Such a simple circuit is linearover about 3 decades of luminous intensity.
In one column of the 16x16 matrix, 16 photo-diodes can be connected to the samepreamplifier, but each diode has to be provided with its own on-off switch, makingfor an unacceptable number of 256 switches. This can be avoided when a normal diodeis placed in series with each photo-diode (Fig. 3b). The diode prevents leakagecurrents to and from other photo-diodes in the same row, resulting in only oneswitch per row.
Such a series diode is also formed by the base-emitter junction of a photo-transistor, which is in this case a normal npn-transistor mounted together with a photodiode, connected between collector and base (Fig. 3b).

1 18
The collector of the photo-transistor needs a few volts for suitable operation.
The photometer circuit has, therefore, to be changed in the way shuwn in Fig. 3c.
The additional resistors in the circuit make the collector supply possible without
causing a dc-shift of the output voltage.Owing to the current amplification of the transistor the circuit is much more sensitive with respect to the photo-diode circuit, but also more sensitive to changesof temperature. This, however, causes no trouble in practice.Fig. 3d shows the set-up of a simple 2x2 matrix as an example. The actual 16x16matrix is built up according to this principle, providing 16 preamplifiers and 16switches. All photo-transistors have the same collector voltage of about 3 volts.Spread of transistor data (although selectioned) causes different sensitivity andgradient between the recentors for which a correction is made in the computerprogram.
The FET switches are operated by appropriate gate voitages to provide a pure on-offfunction. These voltages are delivered by a decoder receiving 4 bits from thedigital output of the MIaS. One extra bit is used to switch offall the rows as wellas the collector voltage of the photo-transistors, thus enabling the offset voltages
at the amplifier outputs to be measured for correction purposes.
-01....---- Row 2
Column2 ~ AISM
-..--------I.....,jo----- Row 1
Column 1
R
Uo= IfXR
2 Uc - ....-C=r--1
o
\
Fig. 3a Basic photometer circuit with photo-diode.
3b Photo-diode with series diode, photo-transistor.
3c Photometer circuit adapted for application of a photo transistor.
3d Simple 2x2 matrix
All signals to and from the computer are handled by the interface. This unit contains:
- A regulated power supply for all electronic circuits, including the photomatrix.

119
- 16 Line amplifiers, the amplification of which can be varied in six steps, iden
tical for all amplifiers, by manual control or automatically by means of 3 bits
from the digital information from MIOS. This makes possible the use of the photomatrix at very different light intensities.Automatic adjustment of the amplification is realized by means of a subroutine inthe program. The process starts from the highest amplification. If, during readingthe matrix, overloading is detected on one or more outputs, the amplification isautomatically adjusted to a lower value, and this continues till the overloadinghas disappeared.
- A bank of preset thumbwheel switches providing a range of constant voltages viathe amplifier outputs. These voltages are used in the program as operational constants or for interruptions or alterations in a running program. Reading of theconstants is performed during the time the photomatrix is switched off, and, duringreading the matrix these voltages are automatically set to zero, thus not affectingthe matrix output levels.
- Digitai circuits receiving and translating the digital information programmed.The 16 bits available are used in the following way:
Bit Nos. 1-4 switching on and of the rows of the matrix successively.Bit No. 5 switching off the matrix for reading offset voltages.Bit No. 6 switching off the matrix for reading of preset constants.Bit Nos. 7-9 setting the amplification level.
Bit Nos.l0-16: not in use yet, reserved for driving a hardware display.The operational bits 1-9 can be inspected by an octal LED-display, mounted on the
front panel of the interface (See photograph at top).To correct for the individual differences of the matrix cells a testprogram is madeproviding a correction matrix which is always available by means of the computerdisc memory. Such a matrix is derived by computing the least-squares line througha number of measured points on the characteristic of each matrix cell, correspondingto different levels of illuminance, e.g. 10-100-1000 lux. The individual line ofeach cell is then translated into a standardized line by computing the correctionfactors for slope and zero-level. Thus, a uniform illumination of the photo-matrixresults in 256 computed numbers related to the individual output voltages of thematrix cells spreading only a few per cent.
Testing and trial experiments can also be done off-line, to reduce computer time.
acknowledgement
We thank Mr. H.Hendriksen, student at the Technical Highschool of Zwolle, who joinedus for 3 months to make the Photo-matrix Interface and to test the electronic circuits.
summary
For the simulation of recognition processes of the human visual system a receptor
field has been developed, the output of which can be analyzed on line by a computer.
The receptor field consists of a 16x16 matrix of phototransistors with sWitchingand amplifying electronics incorporated. It is connected to the analogue and digitalI/O system of a computer, by means of an interface.
The interface decodes the instructions of the computer program and controls the
operations of the receptor field. The analysis of optical configurations presentedto the receptor field may be performed by appropriate programming techniques.

120
references
Hubel, D.E. and Wiesel, T.N. (1965) Receptive Fields and Functional Architecture
in two Nonstriate Visual Areas (18 and 19) of The Cat. J.Neurophysiol.~,229-289.
Bouma, H. and Andriessen, J.J. (1968) Perceived Orientation of Isolated Line Segments,
Vision Research, ~, 493-507.
Bouma, H.and Andriessen, J.J. (1970) Induces Changes in The Perceived Orientation
of Line Segments, Vision Research, lQ, 333-349.
Cosijn, A.J.M. and Hoeks, A.P.E. (1970) Richtingsdetektie door middel van een Elek
tronisch Model en een Computersimulatie,I.P.O.Report 194
Muller, H.F., (1971) Computational Review I.P.O.Annual Progress Report §., 128-129.

6 IPO PUBLICATIONS 1972

6 IPO PUBLICATIONS 1972
1 21
P 217
P 218
P 219
P 220
P 221
P 222
P 223
P 224
P 225
P 226
P 227
P 228
P 229
P 230
P 238
J.A.J. Roufs
J.A.J. Roufs
J.P.M. Eggermont
J. F. Schouten
M.J. de Vriendt- De ManS. de VriendtJ.P.M. EggermontJ. van NesM. Wambach
I.H. Slis
A. van Katwijk
D.J.H. Admiraal
F.1. van Nes
J. Eggermont
J. Vredenbregt
H. Duifhuis
A. van Katwijk
F.1. van Nes
J. 't Hart
Dynamic Properties of Vision - I : Experimental Relationship between Flicker andFlash Thresholds.Vision Research ll, 1972, 261 - 278.
Dynamic Properties of Vision - IIThecretical Relationships between Flickerand Flash Tresholds.Vision Research ll, 1972, 279 - 292.
Systematiek in de verwarring bij het spraakafzien.Taalwetenschap in Nederland 1971, 131 - 138.Universiteit van Amsterdam 1972.
Waan, Waarneming en Werkelijkheid.Organorama 8, 1971, 13 - 17.Also appeared in English, German, Frenchand Spanish.
Methode audio-visuelle de Neerlandais IExcersises de Reemploi.Marcel Didier, Paris 1972.
Enkele aspecten van de produktie en waarneming van spraakklanken.Boerhaave cursus : Afasie - Behandelingvan Afatische Patienten. 10-14 april 1972,48 - 50.
Een goed verstaander heeft maar een halfwoord nodig : de vraag is welke helft ?1e 1angage et 1'Homme, 1972, nr. 18, 15 - 19.
Een tienkanaals Fourier-synthetisator :De pilnsfluit.
Polytechnisch tijdschrift ~, :972, 278-285.
Determining Temporal Differences withAnalogue and Digital Time Displays.Ergonomics ~, 1972, 73 - 79.
Some aspects of the Speech Reading ProcessProceedings of the International CongressonE d u cat ion 0 f the De a f ,Stockholm 1970, Volume I, 173 - 182.
Ein Muskelreizgerat fur ein-und doppelseitigGehbehinderte.5. Internationaler Kurs der SchweizerischenArbeitsgemeinschaft fur Prothesen undOrthesen CAPO) Zurich.Georg Thieme Verlag, Stuttgart, 1972,85 - 87.
Peripheral Aspects of non-simultaneousmasking. Proceedingsof the Symposium onHearing Theory, Eindhoven, 1972, 16 - 26.
Faktoren in de waarneming van klemtoon.Verslagen van de voorjaarsvergadering vande Ned. Ver. v. Fonetische Wetenschappen.p. 29 - 34.
Motor Programming and errors in handwriting.Proceedings of the Symposium on "Neurophysiology in Man", Paris, July 1971.
Intonational Rhyme. Paper presented at thethe Symposium on Intonology, Prague 6-8 oct.1970.Acta Universitatis Carolinae - Philologica1, Phonetica Pragensia III, 1972, 105 - 109.

P 239 A. van Katwijk
122
On the Perception of Stress. Paper presented at the Symposium on Intonology,Prague 6 - 8 oct. 1970.Acta Universitatis Carolinae - Philologica, 1, Phonetica Pragensia III, 1972,127 - 135.
DOCTORAL THESES
H. Bouma
H. Duifhuis
R. Collier
S.G. Nooteboom
Receptive Systems Mediating CertainLight Reactions of the Pupil of the HumanEye.University of Technology, Eindhoven,January 1965.also appeared in:Philips Research Reports Supplements 1965,5.
Perceptual Analysis of Sound.University of Technology, Eindhoven,February 1972.
From Pitch to Intonation.Catholic University of Louvain, June 1972.
Production and Perception of VowelDurations A Study of Durational Propertiesof Vowels in Dutch.University of Utrecht, October 1972.also appeared in:Philips Research Reports Supplements1972, 5.