nrao · nrao summer student lecture notes lawrence rudnick july , 1978 cosmic background radiation...
TRANSCRIPT
NRAO
Summer Student Lecture Notes
Lawrence Rudnick
July , 1978
COSMIC BACKGROUND RADIATION
The Earth is bathed in an ocean of radiation in addition to that from
discrete sources in the sky. The radiation is of very low intensity; it is
equivalent to the radiation expected from a blackbody at about 3°K. But we,
and the known Universe, are "inside" that blackbody, it fills all space around
us. The prediction of this cosmic blackbody radiation, and its subsequent dis-
covery (or vice-versa) is one of the great milestones of cosmology.
If we accept the current understanding of this radiation, then our obser-
vations give us a picture of the distant (and past) Universe - a look at the
time before there were stars, galaxies, clusters, quasars, or anything else we
now observe.
It has been an exciting year in the study of the cosmic background. Its
fundamental characteristics have been laid out with great certainty. It is
hoped that this cosmic laboratory will allow us to understand some of the history,
and thus the future of the Universe.
This lecture will deal with the prediction and discovery of the background,
its radiation spectrum, and its large and small-scale isotropy. Much of these notes
has been unabashedly lifted from two excellent, and highly complementary sources -
Gravitation and Cosmology, S. Weinberg, and Physical Cosmology, P.J.E. Peebles.
I hope mostly to give you a flavor for this field of study - you can take it from
there. A short bibliography is given at the end of the notes. See me for more
detailed or current references.

Prediction
In 1934, Tolman studied the behavior of radiation in an ex-
panding universe. At the time, the calculation was a theoretical
one; there was no real reason to suspect that a radiation field
filled the universe. The result of this calculation was that,
given an initial blackbody spectrum of temperature To at epoch t o ,
then there will exist a blackbody spectrum of temperature T1 at
time tl, such that
T = To R(to)/R(tl),
where R(t) is the scale factor of the expansion. We can understand
this result in a heuristic way by the following argument, similar to
one used in studying the thermodynamics of ideal gases. Imagine a
cavity with perfectly reflecting walls. Let the size be much less
than the size of the visible universe (i.e. zC cH-1). Then, if we
allow the box to expand, without creating or destroying any photons,
we find that the photon gas must cool. This can be thought of as
the result of doing work in expanding the box. Another way to
think of it is that, in a perfectly reflecting cavity, the radia-
tion field can be expressed as made up of a superposition of normal
modes, where each mode has an integral number of wavelengths in
the box. But as the box expands, A4-t) < R(~ o- for each
mode n. Since Planck's formula for a photon gas says that the num-
ber of photons per mode is given by ,is/77 7 /
then the temperature must decrease linearly with the frequency, and
-2 -
hence, as the scale factor of the expansion.
Based on this theoretical background, Gamow and Alpher, in
194J, studied th problem of the production of the elements. There
are.a number of reasons why their analysis was wrong. However, the
thought processes are interesting, and worth reviewing. Besides,
they got the right answer. Some earlier treatments of the prob-
lem had been made, assuming that element formation took place in
a static, equilibrium situation at some hot stage of.the universe.
With the current view of a continually expanding universe, Gamow
and Alpher decided to attack the problem again. They suggested that,
at high temperatures, only free -neutrons, protons, and electronscould exist. The key factor in building up the heavy elements is
the formation of deuterium, according to the reaction
n+ p - d + 7
However, at high temperatures, the reverse reaction (photodissociation)
breaks up all the deuterium. At about 109 K, deuterium can begin to
accumulate. Gamow argued that at around this temperature, there
must be an appreciable chance of n's and p's colliding, so that the
reaction could take place. Not too great, however, because we still
want the universe to consist mainly of atomic hydrogen. The calcu-
lation they went through was somewhat like setting
d nvt 1
where.d is the neutron proton cross section, v, the mean thermal
velocity, t, the time available at that temperature, and n, the
density, all to be determined at the time when T ~ 10 K. Since-4
radiation energy density varies as R(t) , it dominates the matter
energy density, which goes as R(t) 3 at early times. Thus, the
dynamics of the expansion can be found from the temperature of the
radiation alone, and knowing O and v, n was calculated to be
S108 nucleons cm- 3. By the time n gets down to 10-6 cm 3 ,

-3-roughly th96urrent density, T 10 K. Alpher and Herman refined
the calculation, and got T * 5 K. Problems with this argument in-
clude the objection that element building stops at the mass 5 gap
above helium in simple expanding universe models, and that the
neutron-proton ratio was probably only about 0.2 at the proper time.
With the explanation of element formation as part of stellar evo-
lution, this line of argument was dropped, and the idea of a pri-
meval fireball neglected until the early 1960's.
In 1964, Dicke was concerned with the singularity at which
all the mass energy of the universe originated, and-at which the
expansion began. He preferred to relegate the origin of mass energy
to an earlier phase of the universe, which then goes through suc-
cessive oscillations. However, in order to destroy the heavy ele-
ments from the previous oscillation, he needed a hot phase. of the
10universe, around 10 K. The fireball was reborn.
Discovery
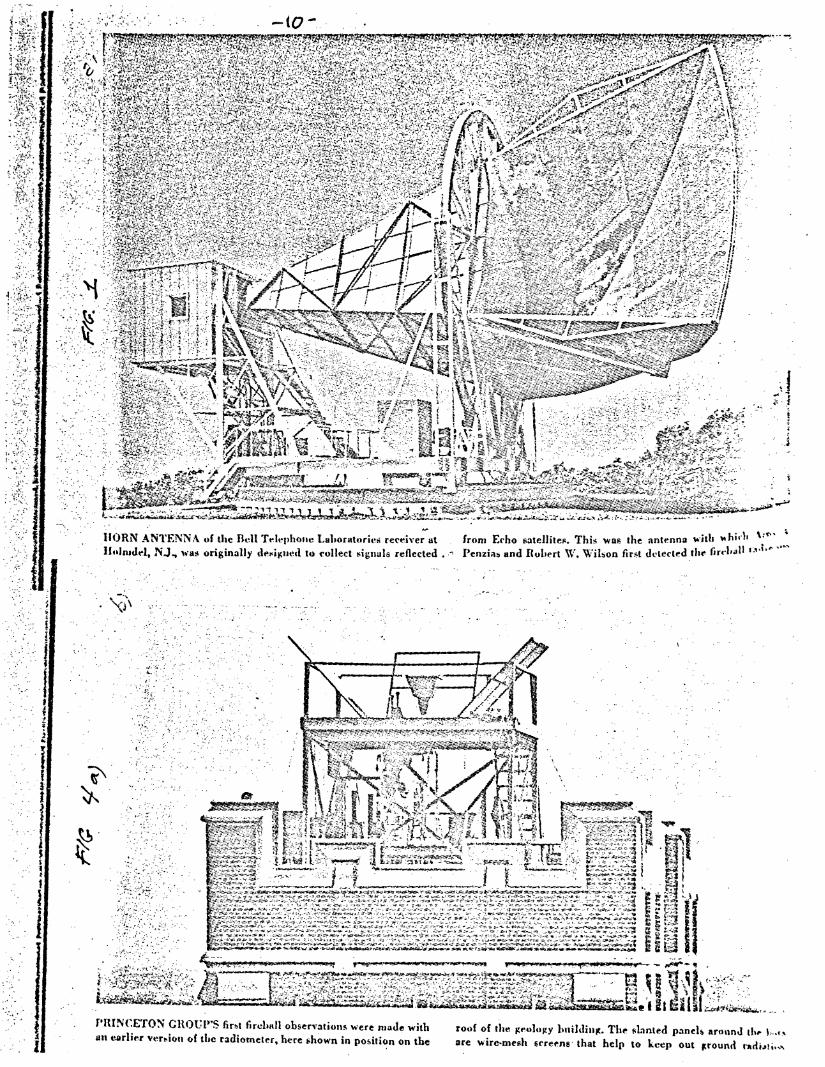
At the Holmdel, N.J. laboratories of Bell Tel, Penzias and
Wilson constructed a large horn antenna (Fig. )- designed to re-
ceive signals from the Echo satellite, at a wavelength of 7.5 cm.
They were trying to track down all possible contributions to the
system noise, and were unable to account for about 3.5 K. The
group at Princeton had already begun the search for the remnant of
the fireball, and realized the significance of the Penzias and Wilson
result. They visited the Holmdel labs, and in 1965, published
companion papers, the first entitled "A Measurement of the Excess
Antenna Temperature at 4080 MHz", and the second an explanatory one
by Dicke, Peebles, Roll and Wilkinson. But was this excess radia-
tion truly the remnant of a primeval fireball? A few critical ex-
periments had to be done.
.4.
Spectrum
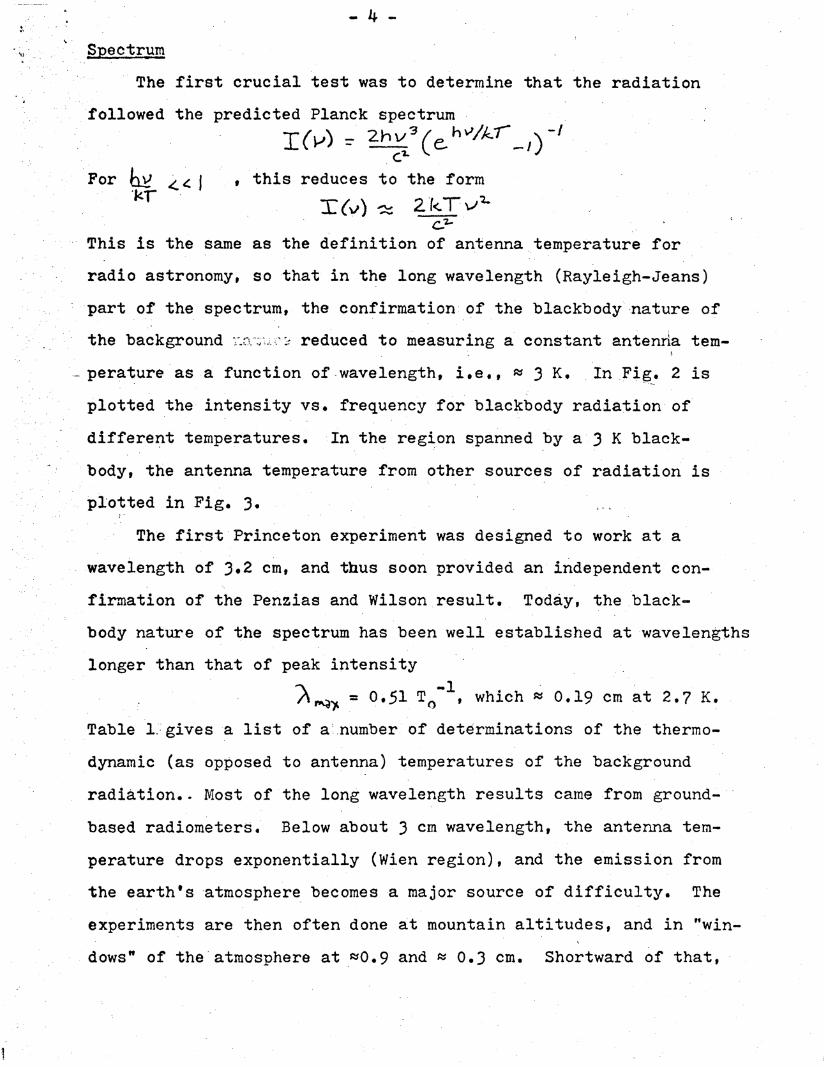
The first crucial test was to determine that the radiation
followed the predicted Planck spectrum
C2.
For s ge1 , this reduces to the form
This is the same as the definition of antenna temperature for
radio astronomy, so that in the long wavelength (Rayleigh-Jeans)
part of the spectrum, the confirmation of the blackbody nature of
the background :a...s reduced to measuring a constant antenna tem-
-perature as a function of wavelength, i.e., a 3 K. In Fig. 2 is
plotted the intensity vs. frequency for blackbody radiation of
different temperatures. In the region spanned by a 3 K black-
body, the antenna temperature from other sources of radiation is
plotted in Fig. 3.
The first Princeton experiment was designed to work at a
wavelength of 3.2 cm, and thus soon provided an independent con-
firmation of the Penzias and Wilson result. Today, the black-
body nature of the spectrum has been well established at wavelengths
longer than that of peak intensity
1,, =0.51 To , which 0.19 cm at 2.7 K.
Table 1:gives a list of a number of determinations of the thermo-dynamic (as opposed to antenna) temperatures of the background
radiation.. Most of the long wavelength results came from ground-
based radiometers. Below about 3 cm wavelength, the antenna tem-
perature drops exponentially (Wien region), and the emission from
the earth's atmosphere becomes a major source of difficulty. The
experiments are then often done at mountain altitudes, and in "win-
dows" of the atmosphere at X0.9 and 0.3 cm. Shortward of that,

however, either balloons or rockets must be used.
In 1941, McKellar discovered that absorption lines in the
cyanogen radical in the direction of Zeta Ophiuci came from both
the ground state and the first excited rotational state. He could
not rule out the possibility that collisional or pumping mechanisms,
for example, were responsible for the excitation. So he quoted a
value of T~ 2.3 K for the equivalent blackbody temperature which
would produce the excitation observed, in the absence of other pro-
cesses. This result applied at a wavelangth of 2.6 mm. It was not
until after the masurements of the background at 7.5 and 3.2 cm
that the significance of this measurement was realized. Further
theoretical work dismissed all other possible rotational excitation
mechanisms. In addition, data from a number of stars have all given
results between 2.7 and 3.7 K. It is unlikely that local excitation
mechanisms would be so uniform. CH and CH+ have also been used to
set limits on the background temperature at wavelengths of 1.32,
0.56, and 0.36 mm.
All of this has subsequently been superceded by a broadband spectral measure-
ment over the top of the Planckian curve. This experiment,by Woody at the Univ.of Calif., Berkeley, generally confirms the blackbody nature of the spectrum. However,third hand rumors are now circulating that there is a discrepancy in the expectedshape near 1 mm wavelength. Keep on the lookout for further news.....
Observing the 3 K Background
A picture of some of the early apparatus used at Princeton is
shown in Fig. 4. In most other radio astronomical observations,
we observe both the unknown source, and a reference in the sky, and
subtract them to remove systematic effects. This is true in spec-
troscopy, where the off-of-line regions of the spectrum, and off-
source spectra are used to determine the instrumental baseline.
J2
-6-
SThis is also true of.single dish measurements of continuum sources,
where observations are taken on and off the source to determine its
flux. Interferometry, by its very nature, is sensitive to differences
in brightness over certain spatial scales. However, with such a
broad spectrum, if the blackbody were indeed universal, then there
is no astromical "off". It was thus the task of the observers to
account extremely carefully for all systematic effects in their
instCruments.
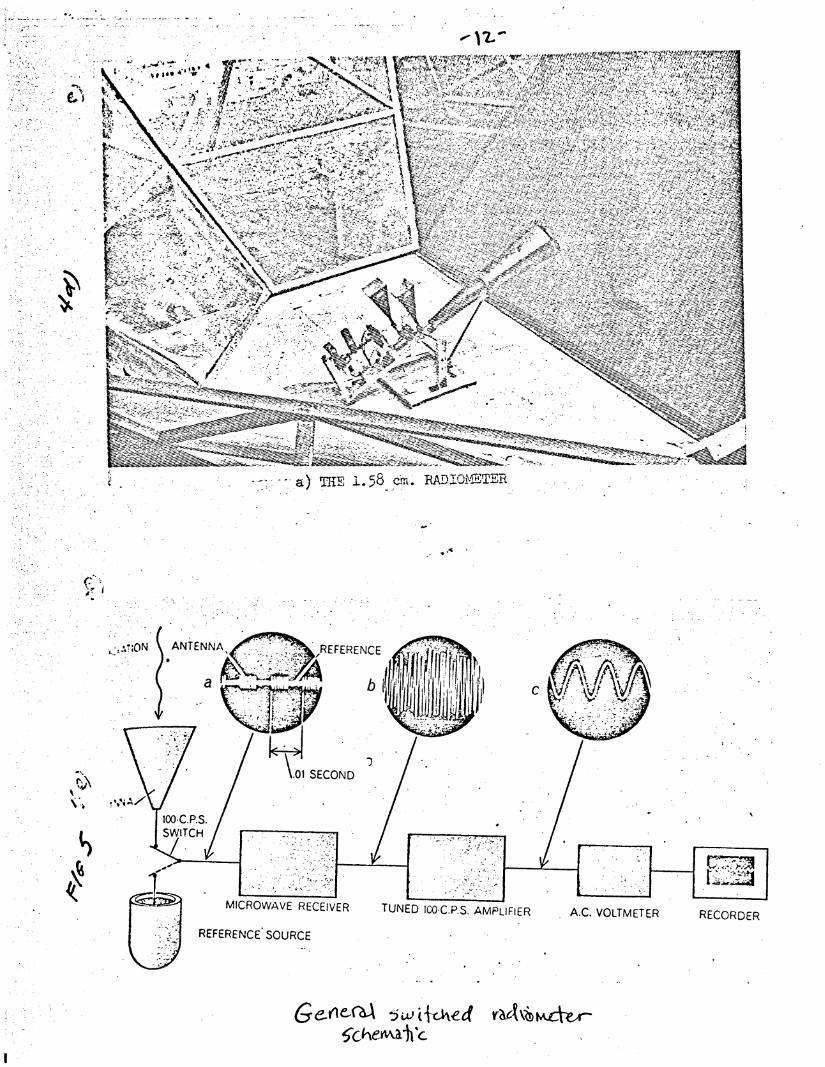
.....The, basic procedure used was switching rapidly between a
known and reference source, a technique developed by Dicke in 1945,
and in common use today. The reference source in this case was a
dewar of liquid helium, at 4.2-K. What was then measured was the
difference between the sky temperature and 4,2 K. A.block diagram
of an early system is shown in Fig. 5.
It is an interesting point to realize that the size of the
antenna does not affect the sensitivity of these measurements.
This is always true, as long as the source of radiation is much
larger than the beam size. Increasing the aperture size merely in-
creases the forward gain, or directivity of the antenna, not the
total power received. In fact, small aperture antennas were used
to degrade the respnse to localized sources of radio flux, as well
as to make the apparatus more manageable. A great deal of effort
went into the design of the antennae, waveguides, switches, and
cold loads in these experiments, and details can be found in the
references. At around 1 cm, the biggest contributions to the
atmospheric temperature are from water vapor and oxygen. The atmos-
pheric contribution is subtracted out by tipping the antenna away
from the zenith, and subtracting out the observed dependence on
the secant of the zenith angle. The residual is the desired back-
ground temperature (hopefully).
-7-..
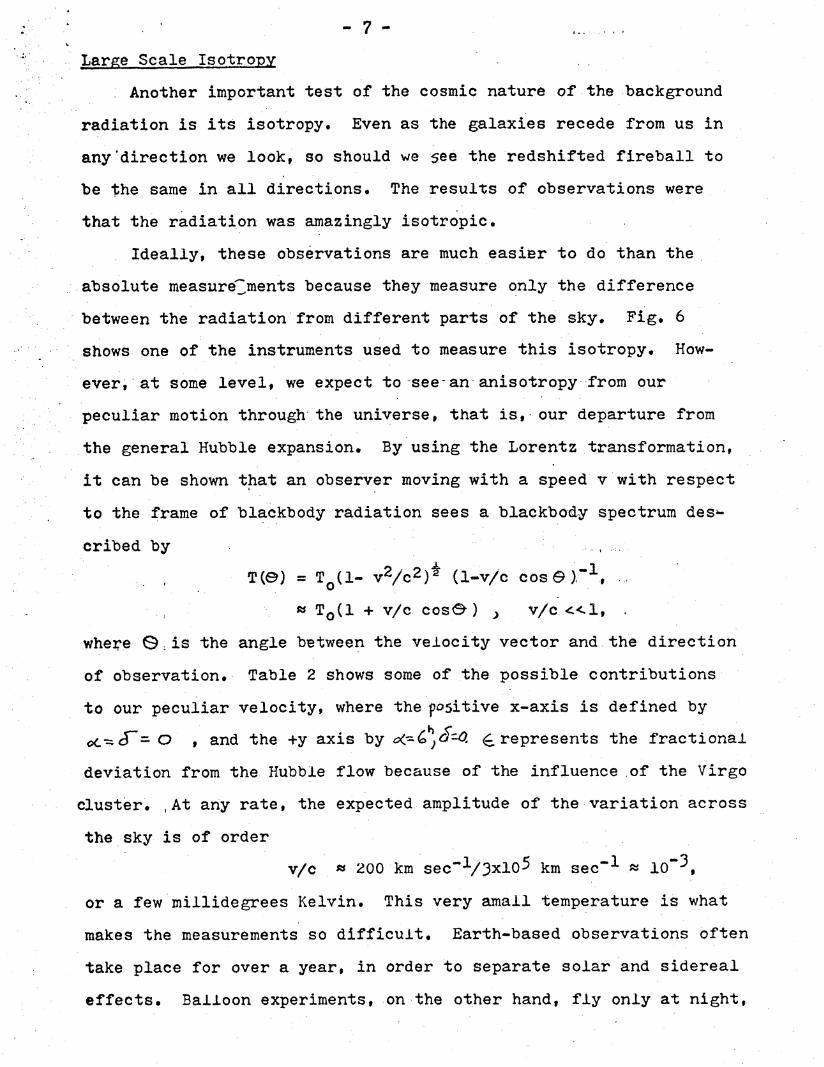
Large Scale Isotropy
Another important test of the cosmic nature of the background
radiation is its isotropy. Even as the galaxies recede from us in
any'direction we look, so should we see the redshifted fireball to
be the same in all directions. The results of observations were
that the radiation was amazingly isotropic.
Ideally, these observations are much easier to do than the
absolute measure ments because they measure only the difference
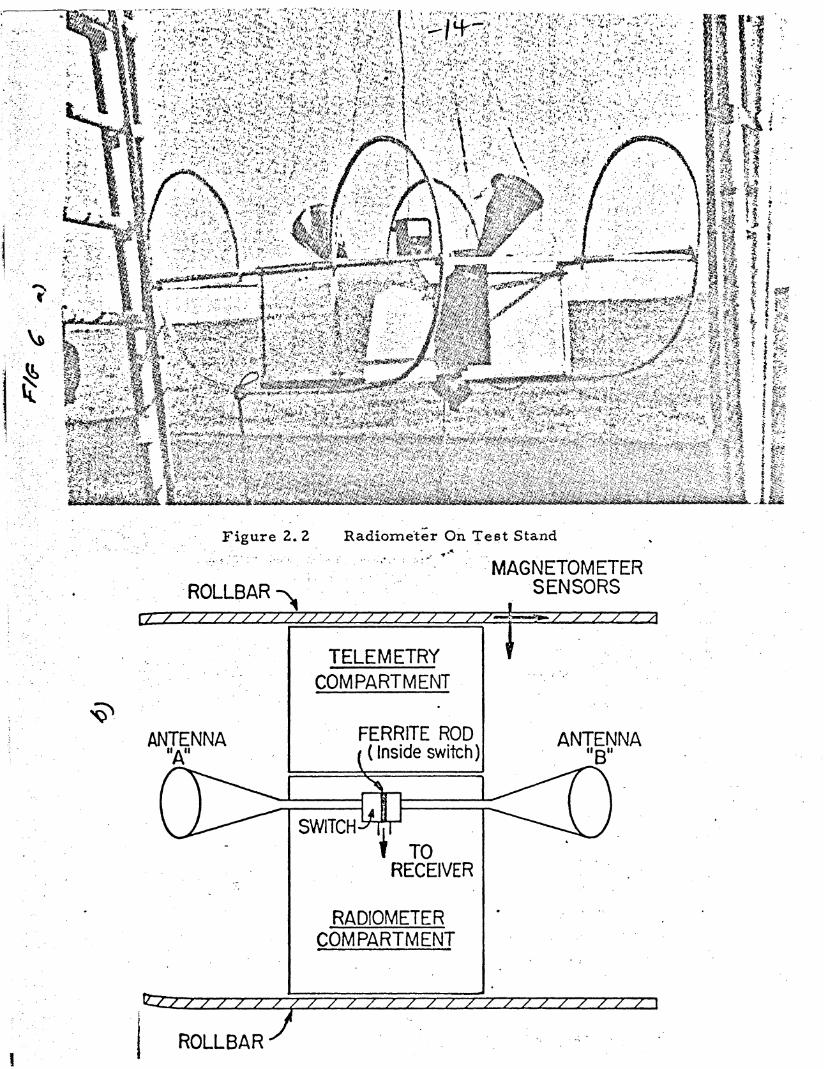
between the radiation from different parts of the sky. Fig. 6
shows one of the instruments used to measure this isotropy. How-
ever, at some level, we expect to -see-an- anisotropy - from our
peculiar motion through- the universe, that is, our departure from
the general Hubble expansion. By using the Lorentz transformation,
it can be shown that an observer moving with a speed v with respect
to the frame of blackbody radiation sees a blackbody spectrum des.
cribed by
T(9) = To(1- v2/c2)i (1-v/c cos 6)-,
* To (l + v/c cos&) v/c l,,
where O9 is the angle between the velocity vector and the direction
of observation. Table 2 shows some of the possible contributions
to our peculiar velocity, where the positive x-axis is defined by
ac--F O , and the +y axis by o Ch -. (represents the fractional
deviation from the Hubble flow because of the influence of the Virgo
cluster. ,At any rate, the expected amplitude of the variation across
the sky is of order
v/c a 200 km sec-1/3xl05 km sec- I 10 3
or a few millidegrees Kelvin. This very amall temperature is what
makes the measurements so difficult. Earth-based observations often
take place for over a year, in order to separate solar and sidereal
effects. Balloon experiments, on the other hand, fly only at night,

-8-
and therefore cannot see the full 24 hr cosine behavior in a single flight.
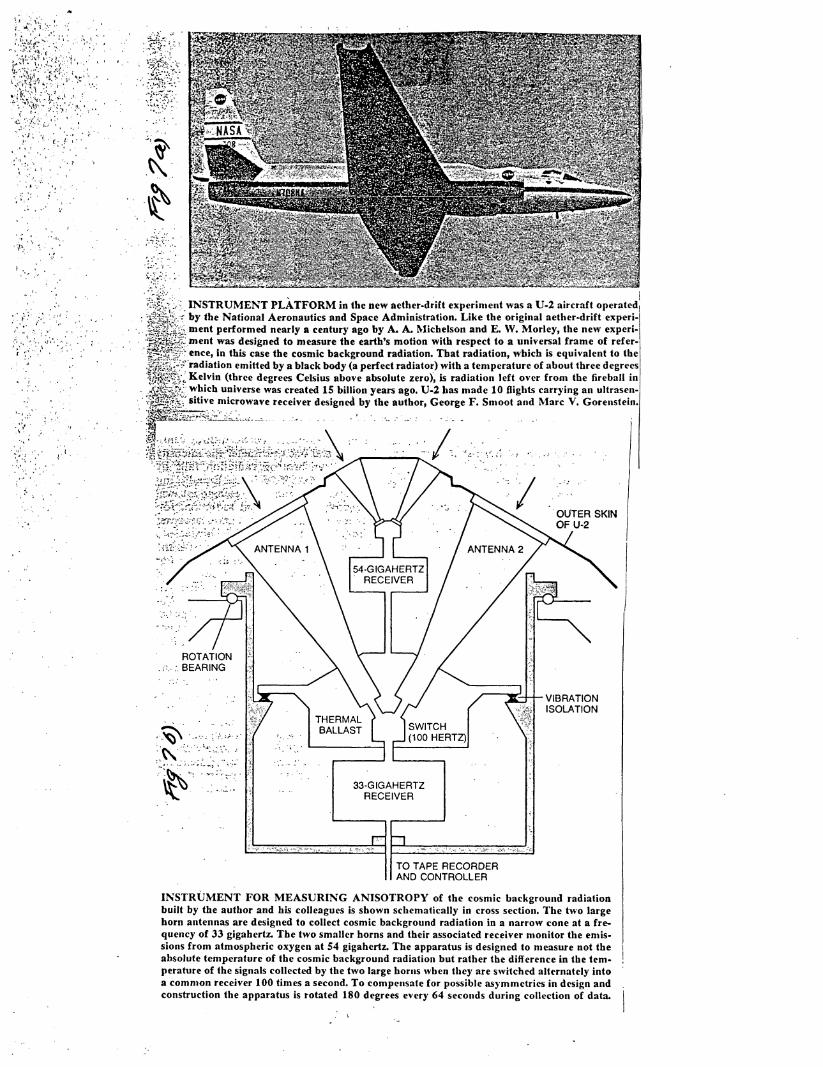
This past year, a research group from Berkeley culminated a beautifully
executed experiment with 10 flights in a U-2 former spy plane (see fig. 7).
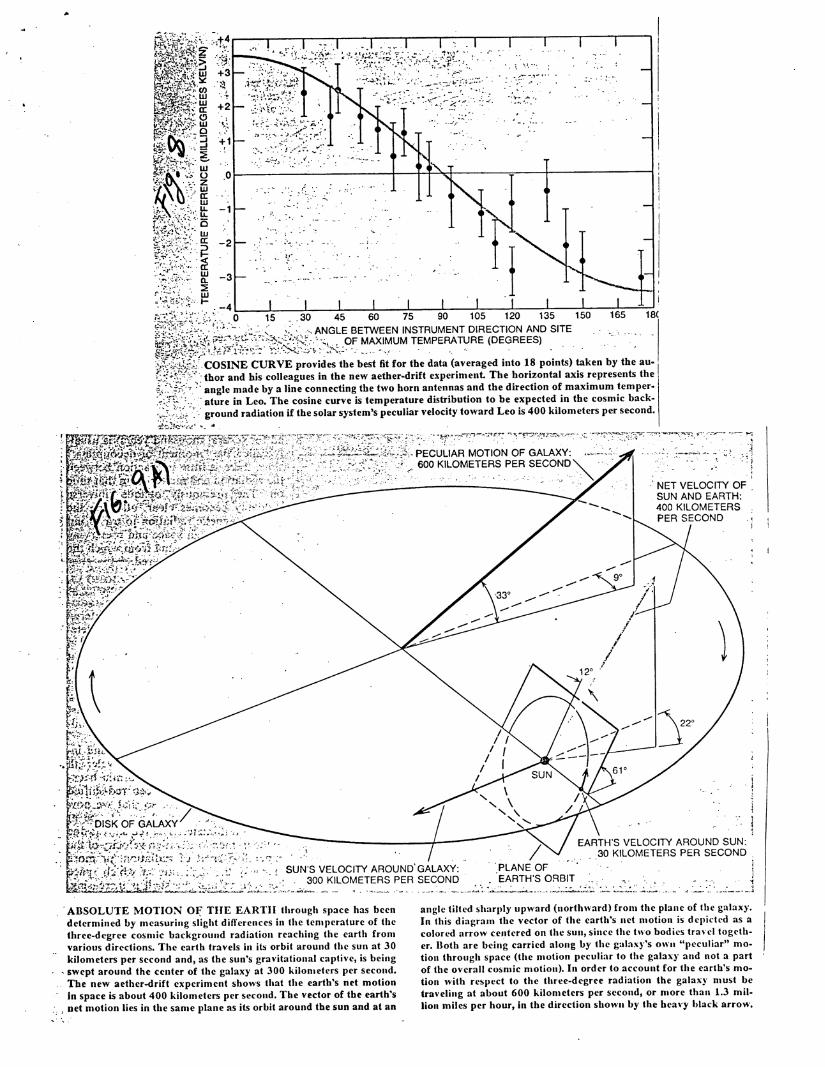
Their results are striking - the cosine curve has been pinned down - at least
in the Northern hemisphere (see fig. 8). To the extent that other large scale
anisotropies are not apparent, this experiment tells us that the Universe is
expanding isotropically. It also puts limits on the rotation of the Universe.
This last is another cruial result - Mach's principle tells us that the distant
matter of the Universe determines the non-rotating frame of reference. If
Mach's principle is valid, then no universal rotation can be observed.
Perhaps most exciting, however, is that, after correcting for the effects
in Table 2 (and Fig. 9A), our velocity is about 600 km/s with respect to the
Universe. But it is not just us - it is our whole neighborhood, including the
Virgo cluster which is partaking in this "peculiar" motion - a deviation from
the Hubble f ow. But what is really perplexing is that measurements by Rubin
and Ford of a sample of spiral galaxies up to about 30 Mpc away show a different
motion with respect to the Earth. A geometrical interpretation of these obser-
vations is shown in Fig.9(B). These peculiar motions, if extrapolated back in time,
have us moving with a velocity near the speed of light, with respect to the rest
of the Universe. Alternatively, these motions could arise from some local turbulence
(see the small-scale anisotropy discussion below). Alternatively, the whole inter-
pretation could be wrong. Its an exciting problem. Watch this space.....
Small-Scale Isotropy
Measurements of isotropy on small angular scales help to rule out a more local
origin from the background radiation, such as from a large number of small sources.
Or, they can be used to place limits on the irregularities on the distribution of
matter at the time of last scattering. This is usually assumed to be at the era of
decoupling ( around z=1500 or so), when hydrogen recombiniation took place.
Results from a recent experiment of mine, done at 2 cm on the 140' telescope, show
that AT Z.3
If we identify Aras arising from the statistical fluctuations in the number of
sources per beam, then the density required to give as smooth a distribution as
observed is (1 (f a
.. 0
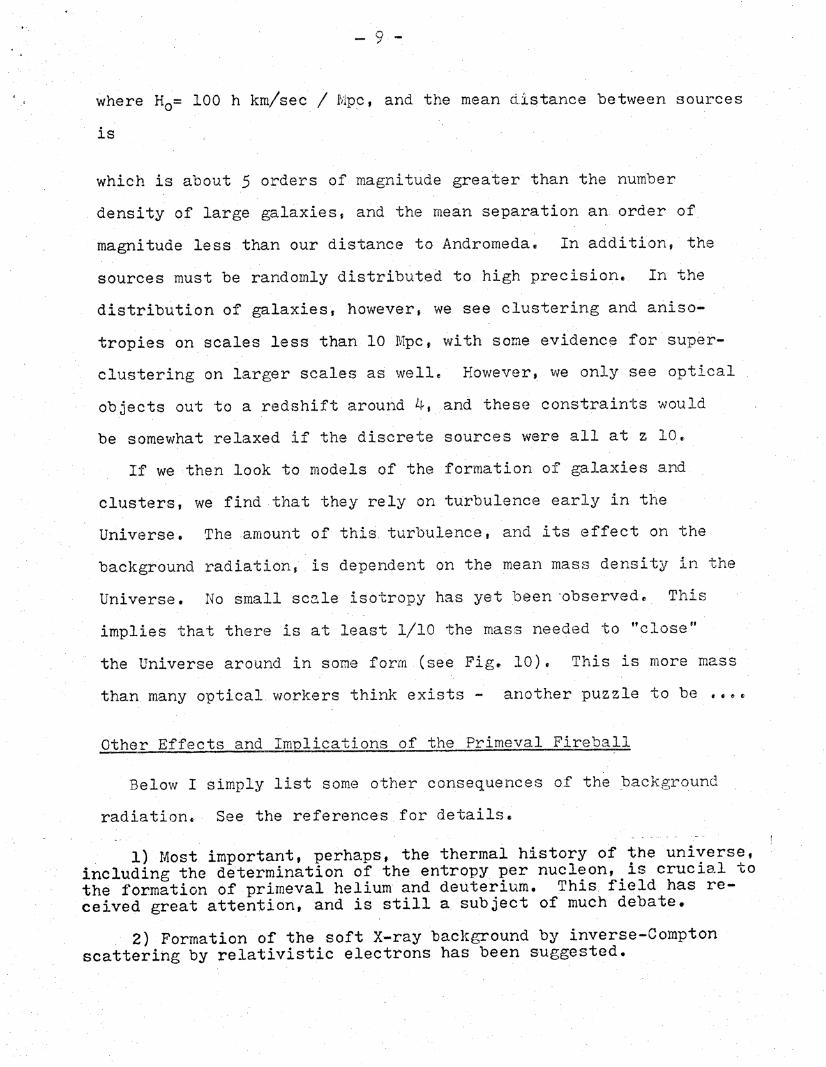
where H0 = 100 h km/sec / Mvipc, and the mean distance between sources
is
which is about 5 orders of magnitude greater than the number
density of large galaxies, and the mean separation an order of
magnitude less than our distance to Andromeda. In addition, the
sources must be randomly distributed to high precision. In the
distribution of galaxies, however, we see clustering and aniso-
tropies on scales less than 10 Mpc, with some evidence for super-
clustering on larger scales as well. However, we only see optical
objects out to a redshift around 4, and these constraints would
be somewhat relaxed if the discrete sources were all at z 10.
If we then look to models of the formation of galaxies and
clusters, we find that they rely on turbulence early in the
Universe. The .amount of this. turbulence, and its effect on the
background radiation, is dependent on the mean mass density in the
Universe. No small scale isotropy has yet been -observed, This
implies that there is at least 1/10 the mass needed to "close"
the Universe around in some form (see Fig. 10), This is more mass
than many optical workers think exists - another puzzle to be ,,.
Other Effects and Imolications of the Primeval Fireball
Below I simply list some other consequences of the background
radiation. See the references for details,
1) Most important, perhaps, the thermal history of the universe,including the determination of the entropy per nucleon, is crucial tothe formation of primeval helium and deuterium. This field has re-ceived great attention, and is still a subject of much debate.
2) Formation of the soft X-ray background by inverse-Comptonscattering by relativistic electrons has been suggested.

- 10 -
3) Interaction with high-energy cosmic rays has been considered
for its implications of the N(E) distribution: , and the origin of
cosmic rays in general.
4) Detailed measurements of the spectrum may help probethe departures from the simple isotropic and equilibrium picture
studied so far. Fluctuations in the spectrum and in the backgroundmay contribute to our understanding of the growth of irregularities
in the universe, and the formation of galaxies.
5) "Cold spots" in the directions of rich clusters of galaxies.This arises from inverse-Compton scattering of the background radia-tion by hot gas in the clusters. It offers a probe of the tempera-ture and density content and distribution of the gas which is alsogiving off X-rays.
REFERENCES
1. P. J. E. Peebles and D. T. Wilkinson, Sci. American 216, June, 1967; 9 . o re V'w
P. J. E. Peebles, J. Roy. Astron. Soc. (Canada) 63, 4, 1969; R. A.
Alpher and R. Herman, Reflections on Big Bang Cosmologies, F. Reines,
ed. (Cambridge), 1971.
2. R. C. Tolman, Relativity Thermodynamics and Cosmology, (Oxford)
1934; 171. c--C\S S c ,3. R. A. Aipher, H. A. Bethe and G. Gamow, Phys. Rev. 73, 803, 1948;
R. A. Alpher and R. C. Herman, Rev. Modern Phys. 22, 153, 1950 and
earlier references therein.
4. G. Gamow, J. Wash. Acad. Sci. 32, 353, 1942; Phys. Rev. 70, 572, 1946.
5. G. Gamow, Phys. Rev. 74, 505, 1948; Nature 162, 680, 1948.
6. R. A. Alpher and R. C. Herman, Nature 162, 774, 1948; Yu. N. Smirnov,
Astron. Zh. 41, 1084, 1964; Engl. tr. Soviet Astronomy - A.J. 8, 864,
1965; A. G. Doroshkevich and I. D. Novikov, Dokl. Akad. Nauk. SSSR
154, 745, 1964; Engl. Tr. Soviet'Physics - Doklady 9, 111, 1964.
7. A. A. Penzias and R. W. Wilson, Ap. J. 142, 419, 1965; R. H. Dicke,
P. J. E. Peebles, P. G. Roll and D. T. Wilkinson, Ap. J. 142, 414, 1965.
8: R. B. Partridge and D. T. Wilkinson, Phys. Rev. Letters 18, 557, 1967; rcj,I4,.
Iature 215, 719, 1967; P. J. E. Peebles, Lectures in Applied Mathe-
matics 8, Relativity and Cosmology, J. Ehlers, ed., 1967, p. 274.
Recent review - IAU Sympos. #63, section III.
Books mentioned at beginning by Weinberg and Peebles.
Latest - Sci. Am., /Ya /P7 (isotropy).
M.1'
i"17 r: i'~
;1.
tV.T-~
t n9t"
t r' C' l
1 ' rl
' "T"
" .C
ft _;
IIORN ANTENNA of the Bell Telephone Laboratories receiver atliolnimdel, NJ., was originally designed to collect signals reflected ,
from Echo satellites. This was the antenna with hilh ':*S"
-Penzias and Robert W. Wilson first detected the fire!"ll e-'
' t--t 3 i , y '.{ "t '" " M. ' 'i, p!"--r">- -. - .A"t w ,M. :t ' i 0Aj-
4 4, Ai .1 ",. .. ." -
k3E! : . :r'..#' t 5 t: T - K".T Y, - . K . "5.tiafs'".... yi;,:y,,w,,; C i ''. . T 'S /S L' ... ~ l t.' i -S' .':;' -- s-- " '"."'":-3 " o.} 't' :.. 1 * '1- ie---M Y:: ,-- : 4 4 A~3r' S. . % - t . t ".. 3 t' "
vi'. ^;ti: ;.,, " ++'1'i'4 .. r . i f.x's. .- -i'11 ':G "y x Mi 1 ¢s~ . i ! ? 4 ~ f ? v7 hg? ° S . 7 ... f l '1 3 tsy.: y. - . 4. ,r ^:: y "7''" -. t r " . s - 9 t u yl : , .'' C I * 1t . .. m : , .: ,:i
t" ^:.. i ." " tM 3+4 VY." !:! "R " 4 YM"Mir "" ,.. .. y ."w.. a!4~'AA44-Mr~;, .P' r., .. - ,-- -'-4--"' '-4 1 '',1 L - -- .a . - -- t-,R/0 . .-. Y r'. -- A tv. . "! 4 - ' / +.-4 1:.i ".vw ."i,: . "J "r SM"' i fy"Ai' it~ F y~ ts:st SI MFSV ' r i~~T' .?:i 9N' '. :.1':'ti FE ( "17'1. ry !4, ' " 'aY ! 't - % t' -e t? ;. " I.M. ,":.:, 'Y '.l~y:~r.s,.a :' :..r .- '"- . ".t:. . .e'" , .. +.:"'.""'.4>. i--* -4 4-44-- . 4 "-4 " :'S 4- 4". "...pri. ry!. . .: 'r3 :, k3; ''f ; " 'a
, M,. "., "4 ."C : ""-% v..:~x":t -4*4s' * 4 *.'r..ttI .y..y '. :..'.* A "S :s':':'.::: .'T: 1.W A'. ~ y " :~wti-r :iX L4 :
PRINCETON GROUP'S first fireball observations were made withan earlier version of the radiometer, here shown in position on the
roof of the geology building. The slanted panels around the ..are wire-mesh screens that help to keep out ground radiats,
-. y' ":>' . y r " 4z r.+. r' y' D 3' r -' ."i .. ; ".M .y ":+r.. T . ::" " .:.
IS- .;~ : -- ~N'r3:
} 1~-~" ~f4 4 b,.---r- i ;~- .1"
t C$F
a 7s- 3g g t t ti '
r
/ .
" " «,Mn.. ^' . t ,ter
. t'i' "" ... .. " ". "- -" :. i. ::(""'G, w-r.- ... -" : " ..
"y"+^f' .y".:.b" ' , : l "r 1 } "' n
a ... ;r.'" ' u t yam' , p~; ~t~3~~y>! ' : . u ,r pY - Htt3' /s 1 ", .: -- - 56.a'.c'",;. 1 "i^
"'' «:H M'Y. , .11." e"' ,v'!: J, L.:!1. ..: l "++"' .. . . . r:^, i.e: . . s saiwa~firpn:,t,. . ':t',;': . . . :..r'"i; r,;-.
It" « y -{ ""y J / ... s ^ :t.«%' . i "s" '' /r! . ..." :.. ' ,""" f '" , cT1, * Y ," !, ,,fy] .) S . r'ti+ + . .:
''tlt M+. 4 "!'MAiia 'a .w^" -tY " "ti"1. :1'. R"'d rNi:r 1' : t , ". :r.1...A. r" . '
III
Ii
$
IIIII
E
s.
t
i
I
IL

'' . . . . : 4 - .. . - • , .t . . .
.4* ,\ 1',0 " :-}'' . 1. +4 " 3.A' ". 1 '-".," ' . . " ." 4, / : . t''~.. . ,': ,w• f,, .: .'-'- , ' ". - ,. :.' , .' " -, '" -- 0 a. .. ,, " .+ f . " . "'.' "w w" ...l " " .a « ..'!" ." 4.".
y' " i F" -. ' oY f , . . .' . . .. . . ., t. .. " , ",1 . . . ... . .. i " ' . ...
'" "'.15 ' "/ ,:.L-,; " '-" i ., " '.,. .., "-"" ,t+- : : it :," ,' ,' ," ." . . .• " ' .'' . . . ." r. ", • . " 'i" - ,.. ,
-: :.. ....'. t ""-: "" . ,{ " .. -- . . . +- . ; , . . . " . : " . "
S. - - . . . , ....'
$41. ;.y ', -
' " " ' . , ,' ' " .. r" "i "_' , , !t-,'-"'C • " ' , 1R ": ^ " 4 ' , . . . .' . - _r. . }.-, - e :' " \ '" ' ' " : " "" - ' '" ' : " I " ... " . - . " : " ".\',,., 4 ." ... . . - ... " . . .:,...,.. ..... ,.. . . ... •. . .
<! ..;! "-,y t..-NT with which the primeval fireball is observed at - right and are directed upward to collect sky radiation; a with.
'.,%j';,.$ 4U University is a recent version of the Dicke radiometer, microwave receiver and amplifier are at the center. The in~strumen
'. , ee., .t from above. The antenna horns extend to the left and is operated both in this configuration and as illustrated below
I- -=-' ; '.1 : ,. "" .-'"'' " ' : ,--" " -:-Sp y .-" . ' " M ,'" ' ! .Z ' ,^ .'.; " ."?!. ?5 ,':', : !". ' f ..."u : " ,;l •," "YG+ . .': .r... p. " ' .p.rt... ... " e-w. " :: :" " '- - .. « .. ,A ",- .
.%.S"""-- ,:3.: ;"3".."-:..:s.r" "-, • .&.A. ".....-.."A" • ...
i3-
:r. ..--
i. i "r It'
..-.- " : i '.. A i -... .-: 'r' ' ..
- A, \ . .
-:.is: : •
:.3 1 t
. .: _ :: % : . { : ..: :- : : : .. .' . ( . - ' 1 ; ' . .: .; ;- O:..- . N : , .- ... --. ..: , . .: .-. ..• ., " - . . .. ... '5! :: - " .-. .' - : -:.' -g :-" "-. . : .... . - r . ' .' , .--' .:.- . - 5 -"
.; ,'' .... '.!t -t " • .." --. ;' -''" -- . '-.. ... -.. ... ,': -'. '.. -
.. ... : ,.- fl. . .-.". '.. . 1 • { .sh ... ..:: -.. . : . fi: ,r'.. ,.,j.-. .. .. : i. .- :N ":.. 3- : ? ' -.. ':-,,.... : > .,:; , .. .,,:. .. .i .. ..:.,. .. ..
.. :.,"/ 'te. +i.~ i. i, :..:. "s "..;. . ...-.. r .. .{.y".a.k: - '--.': p .5/ :"'.- i t " " -' g :- -: .-.'/.-.-.-..../ .. .;.] ;7 ;. .:: .-.,5. : ... .
o. . ", - - • "- .. . . %.. ". " . • " / ---... .. . . ",: q -:.. : " . - . :/7 I '
. . " ' "-.* * '". *" "" -<" " ': 'r " ::'£a:"v::" ' :" ; ': " ':;I 1
"% " , .',. 7. "
.. . . : .- . 4' ' ,-: . . .. .. "".. - . . . . . .. 0 . :. : : :, , - ..-.. : . .. .. ., .. .. V . -. .~ .- - . .: .. " --5 - , 1. . : . . • . - • } . .. .-' • . -.'.:i;" ,.. :: ... X: ".-:,_ .- "".
.. :...".
, "y . r'" •..-:.."
".-'
• ., ;, ... ...... ... ..:. ..: .-. .. .... .. .. . .-... ; . .-. . .., ' .,,, , ... . . .: ..- . ..: ., ..." -.'.-.. ' .. ... 14ii"' .:- : -... :., ,.. ............,. ...
- .. .. , . .. S* 't'yy < 1 .. ! . .- : zSP,;* . ..-. d ..,..-". - " ,,.. - -J. - , . . .. . . . M .- ;• . .d.','. { , .. , ., , . ', .t ' 3 ""
" V "' "" , rQ• " z t' "
TI:R b seen in a side view with one of the horns in boiling liquid helium and is therefore known to he radiating at
. seive radiation from the bky. The other horn of the 4.2 degrees Kelvin (degrees centigrade above ahsolute Zero 1. t'h coupled to a wave guide leading to a referce receiver input is switched back and forth between bky antenna
' 4e u)Crange Dewar flask. The source is innersed in and reference .ource and the intensitics of the two are comIpred.
I
aV4att
"I
I~w
ISC
1
y. .- ,l . . . .. ' M ,,." , -, " , ;t.t" . .. ;t t .:: :.t i+'t';1 . , t t" : : . . : -.. . t;.:> . f,. . l: .'. t'
-.
-"
' -"-""
**
i ! - .' ." .-. {.t H ti +\" . t -- ' i ;i " 5
A. -.
A" .- '-A"
,.. 'A"
li f "i~..". .
, . • , .. ., ;: -.. i-.'..-.v,
.... . .,-.,.,_j-,-- .,, -: .. '.. j:" .. 1. .1." ...-- .-.- :.,......,r ...... '
S --. :~ ' :.-t1 a l i..
.. '. a"t" " ...... . . . ' .Etip58 . : , . n ,ti . ;" ,: ::. - ., .t. . i " - " "l ; "L " " . t' '
,v. .. . . l s , ' ,., r ',t. s "t.1:" . i .?"i ' ,: 1"
• ,,,i.,+ •"i .. t-..•t'. . • . .... ... - ..- j •; . - , . .l .• . .. . o. . , • " ::.y: - .I.t
" ' " ": " .'" " " ; ' r•
• . , ; 'i4.; " . . . o- : ,". : " , . ' , .yu . 9. : ! : . "" ; , . ' E ' ~ f" " , t
ySt.' 't 'N.ANTrENNA " " ,REFERENCE . '- . ",.' k t " . ;"
" " ''t" " : a,' f '" 'Y:. .. 4" "
"' "S9 " " " .t""". ,1 "1: t
,F.1'::"..'SECOND
y _ t. " ,,'_ t :it:,: .'; .
S I -C.P.S..
". , • , s tMIR WV ECIE UE I0dPS MPIIR AC
REFERENCE' SOURCE
Gez(nef&M ,wi ed rA\ck d w
6th-envu'h'c
do2.

LPL!
* z
..
1
* _
", {
- i. ,,
... C
IV IV I'WAVELENGTH (CEI IMETERS)IIVWAVELENGTH (CENTIMETERS)
"BLACK BODY" SOURCES of thermal radiation emit across a broad spectrum, the inten-sity of the radiation varying with wa, elength as shown here for several sources. The shape ofthe curve persists as its position chances according to the temperature of the source. The topcarve is for the fireball radiation billions of years ago, the bottom one for the radiation now.
COSMIC BACKGROUND RADIATION 293
* .ATMOSPHERES100- FOR
WATER VAPOR -25IL
1GALACTIC /
. , 10- PLANE
w /
,, < /z "
z 0.1 1.0 10 100
WAVELENGTH (cm)
Fia. 2. The spectra of two sources of sky radiation which compete with the cosmic micro-wave backgrouind. Alntenna temperature is the thernodynamic temperature off an. extendedblackbody source which would give aa antenna power equal to that being received.
RA)10 MICROWAVE INFRARED VISIBLE ULTRAVIOLET X RAYFREQUENCY (CYCLES PER SECOND)
108 10 1012 . 10, 101 1018
PRIMEVAL FIREBALL --1..000.000" K.
10
100 1 8.
108
10 . SUN 6.000° K.
1010
108 EARTH --300° K.
106
1RIMEVAL FIREBALL ---3° K.
10-4
in3 in2 1nl i n-' in-2 in-3 1n-4 in-5s sin-6 in-7 n-8
.,
IV IV 1
'. .'A A'A A',.' ",,',!''A-..i.''"''.r ". .,l, ,
.... A....'''V.....A , ...-. 'r,, ' ''' . -' ''a, "'t 1 Lf. . }rt"
' '4t t 1 ',',1' '.tU.t"\ " "s t . .
". x ,:i.1' } " " " a i} ii, t . : , : !: P :i , i:, ti, , r. ...... ': 4"' ilt'-A',A-',
1'
t,;t. ' .,- , . , 1 .R. .,t. ',.
A'A', ,'tA:
Y"- f' t .. ,,.,' ,. - ; ,;,. '. I .,,, , ".. ' :' : ' " - . ' . t.. . , " .. f '-- ','. -1.t pt 'F 1 " . ": .,i }.1 ;. ", "" i r . V •r r '1 . ' q , ; l .'. . . -"..t' .. i ,.-., \ ",.t , ..... '! ", ... .. ," ' . , .. . .1 r '%I.I t ."... t of t 1. t ,.,- , 4' f.' t- ! , i'-!,a r : ', :"!- : .,i ;:: . " _t a . "1 "! ' . .. " :i t 1 { t i ,1- " 1. it.a ^a1 ' 1, -'. , , iaA( , . .. t.t': , , ,-' ! .' I J+ 7 ." s;,i
- . V. .::''.' " .:: . -- -. .....1 - . , . t > &,t .,. ....... . .
-. .'" '-,t . n -. ', .{ .... A" + . ' t.W , ,, A '' ' "+•. .
1 xC1 a , l 1 ? t A ,. , A.a 5 . , . '.-. "
V :\.'r.:., t t ' r F 4, , t.".":..T
''3',:'-: .A:"4A.A-,-" -;:..AA'
gM-..;
'.-
A...
*.. Figure 2. 2 Radiometer On Test Stand
.... " A: .. .. A ' -'A - .. MAGNETOMETERROLLBAR> : SENSORS
.$ TELEMETRY7.: _"i"' "1
COMPARTMENT "'
NTNAFERRITE ROD ANTENNA"A" (Inside switch)""
SWRADIMTER
- T O+ w 1 t, "'.} t i it .i i. , . '', ' ; , ,C.!, 1". , t.T, iat" i.,., !'j ,L, .. '. , ! ' - R Et C ,E IV E R %. i ,, . "t t + .A
RADIOMETERCOMPARTMENT
ROLLBAR
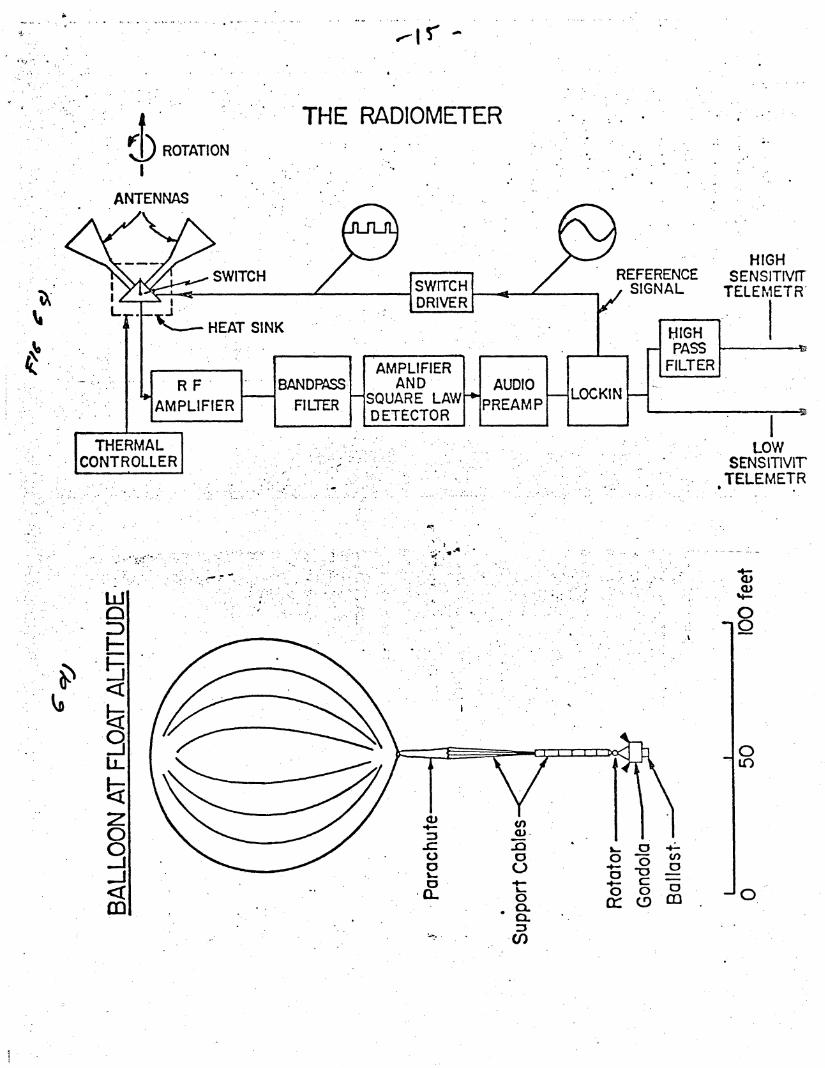
THE RADIOMETERROTATION
I
ANTENNAS
SWTH SWITCH REFERENCE SEN
C SIGNAL TELEi DRIVER
L .
o .: . * * -,
..- HEAT SINK
UG
HIG
-. PASS
AMPLIFIER FILTERR F BANDPASS AND- AUDIO
SQUARE LAW- LOCKIN-
AMPLIFIER FILTER PREAMP
D ETECTOR
THERMAL :L
CONTROLLER SEN.
TELE
. . oO
0° •
0o
S0o4
ANENA * . 0..• . 0
.. ..i . '. " " ' • "
uCl)
-OW
SITIVITEMETR
"
A l
3 -
"a A
~r t
M MA
NSA
INSTRUMENT PLATFORM in the new aether-drift experiment was a U-2 aircraft operatedby the National Aeronautics and Space Administration. Like the original aether-drift experi-1
is
S ment performed nearly a century ago by A. A. Michelson and E. W. Morley, the new experi-\ F ment was designed to measure the earth's motion with respect to a universal frame of refer-
ence, in this case the cosmic background radiation. That radiation, which is equivalent to thet?2<7' iradiation emitted by a black body (a perfect radiator) with a temperature of about three degrees
Kelvin (three degrees Celsius above absolute zero), is radiation left over from the fireball inwhich universe was created 15 billion years ago. U-2 has made 10 flights carrying an ultrasen-sitive microwave receiver designed by the author, George F. Smoot and Marc V. Gorenstein.
ROTALATIO
R' l SWITOINGNC
,.. . 4 GI A E T
ROVTBRATIO
• : .- . , /" i >.y ; \ T Q. P ^ . W\
SISOLATION
- M'ALSWITCH
a " \BALLAST ,lT ::o R , LWw\. l0-Z: " \ ia! \
INSTRUMENT FOR MEASURING ANISOTROPY of the cosmic background radiationbuilt by the author and his colleagues is shown schematically in cross section. The two largehorn antennas are designed to collect cosmic background radiation in a narrow cone at a fre-quency of 33 gigahertz. The two smaller horns and their associated receiver monitor the emis-sions from atmospheric oxygen at 54 gigahertz. The apparatus is designed to measure not theabsolute temperature of the cosmic background radiation but rather the difference in the tem-perature of the signals collected by the two large horns when they are switched alternately intoa common receiver 100 times a second. To compensate for possible asymmetries in design andconstruction the apparatus is rotated 180 degrees every 64 seconds during collection of data.
'I"I I I , .l - I' I I I I
+2-
0
.,,. O MAXIMUM TEMPERATURE (DEGREES)
COSINE CURVE provides the best fit for the data (averaged into 18 points) taken by the au-
thor and his colleagues in the new aether-drift experiment The horizontal axis represents the
angle made by a line connecting the two horn antennas and the direction of maximum temper-ature in Leo. The cosine curve is temperature distribution to be expected in the cosmic back-
ground radiation if the solar system's peculiar velocity toward Leo is 400 kilometers per second.
&9PECULIAR MOTION OF GALAXY: --
600 KILOMETERS PER SECOND
A iij~..,. . .. ,NET VELOCITY OF
12
j- PR SCON
/WMEARTH'S VELOCITY AROUND SUN:A'~ ~ ~30 KILOMETERS PER SECOND
SUN'S VELOCITY AROUND' GALAXY: *PLANE OF
,' , ."300 KILOMETERS PER SECOND EARTH'S ORBIT
&.' .:+' &-"" ;, " it N. _ i - '"'
--.""-..>[-,,,;" ange. ad' bya.inconetig1te wohor atenasan5te6dretin5o m xi um1em er
:;" aue CUVeo. pre osieceis tepestaftre dista(ribtionto 1pcedins)htakenmbycthecau
, : ground radiation if the solar system's peculiar velocity toward Leo is 400 kilometers per second.)rY'" n" . - "M :T "- , .'yT p'' -,.." + "
tw rtM},., t> ,:l. r. ) 'S .. . -, !'
.. y . ' -. : :i b ::-:°y -- ':, ^ ;. . , -, ' : ; PECULIAR MOTION OF GALAXY: ........ 4,..:..
y #t Y 1 lS w ;G C a : i i ; : 'ay v: L~: :: i:! '.:::*i::.:::r :: !. ? i M.::, 60 KIOM TERfPR1SCO D, -e.
_ : -, . :,*4 ,:4'i-:SUN AND EARTH:
. i. J. d.'. ':, / 400 KILOMETERS
, . ( t, f _ ":'t, ,: p ,. & PER SECOND
, . . 330o
120"
! .. 0
ABSOLUTE MOTION OF TIlE EARTH through space has been angle tilted sharply upward (northward) from the plane of the galaxy.
determined by measuring slight differences in the temperature of the In this diagram the vector of the earth's net motion is depicted as a
three-degree cosmic background radiation reaching the earth from colored arrow centered on the sun, since the two bodies travel togeth.
various directions. The earth travels in its orbit around the sun at 30 er. Both are being carried along by the galaxy's own "peculiar" mo-
kilometers per second and, as the sun's gravitational captive, is being tion through space (the motion peculiar to the galaxy and not a part
swept around the center of the galaxy at 300 kilometers per second. of the overall cosmic motion). In order to account for the earth's mo-
The new aether-drift experiment shows that the earth's net motion tion with respect to the three-degree radiation the galaxy must be
in space is about 400 kilometers per second. The vector of the earth's traveling at about 600 kilometers per second, or more than 1.3 mil-
net motion lies in the same plane as its orbit around the sun and at an lion miles per hour, in the direction shown by the heavy black arrow.

[(8T/T )2 1/2 (x 3/4)-[ (ST / T) I ( x&2 ) -
- -
o
OV
C)
1
O'!
-3
J
0,U__. .- i
o, O __0
1
1/2
0 0,
orL~~r
p
.. t
04
' ~ ~ ~ SHERECONTAINING4* N
/ RUBIN-FORD GALAXIES w
" ; . 7 .. ' -: , .. .-
." -(RADIUS - 10 '- LIGHT-YEARS). .-- . -- ." -" T
.
O>ADUSA0 IES
"1'' '7 LIGHT-YEARS)0
I MILKY WAYN . ~ GALAXY/1
-. d M' .; '"i . .r" ' t: d . 7 ~°!" -- . ' j, " I r -i". : . •:: " :- :. " : {':, : "F..+:"V,, ' r te...": • .- '-.!:.." t :; ,- K" " "
w - . .. -" . . .. .- . :... r { " y C ' " -" , -s"Q,"'."- .1 ' { r. y . . .- .r-" t ..• "" ---..;-",I Y. -R r+1 .- : .'tv-et'' J ,f , ...-. ! 1 t r -=;.- -'"t Y x ~ , ' 4 : .,=',": y.":) t !' I '.'. .. y . , .--"c, ,:i ": 4,, t : .6 " . ,' -,:. " r' . l," • . ., t", •. . • ' ,. ., . it " ', ."' .'" -' .;' , i
" . . ' ,, , - , -1. ,. ' 4 44. 4 . ,- . , , , , ," ., ,! ,
N (600
".& .-. ,, .....:OSM I ..,.... . . r ,,. , . ,. .k ' . .
S,'.FANTASTIC VELOC"TY PICTURE emerges when the peculiar velocity of our galaxy, evi-,
dently shared by all the members of the local cluster of galaxies, is plotted in relation to a sani-
ple of galaxies 108 light-years away whose velocities were analyzed spectrographically byVera C. Rubin and WV. Kent Ford, Jr., of the Carnegie Institution of Washington's Departmentof Terrestrial Magnetism. Their results imply that our galaxy is moving at 450 kilometers persecond with respect to those in the reference sample. The diagram shows how the Rubin-Fordvelocity can be reconciled with the peculiar velocity of 600 kilometers per second determinedfor our galaxy by the anisotropy in the cosmic background radiation. The Rubin-Ford sphereof galaxies would require a peculiar velocity of 800 kilometers per second displaced roughly33 degrees from the direction in which our galaxy is moving. Diagram at right shows how ourgalaxy would then be carried toward the Rubin-Ford galaxies at 450 kilometers per second. Inview of uncertainties in measurements the velocities are rounded to 50 kilometers per second.
" )t'" li '^:!fe«I' ; -. : : ., _ :'.. Y l : .{ "" 5" / LOCA ;GALA IE": ' " . f .. - :.\, , :..h"i ^'J#: vl f , +.t«4 .' "/ .:, ,. ;. .Tti t -,ir , A I S - 0 . , ,\ "" :w+
y :!. ;;,gyy . -+ - t / ' " .< ., . ." IG HTYE ARS) . k -f3 \c.,i ' :$ S~g• '-' , ' ̂".. ; : ' .,i": }", -- : %. ": t " f 'i>,r. '.""f " - . ""f." . . G
-!:!;^' i" r :. ' " I ).f" . \ '• :i LKYN W AY,'' f I " .)_l + .e• ' :" 1 .. ..... :i? ! . ..' . : " \ . : ̂ R- t " r t%',\ x' A A X " " " "1 i. ." . , ,
-& ' l ,l ' , -. , ..-. : , "\ r .1T ,{ ' :' .e ' , , :. .:.. <.- "..- ' % . :.., v . er'. i .. " ,. " " / ,+: "' t . 3 .r y : , fr i \ _
x r" -''°x' .::::."- ... " i sd> " z_. ., / _0 /
" ': c j w "; ,,t ..... .. "d xC # / --- . }-- ----. ;: -. -f 600 rF ." " ,'- >' i . i: a , ". " i k ' " ,, " •.
" 4 f . ,t f
• V'r e.:.a .' . Rubin" and . t"F rdJr. , o. heC regeIn.ttinofW sintn' .earm n
-.vlciycnbercnildwthtepcuirvloiyo 600 klmeespe6eon0eerie
.... ............ ...
[(all T)2
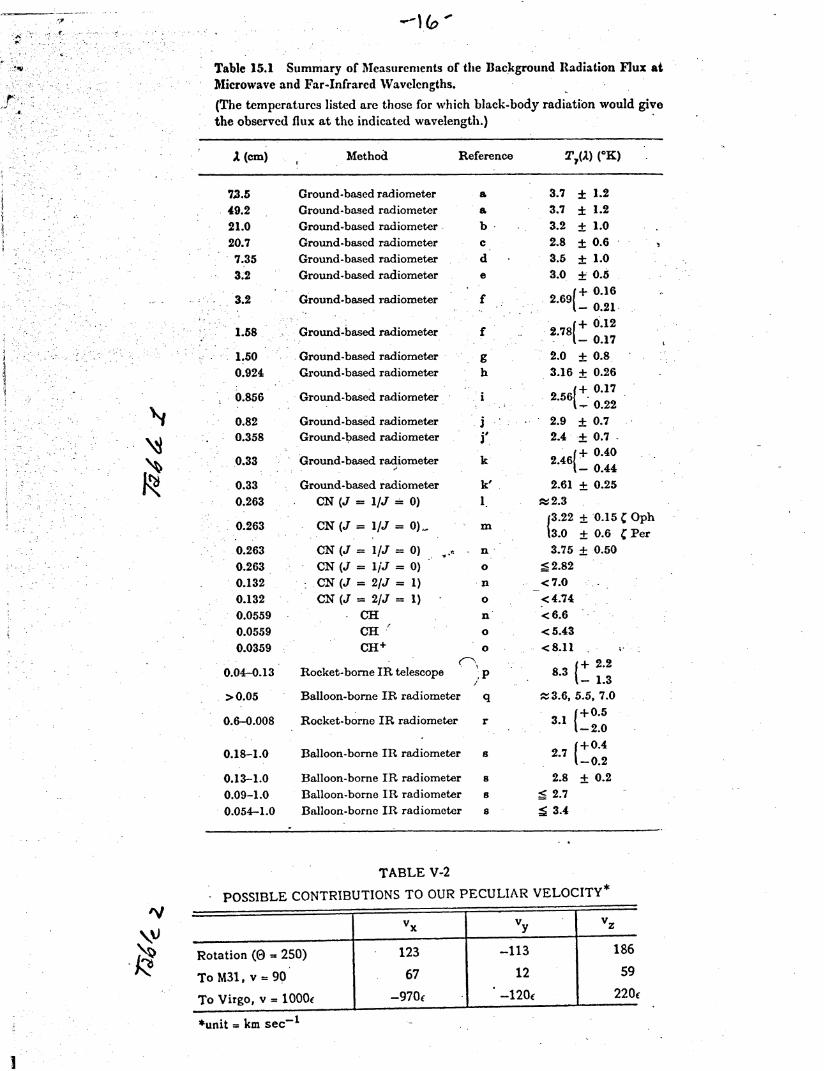
Table 15.1 Summary of Measurements of the Background Radiation Flux at
Microwave and Far-Infrared Wavelengths.
(The temperatures listed arc those for which black-body radiation would give
the observed flux at the indicated wavelength.)
A (cm) Method Reference T,(A) (°K)
'.
>0.05
0.6-0.008
0.18-1.0
0.13-1.00.09-1.00.054-1.0
73.5 Ground.based radiometer49.2 Ground-based radiometer
21.0 Ground-based radiometer
20.7 Ground-based radiometer
7.35 Ground-based radiometer3.2 Ground-based radiometer
3.2 Ground-based radiometer
1.58 Ground-based radiometer
1.50 - Ground-based radiometer0.924 Ground-based radiometer
0.856 Ground-based radiometer
0.82 Ground-based radiometer
0.358 Ground-based radiometer
0.33 Ground-based radiometer
0.33 Ground-based radiometer
0.263 CN(J= 1/J = 0)
0.263 oCN(Ja= 1/J = 0)
0.263 CN (J = 1/J = 0)
0.263 CN (J = 1/J = 0)
0.132 CN (J = 2/J = 1)
0.132 CN (J = 2/J = 1)0.0559 CH
0.0559 CH
0.0359 CH +
0.04-0.13 Rocket-borne IR telescope
Balloon-borne IR radiometer q
Rocket-borne IR radiometer r
Balloon-borne IR radiometer a
Balloon-borne IR radiometer a
Balloon-borne IR radiometer asBalloon-borne IR radiometer a
a
a
b
c
d
e
f
f
gh
i
j,
k
k'
1
m
n+
0o
n
0o
n
0
0opo
.p
TABLE V-2
- POSSIBLE CONTRIBUTIONS TO OUR PECULIAR VELOCITY*
Rotation (0 = 250)
To M31, v = 90
To Virgo, v = 1000e
*unit = km sec 1
vz
186
59
220E
N
, ~~~---- -
3.7 ± 1.23.7 ± 1.23.2 ± 1.02.8 ± 0.63.5 ± 1.03.0 + 0.5
269 + 0.16* -- 0.21
.78 + 0.12S -- 0.17
2.0 + 0.8
3.16 + 0.26
2.56+ 0.172.56 020.222.9 + 0.72.4 .+ 0.7 -
2.4+ 0.40- 0.44
2.61 + 0.25~ 2.3
3.22 ± 0.15 Oph3.0 ± 0.6 CPer3.75 + 0.50
- 2.82< 7.0 -
<4.74< 6.6< 5.43<8.11
8 + 2.28.3-- 1.3
z 3.6, 5.5, 7.0
3.1 1+0.5- 2.0
1+ 0.42.7-0.2
2.8 + 0.2
{ 2.7S3.4
+