nsca 2007 p001-xxx - iaqm · aboutenvironmentalprotectionuk...
TRANSCRIPT
Air Quality andClimate Change:
Integrating PolicyWithin Local Authorities
About Environmental Protection UKEnvironmental Protection UK is a national charity that provides expert policy analysis and advice onair quality, land quality, waste and noise and their effects on people and communities in terms of awide range of issues including public health, planning, transport, energy and climate.
We offer clear and critical analysis of UK government and European Union policy proposals through arange of high-quality publications and expert-led events, as well as up-to-date regulatory informationthrough our comprehensive guide to UK and EU environment legislation.
We bring together policy-makers, business, local authorities and academics to enable and fostersuccessful partnerships for environmental action and provide networking opportunities to support thecareers of environmental professionals and allow them to share best practice.
Our structure enables us to take a progressive and pragmatic approach to the issues which concern usand, on behalf of our wide and extensive cross-sector membership, to promote integrated and effectivepolicy-making which supports sensible and workable solutions to pressing environmental challenges.
Environmental Protection UK works with and for UK national and devolved governments, localauthorities, business, academics and the general public, and with relevant EU institutions and NGOs.
Environmental Protection UK44 Grand ParadeBrighton BN2 9QA
Tel: 01273 878770www.environmental-protection.org.uk
Registered Charity No. 221026
CreditsThe document was edited principally by Ed Dearnley at Environmental Protection UK.
Environmental Protection UK gratefully acknowledges the assistance provided by organisations whocommented on earlier drafts; these included:• AEA Technology• Campaign for Clean Air in London• City of London• The Environment Agency• Local Government Regulation (formerly LACORS)• SLH Environmental Ltd• University of the West of England, Bristol
Cover image: Traffic, solar panel and flues cover images are copyright of Ssuaphotos, Elena Elisseeva and happydancing,2010 Used under license from Shutterstock.com. London bus image by Oxyman© Environmental Protection UK 2011
This guidance was commissioned by the City of London, with fundingprovided by Defra under the Air Quality Grants programme.
Air Quality and Climate Change: Integrating Policy in Local Authorities �
1
Foreword – Air Quality and Climate Change:Integrating Policy in Local Authorities
Climate change presents one of the most significant environmental challenges facing humanity, and the UK is committed tomaking significant cuts in emissions of greenhouse gases. Poor air quality in our towns and cities is a major cause ofpremature death and serious illness for the people who live and work there. Both issues cannot be dealt with by nationaland international measures alone, and local authorities have a key role in coordinating effective action at the local level.
An integrated approach to tackling air quality and climate change makes sound sense. The emissions that pollute our airand those that warm the planet have common sources: vehicles, buildings, power generation and industry. Defra’s recent‘Air Pollution: Action in a Changing Climate’ document set out how policies could be aligned at a national level; however,integrating policy at a local level is also strongly desirable.
Environmental Protection UK and the Carbon Action Network both have a long history of supporting local authorities withtheir environmental duties. We provide training and networking opportunities for our members, and disseminate bestpractice through our publications, workshops and regional networks. With local authorities currently experiencing extremefinancial pressures, we hope that this new guidance will help them take forward a strategic approach to addressing airquality and climate change through joint actions, using resources efficiently to generate ‘win/ win’ outcomes.
This guidance includes several case studies. Many local authorities are now developing best practice in this area, takingforward innovative actions that tackle both sets of emissions. By working together, and learning from each other, we canensure that the air is fit for us to breathe now, and that the climate is protected for generations to come.
Caroline Jackson (President, environmental Protection UK)
Andy Stephenson (Chair, Carbon Action Network)
� Air Quality and Climate Change: Integrating Policy in Local Authorities
2
Contents
Foreword ........................................................................................................................................1
Executive Summary.....................................................................................................................3
1. Why do We Care about Air Pollution? .................................................................................4
2. Why do We Care about Climate Change?............................................................................7
3. Trends in Greenhouse Gas and Air Pollutant Emissions and Concentrations ..............9
4. Air Quality and Climate Change Interactions..................................................................13
5. Benefits of Integrating Air Quality and Climate Change Policy ..................................15
6. Developing an Integrated Approach..................................................................................17
7. Common Measures and Their Impacts on Air Quality and Climate Change...............20
Appendix A – Local Authority Plans and Strategies............................................................37
Appendix B – Glossary of Terms Used ....................................................................................42
EXECUTIVE SUMMARY
Poor air quality and climate change have a direct impact on the health and well-being of both humans andthe natural environment. In the UK over 35,000 annual premature deaths are thought to be attributable toair pollution, whilst climate change threatens to pose significant health and environmental challenges in theyears to come. Local authorities have a pivotal role in managing both air quality and the causes and effectsof climate change, and it is a well recognised fact that the UK will not be able to manage either problemwithout a significant input at the local level. The UK has a legislative framework to manage both emissionsof greenhouse gases and air quality, and under this local authorities have a range of bindingresponsibilities covering both areas.
Air quality and climate change are fundamentally interrelated. Many common air pollutants are ‘climateactive’, and reducing emissions will lessen the warming effect on our climate. A warming climate alsothreatens to make air quality worse, with the prevalence of harmful photochemical smogs likely to increasethroughout longer, hotter summers. The processes of managing emissions of air pollutants andgreenhouse gases are also interconnected. Both sets of emissions largely arise from the same combustionprocesses – vehicle engines, power generation, homes and industry. If impacts of both sets of emissionsare not considered in policy decisions the results can be unintentional trade-offs, with one set of emissionsfalling at the expense of an increase in emissions of the other.
The benefits of an integrated approach are significant. Foremost amongst them is that integrated policyis cheaper to implement – measures can be prioritised to ensure that they benefit both areas, rather thantwo sets of measures being implemented separately. Integrated measures also help to spread benefitsover a long timescale. The benefits of reducing greenhouse gas emissions will be felt several decades inthe future, whilst air quality benefits are felt ‘here and now’ in the form of improved public health andenvironmental improvement. If policy is not integrated unintentional increases in emissions of air pollutantsor greenhouse gases can occur, requiring costly remedial measures to mitigate the impacts.
Local authorities benefit greatly from an integrated approach to climate change and air quality – greaterbenefits still can be achieved if this approach were to be extended to include other local environmentalissues such as noise. The foundation of an integrated approach is a close working relationship betweenstaff and elected members working on the issues, which with staff often working in different departmentscan be challenging to achieve. Climate change and air quality strategies cannot on their own implementthe full range of actions they may propose – to do this they need to influence other plans and strategiesthat guide a local authority’s services. Key functions include planning, transportation and housing. Ideallythis should be done via a top down approach, with policy ‘hooks’ in documents such as the SustainableCommunity Strategy and the Local Development Framework.
This document, developed by Environmental Protection UK, sets out why local authorities need totackle air quality and climate change (sections 1 to 4), and outlines the benefits of an integrated approach(section 5). It also examines how local authorities can successfully implement integrated policy, andintroduce integrated policy into the relevant plans and strategies that guide a local authority’s functions(section 6). Finally it examines some common measures that local authorities can promote to reduceemissions of local air pollutants and greenhouse gases, and whether these measures benefit both sets ofemissions, or whether cuts in one set of emissions will be at the expense of a rise in the other (section 7).
This guidance can be applied throughout the UK, however in the devolved administrations alternativelegislation and practice may need to be taken into account.
3
Air Quality and Climate Change: Integrating Policy in Local Authorities �
Key Points• Better air quality protects human health and sensitive
ecosystems.• Currently at least 35,000 premature deaths a year in the UK
can be attributed to air pollution, around 6% of all deaths.Some research suggests this figure may be as high as50,000.
• The main pollutants of concern in the UK are particulatematter (PM2.5 and PM10)1, nitrogen dioxide (NO2), ozone (O3),sulphur dioxide (SO2) and ammonia (NH3).
• The European Union (EU) has set legally binding LimitValues for concentrations of these and other pollutants inoutdoor (ambient) air.
• Air quality is an issue for local authorities, who havestatutory duties under the Local Air Quality Managementregime, in addition to responsibilities aroundimplementation of the Clean Air Act and, in England, Walesand Northern Ireland, regulation of certain industrialactivities.
Human Health – Air Pollution Causes Premature Deathand Serious Illness
Human exposure to air pollution is associated with prematuredeath and serious illness from cardiovascular (heart) andcardiopulmonary (lung) disease. In addition, existing healthconditions, such as asthma, can be exacerbated by airpollution. Of the common air pollutants, particulate matter isthought to be the most harmful in terms of health, and efforts toquantify the health impacts of air pollution have thereforecentred on this pollutant. The most common ways of expressingthe health impacts of air pollution are through numbers ofpremature deaths in a particular area, average months of lifelost across a population (e.g. UK or a city region) and theestimated economic cost of poor health caused by air pollution.
Premature deaths are perhaps the most graphic way ofquantifying the scale and nature of the air quality issue. In 2010the House of Common’s Environmental Audit Committee2
concluded that, at present, 35,000 people in the UK dieprematurely due to poor air quality every year – nearly 6% of allannual deaths in the UK – with some evidence suggesting thatthis figure could be as high as 50,000.
Average number of life years, or months, lost is also oftenused for quantifying the health impacts of air pollution. The UKAir Quality Strategy3 estimates that air pollution reduces
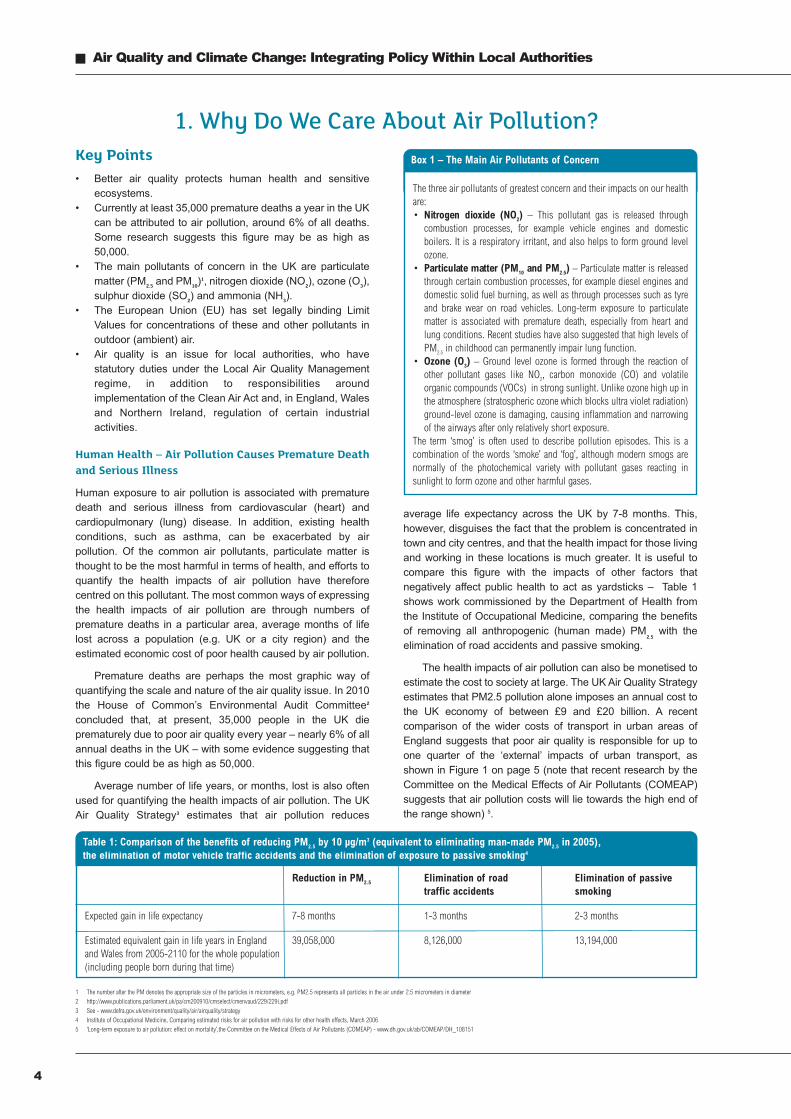
average life expectancy across the UK by 7-8 months. This,however, disguises the fact that the problem is concentrated intown and city centres, and that the health impact for those livingand working in these locations is much greater. It is useful tocompare this figure with the impacts of other factors thatnegatively affect public health to act as yardsticks – Table 1shows work commissioned by the Department of Health fromthe Institute of Occupational Medicine, comparing the benefitsof removing all anthropogenic (human made) PM
2.5with the
elimination of road accidents and passive smoking.
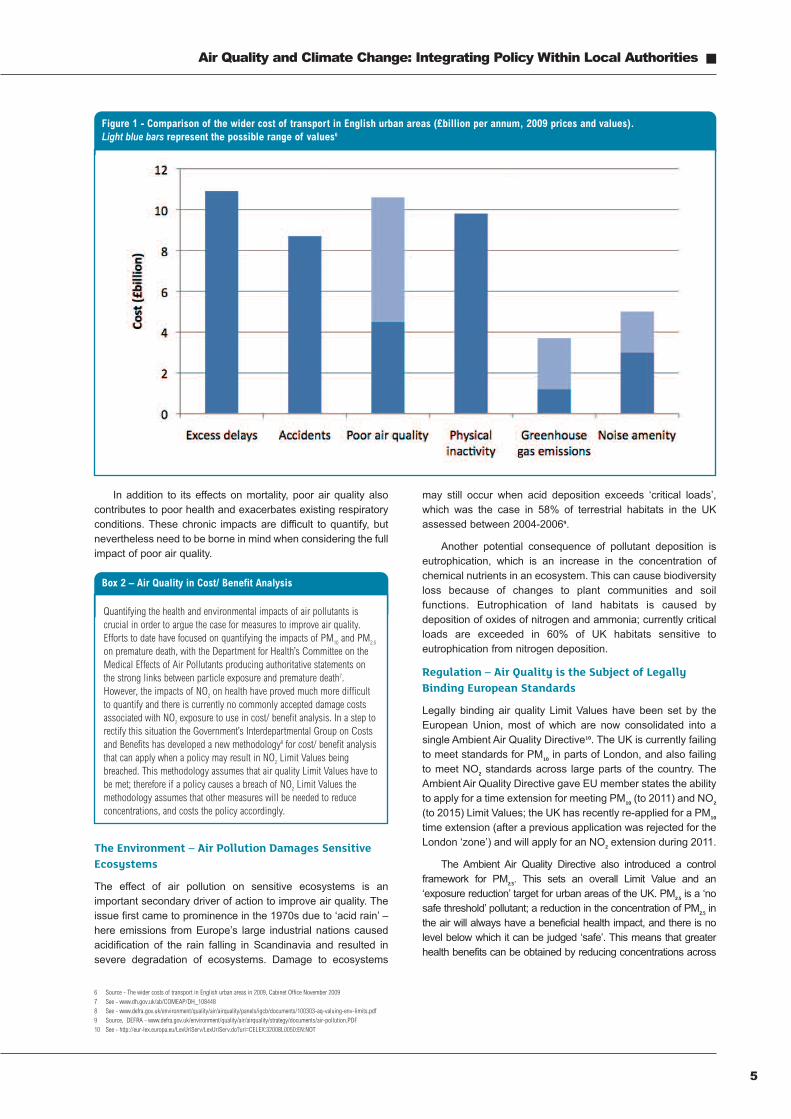
The health impacts of air pollution can also be monetised toestimate the cost to society at large. The UKAir Quality Strategyestimates that PM2.5 pollution alone imposes an annual cost tothe UK economy of between £9 and £20 billion. A recentcomparison of the wider costs of transport in urban areas ofEngland suggests that poor air quality is responsible for up toone quarter of the ‘external’ impacts of urban transport, asshown in Figure 1 on page 5 (note that recent research by theCommittee on the Medical Effects of Air Pollutants (COMEAP)suggests that air pollution costs will lie towards the high end ofthe range shown) 5.
� Air Quality and Climate Change: Integrating Policy Within Local Authorities
4
1 The number after the PM denotes the appropriate size of the particles in micrometers, e.g. PM2.5 represents all particles in the air under 2.5 micrometers in diameter2 http://www.publications.parliament.uk/pa/cm200910/cmselect/cmenvaud/229/229i.pdf3 See - www.defra.gov.uk/environment/quality/air/airquality/strategy4 Institute of Occupational Medicine, Comparing estimated risks for air pollution with risks for other health effects, March 20065 ‘Long-term exposure to air pollution: effect on mortality’,the Committee on the Medical Effects of Air Pollutants (COMEAP) - www.dh.gov.uk/ab/COMEAP/DH_108151
Table 1: Comparison of the benefits of reducing PM2.5 by 10 µg/m3 (equivalent to eliminating man-made PM2.5 in 2005),the elimination of motor vehicle traffic accidents and the elimination of exposure to passive smoking4
Reduction in PM2.5 Elimination of road Elimination of passivetraffic accidents smoking
Expected gain in life expectancy 7-8 months 1-3 months 2-3 months
Estimated equivalent gain in life years in England 39,058,000 8,126,000 13,194,000and Wales from 2005-2110 for the whole population(including people born during that time)
Box 1 – The Main Air Pollutants of Concern
The three air pollutants of greatest concern and their impacts on our healthare:• Nitrogen dioxide (NO2) – This pollutant gas is released throughcombustion processes, for example vehicle engines and domesticboilers. It is a respiratory irritant, and also helps to form ground levelozone.
• Particulate matter (PM10 and PM2.5) – Particulate matter is releasedthrough certain combustion processes, for example diesel engines anddomestic solid fuel burning, as well as through processes such as tyreand brake wear on road vehicles. Long-term exposure to particulatematter is associated with premature death, especially from heart andlung conditions. Recent studies have also suggested that high levels ofPM2.5 in childhood can permanently impair lung function.
• Ozone (O3) – Ground level ozone is formed through the reaction ofother pollutant gases like NO2, carbon monoxide (CO) and volatileorganic compounds (VOCs) in strong sunlight. Unlike ozone high up inthe atmosphere (stratospheric ozone which blocks ultra violet radiation)ground-level ozone is damaging, causing inflammation and narrowingof the airways after only relatively short exposure.
The term ‘smog’ is often used to describe pollution episodes. This is acombination of the words ‘smoke’ and ‘fog’, although modern smogs arenormally of the photochemical variety with pollutant gases reacting insunlight to form ozone and other harmful gases.
1. Why Do We Care About Air Pollution?
In addition to its effects on mortality, poor air quality alsocontributes to poor health and exacerbates existing respiratoryconditions. These chronic impacts are difficult to quantify, butnevertheless need to be borne in mind when considering the fullimpact of poor air quality.
The Environment – Air Pollution Damages SensitiveEcosystems
The effect of air pollution on sensitive ecosystems is animportant secondary driver of action to improve air quality. Theissue first came to prominence in the 1970s due to ‘acid rain’ –here emissions from Europe’s large industrial nations causedacidification of the rain falling in Scandinavia and resulted insevere degradation of ecosystems. Damage to ecosystems
may still occur when acid deposition exceeds ‘critical loads’,which was the case in 58% of terrestrial habitats in the UKassessed between 2004-20069.
Another potential consequence of pollutant deposition iseutrophication, which is an increase in the concentration ofchemical nutrients in an ecosystem. This can cause biodiversityloss because of changes to plant communities and soilfunctions. Eutrophication of land habitats is caused bydeposition of oxides of nitrogen and ammonia; currently criticalloads are exceeded in 60% of UK habitats sensitive toeutrophication from nitrogen deposition.
Regulation – Air Quality is the Subject of LegallyBinding European Standards
Legally binding air quality Limit Values have been set by theEuropean Union, most of which are now consolidated into asingle Ambient Air Quality Directive10. The UK is currently failingto meet standards for PM10 in parts of London, and also failingto meet NO2 standards across large parts of the country. TheAmbient Air Quality Directive gave EU member states the abilityto apply for a time extension for meeting PM10 (to 2011) and NO2
(to 2015) Limit Values; the UK has recently re-applied for a PM10
time extension (after a previous application was rejected for theLondon ‘zone’) and will apply for an NO2 extension during 2011.
The Ambient Air Quality Directive also introduced a controlframework for PM2.5. This sets an overall Limit Value and an‘exposure reduction’ target for urban areas of the UK. PM2.5 is a ‘nosafe threshold’ pollutant; a reduction in the concentration of PM2.5 inthe air will always have a beneficial health impact, and there is nolevel below which it can be judged ‘safe’. This means that greaterhealth benefits can be obtained by reducing concentrations across
5
Air Quality and Climate Change: Integrating Policy Within Local Authorities �
Figure 1 - Comparison of the wider cost of transport in English urban areas (£billion per annum, 2009 prices and values).Light blue bars represent the possible range of values6
6 Source - The wider costs of transport in English urban areas in 2009, Cabinet Office November 20097 See - www.dh.gov.uk/ab/COMEAP/DH_1084488 See - www.defra.gov.uk/environment/quality/air/airquality/panels/igcb/documents/100303-aq-valuing-env-limits.pdf9 Source, DEFRA - www.defra.gov.uk/environment/quality/air/airquality/strategy/documents/air-pollution.PDF10 See - http://eur-lex.europa.eu/LexUriServ/LexUriServ.do?uri=CELEX:32008L0050:EN:NOT
Box 2 – Air Quality in Cost/ Benefit Analysis
Quantifying the health and environmental impacts of air pollutants iscrucial in order to argue the case for measures to improve air quality.Efforts to date have focused on quantifying the impacts of PM10 and PM2.5
on premature death, with the Department for Health’s Committee on theMedical Effects of Air Pollutants producing authoritative statements onthe strong links between particle exposure and premature death7.However, the impacts of NO2 on health have proved much more difficultto quantify and there is currently no commonly accepted damage costsassociated with NO2 exposure to use in cost/ benefit analysis. In a step torectify this situation the Government’s Interdepartmental Group on Costsand Benefits has developed a new methodology8 for cost/ benefit analysisthat can apply when a policy may result in NO2 Limit Values beingbreached. This methodology assumes that air quality Limit Values have tobe met; therefore if a policy causes a breach of NO2 Limit Values themethodology assumes that other measures will be needed to reduceconcentrations, and costs the policy accordingly.
large urban areas, rather than targeting hot spot areas whereconcentrations are above set levels. Both the Limit Value andexposure reduction target need to be achieved by 2020.
The consequence of not meeting European Limit Values forambient air quality is legal action by the European Commission,and ultimately large fines imposed on the UK. These couldreportedly reach £300 million per pollutant per year if the LimitValues are not achieved11.
Air Quality is an Issue for Local Authorities – Local AirQuality Management
The Environment Act (1995) established the Local Air QualityManagement (LAQM) framework for local authorities (inNorthern Ireland LAQM was established by the Environment(Northern Ireland) Order 2002). LAQM requires individual localauthorities to periodically assess air quality, and identifylocations where the national air quality objectives may not bemet by their target dates. Where any such exceedances arepredicted, and where there is relevant public exposure, localauthorities have a duty to declare Air Quality ManagementAreas (AQMAs) following a process of consultation. Suchdesignations are a statutory requirement, with local authoritiesin all parts of the UK having a duty to ‘work towards’ achievingthe national air quality objectives for seven key pollutants12.
Following the designation of AQMAs, local authorities arerequired to develop Air Quality Action Plans (AQAPs) to identifyand implement actions to improve air quality locally. Such plansrequire effective collaboration between local authoritydepartments, external agencies and stakeholders (such asenvironmental regulators, the Highways Agency and industry).Land-use planning and transport planning also underpin thedevelopment of effective air quality action plans, and closeliaison between air quality and planning officers is thereforecritical to improving air quality.
At the time of writing, 234 local authorities across the UKhad declared AQMAs, with the number rising over time ratherthan falling. In 2010 Defra and the devolved administrationsreleased a review of the LAQM regime13, highlighting that LAQMhad been very good at identifying areas of poor air quality, butless successful on taking action to improve these. The reviewrecommended that Defra and the devolved administrationsshould be more prescriptive regarding what they wanted localauthorities to achieve if they wanted LAQM to take more of a
role in improving air quality. During a conference in 2009, thethen Defra Minister for Air Quality Jim Fitzpatrick hinted that anyfines imposed by the European Commission for failing to meetair quality Limit Values may be shared with local authorities,although he did not identify a mechanism for doing this.
Local authorities have duties under the Clean Air Act,ensuring that solid fuel appliances meet legal standards andthat emissions of smoke from domestic and industrial premisesare well controlled. In England and Wales local authorities arealso involved in environmental permitting for smaller industrialoperations under the Local Authority Pollution Prevention andControl regime; these duties include setting and enforcingpermit conditions on emissions of pollutants to the air.
In 2008, a new framework for local authority performanceindicators was introduced in England and Wales, reducing thenumber of indicators to 198. Local authorities are required tomonitor all of the indicators; however, they are only required toset improvement targets for up to 35 indicators as part of multiagency Local Area Agreements. For air quality the relevantindicator is NI 194 (Air quality - % reduction in NOx and primaryPM10 emissions through a local authority's estate andoperations). NI 194 is mirrored by the climate change indictor NI185, with the same data used to calculate both indicators.
� Air Quality and Climate Change: Integrating Policy Within Local Authorities
6
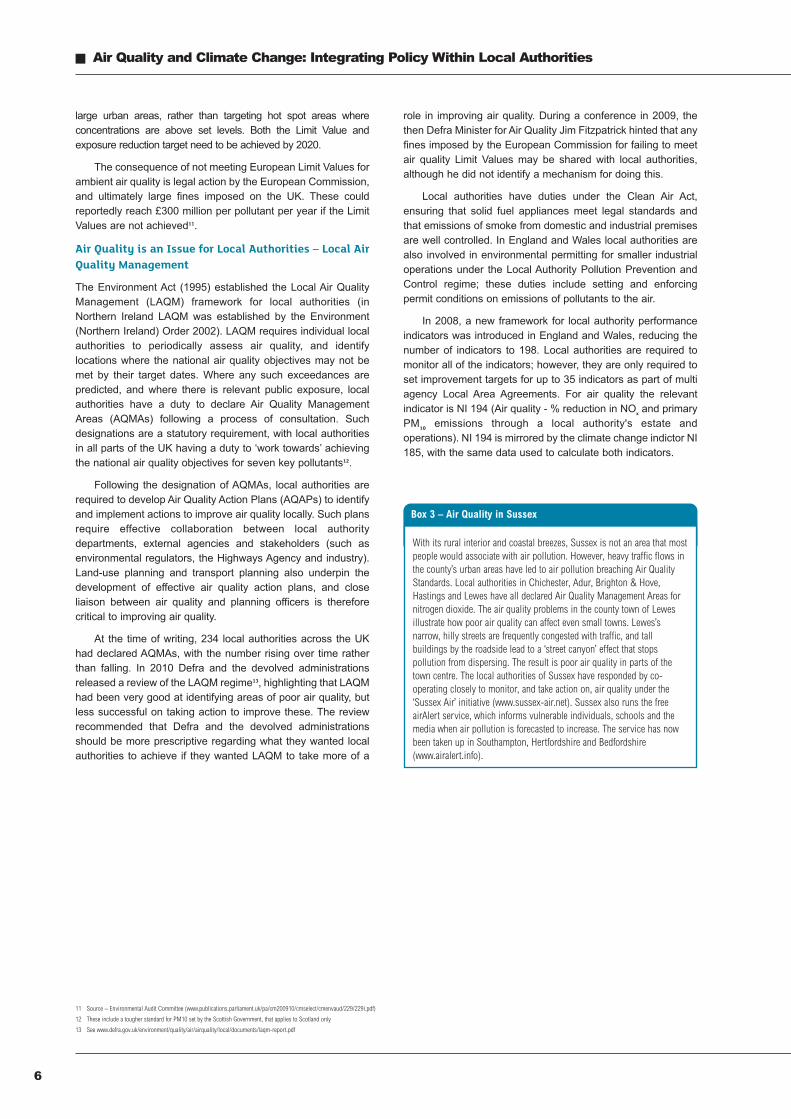
Box 3 – Air Quality in Sussex
With its rural interior and coastal breezes, Sussex is not an area that mostpeople would associate with air pollution. However, heavy traffic flows inthe county’s urban areas have led to air pollution breaching Air QualityStandards. Local authorities in Chichester, Adur, Brighton & Hove,Hastings and Lewes have all declared Air Quality Management Areas fornitrogen dioxide. The air quality problems in the county town of Lewesillustrate how poor air quality can affect even small towns. Lewes’snarrow, hilly streets are frequently congested with traffic, and tallbuildings by the roadside lead to a ‘street canyon’ effect that stopspollution from dispersing. The result is poor air quality in parts of thetown centre. The local authorities of Sussex have responded by co-operating closely to monitor, and take action on, air quality under the‘Sussex Air’ initiative (www.sussex-air.net). Sussex also runs the freeairAlert service, which informs vulnerable individuals, schools and themedia when air pollution is forecasted to increase. The service has nowbeen taken up in Southampton, Hertfordshire and Bedfordshire(www.airalert.info).
11 Source – Environmental Audit Committee (www.publications.parliament.uk/pa/cm200910/cmselect/cmenvaud/229/229i.pdf)
12 These include a tougher standard for PM10 set by the Scottish Government, that applies to Scotland only
13 See www.defra.gov.uk/environment/quality/air/airquality/local/documents/laqm-report.pdf
Key Points• The concentration of greenhouse gases in our atmosphere has
been increasing since pre-industrial times due to emissionsfrom human activities. The climate is warming as a result, andis likely to continue to do so over forthcoming years (even withemissions reductions). The consequences of this include morefrequent extreme weather events and sea level rises.
• The pre-eminent legislative driver for reducing UKgreenhouse gas emissions is now the Climate Change Act(2008) and in Scotland, the Climate Change (Scotland) Act(2009); these both set a legally binding target of an 80%reduction in emissions from 1990 levels by 2050. The‘steps’ to this target are 5 year carbon budgets set by theGovernment (in Scotland these are annual budgets set bythe Scottish Government).
• Local authorities have a key role to play in both reducinggreenhouse gas emissions and adapting communities toclimate change. An evolving framework of mandatory andvoluntary commitments is driving local authorities to act inthis area.
Greenhouse Gases are Changing the Global Climate
The process of climate change relates to levels of ‘greenhousegases’ in the Earth’s atmosphere. For many years it has beenknown that gases such as carbon dioxide and methane have awarming effect; they let heat from the sun in, but trap re-radiated heat from the Earth within the atmosphere. Without thisnatural greenhouse effect, the Earth would be too cold forcomplex life to exist. However, the increasing levels ofatmospheric greenhouse gases that have been measured overrecent decades are cause for concern.
The most significant greenhouse gas, due to the quantityreleased, is carbon dioxide (CO2). Since the pre-industrial era theconcentration of CO2 in the atmosphere has increased from about280 parts per million to 380 parts per million, largely due toemissions from the combustion of fossil fuels and human inducedland use changes. Observations have shown that the world is nowwarming as a result, and modelling predicts that if we continue to
emit CO2 and other greenhouse gases at present rates there willbe a significant change in the climate over coming decades.
The consequences of unabated climate change would besignificant, with increased temperatures, sea level rises and agreater frequency of extreme weather events having seriouseffects on the natural environment, as well as on human healthand well-being. Projections for the UK climate under a numberof different scenarios have been provided by Defra under the‘UK Climate Projections’ programme14.
The UK Has Legal Obligations to Reduce GreenhouseGas Emissions
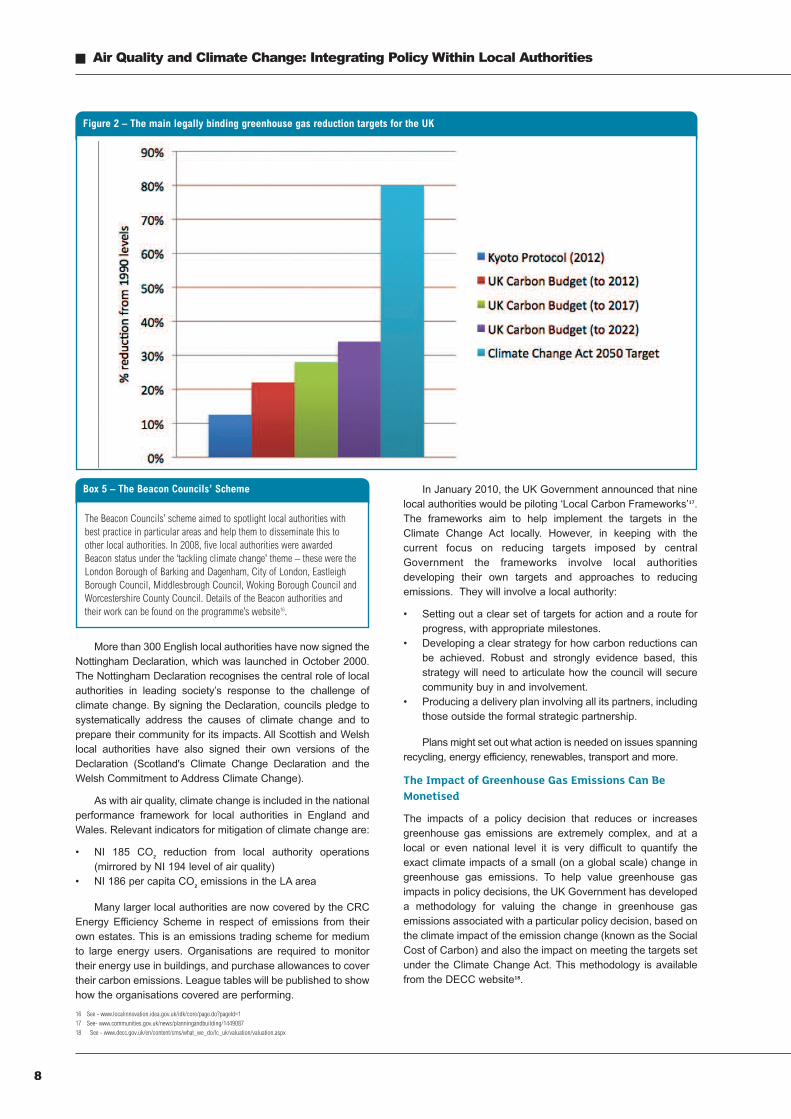
The UK is legally bound by a number of international andnational agreements to reduce its emissions of greenhousegases. The first and most well known of these is the UnitedNations Framework Convention on Climate Change (UNFCCC)and the Kyoto Protocol, which binds the UK to reduceemissions of greenhouse gases by 12.5% from 1990 levels by2020. Further agreements have been set at EU level – underthe Greenhouse Gas (GHG) Effort Sharing Decision the UK isobliged to reduce emissions from non-emissions traded sectors(i.e. excludes large scale industry and power generation)equivalent to 16% below 2005 levels, by 2020.
In 2008 the Climate Change Act was passed, which is now(with the exception of Scotland) the UK’s primary climatechange framework legislation. The Act commits the UKGovernment to achieving an 80% cut in CO2 emissions (from1990 levels) by 2050. Under the Act, the Government sets aseries of 5-year carbon ‘budgets’, with three successivebudgets always in legislation. The first three budgets were setalongside the (financial) Budget in 2009, committing to cuts(from 1990 levels) of 22% by 2012, 28% by 2017 and 34% by2022. The official Government advisory body for setting targetsand budgets under the Act is the Committee on ClimateChange. In Scotland, the Scottish Government set an 80%reduction in emissions by 2050 in the Climate Change(Scotland) Act 2009. The Scottish Act differs from the UK Actwith a tougher (42% cut vs. 34%) interim 2020 target, andannual carbon targets set by Scottish Ministers rather than 5year ‘budgets’.
In 2008, UK emissions of greenhouse gases were 22%below 1990 levels. Much of this decrease is due to growth in theuse of natural gas for electricity generation that took place in the1990s. Preliminary figures for 200915 suggest that a largedecrease in greenhouse gas emissions took place between2008-2009, which is at least partly due to the economicrecession during this time.
Climate Change is a Local Issue
It is well recognised that national action alone cannot deliver thetargets set in the Climate Change Act, and that local authoritiesand their partners have a key role in both reducing emissions ofgreenhouse gases and adapting communities to the effects of achanging climate. A system of voluntary commitments,performance indicators and targets has evolved to encouragelocal authorities to take action.
7
Air Quality and Climate Change: Integrating Policy Within Local Authorities �
14 http://ukclimateprojections.defra.gov.uk/15 See www.decc.gov.uk/en/content/cms/statistics/climate_change/gg_emissions/uk_emissions/uk_emissions.aspx
Box 4 – The Impact of Climate Change in Yorkshire andthe Humber
Key agencies, including local authorities, in the Yorkshire and the Humberarea have come together to form a Climate Change Partnership for theregion. As part of their work the partnership has carried out an adaptationstudy to assess the projected climate changes that the region will face by2050, and how these climate changes will impact on the region’s society,infrastructure, businesses and services. The study also explored whatorganisations in the region need to do now to adapt to these predictedimpacts. Potential climate impacts on the region identified by the studyincluded:• Annual average daily temperatures rising, by almost 2°C• Extreme hot temperatures will increase, with summer temperaturesmore regularly reaching 34°C
• Greater seasonality of rainfall, with increases in winter combined withsignificant reductions in summer
• In northern and upland areas, an increase in the number of extremerainfall events
2. Why Do We Care About Climate Change?
More than 300 English local authorities have now signed theNottingham Declaration, which was launched in October 2000.The Nottingham Declaration recognises the central role of localauthorities in leading society’s response to the challenge ofclimate change. By signing the Declaration, councils pledge tosystematically address the causes of climate change and toprepare their community for its impacts. All Scottish and Welshlocal authorities have also signed their own versions of theDeclaration (Scotland's Climate Change Declaration and theWelsh Commitment to Address Climate Change).
As with air quality, climate change is included in the nationalperformance framework for local authorities in England andWales. Relevant indicators for mitigation of climate change are:
• NI 185 CO2 reduction from local authority operations(mirrored by NI 194 level of air quality)
• NI 186 per capita CO2 emissions in the LA area
Many larger local authorities are now covered by the CRCEnergy Efficiency Scheme in respect of emissions from theirown estates. This is an emissions trading scheme for mediumto large energy users. Organisations are required to monitortheir energy use in buildings, and purchase allowances to covertheir carbon emissions. League tables will be published to showhow the organisations covered are performing.
In January 2010, the UK Government announced that ninelocal authorities would be piloting ‘Local Carbon Frameworks’17.The frameworks aim to help implement the targets in theClimate Change Act locally. However, in keeping with thecurrent focus on reducing targets imposed by centralGovernment the frameworks involve local authoritiesdeveloping their own targets and approaches to reducingemissions. They will involve a local authority:
• Setting out a clear set of targets for action and a route forprogress, with appropriate milestones.
• Developing a clear strategy for how carbon reductions canbe achieved. Robust and strongly evidence based, thisstrategy will need to articulate how the council will securecommunity buy in and involvement.
• Producing a delivery plan involving all its partners, includingthose outside the formal strategic partnership.
Plans might set out what action is needed on issues spanningrecycling, energy efficiency, renewables, transport and more.
The Impact of Greenhouse Gas Emissions Can BeMonetised
The impacts of a policy decision that reduces or increasesgreenhouse gas emissions are extremely complex, and at alocal or even national level it is very difficult to quantify theexact climate impacts of a small (on a global scale) change ingreenhouse gas emissions. To help value greenhouse gasimpacts in policy decisions, the UK Government has developeda methodology for valuing the change in greenhouse gasemissions associated with a particular policy decision, based onthe climate impact of the emission change (known as the SocialCost of Carbon) and also the impact on meeting the targets setunder the Climate Change Act. This methodology is availablefrom the DECC website18.
� Air Quality and Climate Change: Integrating Policy Within Local Authorities
8
Figure 2 – The main legally binding greenhouse gas reduction targets for the UK
Box 5 – The Beacon Councils’ Scheme
The Beacon Councils’ scheme aimed to spotlight local authorities withbest practice in particular areas and help them to disseminate this toother local authorities. In 2008, five local authorities were awardedBeacon status under the ‘tackling climate change' theme – these were theLondon Borough of Barking and Dagenham, City of London, EastleighBorough Council, Middlesbrough Council, Woking Borough Council andWorcestershire County Council. Details of the Beacon authorities andtheir work can be found on the programme’s website16.
16 See - www.localinnovation.idea.gov.uk/idk/core/page.do?pageId=117 See- www.communities.gov.uk/news/planningandbuilding/144908718 See - www.decc.gov.uk/en/content/cms/what_we_do/lc_uk/valuation/valuation.aspx
Key Points• Concentrations of common air pollutants in many urban
areas of the UK remain high, despite UK wide emissions ofmost air pollutants falling significantly. This is due to thelocalised nature of air pollution – UK average figures hide acomplex local picture.
• UK emissions of CO2 (and other greenhouse gases) havefallen over recent years but, as global emissions are stillincreasing, the concentration of CO2 in the atmosphere iscontinuing to rise.
• Transport (particularly road transport) is a ‘problem sector’for both sets of emissions, and reductions in emissions fromindividual vehicles are being offset by the rising number ofvehicles on the roads.
Emissions Are Falling, but Concentrations Are NotFollowing Suit
UK emissions of the main greenhouse gas (CO2) and mostother major air pollutants have been falling over recent years.However, the local concentrations of these pollutants in the airhave not simply followed this overall decline. CO
2
concentrations are rising rapidly, mainly due to increasingemissions from outside of the UK. Meanwhile UK wide averagefigures for air quality hide a complex local picture, withconcentrations of pollutants in many urban areas static or evenincreasing. This situation is summarised in Table 2 below.
Note that several common air pollutants are ‘climate active’and have a warming effect on the climate. These include ozoneand black carbon (black carbon, or soot, forms part of what werefer to as particulate matter). The concentration of thesepollutants in the air therefore has an impact on climate, as well asair quality. These factors are considered in more depth on page 13.
The Damage Caused by Air Pollutant EmissionsDepends Upon Where They Are Emitted
Local air pollutants have a direct impact on human health andecosystems, and the location where they are emitted istherefore of great importance. Emissions from a vehicle in ahighly populated urban area, for example, will have a muchgreater impact on human health than those emitted by the samevehicle in a sparsely populated rural area. By contrast CO2 in
the air is non-toxic at the concentrations we normallyexperience, and even around major power stations and queuingtraffic, CO2 presents no direct danger to human health. Ittherefore doesn’t really matter where on the Earth’s surfacecarbon dioxide is emitted – a kilogram of CO2 emitted in themiddle of London will have much the same impact as a kilogramof CO2 emitted in the middle of the Atlantic Ocean.
In addition to the actual emissions, the concentration of airpollutants that people are exposed to depends on a number ofother factors, which are summarised in Box 6 below. Carbondioxide has a relatively long life in the atmosphere and is fairlyevenly mixed in with other atmospheric gases. Backgroundconcentrations of CO2 in the atmosphere therefore tend to besimilar all over the globe. CO2 exists in a ‘carbon cycle’ – CO2 isemitted from burning fossil fuels as well as through naturalprocesses, and is then absorbed by growing vegetation ordissolved into the oceans. Emissions from human activities areunbalancing this cycle, with more CO2 being emitted than can beabsorbed.As a result, the concentration in the atmosphere is rising.
UK Emissions of Greenhouse Gases Are Falling, butGlobal Atmospheric Concentrations Are Still Rising
UK emissions of greenhouse gases fell from 735 to 628 milliontonnes of CO2 equivalent between 1990 and 2008. The first halfof this period saw a large reduction in emissions from powergeneration. Decreases in emissions since 2000 have been morebroad-based, with falling emissions in many sectors. Somesectors, most notably transport, have bucked the falling trend andhave seen steady increases in emissions since the 1990baseline. See Figure 4, page 10.
9
Air Quality and Climate Change: Integrating Policy Within Local Authorities �
3. Trends in Greenhouse Gas andAir Pollutant Emissions and Concentrations
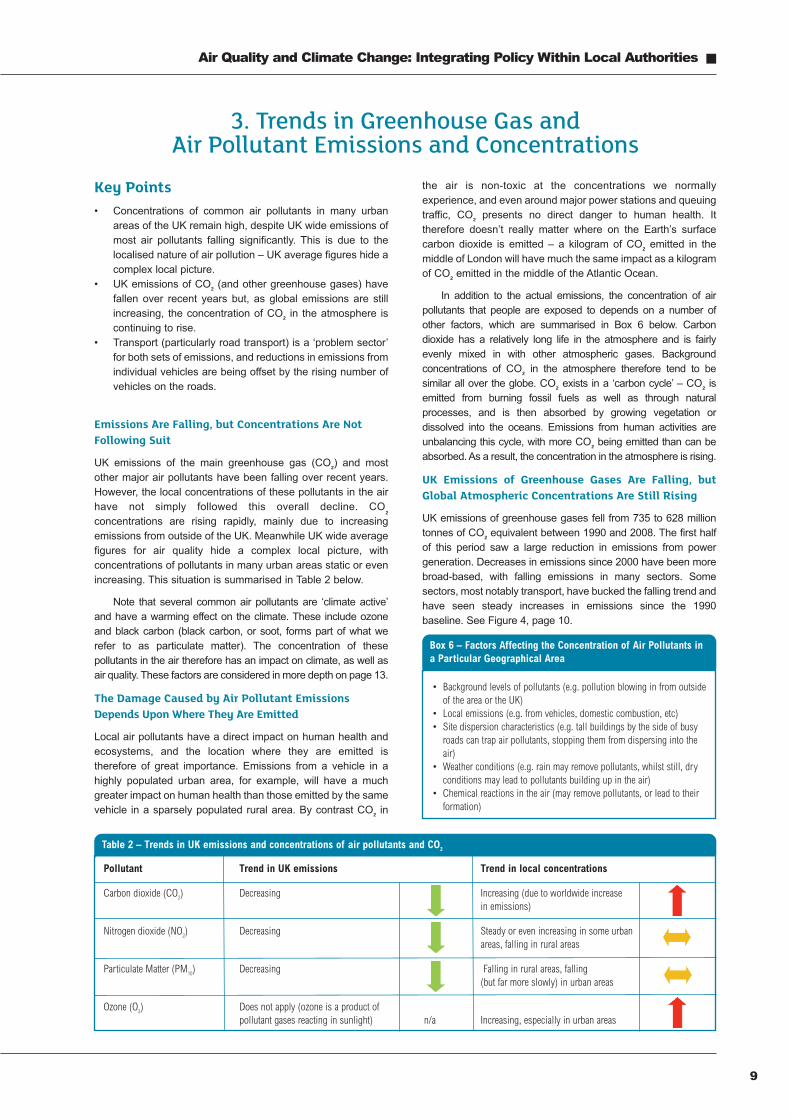
Table 2 – Trends in UK emissions and concentrations of air pollutants and CO2
Pollutant Trend in UK emissions Trend in local concentrations
Carbon dioxide (CO2) Decreasing Increasing (due to worldwide increasein emissions)
Nitrogen dioxide (NO2) Decreasing Steady or even increasing in some urbanareas, falling in rural areas
Particulate Matter (PM10) Decreasing Falling in rural areas, falling(but far more slowly) in urban areas
Ozone (O3) Does not apply (ozone is a product ofpollutant gases reacting in sunlight) n/a Increasing, especially in urban areas
Box 6 – Factors Affecting the Concentration of Air Pollutants ina Particular Geographical Area
• Background levels of pollutants (e.g. pollution blowing in from outsideof the area or the UK)
• Local emissions (e.g. from vehicles, domestic combustion, etc)• Site dispersion characteristics (e.g. tall buildings by the side of busyroads can trap air pollutants, stopping them from dispersing into theair)
• Weather conditions (e.g. rain may remove pollutants, whilst still, dryconditions may lead to pollutants building up in the air)
• Chemical reactions in the air (may remove pollutants, or lead to theirformation)
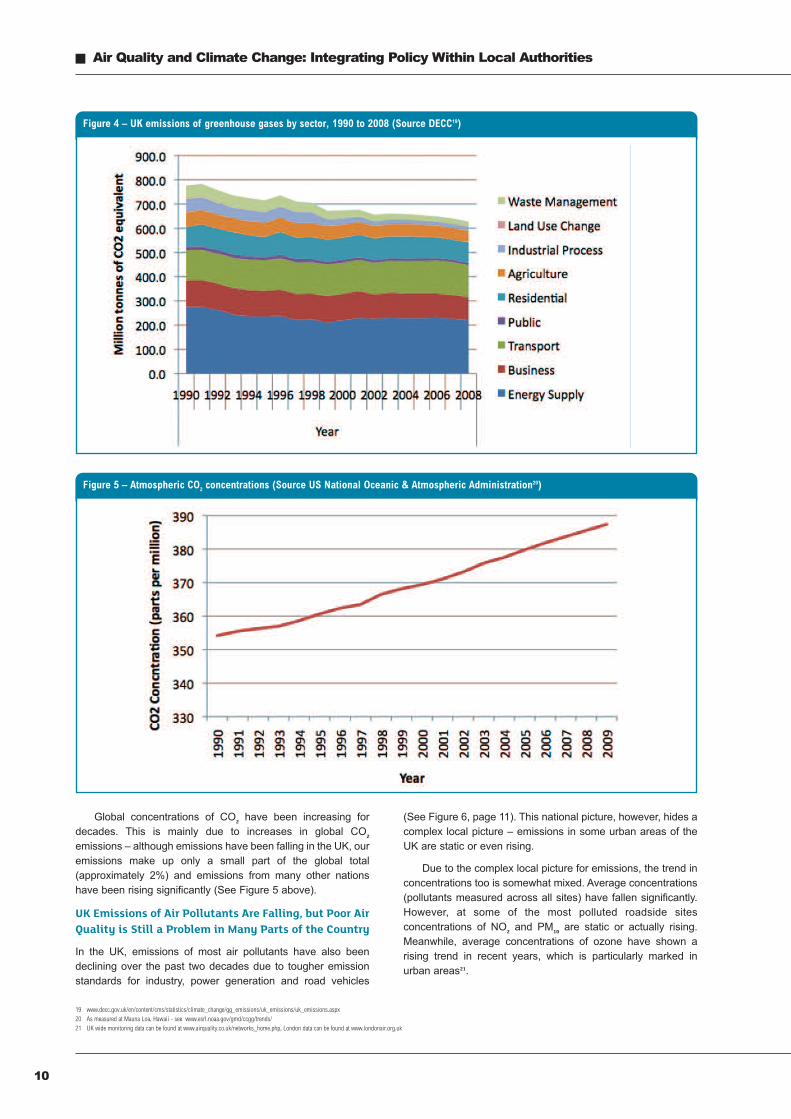
Global concentrations of CO2 have been increasing fordecades. This is mainly due to increases in global CO2
emissions – although emissions have been falling in the UK, ouremissions make up only a small part of the global total(approximately 2%) and emissions from many other nationshave been rising significantly (See Figure 5 above).
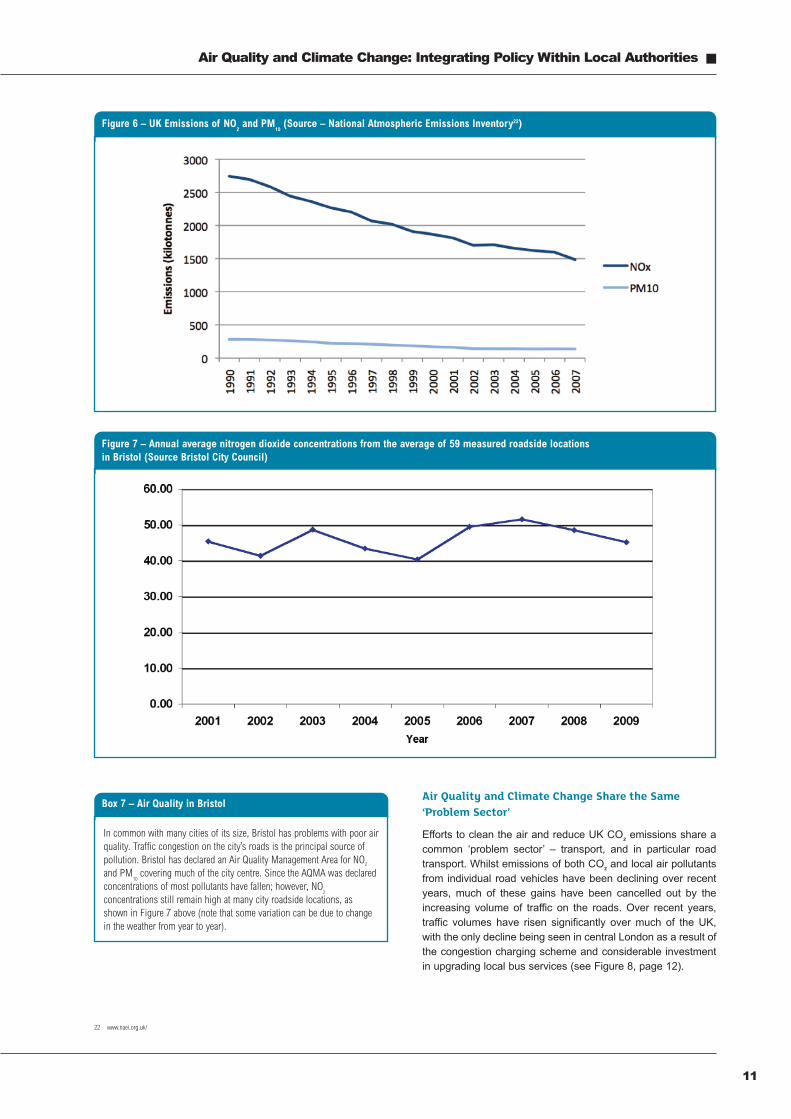
UK Emissions of Air Pollutants Are Falling, but Poor AirQuality is Still a Problem in Many Parts of the Country
In the UK, emissions of most air pollutants have also beendeclining over the past two decades due to tougher emissionstandards for industry, power generation and road vehicles
(See Figure 6, page 11). This national picture, however, hides acomplex local picture – emissions in some urban areas of theUK are static or even rising.
Due to the complex local picture for emissions, the trend inconcentrations too is somewhat mixed. Average concentrations(pollutants measured across all sites) have fallen significantly.However, at some of the most polluted roadside sitesconcentrations of NO2 and PM10 are static or actually rising.Meanwhile, average concentrations of ozone have shown arising trend in recent years, which is particularly marked inurban areas21.
� Air Quality and Climate Change: Integrating Policy Within Local Authorities
10
Figure 4 – UK emissions of greenhouse gases by sector, 1990 to 2008 (Source DECC19)
Figure 5 – Atmospheric CO2 concentrations (Source US National Oceanic & Atmospheric Administration20)
19 www.decc.gov.uk/en/content/cms/statistics/climate_change/gg_emissions/uk_emissions/uk_emissions.aspx20 As measured at Mauna Loa, Hawaii - see www.esrl.noaa.gov/gmd/ccgg/trends/21 UK wide monitoring data can be found at www.airquality.co.uk/networks_home.php, London data can be found at www.londonair.org.uk
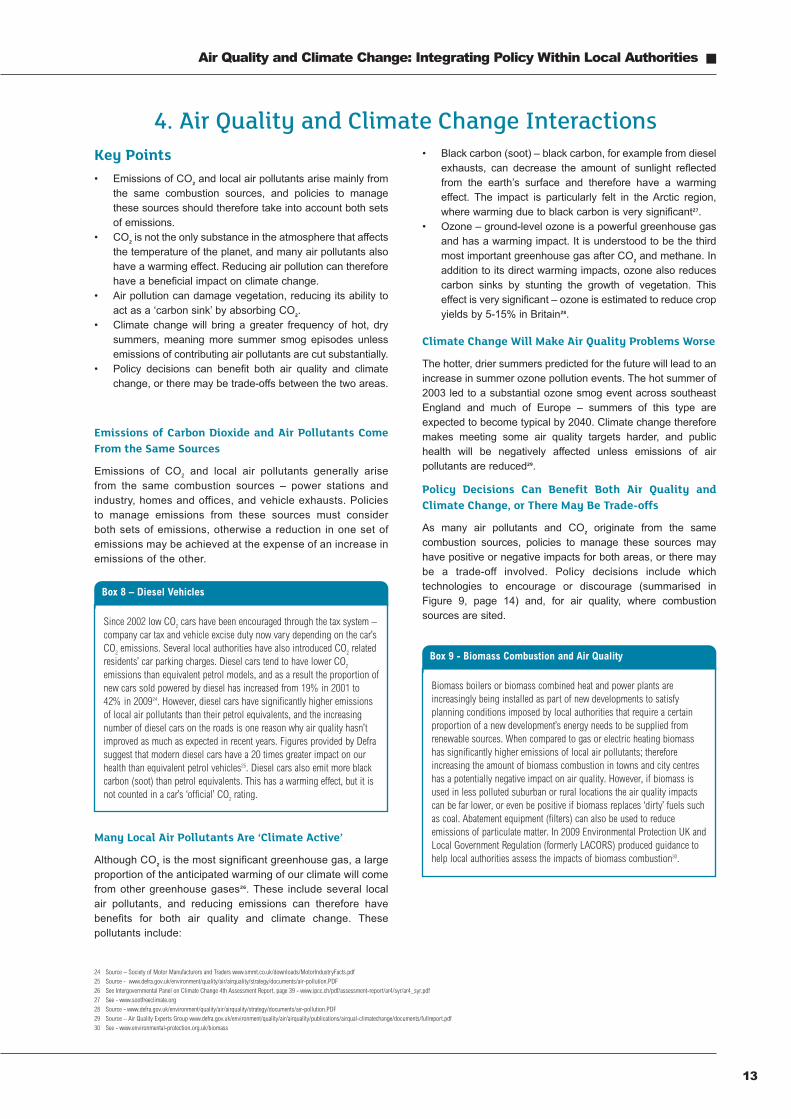
Air Quality and Climate Change Share the Same‘Problem Sector’
Efforts to clean the air and reduce UK CO2 emissions share acommon ‘problem sector’ – transport, and in particular roadtransport. Whilst emissions of both CO2 and local air pollutantsfrom individual road vehicles have been declining over recentyears, much of these gains have been cancelled out by theincreasing volume of traffic on the roads. Over recent years,traffic volumes have risen significantly over much of the UK,with the only decline being seen in central London as a result ofthe congestion charging scheme and considerable investmentin upgrading local bus services (see Figure 8, page 12).
11
Air Quality and Climate Change: Integrating Policy Within Local Authorities �
22 www.naei.org.uk/
Figure 6 – UK Emissions of NO2and PM
10(Source – National Atmospheric Emissions Inventory22)
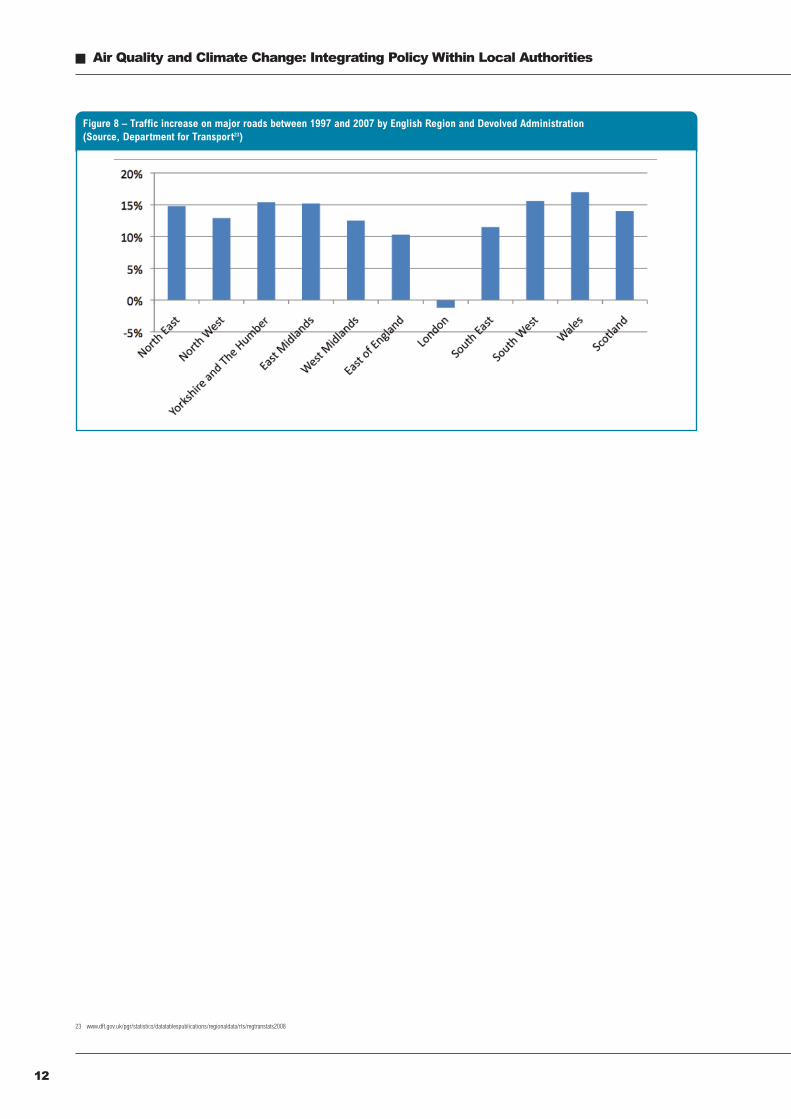
Figure 7 – Annual average nitrogen dioxide concentrations from the average of 59 measured roadside locationsin Bristol (Source Bristol City Council)
Box 7 – Air Quality in Bristol
In common with many cities of its size, Bristol has problems with poor airquality. Traffic congestion on the city’s roads is the principal source ofpollution. Bristol has declared an Air Quality Management Area for NO2
and PM10covering much of the city centre. Since the AQMA was declared
concentrations of most pollutants have fallen; however, NO2
concentrations still remain high at many city roadside locations, asshown in Figure 7 above (note that some variation can be due to changein the weather from year to year).
� Air Quality and Climate Change: Integrating Policy Within Local Authorities
12
Figure 8 – Traffic increase on major roads between 1997 and 2007 by English Region and Devolved Administration(Source, Department for Transport23)
23 www.dft.gov.uk/pgr/statistics/datatablespublications/regionaldata/rts/regtranstats2008
Key Points• Emissions of CO2 and local air pollutants arise mainly from
the same combustion sources, and policies to managethese sources should therefore take into account both setsof emissions.
• CO2 is not the only substance in the atmosphere that affectsthe temperature of the planet, and many air pollutants alsohave a warming effect. Reducing air pollution can thereforehave a beneficial impact on climate change.
• Air pollution can damage vegetation, reducing its ability toact as a ‘carbon sink’ by absorbing CO2.
• Climate change will bring a greater frequency of hot, drysummers, meaning more summer smog episodes unlessemissions of contributing air pollutants are cut substantially.
• Policy decisions can benefit both air quality and climatechange, or there may be trade-offs between the two areas.
Emissions of Carbon Dioxide and Air Pollutants ComeFrom the Same Sources
Emissions of CO2 and local air pollutants generally arisefrom the same combustion sources – power stations andindustry, homes and offices, and vehicle exhausts. Policiesto manage emissions from these sources must considerboth sets of emissions, otherwise a reduction in one set ofemissions may be achieved at the expense of an increase inemissions of the other.
Many Local Air Pollutants Are ‘Climate Active’
Although CO2 is the most significant greenhouse gas, a largeproportion of the anticipated warming of our climate will comefrom other greenhouse gases26. These include several localair pollutants, and reducing emissions can therefore havebenefits for both air quality and climate change. Thesepollutants include:
• Black carbon (soot) – black carbon, for example from dieselexhausts, can decrease the amount of sunlight reflectedfrom the earth’s surface and therefore have a warmingeffect. The impact is particularly felt in the Arctic region,where warming due to black carbon is very significant27.
• Ozone – ground-level ozone is a powerful greenhouse gasand has a warming impact. It is understood to be the thirdmost important greenhouse gas after CO2 and methane. Inaddition to its direct warming impacts, ozone also reducescarbon sinks by stunting the growth of vegetation. Thiseffect is very significant – ozone is estimated to reduce cropyields by 5-15% in Britain28.
Climate Change Will Make Air Quality Problems Worse
The hotter, drier summers predicted for the future will lead to anincrease in summer ozone pollution events. The hot summer of2003 led to a substantial ozone smog event across southeastEngland and much of Europe – summers of this type areexpected to become typical by 2040. Climate change thereforemakes meeting some air quality targets harder, and publichealth will be negatively affected unless emissions of airpollutants are reduced29.
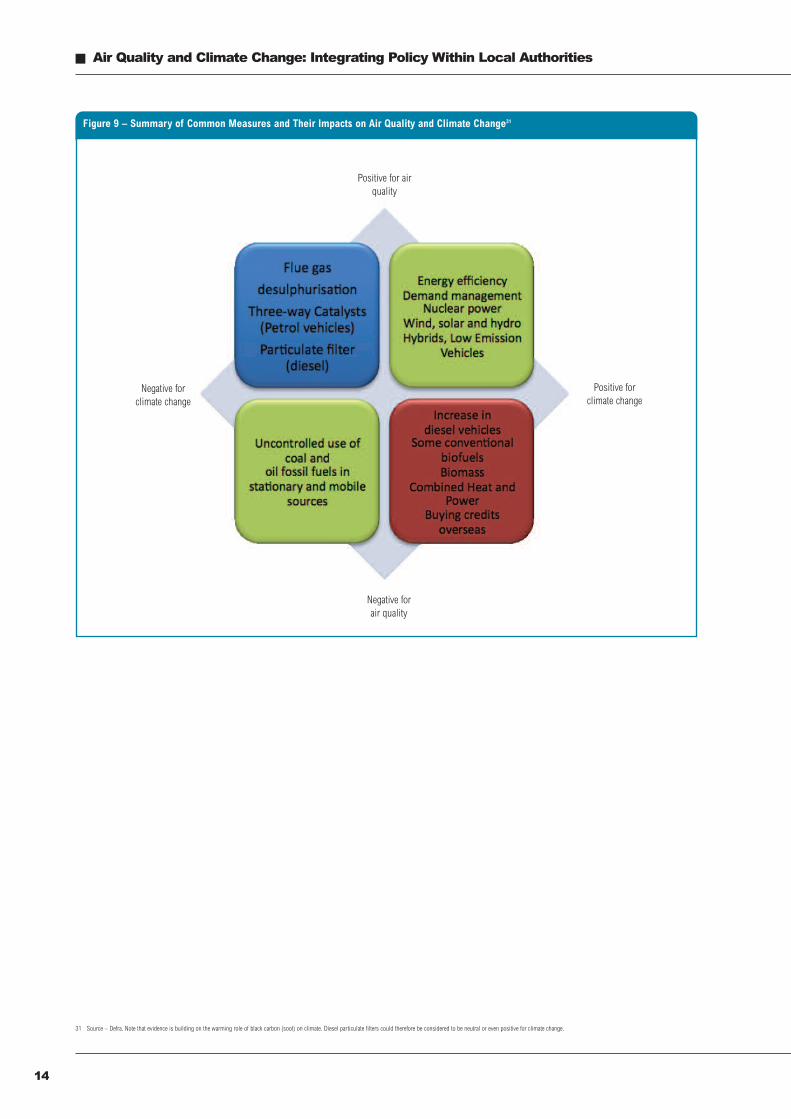
Policy Decisions Can Benefit Both Air Quality andClimate Change, or There May Be Trade-offs
As many air pollutants and CO2 originate from the samecombustion sources, policies to manage these sources mayhave positive or negative impacts for both areas, or there maybe a trade-off involved. Policy decisions include whichtechnologies to encourage or discourage (summarised inFigure 9, page 14) and, for air quality, where combustionsources are sited.
13
Air Quality and Climate Change: Integrating Policy Within Local Authorities �
4. Air Quality and Climate Change Interactions
Box 8 – Diesel Vehicles
Since 2002 low CO2 cars have been encouraged through the tax system –company car tax and vehicle excise duty now vary depending on the car’sCO2 emissions. Several local authorities have also introduced CO2 relatedresidents’ car parking charges. Diesel cars tend to have lower CO2
emissions than equivalent petrol models, and as a result the proportion ofnew cars sold powered by diesel has increased from 19% in 2001 to42% in 200924. However, diesel cars have significantly higher emissionsof local air pollutants than their petrol equivalents, and the increasingnumber of diesel cars on the roads is one reason why air quality hasn’timproved as much as expected in recent years. Figures provided by Defrasuggest that modern diesel cars have a 20 times greater impact on ourhealth than equivalent petrol vehicles25. Diesel cars also emit more blackcarbon (soot) than petrol equivalents. This has a warming effect, but it isnot counted in a car’s ‘official’ CO2 rating.
24 Source – Society of Motor Manufacturers and Traders www.smmt.co.uk/downloads/MotorIndustryFacts.pdf25 Source - www.defra.gov.uk/environment/quality/air/airquality/strategy/documents/air-pollution.PDF26 See Intergovernmental Panel on Climate Change 4th Assessment Report, page 39 - www.ipcc.ch/pdf/assessment-report/ar4/syr/ar4_syr.pdf27 See - www.sootfreeclimate.org28 Source - www.defra.gov.uk/environment/quality/air/airquality/strategy/documents/air-pollution.PDF29 Source – Air Quality Experts Group www.defra.gov.uk/environment/quality/air/airquality/publications/airqual-climatechange/documents/fullreport.pdf30 See - www.environmental-protection.org.uk/biomass
Box 9 - Biomass Combustion and Air Quality
Biomass boilers or biomass combined heat and power plants areincreasingly being installed as part of new developments to satisfyplanning conditions imposed by local authorities that require a certainproportion of a new development’s energy needs to be supplied fromrenewable sources. When compared to gas or electric heating biomasshas significantly higher emissions of local air pollutants; thereforeincreasing the amount of biomass combustion in towns and city centreshas a potentially negative impact on air quality. However, if biomass isused in less polluted suburban or rural locations the air quality impactscan be far lower, or even be positive if biomass replaces ‘dirty’ fuels suchas coal. Abatement equipment (filters) can also be used to reduceemissions of particulate matter. In 2009 Environmental Protection UK andLocal Government Regulation (formerly LACORS) produced guidance tohelp local authorities assess the impacts of biomass combustion30.
� Air Quality and Climate Change: Integrating Policy Within Local Authorities
14
Figure 9 – Summary of Common Measures and Their Impacts on Air Quality and Climate Change31
Negative forclimate change
Negative forair quality
Positive forclimate change
Positive for airquality
31 Source – Defra. Note that evidence is building on the warming role of black carbon (soot) on climate. Diesel particulate filters could therefore be considered to be neutral or even positive for climate change.
Key Points• Integrated policy can be cheaper and more effective to
implement than policies designed to address air quality andclimate change separately, as one set of policy measurescan be designed to benefit both areas.
• If policy is not integrated unintentional trade-offs can occur– policy measures that benefit one area at the expense ofanother, requiring resources to correct later.
• Climate benefits of policy decisions are felt in the future anddistributed over the entire globe, whilst air quality benefitsare felt ‘here and now’.
• Air quality benefits can help to convince climate changesceptics of the need for new policy measures, and vice-versa.
Integrated Policy is Cheaper to Implement
Integrating policy means that measures can be prioritised thatbenefit both air quality and climate change, as opposed todistinct measures to address each problem separately. Thisapproach can often lead to lower overall costs to localauthorities, businesses and the community in general. Forexample, take an urban local authority aiming to reduce CO2
emissions from transport and also improve air quality in the citycentre. Analysis of emissions could suggest that tacklingemissions from the local bus fleet is the best way forward. Non-integrated policy may encourage bus companies to usebiodiesel to reduce CO2 emissions (but with no air qualitybenefits), whilst to tackle the air quality issue the local authoritymight introduce a low emission zone (LEZ) to restrict entry tothe city centre to only the cleanest buses (which has littlebenefit for climate change). If policy was integrated, the localauthority might work with the bus operators to encourage theuse of alternative technologies such as hybrid and biomethanebuses, which locally reduce emissions of both CO2 and airpollutants over pure diesel alternatives.
Integrated Policy Reduces Unintentional Trade-offs
As discussed in Section 4, policies may either benefit both airquality and climate change, or benefit one area to the detrimentof the other – a trade-off. Unintentional trade-offs occur whenpolicy is introduced to benefit one area without consideration ofhow it will affect the other; in these cases, negative impacts feltby one area may outweigh the actual benefits that the policywas designed to bring. Integrated policy aims to prioritiseactions that benefit both areas and ensure, if trade-offs areneeded, that disadvantages are properly assessed andmanaged.
Air Quality Helps to Justify Measures Taken to ReduceCO2 Emissions
The benefits of policy decisions to reduce greenhouse gasemissions will be felt many years in the future and they will forma very small, but essential, part of a global effort – they are noteasily tangible on a 'here and now' basis. Climate changescience can also be attacked by sceptics who seize uponissues such as the 'Climategate' leaked e-mails affair of 2009,or cold winters such as that of 2009/10, to argue the case fornon-action. Human impacts on the climate are concerned withthe increasing probability, rather than the certainty, of extremeclimatic events happening, and it is highly unlikely that there willever be a 'smoking gun' proving that a particular climatic eventis due to rising greenhouse gas emissions.
In contrast the benefits of policy decisions aimed atimproving local air quality are felt almost immediately andalmost entirely in the area where they are introduced. Inaddition the impacts are easily measurable, and the effect onpeople's health and quality of life can be directly linked back tothe policy decision. Measures that address both air quality andclimate change can therefore be justified on both theirimmediate and long-term benefits – this is one of the mostpowerful arguments for an integrated approach to policy.
15
Air Quality and Climate Change: Integrating Policy Within Local Authorities �
5. Benefits of Integrating Air Quality andClimate Change Policy
Box 10 – Biomethane Powered Refuse Vehicles in Leeds
Biomethane is simply methane gas produced from the decomposition oforganic materials, which can include food and green waste. Once cleanedup to remove impurities it is chemically identical to natural gas, and canbe used as a fuel in modified vehicles either by itself or in a 'dual fuel' setup with diesel. Leeds City Council has operated a trial of biomethanepowered refuse vehicles in the city using biomethane produced from alandfill site in Surrey. Overall the vehicles offer a 60% reduction in ‘wellto wheel’ greenhouse gas emissions, plus lower NO
xand almost zero
particulate emissions. Importantly they have also performed well aseveryday refuse collection vehicles.
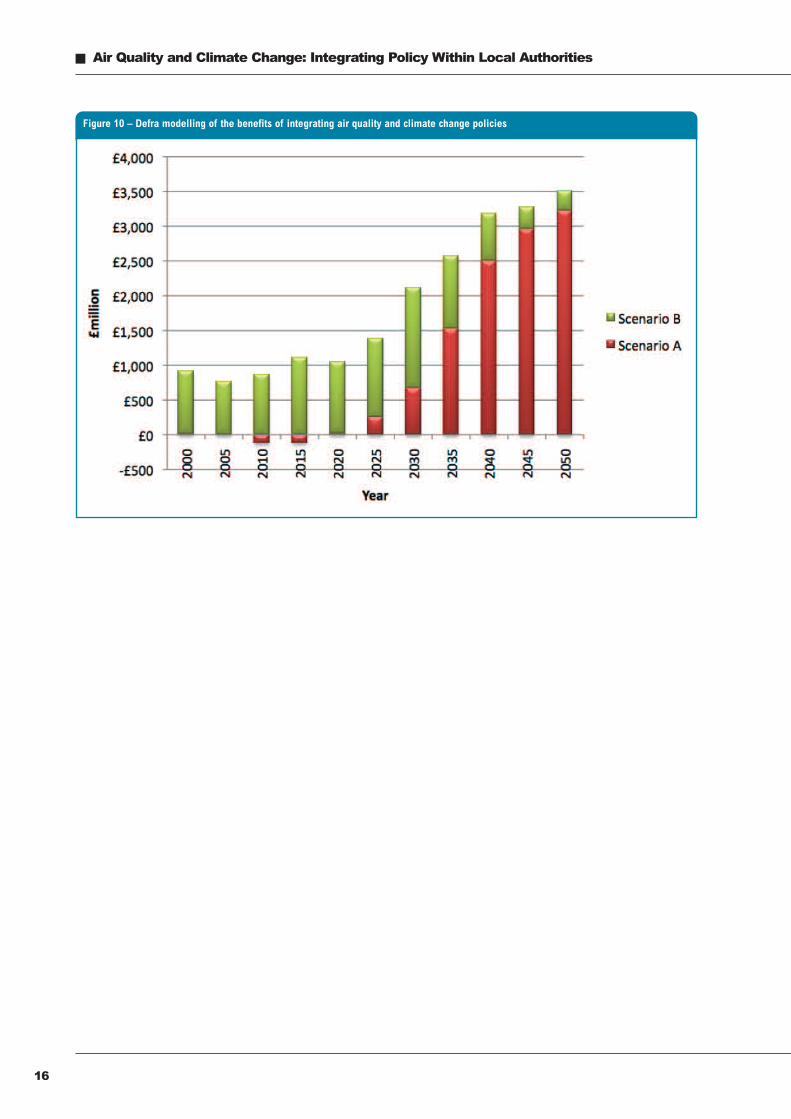
Box 11 – Defra Modelling of the Benefits of Policy Integration
In 2008 the Department for Environment, Food and Rural Affairs (Defra)commissioned a study of the benefits of integrated policy for air qualityand climate change vs. a ‘business as usual’ approach to policy in bothareas. The study covered policy decisions at a UK level between thepresent day and 205032. In common with much of modern Governmentpolicy analysis, the study attempted to monetise the costs and benefitsassociated with policy decisions, i.e. assign a financial cost to the healthand environmental impacts of poor air quality and emissions ofgreenhouse gases. The study concluded that integrated policy broughtsignificantly greater benefits than pursuing each area separately. Thebenefits were particularly felt in early years, where a ‘business as usual’approach would actually lead to negative benefits (i.e. an overall cost) dueto the air quality impacts of a large increase in residential biomasscombustion. The results of the study are shown in Figure 10, page 16,where scenario A is ‘business as usual’ and scenario B represents theintegrated approach.
32 See - http://www.defra.gov.uk/environment/quality/air/airquality/panels/igcb/documents/uk-markal-model.pdf
� Air Quality and Climate Change: Integrating Policy Within Local Authorities
16
Figure 10 – Defra modelling of the benefits of integrating air quality and climate change policies
Key Points• The foundation of an integrated approach is agreement on
emissions reduction measures between staff working on airquality and climate change, who often work in differentdepartments. This requires the establishment of good face-to-face relationships, and an understanding of theimportance and drivers for each other’s work. Agreementon a coherent vision for emissions reduction amongst staffworking on air quality and climate change makes it far morelikely that suitable policies will be adopted by otherdepartments and organisations.
• Elected members decide the policy direction of a localauthority, so gaining their support and understanding isimportant. In cabinet systems the most important electedmembers will be the leader, and the environment portfolioholder.
• In order to deliver air quality and climate change objectives,other local authority plans, strategies and policy documentswill need to contain suitable policies. To do so relevantplans, strategies and targets need to be identified alongwith suitable timescales for input. Early engagement in thedevelopment of these plans and strategies is essential toinfluence their content, as is close cooperation withcolleagues in key departments such as strategic, spatialand transport planning.
The Cornerstone of Integrated Policy is Agreementbetween Staff Working on Air Quality and ClimateChange Issues
Local authority staff provide the expertise to help the council’selected members and managers formulate policy, and will takeforward the actual implementation of the policy measuresagreed. If policy on air quality and climate change is to beintegrated it is essential that staff working on both areas have agood understanding of the importance of each other’s work,communicate freely and regularly, and avoid splitting theenvironment ‘voice’ by contradicting each other’s advice whenfeeding into the policy process. This last point is particularlypertinent for issues that can appear to be quite black or white,for example urban biomass combustion. If conflicting advice isprovided to local policy makers, the result can be unsatisfactorypolicy which suits neither party.
Air quality staff are usually based in environmental health/protection departments33 whilst staff working on climate changeare very often based elsewhere, for example in private sectorhousing or policy teams. With staff based in differentdepartments, and often separate buildings, creating a goodworking relationship is often easier said than done. Despite this,investing time in building strong face-to-face relationships, andconsulting early on policies and plans, is crucial. Understandingthe needs of each other’s work is the foundation of a successfulworking relationship, which the first two sections of thisguidance can help to do (‘why do we care about air pollution’and ‘why do we care about climate change’).
Integrated Policy Means Plans and Strategies WillConsider Their Impact on Each Other
For an integrated approach to work, climate change (or carbonmanagement) policy needs to influence the Local Air QualityManagement (LAQM) system, and air quality managementpolicy needs to influence carbon management. To do this it isimportant to recognise the differences between the twosystems. LAQM is predominantly process driven – the regimeoperates to a fixed timescale dictated by central Government,and is based on detailed policy and practice guidance providedby the Department for Environment, Food and Rural Affairs(Defra). By contrast, climate change activities operate largelyoutside of fixed Government timescales and guidance, withassessment and strategy development driven by the localauthority’s own internal processes, and often using voluntaryguidance available from bodies such as the Carbon Trust andthe Energy Saving Trust.
There may also be significant differences in the skills base ofstaff working on air quality and climate change. Air qualityresponsibilities tend to fall to environmental health officers andtechnical officers, with many having strong technicalbackgrounds and significant experience in many aspects ofenvironmental protection. Staff working on climate change comefrom a wide variety of backgrounds which differ between localauthorities, for example policy development, sustainability, publicrelations and environmental consultancy. These skills bases canfrequently be complementary if the two areas are worked ontogether. The different locations of air quality and climate changestaff within a local authority can also be of benefit for anintegrated approach, with strong champions for action on bothareas embedded within more than one department.
Adopting an integrated approach does not necessarilymean that the two strategies should be merged into one. Aclimate change strategy, for example, may pay considerableattention to adaptation to a changing climate, whilst an airquality action plan may place a high priority on direct measuresto reduce people’s exposure to polluted air (e.g. barriers, bufferzones, alert systems). Integrated policy does, however, meanthat both documents will be developed with due regard to eachother, as shown in Table 3, page 18.
17
Air Quality and Climate Change: Integrating Policy Within Local Authorities �
6. Developing an Integrated Approach
33 This is the most common case, however staff can also be based in regulatory services or other departments
Box 12 – Climate change in the Perth & Kinross CouncilAir Quality Action Plan
In common with other Scottish cities, the city of Perth in Central Scotlandexperiences air quality problems and the local authority has declared anAir Quality Management Area for both particulate matter and nitrogendioxide. As they began the process of drawing up their air quality actionplan, staff working on air quality took the opportunity to assess theimpacts of potential measures on greenhouse gas emissions, and alsotheir cost effectiveness in terms of greenhouse gas reduction. This workwas carried out in the context of development of a greenhouse gasemissions inventory for the whole authority, with aspects of the reportspecifically dedicated to the impact of the air quality action plan. Most ofthe proposed action plan measures showed benefits in terms ofgreenhouse gas emissions; the few measures that showed negativeimpacts were not taken forward in the final plan.
Gaining the Understanding and Support of ElectedMembers is Crucial
Local authorities are democratic bodies, where electedmembers control the policy approach of the organisation.Gaining understanding and support of the need to address airquality and climate change from elected members, and theimportance of integrated policy, is therefore crucial if headwayis to be made. Many local authorities now have an executivesystem, with an elected leader who then appoints a number oftheir party colleagues to form a cabinet. One party (or acoalition) therefore decides the policy direction of the council,and responsibilities are concentrated within a relatively smallnumber of individuals. In these systems the leader of thecouncil and the environment portfolio holder are the two mainindividuals who need to be engaged. Another important groupof councillors are those sitting on Overview and ScrutinyCommittees (a statutory requirement where an executivesystem has been adopted). These committees scrutinisepolicies and decisions made by the cabinet and seniormanagement, and can therefore be a useful place to raise theneed for integrated climate change and air quality policy.
It is often useful to have more than a single line of argumentwhen raising issues with elected members. Individuals and theparties they represent will have their own political views andpriorities, and in most cases it will be easier to work with thesethan against them. The integrated approach to policy can helphere – if elected members are sceptical on the need for actionto address climate change they may be more interested in theneed to improve air quality and public health, and vice-versa.Elected members who do not feel that either air quality orclimate change are a priority may be won over by economicarguments. Some measures, energy efficiency in particular,have the effect of putting more money into residents’ pockets,which can boost the local economy. Understanding individualpolitical priorities and views, and getting a realistic sense ofwhat is achievable, is crucial before trying to engage withelected members.
An Integrated Approach Needs to Influence LocalAuthority Policy and Practice
To capture the benefits of integrated policy discussed insections 4 and 5, local authorities will need to consider whatmeasures they should take forward in their area, and whatpolicies and strategies need to be influenced to implementthem. Guidance on common measures is provided in section 7,whilst Appendix A examines the plans and strategies where anintegrated approach can be embedded.
Local Authorities Produce Many Relevant Plans andStrategies
Local authorities may produce separate climate changestrategies and air quality action plans; in most cases, however,these will need to influence other strategies and service plansthat the local authority produces in order to actually implementpolicy measures. With respect to local authorities in multi-tierareas, the plan or strategy that needs to be influenced may bethe responsibility of another local authority – for example inEngland air quality is the responsibility of district/ borough levelauthorities whilst transport falls to county councils.
The key to influencing the content of plans and strategies isto get involved at an early stage. This can be complicated by thecurrent trend of reducing central Government obligations onlocal government, which is reducing the number of statutoryplans and strategies that a local authority has to produce. Thepractical upshot of this is that there are fewer plans andstrategies that local authorities are required to produce to acentrally imposed deadline, and it can therefore be unclearwhen any particular local authority will be starting the reviewprocess for a plan or strategy. This underlines the need for goodcommunication with colleagues in other departments, andindeed other local authorities, to ensure that opportunities forearly engagement in plans and strategies are taken.
A useful approach is therefore to identify what plans andstrategies need to be influenced, and when opportunities to doso will arise. Ideally this would be done in an integrated fashion,with air quality and climate change staff adopting a commonapproach. Generally it is easier to work by a top down approach– if the need to address air quality and climate change isfeatured in a local authority’s high level overarching strategies itis easier to push policies into the plans and strategies that sitbelow them. Appendix A contains a list and descriptions of themain local authority plans and strategies relevant to air qualityand climate change.
Policy Can Also Be Integrated With Other Areas ofEnvironmental Work
Local authorities are also active, and have legal responsibilities,in other areas of environmental protection. Climate change andair quality policies should integrate with these areas to ensurethat opportunities to forward policies that benefit multiple areasof work are taken. Areas of work that local authorities shouldconsider include:
� Air Quality and Climate Change: Integrating Policy Within Local Authorities
18
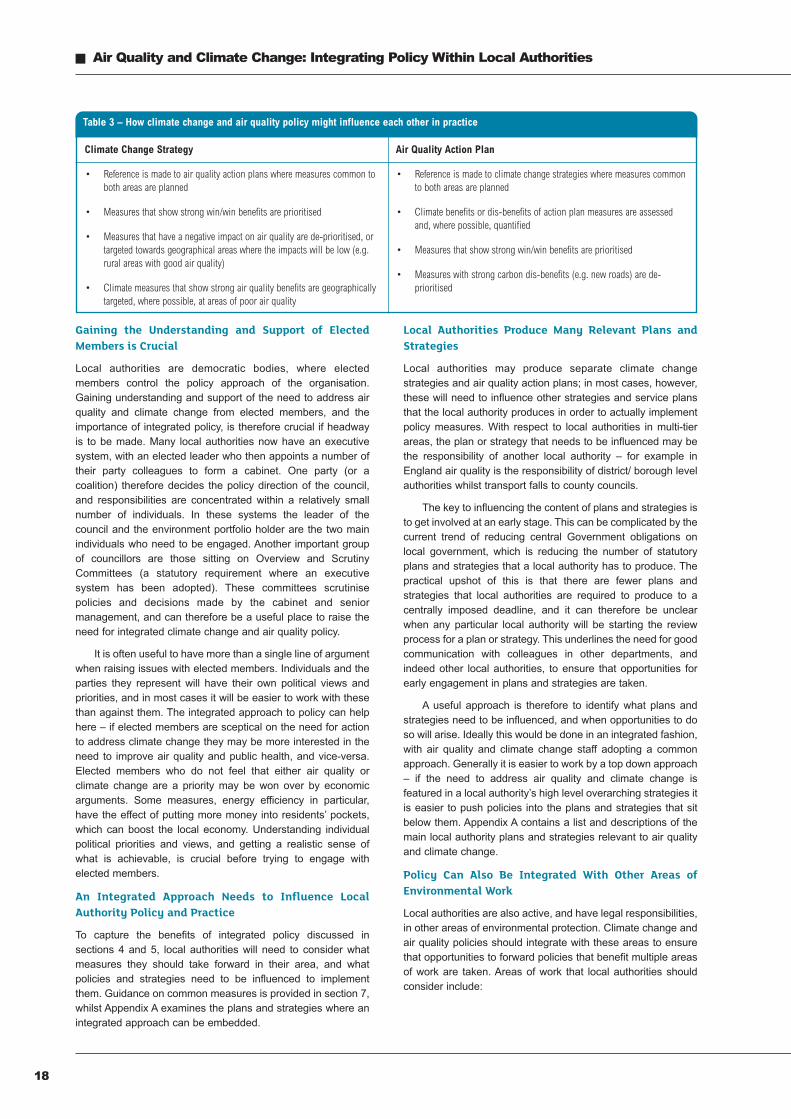
Table 3 – How climate change and air quality policy might influence each other in practice
Climate Change Strategy
• Reference is made to air quality action plans where measures common toboth areas are planned
• Measures that show strong win/win benefits are prioritised
• Measures that have a negative impact on air quality are de-prioritised, ortargeted towards geographical areas where the impacts will be low (e.g.rural areas with good air quality)
• Climate measures that show strong air quality benefits are geographicallytargeted, where possible, at areas of poor air quality
Air Quality Action Plan
• Reference is made to climate change strategies where measures commonto both areas are planned
• Climate benefits or dis-benefits of action plan measures are assessedand, where possible, quantified
• Measures that show strong win/win benefits are prioritised
• Measures with strong carbon dis-benefits (e.g. new roads) are de-prioritised
Waste and Recycling
Local authorities are responsible for the collection anddisposal34 of waste, and face significant pressures to reduce theamount of waste sent to landfill. Some waste disposal optionshave significant potential to benefit both air quality and climatechange, particularly in the area of disposal of organic waste.Biogas (or biomethane) can be produced from organic wastethrough a process known as anaerobic digestion, and used toproduce power or fuel vehicles. Several local authorities haveused biomethane to power public service vehicles (see Box 10,page 15), whilst the city of Lille in France fuels its buses onbiomethane produced from the city’s waste35.
Environmental Noise
Environmental noise is the unwanted sound we are exposed toin our everyday environment, predominantly from transportsources such as road vehicles, rail engines and aircraft. Noisecauses annoyance and sleep disturbance, and is alsoassociated with poor health. Many measures taken to improveair quality and climate change will also reduce noise, such asreducing the number of vehicles on the road and the use ofcleaner quieter technologies such as electric or hybrid vehicles.Some measures though may increase noise and disturbance –for example wind turbines have the potential to damageamenity, and in some cases affect health, due to acousticimpacts and flicker, if they are not thoughtfully sited. TheEnvironmental Noise Directive has introduced a duty for somelocal authorities to create NoiseAction Plans that will reduce theoverall levels of noise. Larger urban areas must also designateand protect quiet urban spaces under the Environmental NoiseDirective – see the Environmental Protection UK report‘Quietening City Open Spaces’36. These problem areas oftenappear in areas that have already been designated Air QualityManagement Areas, and therefore effective corrective actionmay reduce levels of noise and improve local air quality.
Managing Land Sustainably
Soil is a significant carbon sink, and if it is not managed in asustainable fashion its ability to lock away carbon from theatmosphere may be significantly impaired. Local authoritieshave a responsibility to manage land sustainably through theplanning system, and preserving the ability of soil to absorbcarbon should be an important part of a local authority’s climatechange strategy. Good quality development can help to protectsoil by, for example, reducing ‘soil sealing’ which occurs throughthe use of impervious surfaces and soil compaction byconstruction equipment.
Biodiversity and Green Spaces
Climate change and air quality both impact directly onbiodiversity. Air pollution leads to issues of acidification andnutrient (nitrogen) deposition in vulnerable ecosystems, whilstozone pollution attacks vegetation directly, leading to leafdamage and stunted growth. Climate change presents asignificant challenge to vulnerable ecosystems, which may beunable to adapt to warmer conditions. Managing biodiversitysustainably can bring direct benefits for climate change and airquality – for example managing woodlands can boostbiodiversity whilst providing a sustainable source of wood fuel.Green open spaces in urban areas can also benefit air qualityand climate change – urban trees can be a significant carbonsink, locking away carbon, whilst open spaces themselves canprovide a buffer zone between sources of noise and airpollution, and the places where people live and work. Providingbetter quality green open space in urban areas also hassignificant benefits in the area of adaptation to climate change,for example by reducing rainwater run-off, increasing urbanhumidity and reducing urban temperatures.
19
Air Quality and Climate Change: Integrating Policy Within Local Authorities �
34 District level authorities are responsible for waste collection and county level for waste disposal. Unitary authorities and London Boroughs are responsible for both collection and disposal.35 See a short video about Lille’s biomethane buses at www.youtube.com/watch?v=Xz-I_EKU22A36 http://www.environmental-protection.org.uk/assets/library/documents/Quietening_Open_Spaces_july2010_lower_res%29.pdf
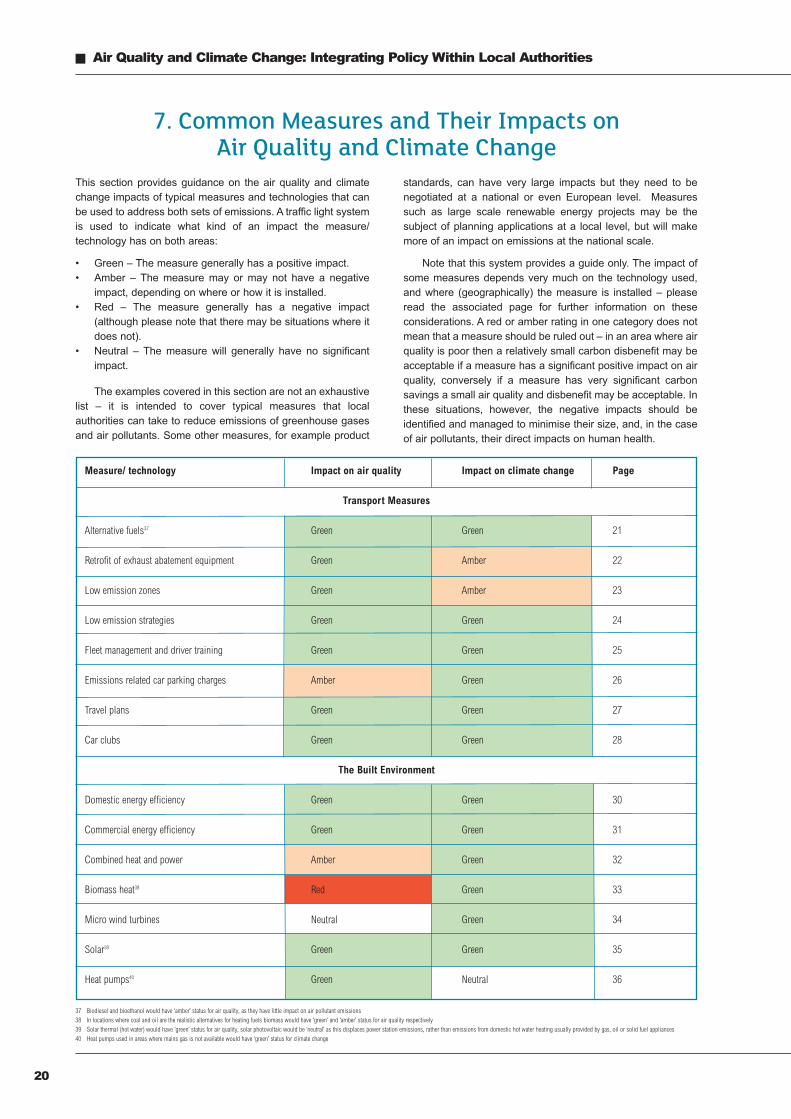
Measure/ technology Impact on air quality Impact on climate change Page
Transport Measures
Alternative fuels37 Green Green 21
Retrofit of exhaust abatement equipment Green Amber 22
Low emission zones Green Amber 23
Low emission strategies Green Green 24
Fleet management and driver training Green Green 25
Emissions related car parking charges Amber Green 26
Travel plans Green Green 27
Car clubs Green Green 28
The Built Environment
Domestic energy efficiency Green Green 30
Commercial energy efficiency Green Green 31
Combined heat and power Amber Green 32
Biomass heat38 Red Green 33
Micro wind turbines Neutral Green 34
Solar39 Green Green 35
Heat pumps40 Green Neutral 36
This section provides guidance on the air quality and climatechange impacts of typical measures and technologies that canbe used to address both sets of emissions. A traffic light systemis used to indicate what kind of an impact the measure/technology has on both areas:
• Green – The measure generally has a positive impact.• Amber – The measure may or may not have a negative
impact, depending on where or how it is installed.• Red – The measure generally has a negative impact
(although please note that there may be situations where itdoes not).
• Neutral – The measure will generally have no significantimpact.
The examples covered in this section are not an exhaustivelist – it is intended to cover typical measures that localauthorities can take to reduce emissions of greenhouse gasesand air pollutants. Some other measures, for example product
standards, can have very large impacts but they need to benegotiated at a national or even European level. Measuressuch as large scale renewable energy projects may be thesubject of planning applications at a local level, but will makemore of an impact on emissions at the national scale.
Note that this system provides a guide only. The impact ofsome measures depends very much on the technology used,and where (geographically) the measure is installed – pleaseread the associated page for further information on theseconsiderations. A red or amber rating in one category does notmean that a measure should be ruled out – in an area where airquality is poor then a relatively small carbon disbenefit may beacceptable if a measure has a significant positive impact on airquality, conversely if a measure has very significant carbonsavings a small air quality and disbenefit may be acceptable. Inthese situations, however, the negative impacts should beidentified and managed to minimise their size, and, in the caseof air pollutants, their direct impacts on human health.
� Air Quality and Climate Change: Integrating Policy Within Local Authorities
20
7. Common Measures and Their Impacts onAir Quality and Climate Change
37 Biodiesel and bioethanol would have ‘amber’ status for air quality, as they have little impact on air pollutant emissions38 In locations where coal and oil are the realistic alternatives for heating fuels biomass would have ‘green’ and ‘amber’ status for air quality respectively39 Solar thermal (hot water) would have ‘green’ status for air quality, solar photovoltaic would be ‘neutral’ as this displaces power station emissions, rather than emissions from domestic hot water heating usually provided by gas, oil or solid fuel appliances40 Heat pumps used in areas where mains gas is not available would have ‘green’ status for climate change
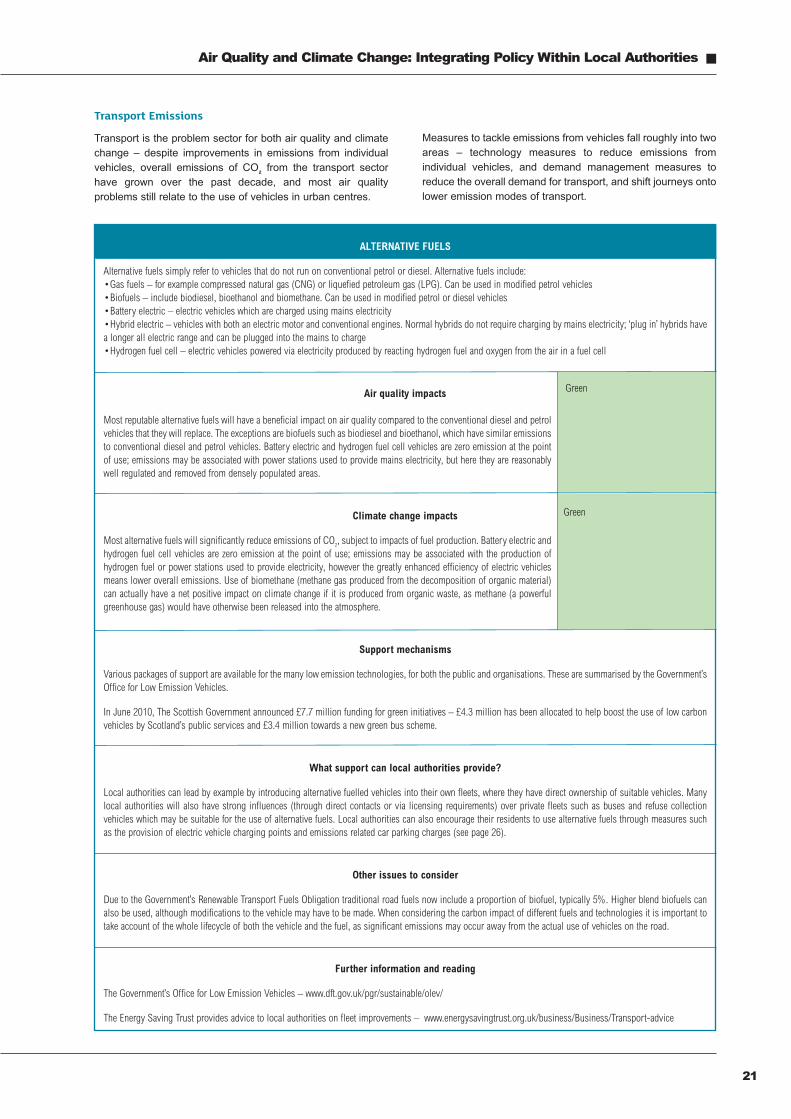
Transport Emissions
Transport is the problem sector for both air quality and climatechange – despite improvements in emissions from individualvehicles, overall emissions of CO2 from the transport sectorhave grown over the past decade, and most air qualityproblems still relate to the use of vehicles in urban centres.
Measures to tackle emissions from vehicles fall roughly into twoareas – technology measures to reduce emissions fromindividual vehicles, and demand management measures toreduce the overall demand for transport, and shift journeys ontolower emission modes of transport.
21
Air Quality and Climate Change: Integrating Policy Within Local Authorities �
ALTERNATIVE FUELS
Alternative fuels simply refer to vehicles that do not run on conventional petrol or diesel. Alternative fuels include:•Gas fuels – for example compressed natural gas (CNG) or liquefied petroleum gas (LPG). Can be used in modified petrol vehicles•Biofuels – include biodiesel, bioethanol and biomethane. Can be used in modified petrol or diesel vehicles•Battery electric – electric vehicles which are charged using mains electricity•Hybrid electric – vehicles with both an electric motor and conventional engines. Normal hybrids do not require charging by mains electricity; ‘plug in’ hybrids havea longer all electric range and can be plugged into the mains to charge•Hydrogen fuel cell – electric vehicles powered via electricity produced by reacting hydrogen fuel and oxygen from the air in a fuel cell
Air quality impacts
Most reputable alternative fuels will have a beneficial impact on air quality compared to the conventional diesel and petrolvehicles that they will replace. The exceptions are biofuels such as biodiesel and bioethanol, which have similar emissionsto conventional diesel and petrol vehicles. Battery electric and hydrogen fuel cell vehicles are zero emission at the pointof use; emissions may be associated with power stations used to provide mains electricity, but here they are reasonablywell regulated and removed from densely populated areas.
Climate change impacts
Most alternative fuels will significantly reduce emissions of CO2, subject to impacts of fuel production. Battery electric andhydrogen fuel cell vehicles are zero emission at the point of use; emissions may be associated with the production ofhydrogen fuel or power stations used to provide electricity, however the greatly enhanced efficiency of electric vehiclesmeans lower overall emissions. Use of biomethane (methane gas produced from the decomposition of organic material)can actually have a net positive impact on climate change if it is produced from organic waste, as methane (a powerfulgreenhouse gas) would have otherwise been released into the atmosphere.
Support mechanisms
Various packages of support are available for the many low emission technologies, for both the public and organisations. These are summarised by the Government’sOffice for Low Emission Vehicles.
In June 2010, The Scottish Government announced £7.7 million funding for green initiatives – £4.3 million has been allocated to help boost the use of low carbonvehicles by Scotland’s public services and £3.4 million towards a new green bus scheme.
What support can local authorities provide?
Local authorities can lead by example by introducing alternative fuelled vehicles into their own fleets, where they have direct ownership of suitable vehicles. Manylocal authorities will also have strong influences (through direct contacts or via licensing requirements) over private fleets such as buses and refuse collectionvehicles which may be suitable for the use of alternative fuels. Local authorities can also encourage their residents to use alternative fuels through measures suchas the provision of electric vehicle charging points and emissions related car parking charges (see page 26).
Other issues to consider
Due to the Government’s Renewable Transport Fuels Obligation traditional road fuels now include a proportion of biofuel, typically 5%. Higher blend biofuels canalso be used, although modifications to the vehicle may have to be made. When considering the carbon impact of different fuels and technologies it is important totake account of the whole lifecycle of both the vehicle and the fuel, as significant emissions may occur away from the actual use of vehicles on the road.
Further information and reading
The Government’s Office for Low Emission Vehicles – www.dft.gov.uk/pgr/sustainable/olev/
The Energy Saving Trust provides advice to local authorities on fleet improvements – www.energysavingtrust.org.uk/business/Business/Transport-advice
Green
Green
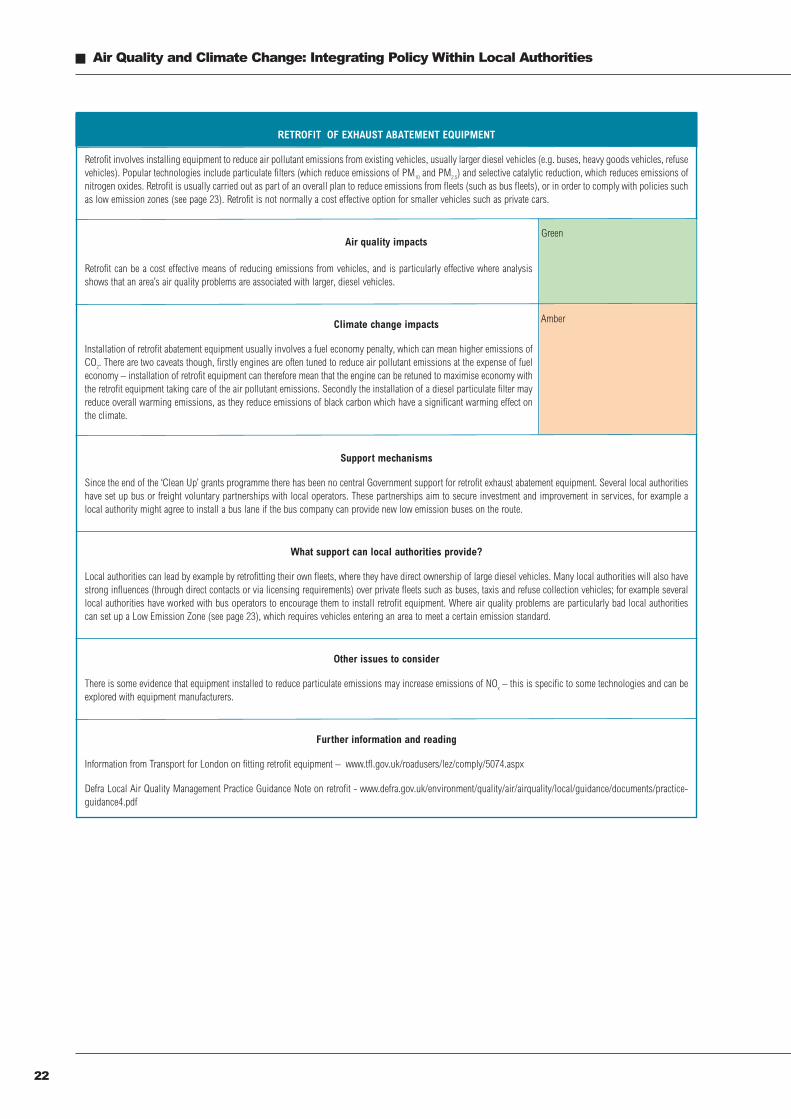
� Air Quality and Climate Change: Integrating Policy Within Local Authorities
22
RETROFIT OF EXHAUST ABATEMENT EQUIPMENT
Retrofit involves installing equipment to reduce air pollutant emissions from existing vehicles, usually larger diesel vehicles (e.g. buses, heavy goods vehicles, refusevehicles). Popular technologies include particulate filters (which reduce emissions of PM10 and PM2.5) and selective catalytic reduction, which reduces emissions ofnitrogen oxides. Retrofit is usually carried out as part of an overall plan to reduce emissions from fleets (such as bus fleets), or in order to comply with policies suchas low emission zones (see page 23). Retrofit is not normally a cost effective option for smaller vehicles such as private cars.
Air quality impacts
Retrofit can be a cost effective means of reducing emissions from vehicles, and is particularly effective where analysisshows that an area’s air quality problems are associated with larger, diesel vehicles.
Climate change impacts
Installation of retrofit abatement equipment usually involves a fuel economy penalty, which can mean higher emissions ofCO2. There are two caveats though, firstly engines are often tuned to reduce air pollutant emissions at the expense of fueleconomy – installation of retrofit equipment can therefore mean that the engine can be retuned to maximise economy withthe retrofit equipment taking care of the air pollutant emissions. Secondly the installation of a diesel particulate filter mayreduce overall warming emissions, as they reduce emissions of black carbon which have a significant warming effect onthe climate.
Support mechanisms
Since the end of the ‘Clean Up’ grants programme there has been no central Government support for retrofit exhaust abatement equipment. Several local authoritieshave set up bus or freight voluntary partnerships with local operators. These partnerships aim to secure investment and improvement in services, for example alocal authority might agree to install a bus lane if the bus company can provide new low emission buses on the route.
What support can local authorities provide?
Local authorities can lead by example by retrofitting their own fleets, where they have direct ownership of large diesel vehicles. Many local authorities will also havestrong influences (through direct contacts or via licensing requirements) over private fleets such as buses, taxis and refuse collection vehicles; for example severallocal authorities have worked with bus operators to encourage them to install retrofit equipment. Where air quality problems are particularly bad local authoritiescan set up a Low Emission Zone (see page 23), which requires vehicles entering an area to meet a certain emission standard.
Other issues to consider
There is some evidence that equipment installed to reduce particulate emissions may increase emissions of NOx – this is specific to some technologies and can beexplored with equipment manufacturers.
Further information and reading
Information from Transport for London on fitting retrofit equipment – www.tfl.gov.uk/roadusers/lez/comply/5074.aspx
Defra Local Air Quality Management Practice Guidance Note on retrofit - www.defra.gov.uk/environment/quality/air/airquality/local/guidance/documents/practice-guidance4.pdf
Green
Amber
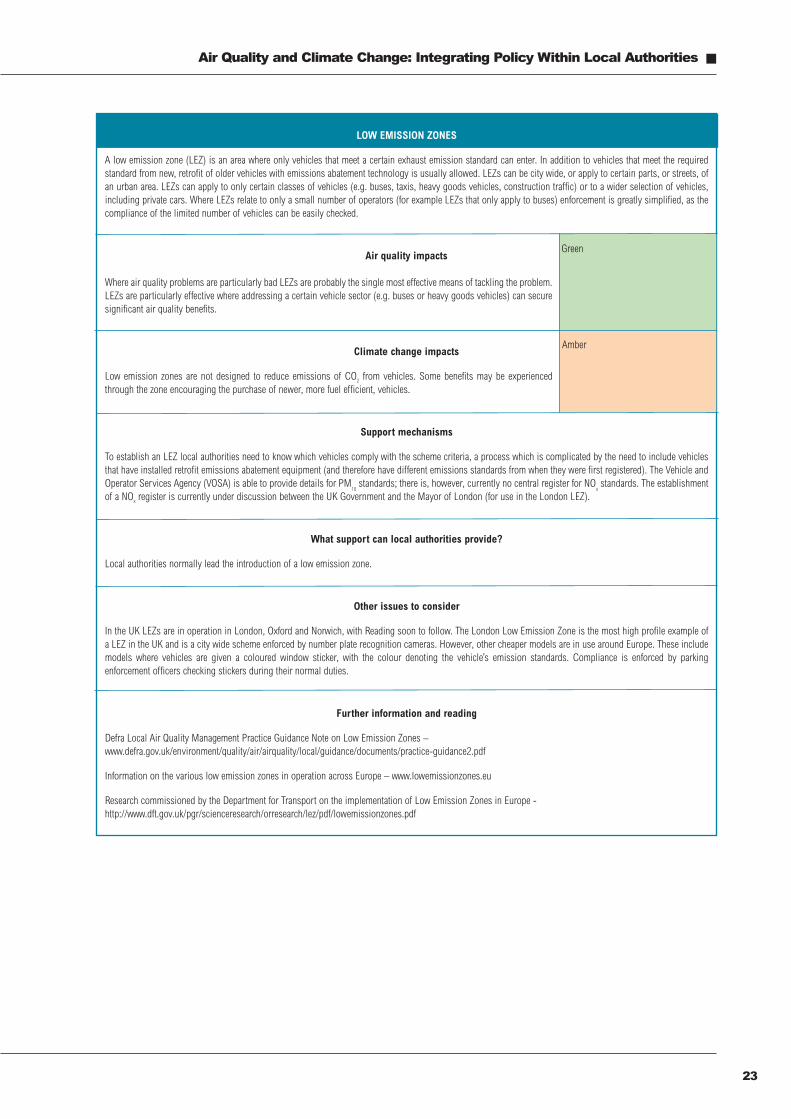
23
Air Quality and Climate Change: Integrating Policy Within Local Authorities �
LOW EMISSION ZONES
A low emission zone (LEZ) is an area where only vehicles that meet a certain exhaust emission standard can enter. In addition to vehicles that meet the requiredstandard from new, retrofit of older vehicles with emissions abatement technology is usually allowed. LEZs can be city wide, or apply to certain parts, or streets, ofan urban area. LEZs can apply to only certain classes of vehicles (e.g. buses, taxis, heavy goods vehicles, construction traffic) or to a wider selection of vehicles,including private cars. Where LEZs relate to only a small number of operators (for example LEZs that only apply to buses) enforcement is greatly simplified, as thecompliance of the limited number of vehicles can be easily checked.
Air quality impacts
Where air quality problems are particularly bad LEZs are probably the single most effective means of tackling the problem.LEZs are particularly effective where addressing a certain vehicle sector (e.g. buses or heavy goods vehicles) can securesignificant air quality benefits.
Climate change impacts
Low emission zones are not designed to reduce emissions of CO2 from vehicles. Some benefits may be experiencedthrough the zone encouraging the purchase of newer, more fuel efficient, vehicles.
Support mechanisms
To establish an LEZ local authorities need to know which vehicles comply with the scheme criteria, a process which is complicated by the need to include vehiclesthat have installed retrofit emissions abatement equipment (and therefore have different emissions standards from when they were first registered). The Vehicle andOperator Services Agency (VOSA) is able to provide details for PM
10standards; there is, however, currently no central register for NO
xstandards. The establishment
of a NOx register is currently under discussion between the UK Government and the Mayor of London (for use in the London LEZ).
What support can local authorities provide?
Local authorities normally lead the introduction of a low emission zone.
Other issues to consider
In the UK LEZs are in operation in London, Oxford and Norwich, with Reading soon to follow. The London Low Emission Zone is the most high profile example ofa LEZ in the UK and is a city wide scheme enforced by number plate recognition cameras. However, other cheaper models are in use around Europe. These includemodels where vehicles are given a coloured window sticker, with the colour denoting the vehicle’s emission standards. Compliance is enforced by parkingenforcement officers checking stickers during their normal duties.
Further information and reading
Defra Local Air Quality Management Practice Guidance Note on Low Emission Zones –www.defra.gov.uk/environment/quality/air/airquality/local/guidance/documents/practice-guidance2.pdf
Information on the various low emission zones in operation across Europe – www.lowemissionzones.eu
Research commissioned by the Department for Transport on the implementation of Low Emission Zones in Europe -http://www.dft.gov.uk/pgr/scienceresearch/orresearch/lez/pdf/lowemissionzones.pdf
Green
Amber
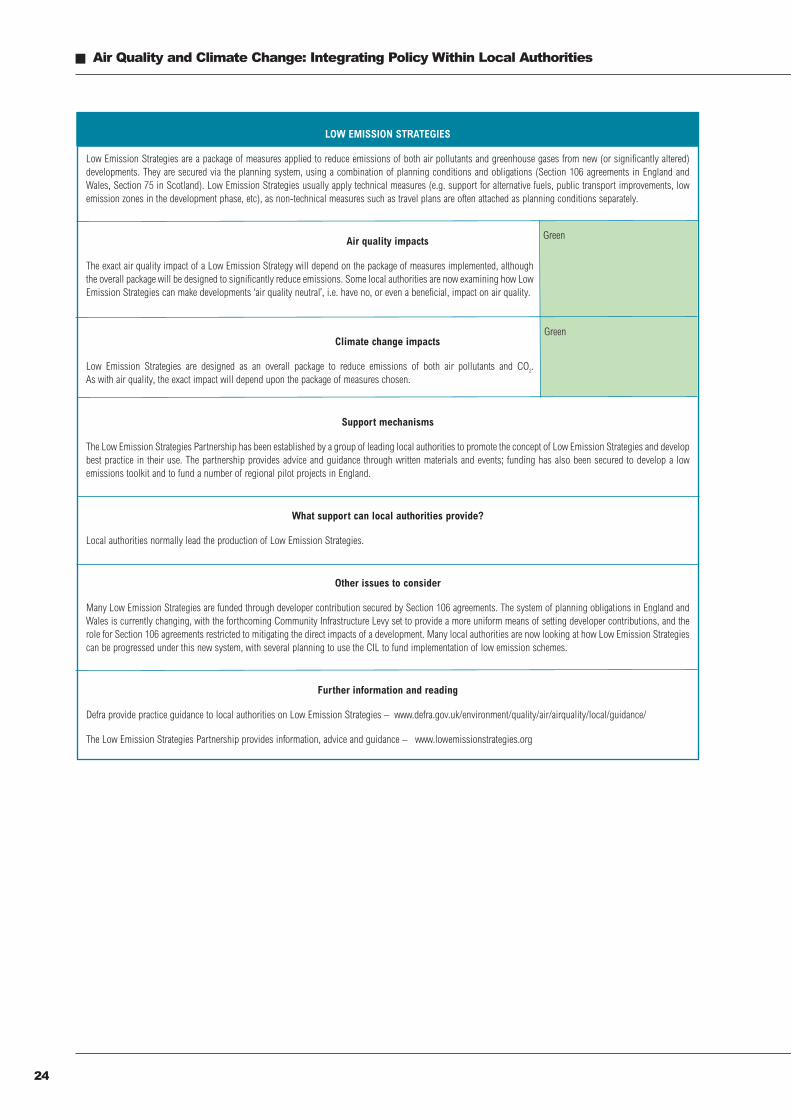
� Air Quality and Climate Change: Integrating Policy Within Local Authorities
24
LOW EMISSION STRATEGIES
Low Emission Strategies are a package of measures applied to reduce emissions of both air pollutants and greenhouse gases from new (or significantly altered)developments. They are secured via the planning system, using a combination of planning conditions and obligations (Section 106 agreements in England andWales, Section 75 in Scotland). Low Emission Strategies usually apply technical measures (e.g. support for alternative fuels, public transport improvements, lowemission zones in the development phase, etc), as non-technical measures such as travel plans are often attached as planning conditions separately.
Air quality impacts
The exact air quality impact of a Low Emission Strategy will depend on the package of measures implemented, althoughthe overall package will be designed to significantly reduce emissions. Some local authorities are now examining how LowEmission Strategies can make developments ‘air quality neutral’, i.e. have no, or even a beneficial, impact on air quality.
Climate change impacts
Low Emission Strategies are designed as an overall package to reduce emissions of both air pollutants and CO2.As with air quality, the exact impact will depend upon the package of measures chosen.
Support mechanisms
The Low Emission Strategies Partnership has been established by a group of leading local authorities to promote the concept of Low Emission Strategies and developbest practice in their use. The partnership provides advice and guidance through written materials and events; funding has also been secured to develop a lowemissions toolkit and to fund a number of regional pilot projects in England.
What support can local authorities provide?
Local authorities normally lead the production of Low Emission Strategies.
Other issues to consider
Many Low Emission Strategies are funded through developer contribution secured by Section 106 agreements. The system of planning obligations in England andWales is currently changing, with the forthcoming Community Infrastructure Levy set to provide a more uniform means of setting developer contributions, and therole for Section 106 agreements restricted to mitigating the direct impacts of a development. Many local authorities are now looking at how Low Emission Strategiescan be progressed under this new system, with several planning to use the CIL to fund implementation of low emission schemes.
Further information and reading
Defra provide practice guidance to local authorities on Low Emission Strategies – www.defra.gov.uk/environment/quality/air/airquality/local/guidance/
The Low Emission Strategies Partnership provides information, advice and guidance – www.lowemissionstrategies.org
Green
Green
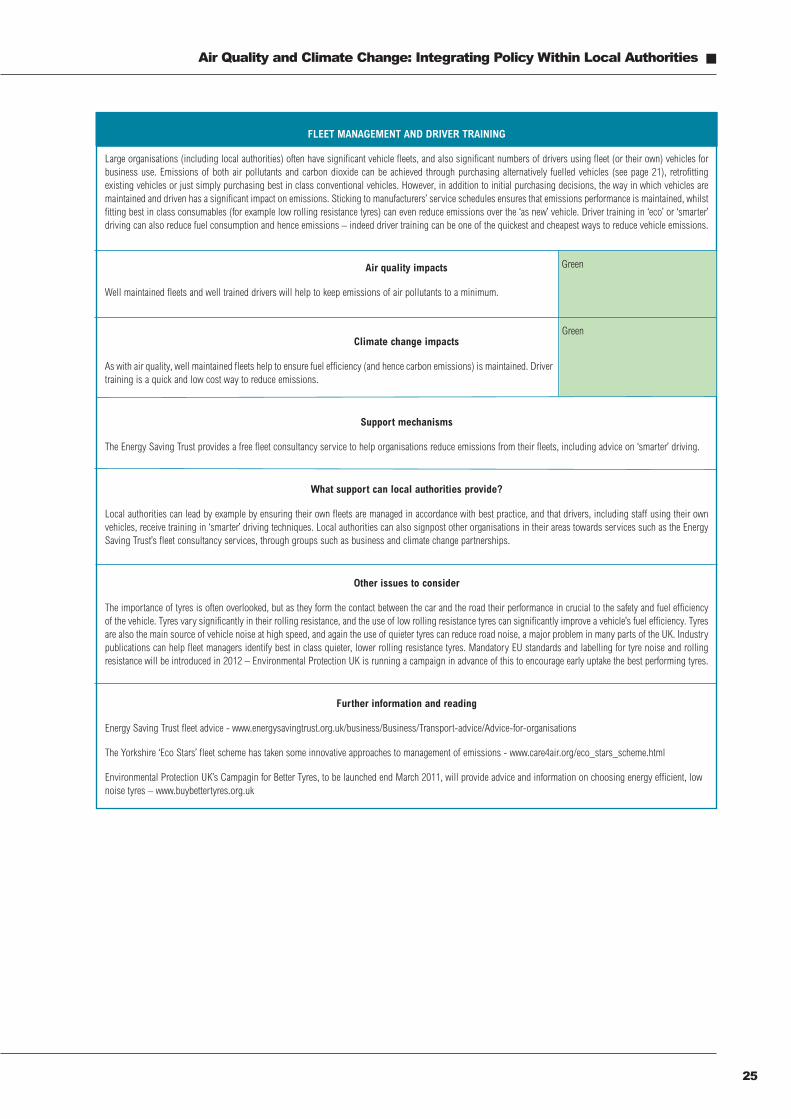
25
Air Quality and Climate Change: Integrating Policy Within Local Authorities �
FLEET MANAGEMENT AND DRIVER TRAINING
Large organisations (including local authorities) often have significant vehicle fleets, and also significant numbers of drivers using fleet (or their own) vehicles forbusiness use. Emissions of both air pollutants and carbon dioxide can be achieved through purchasing alternatively fuelled vehicles (see page 21), retrofittingexisting vehicles or just simply purchasing best in class conventional vehicles. However, in addition to initial purchasing decisions, the way in which vehicles aremaintained and driven has a significant impact on emissions. Sticking to manufacturers’ service schedules ensures that emissions performance is maintained, whilstfitting best in class consumables (for example low rolling resistance tyres) can even reduce emissions over the ‘as new’ vehicle. Driver training in ‘eco’ or ‘smarter’driving can also reduce fuel consumption and hence emissions – indeed driver training can be one of the quickest and cheapest ways to reduce vehicle emissions.
Air quality impacts
Well maintained fleets and well trained drivers will help to keep emissions of air pollutants to a minimum.
Climate change impacts
As with air quality, well maintained fleets help to ensure fuel efficiency (and hence carbon emissions) is maintained. Drivertraining is a quick and low cost way to reduce emissions.
Support mechanisms
The Energy Saving Trust provides a free fleet consultancy service to help organisations reduce emissions from their fleets, including advice on ‘smarter’ driving.
What support can local authorities provide?
Local authorities can lead by example by ensuring their own fleets are managed in accordance with best practice, and that drivers, including staff using their ownvehicles, receive training in ‘smarter’ driving techniques. Local authorities can also signpost other organisations in their areas towards services such as the EnergySaving Trust’s fleet consultancy services, through groups such as business and climate change partnerships.
Other issues to consider
The importance of tyres is often overlooked, but as they form the contact between the car and the road their performance in crucial to the safety and fuel efficiencyof the vehicle. Tyres vary significantly in their rolling resistance, and the use of low rolling resistance tyres can significantly improve a vehicle’s fuel efficiency. Tyresare also the main source of vehicle noise at high speed, and again the use of quieter tyres can reduce road noise, a major problem in many parts of the UK. Industrypublications can help fleet managers identify best in class quieter, lower rolling resistance tyres. Mandatory EU standards and labelling for tyre noise and rollingresistance will be introduced in 2012 – Environmental Protection UK is running a campaign in advance of this to encourage early uptake the best performing tyres.
Further information and reading
Energy Saving Trust fleet advice - www.energysavingtrust.org.uk/business/Business/Transport-advice/Advice-for-organisations
The Yorkshire ‘Eco Stars’ fleet scheme has taken some innovative approaches to management of emissions - www.care4air.org/eco_stars_scheme.html
Environmental Protection UK’s Campagin for Better Tyres, to be launched end March 2011, will provide advice and information on choosing energy efficient, lownoise tyres – www.buybettertyres.org.uk
Green
Green
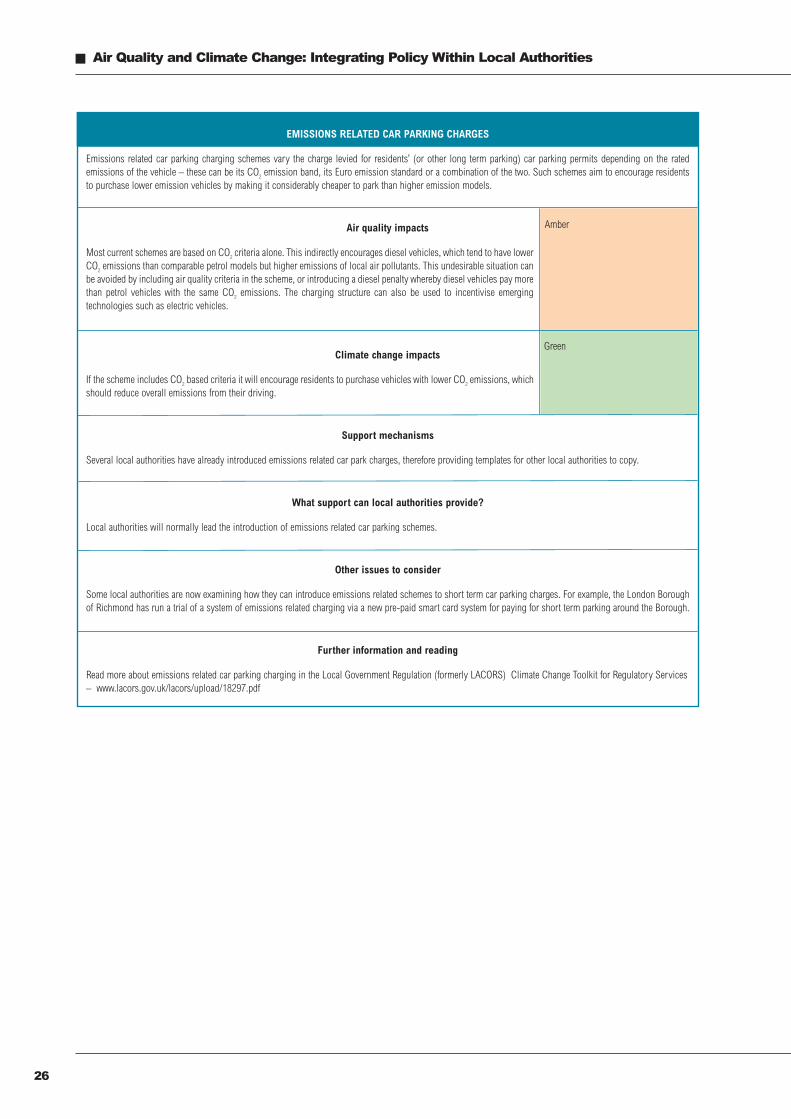
� Air Quality and Climate Change: Integrating Policy Within Local Authorities
26
EMISSIONS RELATED CAR PARKING CHARGES
Emissions related car parking charging schemes vary the charge levied for residents’ (or other long term parking) car parking permits depending on the ratedemissions of the vehicle – these can be its CO2 emission band, its Euro emission standard or a combination of the two. Such schemes aim to encourage residentsto purchase lower emission vehicles by making it considerably cheaper to park than higher emission models.
Air quality impacts
Most current schemes are based on CO2 criteria alone. This indirectly encourages diesel vehicles, which tend to have lowerCO2 emissions than comparable petrol models but higher emissions of local air pollutants. This undesirable situation canbe avoided by including air quality criteria in the scheme, or introducing a diesel penalty whereby diesel vehicles pay morethan petrol vehicles with the same CO2 emissions. The charging structure can also be used to incentivise emergingtechnologies such as electric vehicles.
Climate change impacts
If the scheme includes CO2 based criteria it will encourage residents to purchase vehicles with lower CO2 emissions, whichshould reduce overall emissions from their driving.
Support mechanisms
Several local authorities have already introduced emissions related car park charges, therefore providing templates for other local authorities to copy.
What support can local authorities provide?
Local authorities will normally lead the introduction of emissions related car parking schemes.
Other issues to consider
Some local authorities are now examining how they can introduce emissions related schemes to short term car parking charges. For example, the London Boroughof Richmond has run a trial of a system of emissions related charging via a new pre-paid smart card system for paying for short term parking around the Borough.
Further information and reading
Read more about emissions related car parking charging in the Local Government Regulation (formerly LACORS) Climate Change Toolkit for Regulatory Services– www.lacors.gov.uk/lacors/upload/18297.pdf
Amber
Green
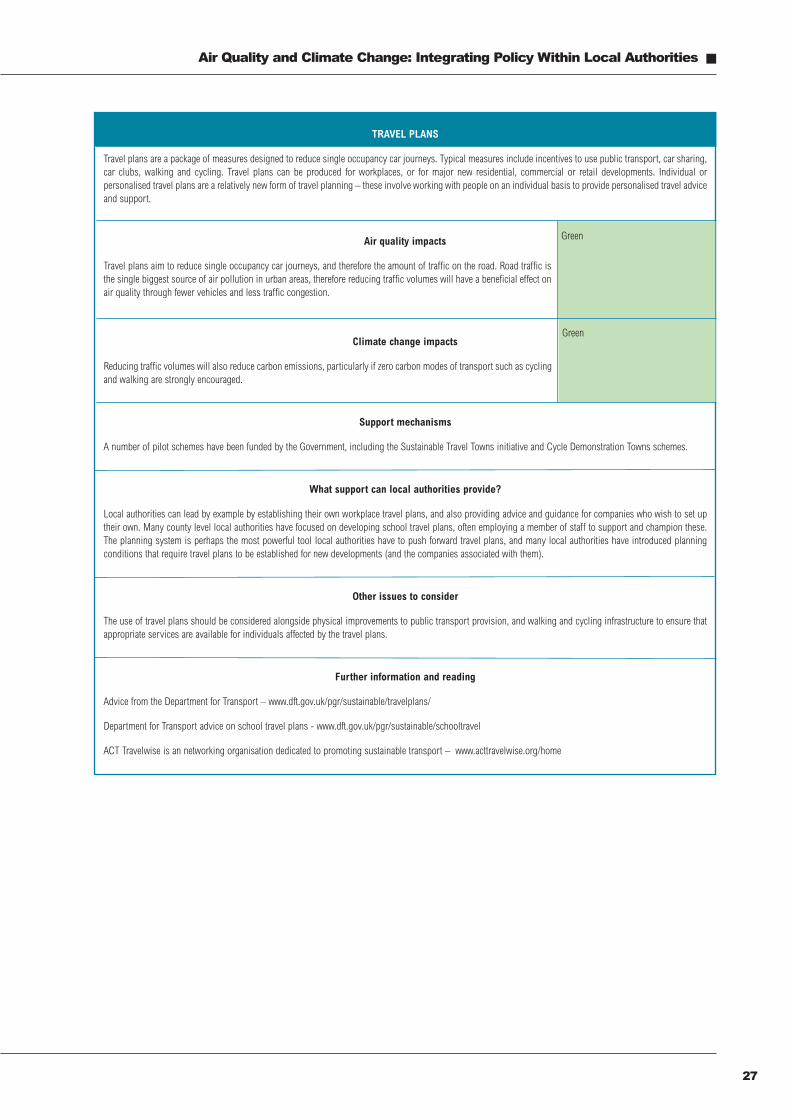
27
Air Quality and Climate Change: Integrating Policy Within Local Authorities �
TRAVEL PLANS
Travel plans are a package of measures designed to reduce single occupancy car journeys. Typical measures include incentives to use public transport, car sharing,car clubs, walking and cycling. Travel plans can be produced for workplaces, or for major new residential, commercial or retail developments. Individual orpersonalised travel plans are a relatively new form of travel planning – these involve working with people on an individual basis to provide personalised travel adviceand support.
Air quality impacts
Travel plans aim to reduce single occupancy car journeys, and therefore the amount of traffic on the road. Road traffic isthe single biggest source of air pollution in urban areas, therefore reducing traffic volumes will have a beneficial effect onair quality through fewer vehicles and less traffic congestion.
Climate change impacts
Reducing traffic volumes will also reduce carbon emissions, particularly if zero carbon modes of transport such as cyclingand walking are strongly encouraged.
Support mechanisms
A number of pilot schemes have been funded by the Government, including the Sustainable Travel Towns initiative and Cycle Demonstration Towns schemes.
What support can local authorities provide?
Local authorities can lead by example by establishing their own workplace travel plans, and also providing advice and guidance for companies who wish to set uptheir own. Many county level local authorities have focused on developing school travel plans, often employing a member of staff to support and champion these.The planning system is perhaps the most powerful tool local authorities have to push forward travel plans, and many local authorities have introduced planningconditions that require travel plans to be established for new developments (and the companies associated with them).
Other issues to consider
The use of travel plans should be considered alongside physical improvements to public transport provision, and walking and cycling infrastructure to ensure thatappropriate services are available for individuals affected by the travel plans.
Further information and reading
Advice from the Department for Transport – www.dft.gov.uk/pgr/sustainable/travelplans/
Department for Transport advice on school travel plans - www.dft.gov.uk/pgr/sustainable/schooltravel
ACT Travelwise is an networking organisation dedicated to promoting sustainable transport – www.acttravelwise.org/home
Green
Green
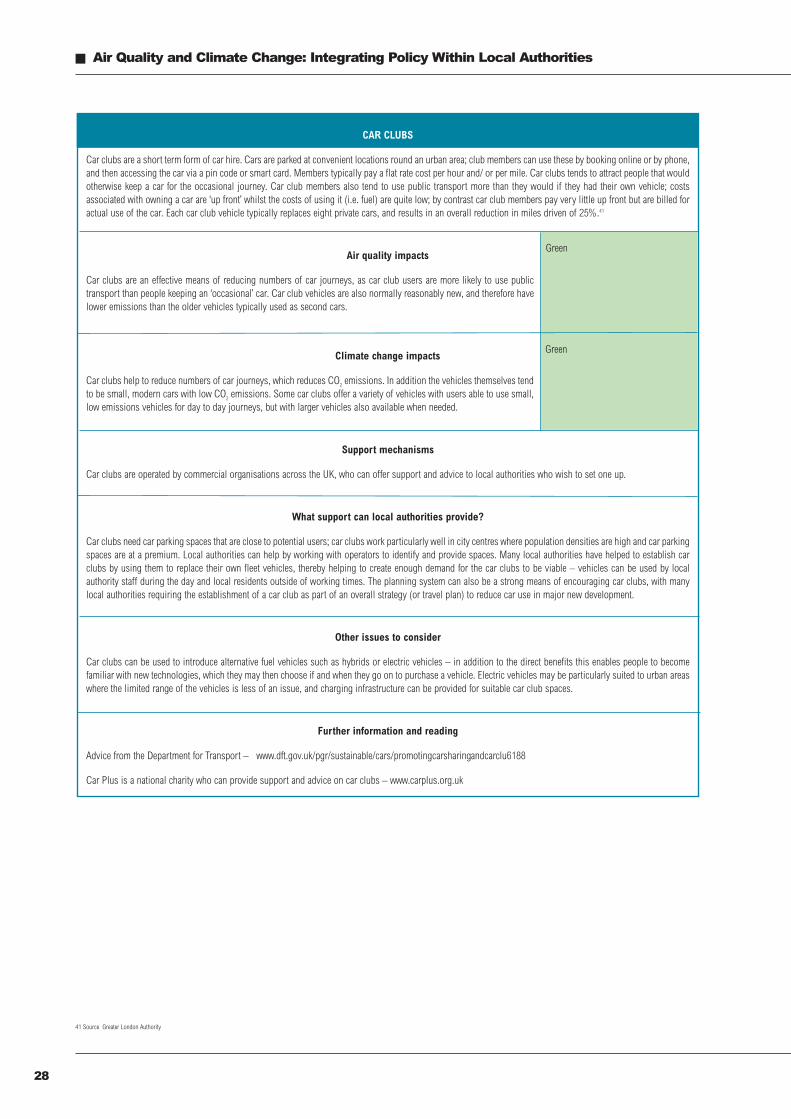
� Air Quality and Climate Change: Integrating Policy Within Local Authorities
28
CAR CLUBS
Car clubs are a short term form of car hire. Cars are parked at convenient locations round an urban area; club members can use these by booking online or by phone,and then accessing the car via a pin code or smart card. Members typically pay a flat rate cost per hour and/ or per mile. Car clubs tends to attract people that wouldotherwise keep a car for the occasional journey. Car club members also tend to use public transport more than they would if they had their own vehicle; costsassociated with owning a car are ‘up front’ whilst the costs of using it (i.e. fuel) are quite low; by contrast car club members pay very little up front but are billed foractual use of the car. Each car club vehicle typically replaces eight private cars, and results in an overall reduction in miles driven of 25%.41
Air quality impacts
Car clubs are an effective means of reducing numbers of car journeys, as car club users are more likely to use publictransport than people keeping an ‘occasional’ car. Car club vehicles are also normally reasonably new, and therefore havelower emissions than the older vehicles typically used as second cars.
Climate change impacts
Car clubs help to reduce numbers of car journeys, which reduces CO2 emissions. In addition the vehicles themselves tendto be small, modern cars with low CO2 emissions. Some car clubs offer a variety of vehicles with users able to use small,low emissions vehicles for day to day journeys, but with larger vehicles also available when needed.
Support mechanisms
Car clubs are operated by commercial organisations across the UK, who can offer support and advice to local authorities who wish to set one up.
What support can local authorities provide?
Car clubs need car parking spaces that are close to potential users; car clubs work particularly well in city centres where population densities are high and car parkingspaces are at a premium. Local authorities can help by working with operators to identify and provide spaces. Many local authorities have helped to establish carclubs by using them to replace their own fleet vehicles, thereby helping to create enough demand for the car clubs to be viable – vehicles can be used by localauthority staff during the day and local residents outside of working times. The planning system can also be a strong means of encouraging car clubs, with manylocal authorities requiring the establishment of a car club as part of an overall strategy (or travel plan) to reduce car use in major new development.
Other issues to consider
Car clubs can be used to introduce alternative fuel vehicles such as hybrids or electric vehicles – in addition to the direct benefits this enables people to becomefamiliar with new technologies, which they may then choose if and when they go on to purchase a vehicle. Electric vehicles may be particularly suited to urban areaswhere the limited range of the vehicles is less of an issue, and charging infrastructure can be provided for suitable car club spaces.
Further information and reading
Advice from the Department for Transport – www.dft.gov.uk/pgr/sustainable/cars/promotingcarsharingandcarclu6188
Car Plus is a national charity who can provide support and advice on car clubs – www.carplus.org.uk
Green
Green
41 Source Greater London Authority
The Built Environment
Air quality and climate change can both be addressed byimproving building energy efficiency, and installing small scalerenewable energy technologies. Energy efficiency is probablythe most cost effective means of reducing both CO2 and airpollutant emissions. Despite significant attention in recent yearsthere is still huge potential to save energy by improving theefficiency of homes and workplaces. Improving energyefficiency can involve reducing the energy demands of buildingsthrough insulation measures, the use of more efficientappliances, and supplying heat and power to buildings throughmore efficient means.
Small scale renewable energy technologies installed inhomes, offices and retail developments are an increasinglypopular means of reducing CO2 emissions. The impact of thesetechnologies on air quality and CO2 emissions depends a greatdeal on the following factors:
• The quality of the equipment installed, and the quality of theinstallation
• The suitability of the technology to its location• The type of fuel displaced by the new equipment
Good quality renewable installations should normally have abeneficial impact on CO2 emissions, particularly if they displacehigh carbon fuels such as coal, oil or electricity. The greatestimpacts will be seen where there is a very good renewableresource available to exploit (e.g. south facing unshaded roofsfor solar; high and consistent wind speeds for wind).
For air quality the greatest benefits will be seen where noncombustion technologies (e.g. solar thermal) replacecombustion (e.g. boilers) in urban areas with poor air quality.Electricity generation technologies will have a marginal impacton air quality – emissions will be reduced, but from powerstations rather than directly from the local area. Combustiontechnologies such as biomass may have a negative impact onair quality in urban areas where the most common heating fuelis natural gas, although if biomass displaces oil or coal firedheating it may have no impact, or even improve, air quality.
A location based approach to renewables can thereforehelp secure maximum benefits for air quality and carbonreduction. This approach encourages technologies that reduceemission of both CO2 and air pollutants (such as solar thermal)in urban centres with poor air quality, and technologies that mayhave an air quality penalty, such as biomass, in rural andsuburban areas.
29
Air Quality and Climate Change: Integrating Policy Within Local Authorities �
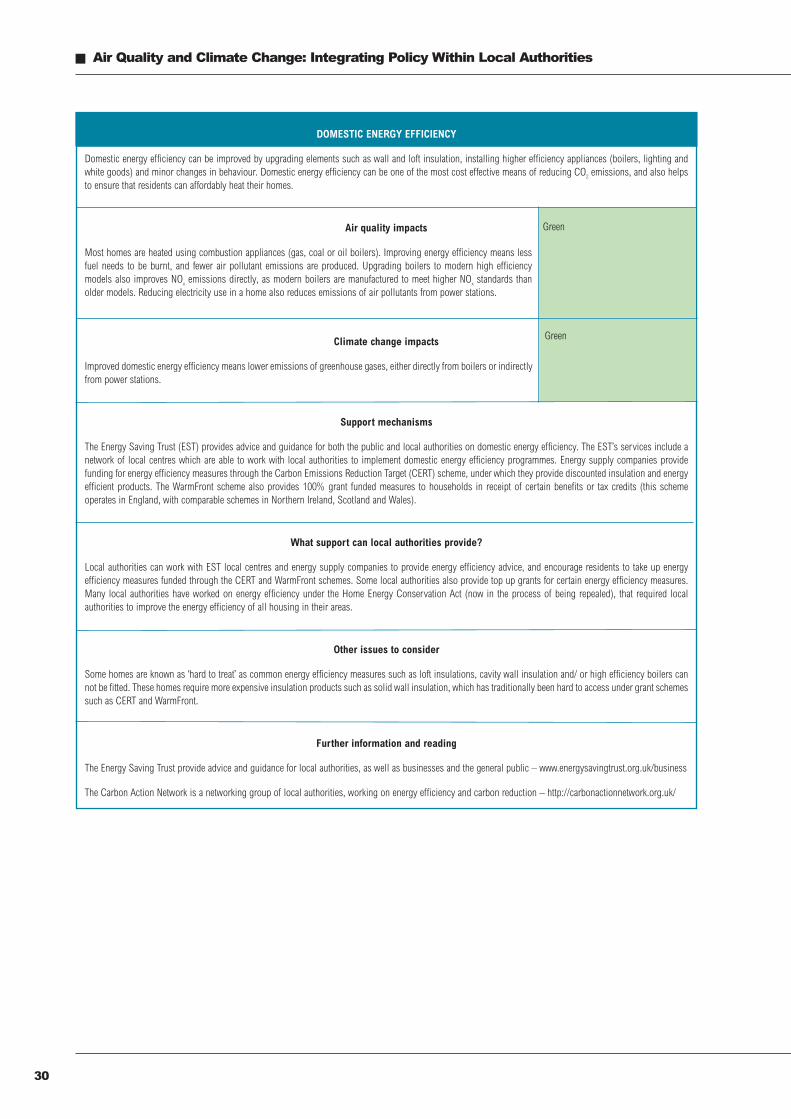
� Air Quality and Climate Change: Integrating Policy Within Local Authorities
30
DOMESTIC ENERGY EFFICIENCY
Domestic energy efficiency can be improved by upgrading elements such as wall and loft insulation, installing higher efficiency appliances (boilers, lighting andwhite goods) and minor changes in behaviour. Domestic energy efficiency can be one of the most cost effective means of reducing CO2 emissions, and also helpsto ensure that residents can affordably heat their homes.
Air quality impacts
Most homes are heated using combustion appliances (gas, coal or oil boilers). Improving energy efficiency means lessfuel needs to be burnt, and fewer air pollutant emissions are produced. Upgrading boilers to modern high efficiencymodels also improves NOx emissions directly, as modern boilers are manufactured to meet higher NOx standards thanolder models. Reducing electricity use in a home also reduces emissions of air pollutants from power stations.
Climate change impacts
Improved domestic energy efficiency means lower emissions of greenhouse gases, either directly from boilers or indirectlyfrom power stations.
Support mechanisms
The Energy Saving Trust (EST) provides advice and guidance for both the public and local authorities on domestic energy efficiency. The EST’s services include anetwork of local centres which are able to work with local authorities to implement domestic energy efficiency programmes. Energy supply companies providefunding for energy efficiency measures through the Carbon Emissions Reduction Target (CERT) scheme, under which they provide discounted insulation and energyefficient products. The WarmFront scheme also provides 100% grant funded measures to households in receipt of certain benefits or tax credits (this schemeoperates in England, with comparable schemes in Northern Ireland, Scotland and Wales).
What support can local authorities provide?
Local authorities can work with EST local centres and energy supply companies to provide energy efficiency advice, and encourage residents to take up energyefficiency measures funded through the CERT and WarmFront schemes. Some local authorities also provide top up grants for certain energy efficiency measures.Many local authorities have worked on energy efficiency under the Home Energy Conservation Act (now in the process of being repealed), that required localauthorities to improve the energy efficiency of all housing in their areas.
Other issues to consider
Some homes are known as ‘hard to treat’ as common energy efficiency measures such as loft insulations, cavity wall insulation and/ or high efficiency boilers cannot be fitted. These homes require more expensive insulation products such as solid wall insulation, which has traditionally been hard to access under grant schemessuch as CERT and WarmFront.
Further information and reading
The Energy Saving Trust provide advice and guidance for local authorities, as well as businesses and the general public – www.energysavingtrust.org.uk/business
The Carbon Action Network is a networking group of local authorities, working on energy efficiency and carbon reduction – http://carbonactionnetwork.org.uk/
Green
Green
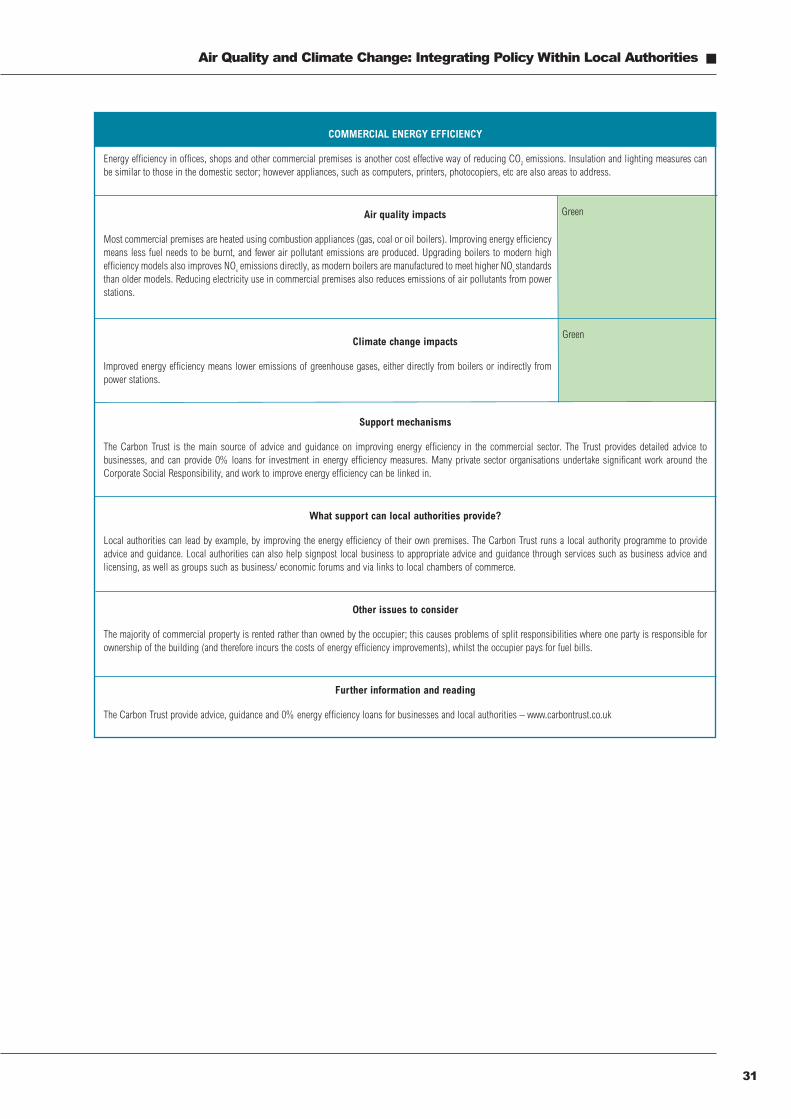
31
Air Quality and Climate Change: Integrating Policy Within Local Authorities �
COMMERCIAL ENERGY EFFICIENCY
Energy efficiency in offices, shops and other commercial premises is another cost effective way of reducing CO2 emissions. Insulation and lighting measures canbe similar to those in the domestic sector; however appliances, such as computers, printers, photocopiers, etc are also areas to address.
Air quality impacts
Most commercial premises are heated using combustion appliances (gas, coal or oil boilers). Improving energy efficiencymeans less fuel needs to be burnt, and fewer air pollutant emissions are produced. Upgrading boilers to modern highefficiency models also improves NOx emissions directly, as modern boilers are manufactured to meet higher NOxstandardsthan older models. Reducing electricity use in commercial premises also reduces emissions of air pollutants from powerstations.
Climate change impacts
Improved energy efficiency means lower emissions of greenhouse gases, either directly from boilers or indirectly frompower stations.
Support mechanisms
The Carbon Trust is the main source of advice and guidance on improving energy efficiency in the commercial sector. The Trust provides detailed advice tobusinesses, and can provide 0% loans for investment in energy efficiency measures. Many private sector organisations undertake significant work around theCorporate Social Responsibility, and work to improve energy efficiency can be linked in.
What support can local authorities provide?
Local authorities can lead by example, by improving the energy efficiency of their own premises. The Carbon Trust runs a local authority programme to provideadvice and guidance. Local authorities can also help signpost local business to appropriate advice and guidance through services such as business advice andlicensing, as well as groups such as business/ economic forums and via links to local chambers of commerce.
Other issues to consider
The majority of commercial property is rented rather than owned by the occupier; this causes problems of split responsibilities where one party is responsible forownership of the building (and therefore incurs the costs of energy efficiency improvements), whilst the occupier pays for fuel bills.
Further information and reading
The Carbon Trust provide advice, guidance and 0% energy efficiency loans for businesses and local authorities – www.carbontrust.co.uk
Green
Green
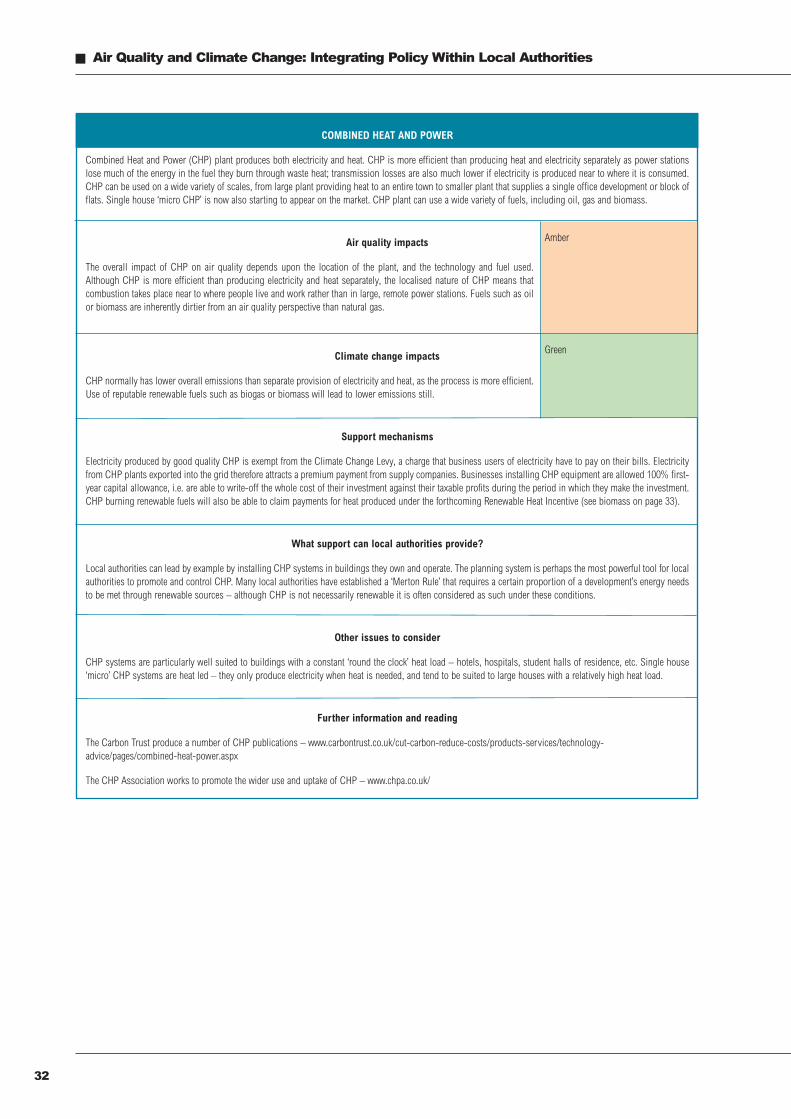
� Air Quality and Climate Change: Integrating Policy Within Local Authorities
32
COMBINED HEAT AND POWER
Combined Heat and Power (CHP) plant produces both electricity and heat. CHP is more efficient than producing heat and electricity separately as power stationslose much of the energy in the fuel they burn through waste heat; transmission losses are also much lower if electricity is produced near to where it is consumed.CHP can be used on a wide variety of scales, from large plant providing heat to an entire town to smaller plant that supplies a single office development or block offlats. Single house ‘micro CHP’ is now also starting to appear on the market. CHP plant can use a wide variety of fuels, including oil, gas and biomass.
Air quality impacts
The overall impact of CHP on air quality depends upon the location of the plant, and the technology and fuel used.Although CHP is more efficient than producing electricity and heat separately, the localised nature of CHP means thatcombustion takes place near to where people live and work rather than in large, remote power stations. Fuels such as oilor biomass are inherently dirtier from an air quality perspective than natural gas.
Climate change impacts
CHP normally has lower overall emissions than separate provision of electricity and heat, as the process is more efficient.Use of reputable renewable fuels such as biogas or biomass will lead to lower emissions still.
Support mechanisms
Electricity produced by good quality CHP is exempt from the Climate Change Levy, a charge that business users of electricity have to pay on their bills. Electricityfrom CHP plants exported into the grid therefore attracts a premium payment from supply companies. Businesses installing CHP equipment are allowed 100% first-year capital allowance, i.e. are able to write-off the whole cost of their investment against their taxable profits during the period in which they make the investment.CHP burning renewable fuels will also be able to claim payments for heat produced under the forthcoming Renewable Heat Incentive (see biomass on page 33).
What support can local authorities provide?
Local authorities can lead by example by installing CHP systems in buildings they own and operate. The planning system is perhaps the most powerful tool for localauthorities to promote and control CHP. Many local authorities have established a ‘Merton Rule’ that requires a certain proportion of a development’s energy needsto be met through renewable sources – although CHP is not necessarily renewable it is often considered as such under these conditions.
Other issues to consider
CHP systems are particularly well suited to buildings with a constant ‘round the clock’ heat load – hotels, hospitals, student halls of residence, etc. Single house‘micro’ CHP systems are heat led – they only produce electricity when heat is needed, and tend to be suited to large houses with a relatively high heat load.
Further information and reading
The Carbon Trust produce a number of CHP publications – www.carbontrust.co.uk/cut-carbon-reduce-costs/products-services/technology-advice/pages/combined-heat-power.aspx
The CHP Association works to promote the wider use and uptake of CHP – www.chpa.co.uk/
Amber
Green
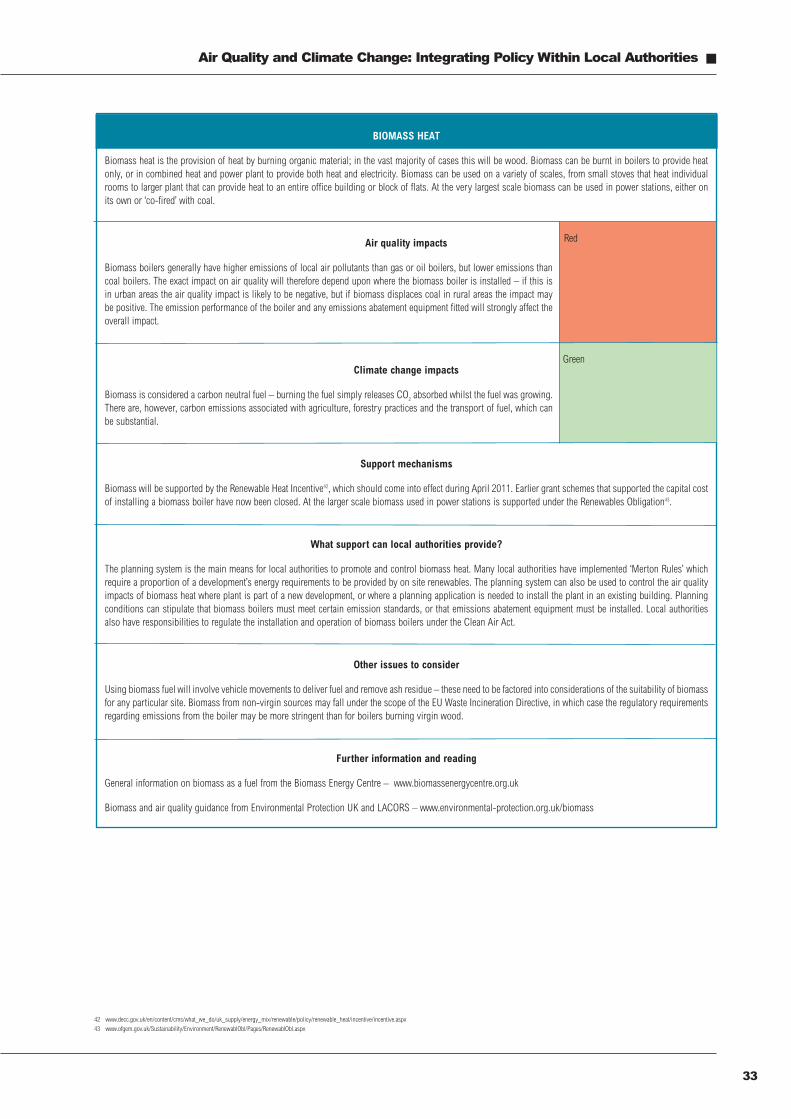
33
Air Quality and Climate Change: Integrating Policy Within Local Authorities �
BIOMASS HEAT
Biomass heat is the provision of heat by burning organic material; in the vast majority of cases this will be wood. Biomass can be burnt in boilers to provide heatonly, or in combined heat and power plant to provide both heat and electricity. Biomass can be used on a variety of scales, from small stoves that heat individualrooms to larger plant that can provide heat to an entire office building or block of flats. At the very largest scale biomass can be used in power stations, either onits own or ‘co-fired’ with coal.
Air quality impacts
Biomass boilers generally have higher emissions of local air pollutants than gas or oil boilers, but lower emissions thancoal boilers. The exact impact on air quality will therefore depend upon where the biomass boiler is installed – if this isin urban areas the air quality impact is likely to be negative, but if biomass displaces coal in rural areas the impact maybe positive. The emission performance of the boiler and any emissions abatement equipment fitted will strongly affect theoverall impact.
Climate change impacts
Biomass is considered a carbon neutral fuel – burning the fuel simply releases CO2 absorbed whilst the fuel was growing.There are, however, carbon emissions associated with agriculture, forestry practices and the transport of fuel, which canbe substantial.
Support mechanisms
Biomass will be supported by the Renewable Heat Incentive42, which should come into effect during April 2011. Earlier grant schemes that supported the capital costof installing a biomass boiler have now been closed. At the larger scale biomass used in power stations is supported under the Renewables Obligation43.
What support can local authorities provide?
The planning system is the main means for local authorities to promote and control biomass heat. Many local authorities have implemented ‘Merton Rules’ whichrequire a proportion of a development’s energy requirements to be provided by on site renewables. The planning system can also be used to control the air qualityimpacts of biomass heat where plant is part of a new development, or where a planning application is needed to install the plant in an existing building. Planningconditions can stipulate that biomass boilers must meet certain emission standards, or that emissions abatement equipment must be installed. Local authoritiesalso have responsibilities to regulate the installation and operation of biomass boilers under the Clean Air Act.
Other issues to consider
Using biomass fuel will involve vehicle movements to deliver fuel and remove ash residue – these need to be factored into considerations of the suitability of biomassfor any particular site. Biomass from non-virgin sources may fall under the scope of the EU Waste Incineration Directive, in which case the regulatory requirementsregarding emissions from the boiler may be more stringent than for boilers burning virgin wood.
Further information and reading
General information on biomass as a fuel from the Biomass Energy Centre – www.biomassenergycentre.org.uk
Biomass and air quality guidance from Environmental Protection UK and LACORS – www.environmental-protection.org.uk/biomass
Red
Green
42 www.decc.gov.uk/en/content/cms/what_we_do/uk_supply/energy_mix/renewable/policy/renewable_heat/incentive/incentive.aspx43 www.ofgem.gov.uk/Sustainability/Environment/RenewablObl/Pages/RenewablObl.aspx
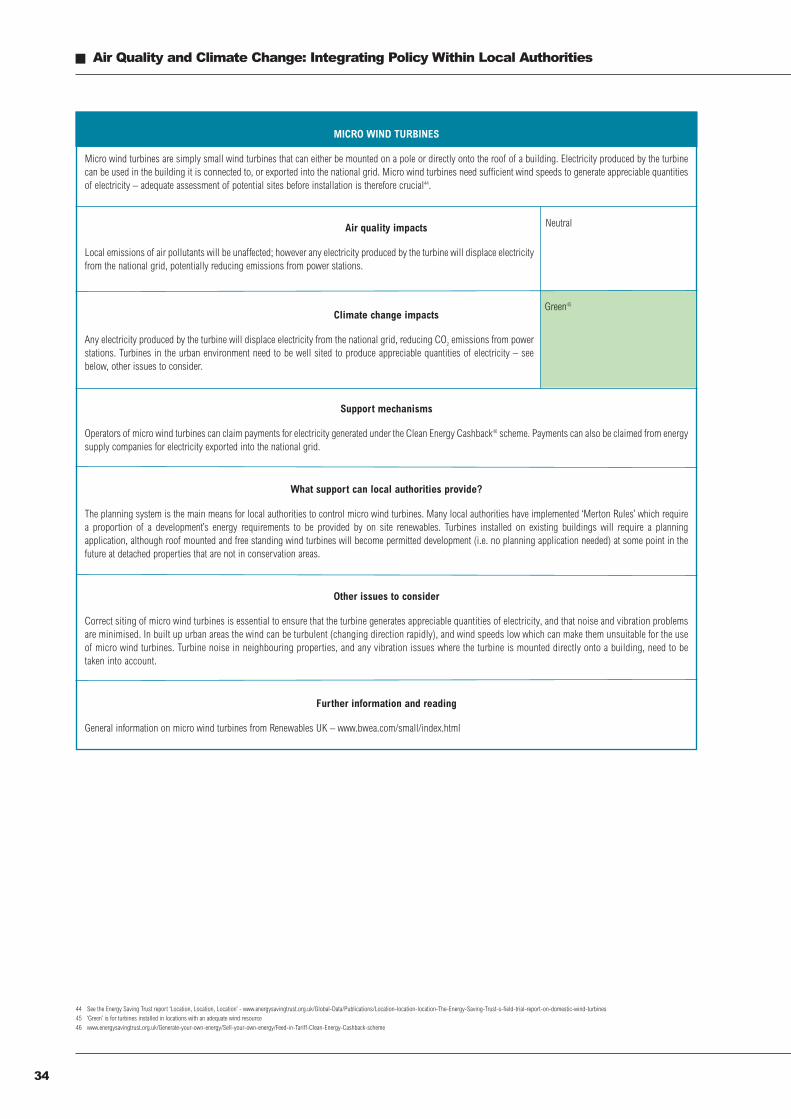
� Air Quality and Climate Change: Integrating Policy Within Local Authorities
34
MICRO WIND TURBINES
Micro wind turbines are simply small wind turbines that can either be mounted on a pole or directly onto the roof of a building. Electricity produced by the turbinecan be used in the building it is connected to, or exported into the national grid. Micro wind turbines need sufficient wind speeds to generate appreciable quantitiesof electricity – adequate assessment of potential sites before installation is therefore crucial44.
Air quality impacts
Local emissions of air pollutants will be unaffected; however any electricity produced by the turbine will displace electricityfrom the national grid, potentially reducing emissions from power stations.
Climate change impacts
Any electricity produced by the turbine will displace electricity from the national grid, reducing CO2 emissions from powerstations. Turbines in the urban environment need to be well sited to produce appreciable quantities of electricity – seebelow, other issues to consider.
Support mechanisms
Operators of micro wind turbines can claim payments for electricity generated under the Clean Energy Cashback46 scheme. Payments can also be claimed from energysupply companies for electricity exported into the national grid.
What support can local authorities provide?
The planning system is the main means for local authorities to control micro wind turbines. Many local authorities have implemented ‘Merton Rules’ which requirea proportion of a development’s energy requirements to be provided by on site renewables. Turbines installed on existing buildings will require a planningapplication, although roof mounted and free standing wind turbines will become permitted development (i.e. no planning application needed) at some point in thefuture at detached properties that are not in conservation areas.
Other issues to consider
Correct siting of micro wind turbines is essential to ensure that the turbine generates appreciable quantities of electricity, and that noise and vibration problemsare minimised. In built up urban areas the wind can be turbulent (changing direction rapidly), and wind speeds low which can make them unsuitable for the useof micro wind turbines. Turbine noise in neighbouring properties, and any vibration issues where the turbine is mounted directly onto a building, need to betaken into account.
Further information and reading
General information on micro wind turbines from Renewables UK – www.bwea.com/small/index.html
Green45
44 See the Energy Saving Trust report ‘Location, Location, Location’ - www.energysavingtrust.org.uk/Global-Data/Publications/Location-location-location-The-Energy-Saving-Trust-s-field-trial-report-on-domestic-wind-turbines45 ‘Green’ is for turbines installed in locations with an adequate wind resource46 www.energysavingtrust.org.uk/Generate-your-own-energy/Sell-your-own-energy/Feed-in-Tariff-Clean-Energy-Cashback-scheme
Neutral
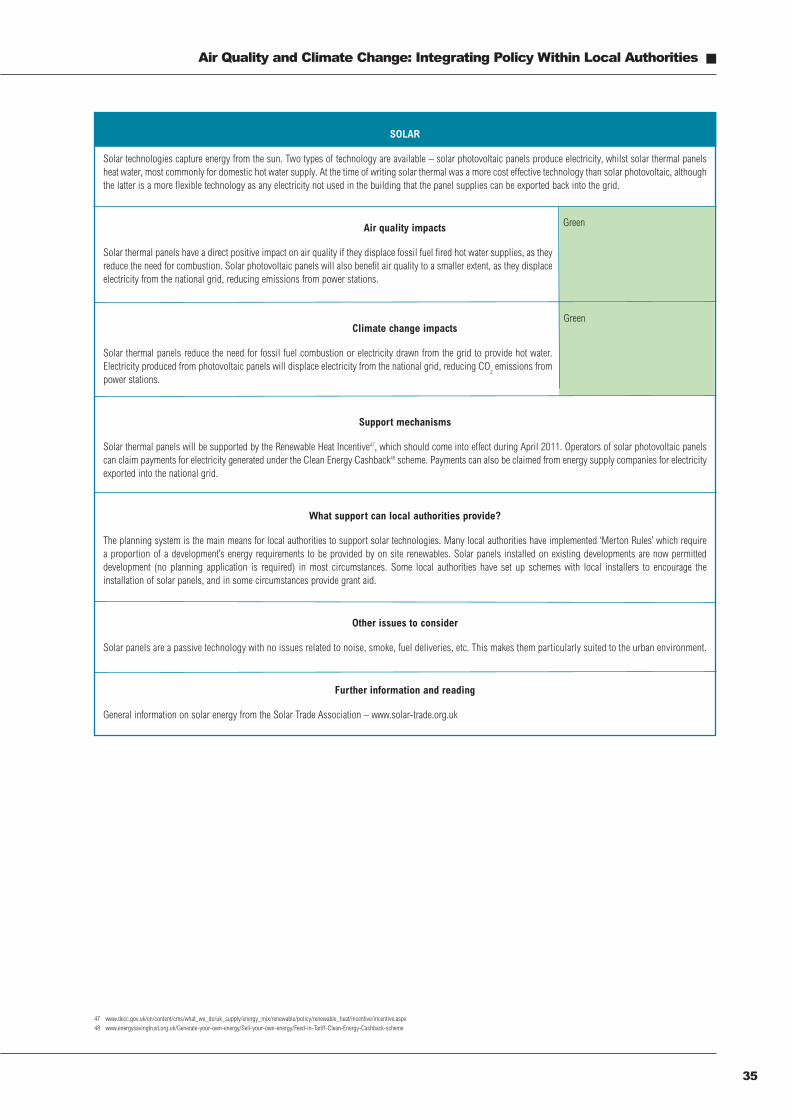
35
Air Quality and Climate Change: Integrating Policy Within Local Authorities �
SOLAR
Solar technologies capture energy from the sun. Two types of technology are available – solar photovoltaic panels produce electricity, whilst solar thermal panelsheat water, most commonly for domestic hot water supply. At the time of writing solar thermal was a more cost effective technology than solar photovoltaic, althoughthe latter is a more flexible technology as any electricity not used in the building that the panel supplies can be exported back into the grid.
Air quality impacts
Solar thermal panels have a direct positive impact on air quality if they displace fossil fuel fired hot water supplies, as theyreduce the need for combustion. Solar photovoltaic panels will also benefit air quality to a smaller extent, as they displaceelectricity from the national grid, reducing emissions from power stations.
Climate change impacts
Solar thermal panels reduce the need for fossil fuel combustion or electricity drawn from the grid to provide hot water.Electricity produced from photovoltaic panels will displace electricity from the national grid, reducing CO
2emissions from
power stations.
Support mechanisms
Solar thermal panels will be supported by the Renewable Heat Incentive47, which should come into effect during April 2011. Operators of solar photovoltaic panelscan claim payments for electricity generated under the Clean Energy Cashback48 scheme. Payments can also be claimed from energy supply companies for electricityexported into the national grid.
What support can local authorities provide?
The planning system is the main means for local authorities to support solar technologies. Many local authorities have implemented ‘Merton Rules’ which requirea proportion of a development’s energy requirements to be provided by on site renewables. Solar panels installed on existing developments are now permitteddevelopment (no planning application is required) in most circumstances. Some local authorities have set up schemes with local installers to encourage theinstallation of solar panels, and in some circumstances provide grant aid.
Other issues to consider
Solar panels are a passive technology with no issues related to noise, smoke, fuel deliveries, etc. This makes them particularly suited to the urban environment.
Further information and reading
General information on solar energy from the Solar Trade Association – www.solar-trade.org.uk
Green
Green
47 www.decc.gov.uk/en/content/cms/what_we_do/uk_supply/energy_mix/renewable/policy/renewable_heat/incentive/incentive.aspx48 www.energysavingtrust.org.uk/Generate-your-own-energy/Sell-your-own-energy/Feed-in-Tariff-Clean-Energy-Cashback-scheme
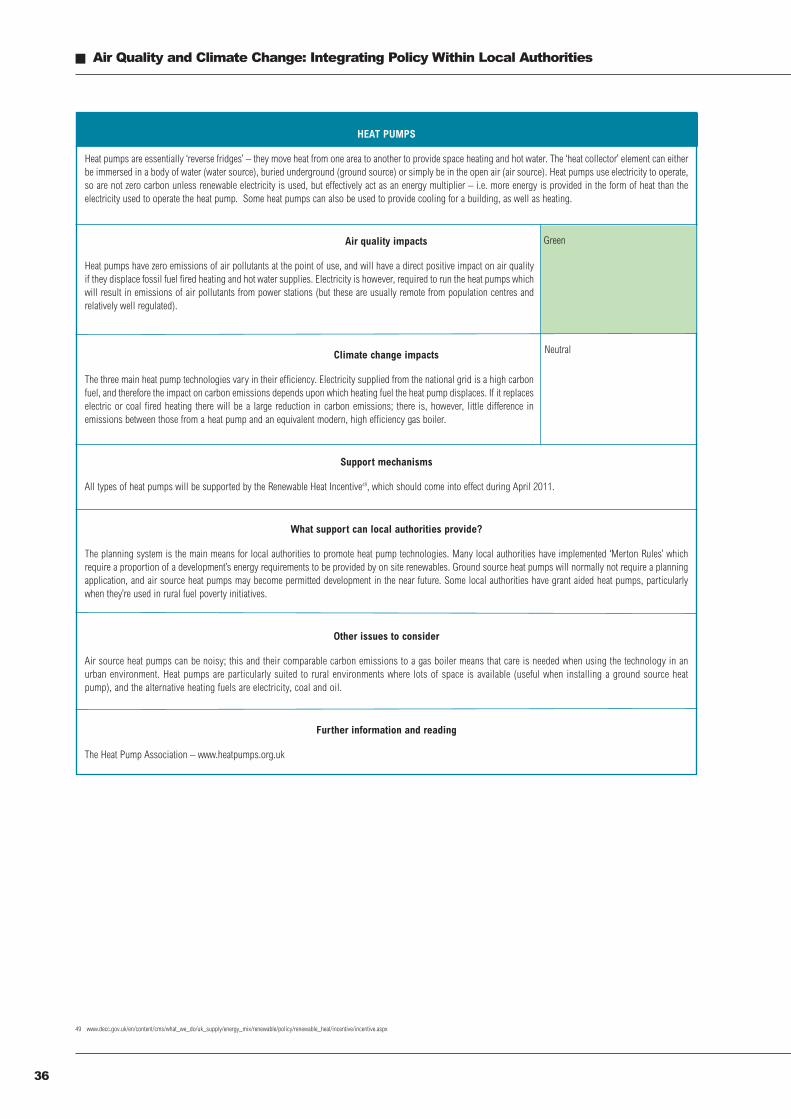
� Air Quality and Climate Change: Integrating Policy Within Local Authorities
36
HEAT PUMPS
Heat pumps are essentially ‘reverse fridges’ – they move heat from one area to another to provide space heating and hot water. The ‘heat collector’ element can eitherbe immersed in a body of water (water source), buried underground (ground source) or simply be in the open air (air source). Heat pumps use electricity to operate,so are not zero carbon unless renewable electricity is used, but effectively act as an energy multiplier – i.e. more energy is provided in the form of heat than theelectricity used to operate the heat pump. Some heat pumps can also be used to provide cooling for a building, as well as heating.
Air quality impacts
Heat pumps have zero emissions of air pollutants at the point of use, and will have a direct positive impact on air qualityif they displace fossil fuel fired heating and hot water supplies. Electricity is however, required to run the heat pumps whichwill result in emissions of air pollutants from power stations (but these are usually remote from population centres andrelatively well regulated).
Climate change impacts
The three main heat pump technologies vary in their efficiency. Electricity supplied from the national grid is a high carbonfuel, and therefore the impact on carbon emissions depends upon which heating fuel the heat pump displaces. If it replaceselectric or coal fired heating there will be a large reduction in carbon emissions; there is, however, little difference inemissions between those from a heat pump and an equivalent modern, high efficiency gas boiler.
Support mechanisms
All types of heat pumps will be supported by the Renewable Heat Incentive49, which should come into effect during April 2011.
What support can local authorities provide?
The planning system is the main means for local authorities to promote heat pump technologies. Many local authorities have implemented ‘Merton Rules’ whichrequire a proportion of a development’s energy requirements to be provided by on site renewables. Ground source heat pumps will normally not require a planningapplication, and air source heat pumps may become permitted development in the near future. Some local authorities have grant aided heat pumps, particularlywhen they’re used in rural fuel poverty initiatives.
Other issues to consider
Air source heat pumps can be noisy; this and their comparable carbon emissions to a gas boiler means that care is needed when using the technology in anurban environment. Heat pumps are particularly suited to rural environments where lots of space is available (useful when installing a ground source heatpump), and the alternative heating fuels are electricity, coal and oil.
Further information and reading
The Heat Pump Association – www.heatpumps.org.uk
Neutral
Green
49 www.decc.gov.uk/en/content/cms/what_we_do/uk_supply/energy_mix/renewable/policy/renewable_heat/incentive/incentive.aspx
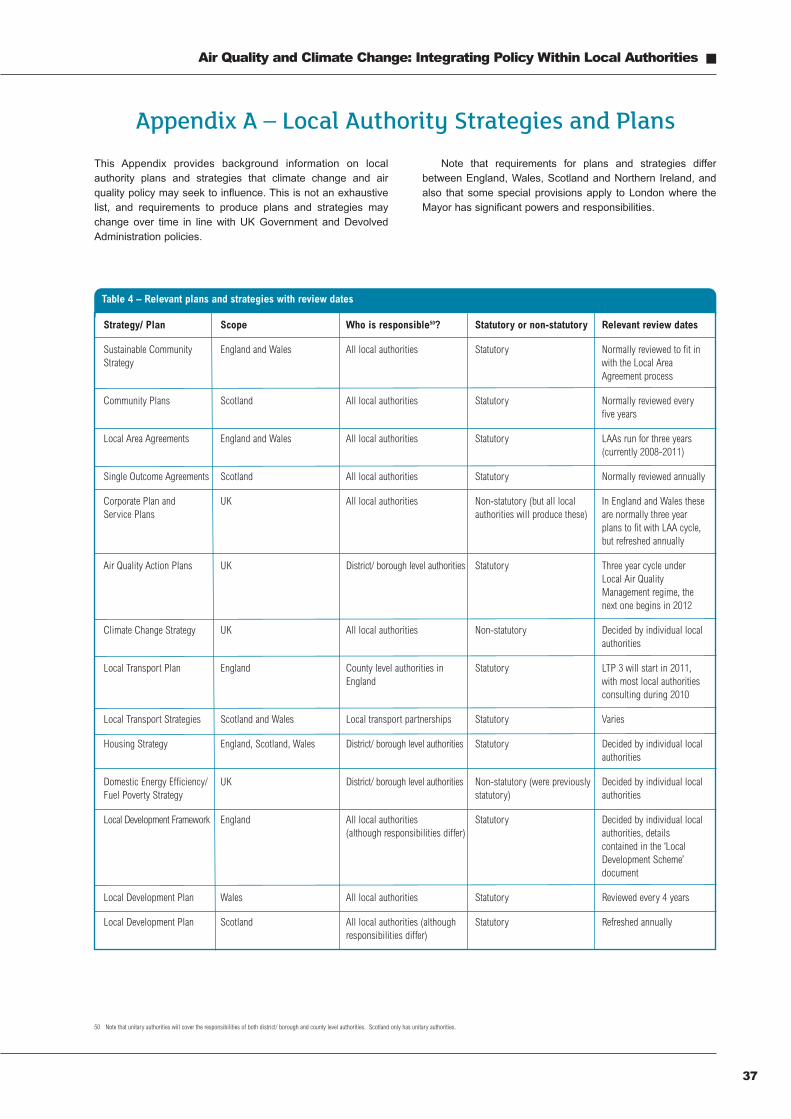
This Appendix provides background information on localauthority plans and strategies that climate change and airquality policy may seek to influence. This is not an exhaustivelist, and requirements to produce plans and strategies maychange over time in line with UK Government and DevolvedAdministration policies.
Note that requirements for plans and strategies differbetween England, Wales, Scotland and Northern Ireland, andalso that some special provisions apply to London where theMayor has significant powers and responsibilities.
37
Air Quality and Climate Change: Integrating Policy Within Local Authorities �
Appendix A – Local Authority Strategies and Plans
Table 4 – Relevant plans and strategies with review dates
Strategy/ Plan Scope Who is responsible50? Statutory or non-statutory Relevant review dates
Sustainable Community England and Wales All local authorities Statutory Normally reviewed to fit inStrategy with the Local Area
Agreement process
Community Plans Scotland All local authorities Statutory Normally reviewed everyfive years
Local Area Agreements England and Wales All local authorities Statutory LAAs run for three years(currently 2008-2011)
Single Outcome Agreements Scotland All local authorities Statutory Normally reviewed annually
Corporate Plan and UK All local authorities Non-statutory (but all local In England and Wales theseService Plans authorities will produce these) are normally three year
plans to fit with LAA cycle,but refreshed annually
Air Quality Action Plans UK District/ borough level authorities Statutory Three year cycle underLocal Air QualityManagement regime, thenext one begins in 2012
Climate Change Strategy UK All local authorities Non-statutory Decided by individual localauthorities
Local Transport Plan England County level authorities in Statutory LTP 3 will start in 2011,England with most local authorities
consulting during 2010
Local Transport Strategies Scotland and Wales Local transport partnerships Statutory Varies
Housing Strategy England, Scotland, Wales District/ borough level authorities Statutory Decided by individual localauthorities
Domestic Energy Efficiency/ UK District/ borough level authorities Non-statutory (were previously Decided by individual localFuel Poverty Strategy statutory) authorities
Local Development Framework England All local authorities Statutory Decided by individual local(although responsibilities differ) authorities, details
contained in the ‘LocalDevelopment Scheme’document
Local Development Plan Wales All local authorities Statutory Reviewed every 4 years
Local Development Plan Scotland All local authorities (although Statutory Refreshed annuallyresponsibilities differ)
50 Note that unitary authorities will cover the responsibilities of both district/ borough and county level authorities. Scotland only has unitary authorities.
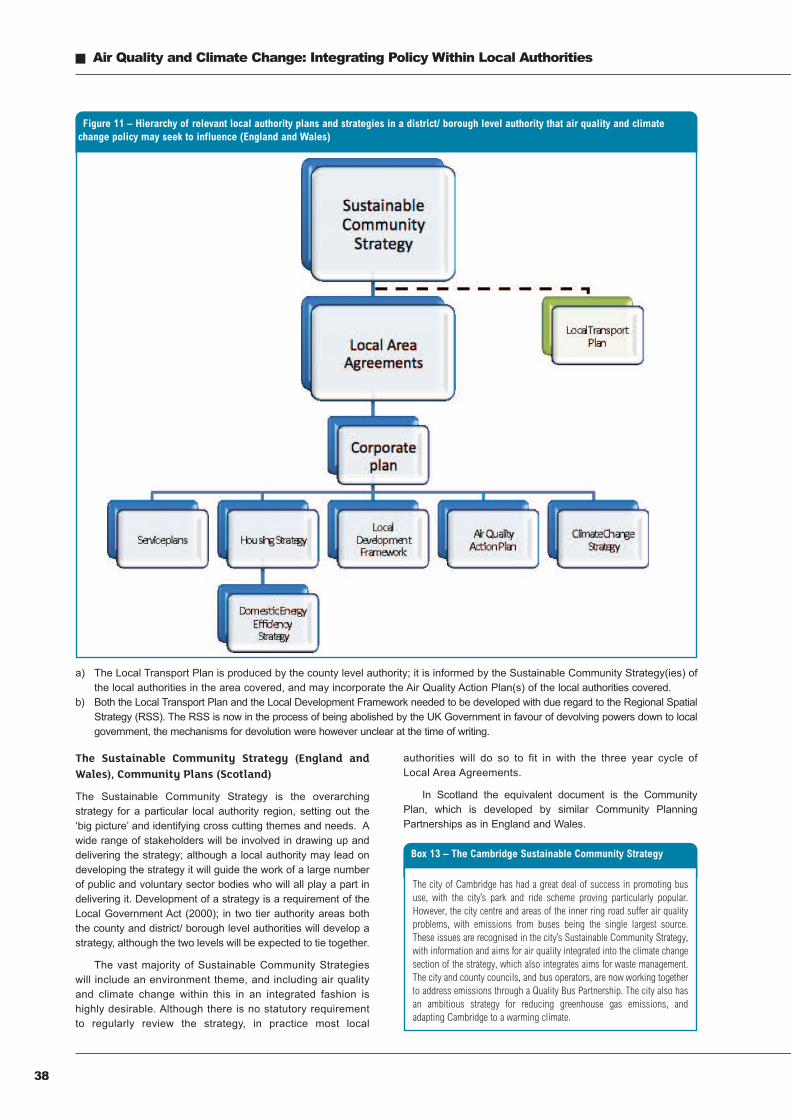
The Sustainable Community Strategy (England andWales), Community Plans (Scotland)
The Sustainable Community Strategy is the overarchingstrategy for a particular local authority region, setting out the‘big picture’ and identifying cross cutting themes and needs. Awide range of stakeholders will be involved in drawing up anddelivering the strategy; although a local authority may lead ondeveloping the strategy it will guide the work of a large numberof public and voluntary sector bodies who will all play a part indelivering it. Development of a strategy is a requirement of theLocal Government Act (2000); in two tier authority areas boththe county and district/ borough level authorities will develop astrategy, although the two levels will be expected to tie together.
The vast majority of Sustainable Community Strategieswill include an environment theme, and including air qualityand climate change within this in an integrated fashion ishighly desirable. Although there is no statutory requirementto regularly review the strategy, in practice most local
authorities will do so to fit in with the three year cycle ofLocal Area Agreements.
In Scotland the equivalent document is the CommunityPlan, which is developed by similar Community PlanningPartnerships as in England and Wales.
� Air Quality and Climate Change: Integrating Policy Within Local Authorities
38
Figure 11 – Hierarchy of relevant local authority plans and strategies in a district/ borough level authority that air quality and climatechange policy may seek to influence (England and Wales)
Box 13 – The Cambridge Sustainable Community Strategy
The city of Cambridge has had a great deal of success in promoting bususe, with the city’s park and ride scheme proving particularly popular.However, the city centre and areas of the inner ring road suffer air qualityproblems, with emissions from buses being the single largest source.These issues are recognised in the city’s Sustainable Community Strategy,with information and aims for air quality integrated into the climate changesection of the strategy, which also integrates aims for waste management.The city and county councils, and bus operators, are now working togetherto address emissions through a Quality Bus Partnership. The city also hasan ambitious strategy for reducing greenhouse gas emissions, andadapting Cambridge to a warming climate.
a) The Local Transport Plan is produced by the county level authority; it is informed by the Sustainable Community Strategy(ies) ofthe local authorities in the area covered, and may incorporate the Air Quality Action Plan(s) of the local authorities covered.
b) Both the Local Transport Plan and the Local Development Framework needed to be developed with due regard to the Regional SpatialStrategy (RSS). The RSS is now in the process of being abolished by the UK Government in favour of devolving powers down to localgovernment, the mechanisms for devolution were however unclear at the time of writing.
Local Area Agreements (England and Wales), SingleOutcome Agreements (Scotland)
Local Area Agreements (LAAs) are three year plans to deliveron priorities set out in the Sustainable Community Strategy.They are the main means in which priorities and targets areagreed between national and local Government, and the targetswithin them formed the criteria by which authorities were judgedduring the Comprehensive Area Assessment process (nowabolished). LAAs contain 16 statutory targets for education andearly years development, and a further 35 targets for indicatorsthat local authorities pick from the national indicator set (of 198)to reflect local priorities, as identified in the SustainableCommunity Strategy. The targets are agreed with the relevantGovernment Office for the regions, and signed off by Ministers51.
The national indicator set includes indicators for both airquality and climate change, and getting targets for theseincluded in the LAA is therefore desirable for those seeking toprogress work in these areas. It is worth noting that the LAA cancontain targets for areas not covered by the national indicatorset, in addition to the 51 indicators required. This can beimportant for air quality, as there is no indicator for ‘community’air pollutant emissions, just those emitted by the localauthority’s own estates and operations. The current round ofLAAs runs from 2008 to 2011; a further three year LAA cyclemay follow, depending on the policies of the UK Governmentelected in 2010. LAAs are usually refreshed annually to ensurethey still meet local needs, with discussions and negotiationsusually taking place between July and December.
In Scotland the equivalent system is Single OutcomeAgreements. These are agreements between the ScottishGovernment and Community Planning Partnerships, based on15 National Outcomes. The agreements set strategic prioritiesfor local areas and outline how these priorities will bedelivered by the partners. They also show how theseoutcomes will contribute to the Scottish Government's relevantNational Outcomes.
Service Plans (UK)
All local authorities will produce service plans; these relate tothe services that a local authority provides. The overarchingdocument will be the Corporate Plan, which links the Local AreaAgreement and Community Strategy to the council's otherbusiness and service plans. Service plans will be developed tofit in below this, either on a departmental basis or using crosscutting delivery themes.
In England and Wales service plans usually run on a three
year cycle to fit in with the Local Area Agreement cycle, and areusually refreshed annually. Getting air quality and climatechange included in relevant service plans in an integratedfashion is highly desirable – this is easiest if it can be done in a‘top down’ fashion, i.e. rolled down from the Corporate Plan,rather than driven from the ‘bottom up’ into each relevantservice plan.
Air Quality Action Plans (UK)
Under the Local Air Quality Management (LAQM) regime localauthorities are required to periodically assess air quality in theirarea, and declare an Air Quality Management Area (AQMA) ifexceedances of national air quality standards are found. Oncethey have declared an AQMA they need to produce a furtherassessment to investigate the nature and scale of the problem,and an action plan setting out what measures they propose totake ‘in pursuit of the achievement of air quality standards andobjectives’. The LAQM regime is a requirement of theEnvironment Act (1995). The regime follows a three year cycle,with the last round of review and assessments completed in2009. Air quality action plans are normally reviewed after eachround of review and assessments to ensure that they addressthe problems identified.
LAQM is the responsibility of district/ borough levelauthorities, and in recent years they have been encouraged tointegrate air quality action plans into Local Transport Plansproduced by county level authorities. This has met with mixedsuccess, in part due to the differing timescales for thedevelopment of air quality action plans and Local TransportPlans. Special provisions apply in London where the Mayor isrequired to produce a London air quality strategy setting outproposals and policies for implementation of the national airquality strategy, and for the achievement of air quality standardsand objectives in London. The Mayor is also required toscrutinise reports and plans submitted by the London Boroughsunder the LAQM regime, which elsewhere in the UK is theresponsibility of Defra or the relevant Devolved Administration.
The next cycle of LAQM will begin in 2012. It is desirablefor those drawing up air quality action plans to involve thoseresponsible for developing the local authority’s policies onreducing emissions of greenhouse gases at an early stage, andfor the plan to take account of measures designed to reduceemissions of greenhouse gases – both air quality action plansand climate change strategies will largely be addressing thesame sources of pollution.
39
Air Quality and Climate Change: Integrating Policy Within Local Authorities �
51 Government offices for the regions have been abolished by the new UK Government; however at the time of writing it was not clear what systems would replace them
Box 14 – Air quality in the City of London’s Local Area Agreement
The City of London is a unique local authority governing a unique area. Theresident population of the City’s area is very small, but the businessesresident in the area are very significant on a national level. As such the Cityhas a unique LAA with only 6 indicators rather the usual 35. Air quality inthe City is very poor, and therefore one of the 6 indicators chosen for theLAA is ‘NI 194 Level of air quality – reduction in NOx and primary PM10
emissions through local authority’s estate and operations’. The target is fora 5% reduction in emissions over the 2 year period of the LAA; at the timeof writing the City had exceeded this target with a reduction in NOx of 8.4%and PM10 of 10% in the first year, mainly through energy efficiency and fleetmanagement measures.
Box 15 – Climate change and air quality in the Sheffield CityCouncil Corporate Plan
Long a leading authority in the field of managing air quality, Sheffield CityCouncil has recognised the need for addressing climate change in itsCorporate Plan. The plan sets out the Council’s ambitions for raisingcommunity awareness, insulating more homes and schools and switchingto low emission vehicle technologies. In doing this, the plan recognisesthat significant air quality benefits can also be secured. Sheffield has alsoworked to integrate the delivery of air quality and climate change functions,with the establishment of a Carbon Reduction and Air Quality Team. Thecity’s new Air Quality Action Plan, currently in development, will considercarbon impacts, and aim to prioritise 'win-win' measures that show benefitsfor both air quality and greenhouse gas emissions.
Local Transport Plans (England), Local TransportStrategies (Scotland and Wales)
Local Transport Plans (LTPs) contain a local authority’s plansand priorities for transportation, covering areas such as roads,public transport provision and walking and cycling facilities.They are prepared by county level and unitary authorities, or inmetropolitan regions by the Passenger Transport Executive inconjunction with district/ borough level authorities. LTPs musthave regard to Regional Spatial Strategies (abolished by thecurrent UK Government, but still in place during the LTP3development phase) and Sustainable Community Strategies.LTPs are used by the Department for Transport to set fundingallocations.
The current round of LTPs (LTP 2) ends in March 2011, withthe new round ‘LTP 3’ starting where LTP 2 left off. Unlike itspredecessors LTP 3 will have no fixed end date, and insteadmost LTP 3s will have a long term strategy (25 years) and ashort term 3-5 year implementation plan. In drawing up theirLTP 3s local authorities need to give regard to five goals set outin the Department for Transport’s ‘Delivering a SustainableTransport System’ document. These include ‘To reducetransport’s emissions of carbon dioxide and other greenhousegases’ and ‘to improve quality of life for transport users and non-transport users, and to promote a healthy natural environment’(which includes air quality). Many local authorities integratedtheir air quality action plans into LTP 2 (which was encouragedby central Government), a process which should continue withLTP 3. With transport being a ‘problem sector’ for both airquality and climate change influencing the content on the LocalTransport Plan is key to addressing both problems.
In Scotland and Wales the equivalent document to the LTPis known as the Local Transport Strategy. These are producedby Local Transport Partnerships covering a region of thedevolved administration. Unlike the English LTP system thereare no fixed dates for the production or refreshing of thestrategy, with most partnerships choosing to implement a longterm strategy with a shorter term implementation plan (as withthe English LTP 3).
In Northern Ireland transportation is the responsibility of theDepartment for Regional Development, who produce aRegional Transport Strategy.
Housing Strategies (UK)
Most local authorities have now transferred ownership of theirown council housing to registered social landlords, althoughdistrict/ borough level authorities still have a key role in shapingand delivering private housing services in their areas. These
duties include provision of new housing (which has a knock-onimpact on transport in the area), and encouragingimprovements to energy efficiency in all of the housing in theirarea. In common with the general theme of reducing statutoryrequirements on local authorities it is no longer a requirement inEngland to produce a housing strategy for assessment by therelevant Government Office; instead local authorities areencouraged to incorporate the Housing Strategy within theirSustainable Community Strategy, with freedom as to how andwhen they document their policies. In practice most localauthorities are continuing to produce separate housingstrategies but without a fixed timetable imposed by centralGovernment.
In Northern Ireland housing is the responsibility of theNorthern Ireland Housing Executive, rather than individual localauthorities.
Domestic Energy Efficiency/ Fuel Poverty Strategy (UK)
Under the Home Energy Conservation Act (1995) all localauthorities with a housing responsibility were required to drawup a strategy for effecting a 30% improvement in domesticenergy efficiency across all housing in their area over a 10-15year timescale. By 1997 most local authorities had preparedtheir strategy, and annual reporting to central Governmentcommenced. The Home Energy Conservation Act is now in theprocess of being repealed, and annual reporting requirementshave been dropped; however many local authorities still have adomestic energy efficiency strategy, and in some cases theseare being updated to fit with current climate change targets,either as stand alone documents or subsumed into housing orclimate change strategies.
Many local authorities have also developed fuel poverty or‘affordable warmth’ strategies, linked to their statutory HECAstrategies. These aim to use energy efficiency and othermeasures to reduce the number of people unable to adequatelyheat their home due to high fuel bills. They may be a separatedocument, a bolt on to the HECA strategy or alternativelyproduced in conjunction with other local authorities to cover awider geographical area (e.g. a county).
Local Development Framework (England and Wales),
� Air Quality and Climate Change: Integrating Policy Within Local Authorities
40
Box 16 – The Local Transport Plan and air quality in West Sussex
Although predominantly rural the county of West Sussex contains anumber of Air Quality Management Areas, a consequence of the area’s busyroads. Transport planning at the county level, and air quality managementat the district level, are brought together in the Sussex Air QualityPartnership, with a county transport planner taking an active part in thegroup. Measures that have helped to improve air quality include schooltravel plans, improvements to bus fleets and infrastructure, and measuresto encourage cycling. The county is now planning to implement a numberof new measures including variable messaging signs on busy roads,electric vehicle charging points and larger infrastructure measuresincluding Park & Ride, bus priority and cycle bridges.
Box 17 – Gloucestershire’s Warm and Well scheme
Gloucestershire’s successful Warm and Well scheme aims to improveenergy efficiency and reduce fuel poverty across the county. The schemewas developed by the Severn Wye Energy Agency in partnership with thelocal authorities of Gloucestershire, and provides both energy advice and aholistic approach to the provision of grants for energy efficiency measures.Households using the scheme are referred to suitable grant providers formeasures such as insulation and heating upgrades – the Government’sWarmFront scheme, a local authority funded Gloucestershire EnergyEfficiency Grant, or discounted insulation schemes run by energysuppliers. The scheme has also periodically provided heat recovery extractfans and solar water heating when funding has been available. In operationsince 2001, Warm and Well has grown into the main vehicle for improvingdomestic energy efficiency in the county, with over 30,000 householdsinstalling energy efficiency measures, with lifetime savings of over 188,000tonnes of carbon.
Local Development Plan (Scotland)
The Local Development Framework (LDF) is now themechanism for local authority’s forward spatial planning inEngland and Wales, replacing the previous Local Plan system.The LDF drives development control decisions, i.e. it is the localauthority’s vision for spatial planning in the area. LDFs comprisea ‘folder’ of documents, and as such documents can bereviewed and refreshed as necessary rather than the wholeplan having to be reviewed to a set timetable. LDFs contain anumber of statutory documents, the main ones being:
• A Local Development Scheme – this sets out whatDevelopment Plan Documents will be developed and when.
• A Statement of Community Involvement – this outlines thelocal authority’s plans for consultation on Development PlanDocuments.
• Development Plan Documents – these set out the localauthority’s planning policies. They take the form of a corestrategy for spatial planning and a proposals map; they canalso include Area Action Plans to detail planning policies forparticular areas. DPDs are the subject of two stages offormal consultation, and an independent examination bythe Planning Inspector.
• Annual monitoring reports – these need to be submitted tocentral Government.
LDFs can also include Supplementary Planning Documents(SPDs), these are optional documents that can set out planningpolicies for areas such as air quality.
Ideally air quality and climate change should be addressedvia a ‘hook’ (short policy statement) in the main core strategy ofthe LDF, with more detailed policy spelt out in a SupplementaryPlanning Document. Many local authorities have used thisapproach to take forward Low Emission Strategies, which aimto reduce emissions of air pollutants and greenhouse gasesfrom development related transport. The Local DevelopmentScheme document provides a timetable to help identify whenrelevant parts of the LDF are scheduled to be created, reviewedor refreshed.
In Wales the equivalent document is known as the LocalDevelopment Plan (LDP). Unlike the LDF in England the LDP isa single development document. The LDP replaced theprevious Unitary Development Plans in Wales in 2004.Compared to UDP, the LDP is smaller and more concise andthere is greater emphasis placed on the sustainability of theplan, mainly through the use of Strategic EnvironmentalAssessment (SEA). The LDP is reviewed every 4 years. Thereis more information about the plans on the Welsh AssemblyGovernment website52.
In Scotland the equivalent document is known as the LocalDevelopment Plan. This is made up of a local development planand supplementary guidance; in the four main cities (Aberdeen,Dundee, Edinburgh and Glasgow) and their surrounding areasa strategic development plan must also be prepared. Everyyear all planning authorities in Scotland produce a developmentplan scheme which sets out the programme for preparing andreviewing their development plans, and what is likely to beinvolved at each stage. An overview of their timetables isavailable on the Scottish Government’s website53.
41
Air Quality and Climate Change: Integrating Policy Within Local Authorities �
Box 18 – Low Emission Strategies and the Local DevelopmentFramework in Mid Devon
In 2005 Mid Devon District Council recognised the importance of arobust policy for air quality and development, and air quality staff beganearly engagement with strategic planning staff as they started to draw upthe Council’s Local Development Framework. This led to the inclusion ofa policy ‘hook’ in the core strategy in 2007, and the adoption of aSupplementary Planning Document in 2008. Mid Devon’s policies use aunique formula to gain developer contributions to fund low emissioninfrastructure. Since 2008 over £1.3 million in developer contributionshas been obtained. The Council is now planning for the introduction ofthe Community Infrastructure Levy, a new system for gainingcontributions from developers, with their draft Allocations andInfrastructure Development Plan Document joining up air quality andclimate change by requiring low emissions strategies and/ orcontributions for major new developments.
52 See - http://wales.gov.uk/topics/planning/devplan/?lang=en53 See - www.scotland.gov.uk/Topics/Built-Environment/planning/National-Planning-Policy/themes/dev-plan/DPtimeline
(EU) Air Quality Directive – A European Directive(2008/50/EC) that sets standards for the concentration ofseveral pollutants in the air that all European member statesmust meet. This is the pre-eminent piece of legislation affectinghow air quality is managed in the UK.
Air Quality Experts Group (AQEG) – A Government advisorybody.
Air Quality Management Area (AQMA) – An area wherelevels of one or more air pollutants breach air quality standards,as designated by the relevant local authority. AQMAs are partof the system of Local Air Quality Management.
(UK) Air Quality Standards – UK objectives for maximumconcentrations of several pollutants in the air – in the mainthese follow the standards imposed by the EU Air QualityDirective. The Scottish Government has also set tougherstandards for several pollutants, which only apply in Scotland.
(UK) Air Quality Strategy – The Air Quality Strategy sets outthe Government’s policies for achieving the Air QualityStandards. Production of an Air Quality Strategy is arequirement of the Environment Act (1995).
Biofuels – Fuels derived from biological material such as plantsor trees. They can be solid, liquid or gaseous fuels.
Biomass – Solid biofuels, such as wood. Biomass is typicallyburnt to provide heat or electricity.
Biomethane – Natural gas (methane) produced by thedecomposition of organic material. Biomethane can beextracted from landfills, or produced using a process known asanaerobic digestion. ‘Raw’ gas from these processes is knownas biogas; once the gas has had impurities removed it is knownas biomethane.
Black carbon – Soot arising from vehicle exhausts, anddomestic and industrial combustion. Black carbon can have asignificant warming effect on the climate, as it reduces theamount of solar radiation reflected from the Earth’s surface.
Carbon dioxide (CO2) – CO2is exhaled by living organisms, as
well as emitted from the combustion of fuels. CO2in the
atmosphere exists in a ‘carbon cycle’ where CO2emitted into
the atmosphere is balanced by processes that remove it,keeping concentrations in the atmosphere roughly steady.Emissions from human activities have upset this balance, andconcentrations in the atmosphere are climbing. As CO
2is a
greenhouse gas, this is causing the Earth’s climate to change.
Clean Air Act – The Clean Air Act dates back to the 1950s,where it was introduced to deal with the problem of coal smokesmogs. It regulates the use of solid fuels and emissions ofsmoke in commercial and domestic premises, and sets anumber of responsibilities on local authorities to act as localregulators. The Act was last updated in 1993. Similar controlsfor Northern Ireland are contained in the Clean Air (NorthernIreland) Order 1981.
Carbon Emissions Reduction Target (CERT) – An obligationon domestic energy supply companies (gas and electricity) toreduce carbon emissions from domestic buildings. Typically
CERT is discharged through subsidised home insulation,appliances and lighting schemes.
Clean Energy Cashback – The Government’s supportpackage for small scale renewable electricity generation.Operators of technologies such as solar photovoltaic and microwind turbines are able to claim payments from energy supplycompanies for the electricity they generate (whether they use iton site or export it into the electricity grid), and also claim extrapayments for electricity exported into the grid.
Climate Change Levy – A levy charged on energy supplied tobusiness users. The levy is not charged on energy suppliedfrom renewable sources, or that supplied by good qualityCombined Heat and Power systems.
Combined Heat and Power (CHP) – Systems that produceboth heat (for space heating or hot water) and electricity. CHPtends to be more efficient than separate heating boilers andelectricity from the grid, as much of the energy consumed bypower stations is wasted as unused heat. Losses incurredduring electricity generation are also reduced if electricity isgenerated near to where it is consumed.
Department of Energy and Climate Change (DECC) – TheGovernment department with responsibility for climate changeand energy policy.
Department for Environment, Food and Rural Affairs(Defra) – the Government department with responsibility for airquality, and also adaptation to climate change.
Environmental Audit Committee (EAC) – A cross party selectcommittee of MPs set up to scrutinise the Government’sperformance against their environmental objectives. The EAChas undertaken several investigations in the areas of air qualityand climate change.
European Limit Values – Limit Values are targets for theconcentration of several pollutants in the air, as set in the EUAirQuality Directive. Limit Values are legally binding – if memberstates do not achieve them they can be subject to legal actionin the European Courts, and ultimately receive fines ranginginto hundreds of millions of pounds.
Eutrophication – An increase in the chemical nutrients in anecosystem leading to increases in ‘primary production’, e.g.photosynthesis. Examples include algal blooms, where largeincreases in the amount of algae in bodies of water depletes thewater of oxygen, harming other organisms such as fish.
Fuel Cell – A device that generates electricity via the chemicalreaction of two substances, for example hydrogen and oxygen.Fuel cells work rather like batteries, although they are re-fuelled(the tank of fuel can be filled up) rather than re-charged.
Great London Smog – The Great London Smog was aseminal air pollution event that took place in the winter of 1952.London had suffered from coal smoke smogs (or ‘pea soupers’)for many years; however in December 1952 climatic conditionsserved to trap the polluted air over the city for several days. Asa result the smog became so thick that people became lost inthe streets, and theatres had to close as the audience could notsee the stage. Tens of thousands of people are thought to have
� Air Quality and Climate Change: Integrating Policy Within Local Authorities
42
Appendix B – Glossary of Terms Used
died due to the smog. As a result political will was galvanised toact on the causes of smog, resulting in the Clean Air Acts whichaimed to reduce the impact of coal smoke pollution.
Greenhouse Gas – Any atmospheric gas that traps heat in theatmosphere. Like the panes of glass in a greenhouse,greenhouse gases allow radiation from the sun to pass through,but trap heat re-radiated from the Earth’s surface.
Hybrid vehicle – Vehicles that use two sources of power topropel them – most commonly an internal combustion enginecoupled with an electric motor and battery. Hybrid vehicles aremore efficient than equivalent conventional diesel and petrolvehicles, and usually have lower emissions of air pollutants too.
Local Air Quality Management (LAQM) – LAQM is the systemunder which local authorities review and assess air quality intheir areas against agreed national standards. Where air qualityis found to be in breach of the standards they must declare anAir Quality Management Area and produce an action plan topursue attainment of the standards.
Low Emission Zone (LEZ) – A designated area where onlyvehicles that meet a certain emission standard (for airpollutants) are allowed to enter.
Merton Rule – Planning rules which state that a certainproportion of a new development’s energy needs must be metby on-site renewable energy generation. Named after theLondon Borough of Merton which was the first to introduce suchconditions.
National Indicator Set – A national set of indicators used bycentral Government to judge the performance of localauthorities (does not apply in Scotland or Northern Ireland)
Nitrogen Dioxide (NO2) – A common air pollutant emitted bycombustion processes, including road vehicles, aircraft anddomestic and industrial combustion. NO2 is a respiratoryirritant, and in strong sunlight is a precursor for ozone formation.
Ozone (O3) – Ground level (tropospheric) ozone is a common
air pollutant, formed by other pollutant gases reacting in strongsunlight. Ozone is relatively long lived and is transported overlong distances by the winds. This factor combined withchemical processes that destroy ozone in polluted urbanenvironments means that ozone levels can actually be highestin rural areas. Ozone is associated with lung disease,exacerbation of conditions such as asthma, and damage tovegetation and crops.
Particulate Filter – A device to filter particles from exhaustgases, commonly found on newer diesel vehicles.
PM10and PM
2.5– Airborne particle pollution, with the number
denoting the appropriate size of the particle in micro-meters.Fine particles are taken deep into the lung’s membrane, andcan even cross over into the bloodstream. Particle pollution isstrongly associated with illness and premature death from heartand lung disease. Common sources of particles include dieselvehicles, solid fuel combustion and vehicle tyre and brake wear.
(Solar) Photovoltaic – Technology that produces electricityfrom sunlight.
WarmFront – A Government funded grant scheme giving freeinsulation and energy efficient heating measures to householdsin receipt of certain benefits. Operates in England only,comparable schemes operate in Northern Ireland, Scotland andWales.
Renewable Heat Incentive (RHI) – A proposed scheme toprovide payments to people producing heat from renewablesources (e.g. biomass, solar, heat pumps). Payments would beprovided based on the amount of heat produced, rather than anupfront grant to cover the costs of installation. The RHI wouldbe the heat equivalent of the Clean Energy Cashbacksavailable for renewable electricity generation.
43
Air Quality and Climate Change: Integrating Policy Within Local Authorities �