nsep fiber optics system study, background report: nuclear
TRANSCRIPT

NTIA Report 87-227NCS Technical Information Bulletin 87-26
NSEP Fiber Optics System Study,Background Report: Nuclear Effects on
Fiber Optic Transmission Systems
Joseph A. Hull
u.s. DEPARTMENT OF COMMERCEC. William Verity, Secretary
Alfred C. Sikes, Assistant Secretaryfor Communications and Information
NATIONAL COMMUNICATIONS SYSTEM
November 1987


PREFACE
This report is submitted in partial completion of a study conducted by theInstitute for Telecorr~unicationSciences (ITS), National Telecommunications andInformation Administration (NTIA), for the Office of the Manager, NationalCommunications System (NCS) , Technology and Standards Office, Washington, DC,under Reimbursable Order 6-10038. Several other reports are submitted as partof this study as listed below.
Peach, David F. (1987), Multitier specification for NSEP enhancementof fiber optic long-distance telecommunication networks:
Volume I:
Volume II:
The Multitier Specification--An ExecutiveSummary
Multitier Specification Background andTechnical Support Information
These two volumes form the primarypublished as NTIA Report 87-226/NCS87-226/NCS TIB 87-25, respectively.
deliverableTIB 87-24
and areand NTIA
to beReport
Ingram, William J. (1987), A program description of FIBRAM: Aradiation attenuation model for optical fibers, NTIAReport 87-2l6/NCS TIB87-22, 120 pp., NTIS Order No. PB 87-230686(report only), NTIS Order No. PB 87-230678 (report and flexibledisk) .
Nesertbergs, Martin (1987), Fiber optic networks and their servicesurvival, NTIA. Report 87-214/NCS TIB 87-9, 121 pp., NTIS Order No.PB 87-l86706/AS.
Englert, Thad J. (1987), Effects of radiation damage in opticalfibers--A tutorial, 55 pp., May, NTIA Contractor Report 87-38, NTISOrder No. PB 87-210308.
This report contains summaries and illustrations from the unclassifiedliterature that should assist telecommunication engineers to gain a neededbackground in nuclear effects on fiber-optic transmission media. The authorwishes to express appreciation to Messrs. David F. Peach, A. Glenn Hanson,Robert T. Adair, and Dr. William A. Kissick at ITS and staff members of theOffice of Technology and Standards at NCS for their review of the manuscriptand encouragement to publish it as a report. Also, he would like to thankDr. Thad J. Englert, University of Wyoming for his review and comments.Special thanks are also due to Mrs. Lenora J. Cahoon and Mrs. Evelyn M. Grayfor their editorial assistance and to Ms. Kathy E. Mayeda for her wordprocessing and final preparation of the report.
iii

I
I
IIII

CONTENTS
LIST OF FIGURES
LIST OF TABLES
Page
vii
ix
ABSTRACT
1. INTRODUCTION
1.1 NCS Mission
1.2 Purpose of Study
1.3 Scope and Purpose of Report
1.4 Problem Context
1.5 Organization of Report
1.6 Background
1.7 NSEP Context for This Study
2. NUCLEAR EXPLOSIONS
3.
4.
2.1 Blast Damage
2.2 Radioactivity
2.3 Gamma Radiation
2.4 Exposure Levels
2.5 Shielding
2.6 Radiation Environment for NSEP Study
2.7 Summary
HIGH ALTITUDE NUCLEAR EXPLOSIONS
3.1 High Altitude Electromagnetic Pulse (HEMP)
3.2 HEMP Effects
3.3 HEMP Levels
3.4 System Evaluation
3.5 Conclusions
PROPERTIES OF OPTICAL WAVEGUIDES
4.1 Material Attenuation
4.2 Material Dispersion
v
1
1
2
2
3
3
4
4
12
16
17
17
19
22
22
24
24
25
27
35
38
39
41
41
42
42

5.
6.
7.
8.
CONTENTS (cont.)
4.3 Glass and Fiber Making
4.4 Single-Mode (SM) Fiber Waveguides
4.5 Experimental Measurements of Radiation Damage
4.6 Recent Unpublished Results
4.7 Conclusions
RADIATION EFFECTS ON FIBER OPTIC SYSTEMS
5.1 Terrestrial Background Radiation
5.2 Fiber Measurements (Low Dose Rates)
5.3 Radioactive Contamination from Nuclear Explosions
5.4 Protection Factors from Gamma Radiation
5.5 Some Estimates of Environment
5.6 System Degradation
FUTURE FIBER OPTIC SYSTEMS
6.1 Next Generation Systems
6.2 Coherent Systems
6.3 Coherent System Implementation
6.4 Long Wavelength Optical Fibers
REFERENCES
BIBLIOGRAPHY
vi
Page
46
52
56
65
70
72
72
72
73
78
78
83
84
85
88
91
100
100
103

LIST OF FIGURES
Page
Figure 1. Peak blast overpressure (psi) at the ground for variousdistances from ground zero versus height of burst (afterG1asstone and Dolan, 1977).
18
Figure 2.
Figure 3.
Figure 4.
Figure 5.
Figure 6.
Figure 7.
Figure 8.
Figure 9.
Figure 10.
Figure 11.
Figure 12.
Figure 13.
Figure 14.
Figure 15.
Figure 16.
Figure 17.
Origin and nature of the EMP (after G1asstone and Dolan, 281977) .
EMP ground coverage for high-altitude bursts at 100, 300, 30and 500 krn.
Electric field contours at the Earth's surface from a 31high-altitude nuclear detonation.
Generalized high-altitude EMP electric and magnetic field 32time waveform.
High-altitude EMP spectrum and normalized energy density 33spectrum.
Current unclassified HEMP waveform (Dittmer et a1., 1986). 34
Refractive index of Si02 with different dopants (after 43Mah1ke and Gossing, 1987).
Representation of loss components in a Ge-doped, single-mode 44fiber as a function of wavelength (after Baack, 1985).
Material dispersion of pure and doped silica versus 45wavelength (after Baack, 1985).
Crystalline (a) and glassy (b) silica structures. 47
CVD glass preform fabrication (after Personick, 1985). 48
MCVD glass preform fabrication (after Personick, 1985). 50
VAD glass preform fabrication (after Personick, 1985). 51
Schematic representation of a step-index optical waveguide 53(after Baack, 1985).
Recovery of the induced attenuation in Ge-doped silica 59core fiber.
Recovery of the induced attenuation in Ge-doped silica core 60fiber with a P-F-doped cladding.
vii

LIST OF FIGURES (cont.)
Page
Figure 18. Recovery of the induced attenuation in Ge-doped silica core 61fiber (radiation hardened).
Figure 19a. Growth of radiation-induced attenuation in single-mode fibers. 63
Figure 19b. Growth of radiation-induced attenuation in single-mode fibers 64(no P-dopants).
Figure 20. Recovery of radiation-induced attenuation in single-mode 66fibers.
Figure 21.
Figure 22.
Figure 23.
Figure 24a.
Recovery of single-mode optical fibers. 67
Recovery of single-mode optical fibers. 68
Recovery of single-mode optical fiber. 69
Dependence of dose rate from early fallout upon time after 75explosion (after Glasstone and Dolan, 1977).
Figure 24b.
Figure 25.
Figure 26.
Figure 27.
Figure 28.
Figure 29.
Figure 30.
Figure 31.
Figure 32.
Figure 33.
Dependence of dose rate from early fallout upon time afterexplosion - continued (after Glasstone and Dolan, 1977).
Curve for ~alculating accumulated total dose from earlyfallout at various times after explosion.
Dose rates above an ideal plane from gamma rays of variousenergies.
Typical free-field nuclear fallout radiation environment(after Warren et al., 1985).
Five generations of fiber optic systems (after Keiser,1985).
A coherent fiber optic communication system.
Improvements in receiver sensitivity for various coherentmodulation/detection schemes.,
Minimum detectable power required to achieve aBER of10- 9 versus data rate.
Optical heterodyne receiver.
Optical homodyne receiver.
viii
76
77
81
82
86
89
92
93
96
98

LIST OF TABLES
Page
Table 1. Planned Lightwave Installations for the United States 7
Table 2. Radiation Sources and Approximate Energies 21
Table 3. Summary of Relationship Between Exposure and Level of Radiation 23Sickness
Table 4. Gamma-Ray, Mass-Absorption Coefficients for Various Materials 24Used in Shielding
Table 5. Areal Impacts of Nuclear Weapons Effects 26
Table 6. Typical Vulnerability of Electronic Components 37
Table 7. Added Span Loss for 30-km Span, 20-Year Exposure 73
Table 8. Fallout Gamma-Ray Dose Transmission Factors for Various 79Structures
Table 9. Minimum Detectable Peak Power Level in Photons per Bit for a 9710- 9 Error Rate
ix


NSEP FIBER OPTICS SYSTEM STUDY, BACKGROUND REPORT:NUCLEAR EFFECTS ON FIBER OPTIC TRANSMISSION SYSTEMS
*Joseph A. Hull
The National Communications System (NCS) is responsible fordefining reasonable enhancements that could be applied to commercialcommon carrier (or carriers/-carrier) fiber optic systems that willbe leased or owned by government agencies and which may be used forNational Security/Emergency Preparedness (NSEP) purposes. Thisreport provides background excerpted from many references used in thedevelopment of a mu1titier specification that identifies five levelsof enhancement. (The mu1titier specification is presented in aseparate report.) This report describes the nuclear environment forsurface and in-atmosphere bursts outside of the blast region, wherebuildings and personnel would be expected to survive. In thisenvironment, the vulnerability of optical fiber waveguides to falloutradiation is a primary concern. An assessment of fiber darkening,based on a review of unclassified literature, is presented. For exoatmospheric nuclear bursts, the fiber optic system is exposed to HighAltitude Electromagnetic Pulse (HEMP) radiation. Unclassified levelsof these nuclear effects have been obtained from publishedliterature. The characteristics of future generations of opticalfiber systems, as described in current literature, are outlined.
Key words: common carrier optical fiber systems; fiber optic systems; gammaradiation darkening; National Security/Emergency Preparedness;nuclear effects
1. INTRODUCTION
This report provides an introduction to the technical background needed to
understand the rationale behind the mu1titier specification. It is submitted
by the Institute for Telecommunication Sciences (ITS) to the National
Communications System (NCS) , Office of Technology and Standards, in partial
fulfillment of Reimbursable Order Number 6-10038. The primary output of this
study is a mu1titier specification for NSEP-enhancing features required of
commercial fiber optic transmission systems using rights -of -way .(ROW) owned or
controlled by the Federal Government.
*The author is with the Institute for Telecommunication Sciences, NationalTelecommunications and Information Administration, U.S. Department of Commerce,Boulder, CO 80303-3328.

1.1 NCS Mission
Executive Order 12472 defines the National Communications System's mission
(in part) as "The coordination of the planning for, and provision of, NSEP
communications for the Federal government under all circumstances, including
crisis or emergency." Key responsibilities of the NCS are to: (1) seek
development of a national telecommunications infrastructure that is survivable,
responsive to NSEP needs of the President and the Federal Government, capable
of satisfying priority telecommunications, and consistent with other National
policies; (2) serve as a focal point for joint industry-Government NSEP
telecommunications planning; and (3) establish a j oint Industry-Government
National Coordinating Center. This study is to support the National Security
Telecommunications policy as enunciated in NSDD-97 ... "the national
telecommunications infrastructure must possess the functional characteristics
of connectivity, redundancy, interoperability, restorability, and hardness
necessary to provide a range of telecommunication services to support essential
national leadership requirements."
1.2 Purpose of Study
The primary purpose of the work is to prepare a multitier specification
identifying prudent measures that could be incorporated in the design of
commercial, intercity, fiber optic transmission systems to make them more
responsive to NSEP requirements in exchange for rights-of-way concessions by
the Government. The specification has been structured in such a way that it
can also be used as a "report card type" instrument for assessing the degree to
which present and future intercity fiber optic systems not using Federally
controlled rights-of-way measure up from an NSEP standpoint. The spectrum of
situations that the fiber optic systems must cope with from an NSEP standpoint
include natural disasters (e.g., floods, earthquakes, fire); local acts of
sabotage; and nuclear attacks [i. e., nuclear radiation and electromagnetic
pulse (EMP) effects]. The design parameters addressed by the specification are
those that tend to minimize interruptions of service in the face of these
hazards by proper attention to features which facilitate quick restoral of
operation or bridging around damaged terminals or repeaters.
2

1.3 Scope and Purpose of Report
The multi tier specification concentrates on the engineering and
installation aspects of optical communication common-carrier-type systems and
recommends those additional practices or alternatives that result in higher
probability of survival or restora1 in a broad range of NSEP environments. The
rating approach is a five-level, mu1titier, rank-ordered specification.
This report is intended to provide background information and references
needed to understand the rationale and basis for the NSEP enhancements. The
enhancements represent a progression of hardening steps considered feasible and
desirable to be added to commercial common-carrier installations. The
mu1titier specification is intended to be a living instrument that will grow
and improve as feedback from the common carrier industry is obtained and as
more complete assessment of the NSEP environments and enhancements are reached.
This report is not intended to be comprehensive or definitive, but rather a
record of the literature, references, and considerations that ~re found useful
in guiding .the work. The figures and graphics of this report are sketches
drawn on a computer and are intended to convey concepts and relative values.
Readers should consult the references for actual data plots, where applicable.
The work has been based entirely_on unclassified literature and information.
1.4 Problem Context
Although the nature and level of communication support required to
accomplish the NSEP mission varies widely with the nature of the emergency, two
broad categories of missions may be defined. They are:
(1) Time-Critical Missions
o Continuous communication capability is essential(communications restored "too late" are of little value).
o Specific user pairs must be linked.
(2) Nontime-Critica1 Missions
o Minute-to-minute continuity of communicationsessential (restora1 delay is acceptable).
is not
o An increasing number of specific user pairs must be linkedas time evolves after the stress event but the criticalityof each specific call is slowly decreasing as a function oftime.
3

Missions in the first category include those that are primarily military
in nature as well as emergencies that arise from natural-disaster or man-made
events. Those events that are military in nature are best addressed by the
development of survivable, mission-specific, dedicated networks. Missions in
the second category include nonmilitary Government functions as well as
military functions, and are best addressed through the gradual enhancement and
integration of Federal and commercial common-user networks. It is this latter
category of enhancement and integration of Federal and commercial common-user
networks to which the results of this study are expected to apply. Arbitrary
times of restora1 have been assumed for various scenarios addressed in this
study. A recovery time of 10 min has been suggested. This time requires that
the system generally will automatically recover and no human intervention
(except perhaps for initiating a recovery cycle) is assumed. Restora1 via the
replacement of components or subsystems is not assumed. For example, a
recovery time of the order of 10 min- following a gamma radiation dose
sufficient to disrupt the system due to induced attenuation would meet the
requirements of networks to support restora1 following a nuclear event. This
nuclear event could be the result of an accident or an act of sabotage, and not
necessarily a limited nuclear war.
1.5 Organization of Report
The remainder of this section will provide background information leading
up to the divestiture and some implications of the divestiture, some definition
of NSEP, and the attributes of systems required to meet NSEP requirements.
Section 2 describes the environment associated with nuclear explosions with
emphasis on gamma radiation. Section 3 discusses high-altitude nuclear
explosions and the electromagnetic pulse produced by such nuclear events.
Section 4 looks at the properties of optical waveguides and their response to
gamma radiation. Section 5 addresses some aspects of future fiber optic
systems. Section 6 provides some background on the radiation effects on fiber
optic systems.
1.6 Background
In order to appreciate the complexity of the regulatory and policy
environment in which the output of this study will be used, the following
background information may be helpful.
4

1.6.1 Communications Historical Perspective
In 1934, the Communications Act created the Federal Communications
Commission. Part of the purpose of the Commission was to regulate
telecommunications "in the public interest" - - a phrase that apparently has no
legal definition that can be cited as a yardstick (Bell, 1985). One of the
FCC's missions was, in the words of the 1934 act, "to make available, so far as
is possible, to all the people of the United States, a rapid, efficient,
nationwide, and worldwide wire and radio communication service with adequate
facilities at reasonable charges." AT&T was established as a monopoly to
provide this "universal service at a reasonable rate." As a monopoly, AT&T was
able to cross-subsidize between long-distance and local rates to minimize the
cost of less-utilized portions of the network. Because the company could rely
on its manufacturing expertise provided by Western Electric, it could assure
uniform quality in all equipment.
In 1949, the Justice Department filed a major antitrust suit against both
AT&T and Western Electric. The accusation was the restraint of trade in the
manufacture, distribution, sale, and installation of all forms of telephone
apparatus in violation of the Sherman Antitrust Act. The result of this suit
was a 1956 out-of-court consent decree that allowed the Bell System to remain
intact on condition that it restrict its business to common-carrier
communication services subject to regulation.. Western Electric was barred from
manufacturing equipment other than the type used by the Bell System. AT&T,
Western Electric, and Bell Laboratories were required to license their patents
to all app1icants--both domestic and foreign--upon payment of reasonable
royalties. During the 1970's the Bell System and its allies pressed Congress
for a new telecommunications policy bill that would update the 1934
Communications Act. The company wanted affirmation of the premise of universal
service as a natural monopoly and the Bell System as the regulated quasi
utility to fulfill that service. During this period, several competitors
(notably MCI) sued the Bell System for unfair anticompetitive practices under
the Sherman Antitrust Act.
The advance of technology during the 1960 and 1970 decades made the 1956
consent decree highly constraining to the world's largest company. AT&T
recognized the coming of an Information Age brought about by the marriage of
computers and telecommunications. Consequently there was much effort to remove
5

the restrictions of this decree to permit competition in the evolution of the
information explosion.
In 1980, the FCC handed down a ruling, called the Second Computer Inquiry
Decision. It did three things:
o It distinguished between basic transmission services,traditionally provided by common carriers, and enhanced networkservices such as those incorporating data processing.
o It found that enhanced services and customer premises equipmentwould not be reg':llated as common-carrier offerings, whereasbasic services should be so regulated.
o It concluded that AT&T should be allowed to sell equipment andenhanced services, but only through a separate subsidiary.
This Computer II decision opened the way for an explosion of new
telecommunication products and services both by new suppliers and AT&T.
In 1974, the Justice Department brought an antitrust suit against AT&T,
Western Electric, Bell Telephone Laboratories, and the 22 Bell Operating
Companies again under the Sherman Antitrust Act. The Justice Department
alleged that AT&T monopolized the long-distance telephone business by
exploiting its control of the local telephone companies to restrict competition
from other telecommunication systems and carriers by denying interconnection
with the local phone service and that AT&T restricted competition from other
manufacturers and suppliers of customer-premises equipment. The relief sought
was not punishment for past deeds, but a cure that would prevent continued
future violations. This suit was settled in 1982 through what is known as the
Modification of Final Judgment (MFJ) (of the 1956 Consent Decree). This MFJ
brought about the divestiture of the 22 Bell Operating Companies and a major
reorganization of the remaining Bell System and the removal of the restrictions
of the 1956 Consent Decree. The divestiture took place on January 1, 1984.
One major result of the divestiture is the competitive installation of
long-haul, fiber optic, common carrier systems. The technology for these
systems has matured extremely rapidly under the competitive environment.
By April 1985, 12 companies had announced (Galuszka, 1985) plans for
long-distance lightwave communication systems in the United States (See
Table 1). In many cases, these common carrier or carrier 's - carrier sys terns
will utilize ROWs of a few main trunk railways. There are more than 7 billion
circuit miles of transmission capacity indicated here over a distance of 65,650
route miles. By the year 2000, it is forecast (Dixon, 1985) that worldwide
6

Table 1. Planned Lightwave Installations for the United States(After Ga1uszka, 1985)
LIGHTWAVE PlANS
Company Investment Areas CircuitMiles
RouteMiles/Date
UnitedTelecommunications
AT&T Communications
$2.0 B
1.3B
National
National
1.2 B
1.7B
23
10
K/1988
K/1988
Fibertrak (Sante Fe,Southern Pacific,Norfolk Southern)
MCI Communications
GTE Sprint
Lightnet (CSX andSNET)
LDX Net (KansasCity SouthIndustries)
SOUTHERNET(E.F. Hutton et a1.)
RCI
Microte1 (A11te1,E.F. Hutton, Cente1,Norfolk Southern)
Lite1 Telecommunications (Cente1,A11tel, and Pire11i)
Electra Communications
1.2B
450 M
130M
500 M
110M
90 M
90 M
60 M
57 M
40 M
National
National
National
Regional(East of
Miss. River)
Regional(South/Midwest)
Regional(Southeast)
Regional(Northeast,
Midwest)
Regional(F1orida/Georgia)
Regional(Midwest)
Texas
2.4 B
550 M
110M
650 M
165 M
50 M
87 M
45 M
85 M
12M
8.1 K/1988
8.0 K/1988
4.0 K/1989
4.0 K/1986
1.7 K/1986
1.6 K/1986
.9 K/1986
1. 5 K/1986
1. 3 K/1986
.55K/1986
(Source: The Hudson Institute)
7

fiber optic transmission capacity will be about 200 billion circuit miles. All
other transmission media combined will provide an additional 50 billion circuit
miles. These trends indicate that fiber optic transmission media will be the
dominant means of connecting nodes of the public switched telephone and data
networks in the United States. The opportunity exists to plan for lightwave
systems that assure the availability of emergency communications capacity
through engineering design and implementation practices.
1.6.2 NSEP Historical Perspective
Ten years ago, before AT&T installed a new long-distance system, it asked
the Department of Defense (DOD) what route it should take. Defense officials
looked over their highly classified II 1aydown" maps, showing the expected
targets of a Soviet nuclear strike, and told AT&T which route was most
survivab1e--that is, which was farthest from targets. The company then used
that path, folding any extra cost into its rate base (Horgan, 1985).
Today, commercial carriers--MCI and GTE, as well as AT&T Communications-
might still ask the Government which routes it considers most survivable, and
all other factors being equal, a carrier might use the more survivable route.
But no company is likely to pay extra for it. If the Government wants a more
expensive route used, the Government must pay for it.
This is just one example of how the relationship between the
telecommunications industry and the U.S. Government has changed since the Bell
System breakup on January 1, 1984 (divestiture). Change has been particularly
profound for those agencies responsible for National Security/Emergency
Preparedness (NSEP). These agencies include both military and intelligence
groups and civil organizations like the Federal Emergency Management Agency;
they are charged with helping the country cope with crises, from floods to
nuclear war.
Government and industry have moved to offset the potentially adverse
effects of the divestiture. Eventually, the diversity of carriers should make
the Nation's total network more robust than ever, and the growth of competition
should provide the Government with less expensive, better service.
Divestiture involved a collision between one profound republican
commitment--deregu1ation--and another--defense. The Administration has sought
to increase the "readiness" not only of military command and control systems
but of the entire communications infrastructure of the United States as well.
8

In a directive, National Security Telecommunications Policy, (issued on
June 13, 1983), the entire U.S. telecommunications infrastructure, including
commercial and private networks as well as Government systems, was declared to
be "a crucial element of U.S. deterrence." This document reflects a shift away
from the policy of mutual assured destruction (in which each side assumes that
the other will answer a first strike with massive retaliation that will leave
both countries completely destroyed) to a concept of flexible response. This
concept suggests that nuclear weapons can be used to defeat the enemy in
various ways short of an all-out attack. A strategy geared toward mutual
assured destruction requires only a minima1--a1though extremely reliable-
command and control system for sensing an attack and launching missiles in
response. In contrast, flexible response assumes that a nuclear war may be a
prolonged and complex affair; hence the need for extensive, redundant
communications that only industry can provide.
In January 1983, the FCC handed down the Computer II ruling. This ruling
forced AT&T to form a wholly independent subsidiary, AT&T Information Systems,
for selling and servicing equipment such as private branch exchanges and
computerized telephones. The AT&T-IS personnel were severely restricted in hpw
they worked with other personnel in AT&T who sold transmission services.
(Divestiture constrains the local operating companies in a similar way in their
sales of customer premises equipment.) Computer II thus prevents the DOD's
This leads to administrative nightmares under emergency
primary contractor, AT&T, from packaging, selling, and servicing a complete
system of equipment and transmission service from one end of a circuit to the
other. (For example, 10 or more vendors--a11 low bidders--may provide parts of
a single link.
conditions.)
The FCC did grant the Government some important concessions for NSEP
purposes. The Commission agreed that 21 Government communication systems were
so critical to NSEP that AT&T could retain control over them from end to end.
Most of these systems involve services and equipment from several vendors, but
all are managed by AT&T. These systems include
o White House's Echo Fox Radio System (which links the Presidentto his military commanders while he is airborne),
o Defense Department's Minuteman (a combinationmobile radio system that connects key militarythe strategic command and control structure evenin transit),
9
land-line andpersonnel withwhile they are
o Strategic Air Command's Primary Alerting System (which connectsthe commander of the Strategic Air Command with bombers andmissile silos),
o Automatic Secure Voice Communications Network (which providesDOD personnel with encrypted voice communication),
o Federal Emergency Management Agency's Emergency BroadcastNetwork (which allows the President to address the country overcommercial radio stations during crises),
o Air Force Digital Graphics System, (which distributes weathermaps to U.S. armed forces worldwide), and
o Nuclear Regulatory Commission's Emergency Notification System,(through which operators of nuclear power plants notify thecommission of accidents).
As a concession to the needs of national security, Judge Greene's
Modification of Final Judgment states that: "The Bell Operating Companies
shall provide, through a centralized organization, a single point of contact
for coprdination of Bell Operating Companies to meet the requirements of
national security and emergency preparedness." This ruling resulted in the
creation of a special branch of Bell Communications Research, Inc. (Bellcore)
devoted to helping the Government get fast service from operating companies in
NSEP situations. The Bellcore NSEP group is also a single point of contact for
other carriers trying to fulfill emergency requests from the Government.
Some of the most important work done to counter the effects of the AT&T
breakup on security emerged from the voluntary efforts of industry--in
particular, from a group of industry executives called the National Security
Telecommunications Advisory Committee (NSTAC). This group was formed under
Executive Order 12382 in September 1982. The committee consists of the chief
executive officers of 27 of the largest telecommunication companies in the
United States. The first problem to be addressed by this committee was the
need for a single point of contact representing not only the operating
companies but all local and long-distance carriers. The NSTAC created (early
in 1984) the National Coordinating Center (NCC) to be located at the Defense
Communications Agency headquarters in Arlington, VA. The Coordinating Center's
most critical mission is to provide Government agencies with instant access-
24 hours a day, 7 days a week--to industry for emergency communications needs
that cannot be filled through normal business procedures. Representatives from
numerous Government agencies are assigned to the Center's offices. The NCC is
10

a private-sector extension of the National Communications System (NCS). The
NCS is an organization of representatives of 22 Government agencies with
security and emergency missions. The NCS helps these agencies coordinate their
telecommunication policies (standards) and plans. Many of these plans involve
the use of commercial communications. The NCC advises the NCS as they devise
plans and policies that involve private-sector communications.
NSEP Requirements
According to the NCC procedures manual, the coordinating center is charged
with supporting any telecommunication services used
"to maintain a state of readiness or to respond to and manage anyevent or crisis (local, national, or international) which causes orcould cause injury or harm to the population, damage to or loss ofproperty, or degrades or threatens the national security emergencypreparedness posture of the United States."
A disaster or emergency declared by the President is automatically a
national security/emergency preparedness situation. The procedures can also be
invoked by various other officials, including Lieutenant General Winston
Powers, director of both the NCS and the Defense Communications Agency (DCA),
as well as at least one official from each Government agency belonging to the
National Communications System.
The ultimate Presidential emergency would involve an invocation of war
powers. Section 706 of the 1934 Communications Act, in particular, allows the
President to commandeer the communications industry during a crisis that he
believes threatens the sovereignty of the Nation.
NSTAC Concerns
The following are maj or subj ects of discussion in the subgroups of the
National Security Telecommunications Advisory Committee:
o the promotion of links between different networks and ofstandards to make them interoperable,
o the use of materials resistant to electromagnetic pulses,
o the creation of backup power sources for circuits and terminalequipment, and
o the standardization of procedures for restoring networks after adisaster.
11

Debate may also center on the degree to which solutions should be
implemented. For example, should there be an effort to make commercial
networks truly survivable, perhaps by burying switches and circuits and/or
using EMP-resistant materials?
Cost is the final determinant. Inevitably conflicts arise between the
Government's concern for national security and the commercial carriers'
financial considerations. According to the participants, there is much pushing
and pulling each way: the Government tries to convince industry that much of
what it wants to increase national security would enhance the companies'
competitive position; conversely, the companies try to get the Government to
pay for programs that they would implement anyway for commercial reasons.
NCS Initiative
One proposal for resolving this cost element is that of bartering. The
NCS-sponsored program, for which this report serves as background; was
developed on the basis of offering interstate rights-of-way for fiber optic
common carrier installation in exchange for the carriers' agreement to install
the system in accordance with the multitier specification developed here.
1.7 NSEP Context for This Study
Mr. Benham E. Morriss, Deputy Manager of NCS, described the NCS
responsibilities i for NSEP communications (Morriss, 1985). This paper, along
with other personal communications with the NCS staff has been used to develop
the context for this study as described below.
1.7.1 NCS Assets and Authorities
The 22 Federal organizations that make up the member agencies of NCS
collectively own or lease the bulk of the telecommunication resources of the
Federal Government. These networks and systems support a variety of
organization-specific missions in their normal day-to-day use. The context in
which these networks and systems become a viable means for satisfying national
level NSEP needs, however, is largely dependent on three factors--the types of
services required by the users; the set of networks and systems from which
possible approaches to the provision of NSEP services can be fashioned; and the
major settings, or scenarios, under which services must by provided.
12
It is

primarily within the boundaries offered by these factors that potential NSEP
uses for a network, system, or technology must be measured.
By virtue of Executive Order 12472, it is the mission of NCS to assist the
President, the National Security Council, the Director of the Office of Science
and Technology Policy, and the Director of the Office of Management and Budget
in the execution of their national security emergency preparedness
telecommunication functions, and in the coordination of planning for and
provisioning of NSEP communications for the Federal Government under all
circumstances. The NCS also is charged by the Executive Order to seek to
ensure that a national telecommunication infrastructure is developed that
satisfies priority telecommunication requirements under all circumstances,
using all existing telecommunication resources, regardless of character or
ownership. The legal mandate of E. O. 12472, and the policy guidance of
National Security Decision Directive 97 compel NCS to use, improve, and expand
the Government's capabilities to assimilate technology in the most fruitful and
cost effective manner possible for the purpose of ensuring a flexible,
survivable, and enduring national telecommunication capability.
1.7.2 NSEP Services
NSEP telecommunication services are defined as those services that are
used to maintain a state of readiness or to respond to and manage any event or
crisis--local, national, or international--which causes, or could cause, injury
or harm to the population, damage to or loss of property, or which degrades or
threatens the National Security Emergency Preparedness posture of the United
States. Two specific categories of telecommunication services are defined:
"Emergency NSEP Telecommunication Services" and "Essential Telecommunication
Services. It The first category includes those that are so important as to be
needed as soon as possible, without regard to cost (e.g., support services for
Federal Government activities in response to a Presidentially declared disaster
or emergency or service requirements critical to the protection of life and
property, or to maintain national security under stressed circumstances). The
second category includes services that are important and must be provided by
the "service-due" date, but which do not necessarily require around-the-clock
emergency response by a carrier (e.g., services assigned, or eligible for, an
NCS/FCC-approved restoration priority; the minimum essential services necessary
to carry out military and civilian exercises; and services that are specially
13

provided in support of the Foreign Intelligence Surveillance Act, the President
or Vice President, or the conduct of foreign affairs).
1.7.3 NSEP Attributes
Both NSDD-97 and E.O. 12472 specify that the use of all Government,
commercial, and private resources must by considered for their potential
contributions to NSEP. The ability to include assets of both the public and
private sectors is, in fact, seen as an essential element of United States
deterrent capability and emergency preparedness. By virtue of the Government's
current reliance on commercial systems, it is appropriate that the technologies
of those systems be examined for compliance with NSEP requirements. Guidance
for performing such analyses is contained in NSDD-97 and E.O. 12472 in the form
of policy principles and objectives. Seven system attributes are defined:
o hardness
o restorability
o security
o connectivity
o redundancy
o interoperability
o mobility
These seven terms reflect the characteristics of communication systems
that are desirable for NSEP purposes. These seven attributes in combination
reflect the necessary component characteristics of a survivable and endurable
communication system. Evaluations of candidate networks, systems, or
technologies for supporting NSEP communications should be based on the degree
to which these attributes are present.
1.7.4 Implications for Fiber Optic Systems
In terms of hardness, fiber optic system survivability can be
significantly extended by following the recommendations of the current study.
In terms of restorability, fiber optic systems offer unique capabilities
for automatic restoration when configured in networks (Nesenbergs, 1987).
In terms of security, fiber optic services are inherently well sui ted to
deny access to transmission content by an enemy and are free from the effects
of electromagnetic interference.
In terms of connectivity, present fiber optic long haul systems are
concentrated along railway rights-of-way. The rapid introduction of intra-LATA
fiber optic systems along with judicious planning of interconnecting links
14

could add significantly to this capability. [Note: LATA is an acronym for
Local Access and Transport Area (GSA, 1986).] The concept of this program is
to make judicious choices of needed linkages and to utilize interstate highway
rights-of-way as means of interconnecting population centers. These rights-of
way provide highly redundant paths among these population centers.
Redundancy is an attribute conveying the duplicity of routes, paths, or
even equipment types that may be employed in a network or system. As a result,
redundancy measures tend to be highly dependen1: on network topologies and site
specific installation procedures , and these measures are more reflective of
system rather than component attributes.
Interoperability among the types of systems being installed by the
competing networks is a subject being actively addressed in the T1Xl.2
standards committee (document is· in rough draft as of this writing). The
objective here is to create an optical cross-connect interface (DS3-level).
[Note: DS3-level denotes a multiplex level in a digital multiplex hierarchy
that operates at a T-carrier rate of about 45 Mb/s (GSA, 1986).] From an
operational perspective, wide variations in network management, transmission
record formats, and communications protocols make system interoperability
difficult.
The attribute of mobility is not specifically applicable to fiber optic
systems. Ubiquity of fiber optic systems may be a more achievable attribute.
If, indeed, fiber optic transmission media replaces copper and microwave media
in the way that solid state components replaced vacuum tubes, then one can
expect to see much more NSEP reliance on the fixed telecommunications plant.
1.7.5 NSEP Environments
Four environments of NSEP telecommunications are considered:
o peacetime natural disasters
o crisis management
o limited conventional war
o nuclear war
Each of these presents special concerns to providers of NSEP communications
services.
In peacetime natural disasters, communications requirements are
characterized by sporadic or localized service disruptions due to the effects
15

of the disaster. This requires restoration of lost connectivity by mending the
"holes" in the network, so that emergency aid and rescue activities can be
supplied to the affected area.
Crisis management situations include international incidents such as the
hij acking of the Achille Lauro, domestic incidents such as the accident at
Three Mile Island, and third-party military actions that may result in
heightened tensions at home or abroad. In these situations ,fast , reliable,
secure communications are essential for crisis management, averting
hostilities, and relaxing tensions.
In limited conventional war, communications are required to support troop
and equipment deployments and for battle management. In this situation,
communications may be required where no residual capabilities exist. Thus
required for managingissystemsinteroperabili ty wi th commercial
support/sustaining activities.
In nuclear war as considered here, several stages of requirements are
suggested to reflect the extent of damage sustained and the nature of the
attack. Until the point of exchange, communications needs and the
communications environment are considered to be the same as in crisis. After
an exchange, however, fixed-plant communications will be damaged or destroyed.
In the extreme, the communications infrastructure will be highly fragmented.
In this case, regenerative approaches to providing communications must be
pursued; the emphasis will be on restoration and use of any and all
communications.
2. NUCLEAR EXPLOSIONS
Fiber optic transmission systems are vulnerable to both gamma-ray
radiation and to the electromagnetic pulse (EMP) generated by nuclear
explosions. For purposes of this study, it is necessary to define environments
for those transmission systems that can be protected. No attempt is made to
define harsh environments in nuclear reactors or underground testing
facilities. Rather, the approach has been to look at those areas where
personnel, buildings, and equipments will generally survive the nuclear
explosion.
One measure of the destructive power of a nuclear explosion is the peak
overpressure it creates at various distances from the hypocenter. The peak
overpressure in the shock wave is the maximum increase of static air pressure
16

over ambient atmospheric pressure. The overpressure is usually measured in
pounds per square inch (psi). Figure 1 (Pittock et al., 1986) illustrates the
peak overpressure produced by a I-Megaton (Mt) detonation as a function of
distance from ground zero and height-of-burst (HOB). For a given overpressure,
there is generally an optimum HOB to maximize the range for that overpressure.
However, very close to the explosion, nearly identical peak overpressures can
be achieved from bursts at the surface and up to a moderate height above the
surface.
2.1 Blast Damage
All structures are vulnerable to nuclear blast. Residential wood- frame
houses (with wood or brick exteriors) suffer substantial damage at 2 psi peak
overpressure, and are crushed at 5 psi. Glass windows are shattered at 0.5 to
1.0 psi. Concrete and steel buildings are broken apart at 10 to 15 psi
(although the interiors and facades are destroyed at much lower overpressures).
Flying debris is a major cause of damage in a nuclear explosion. People
are particularly vulnerable to flying obj ects. For example, while the human
body can withstand substantial static overpressures (greater than 10 psi is
required to produce severe injuries), serious wounds due to flying glass and
rubble can occur at 1. to 2 psi.
Blast damage also leads to secondary fire ignition. These secondary fires
can occur anywhere within the perimeter of the 2 psi zone.
Based on the above description of blast damage effects, it seems
reasonable to consider fiber optic communication system survivability and
applicable NSEP-enhancement outside the 2 psi zone of nuclear explosions. This
is consistent with the expectation that buildings and personnel will remain
intact.
2.2 Radioactivity
In a nuclear detonation, several types of energetic ionizing radiation are
produced:
1. prompt (fast) neutrons that escape during fission and fusionreactions
2. prompt gamma rays created by fission/fusion processes, includingneutron capture and inelastic scattering, and by early fissionproduct decay
17

15
1Mt Detonation
".....
E~....... 10......00L:J(D
\t-o
+-I~0)
/1.' 5:r:
oo 5 10 15 20
Distance from Ground Zero (km)
Figure 1. Peak blast overpressure (psi) at the groundfor various distances from ground zero versusheight of burst (after Glasstone and Dolan.1977) .
\
18

3. delayed gamma and beta radiation from induced activity inmaterials bombarded by prompt neutrons
4. delayed gamma and beta radiation emitted through the decay oflong-lived radionuclides (lifetimes greater than minutes)produced by nuclear fission and carried in the bomb residues
For existing nuclear weapons, the prompt radiations do not propagate
beyond a few kilometers because of their strong attenuation over such path-
lengths in air.
fallout debris.
Greater concern centers on the delayed nuclear radiation of
2.3 Gamma Radiation
When a typical fission or fission-driven fusion weapon detonates, several
hundred distinct radionuclides are generated (Glasstone and Dolan, 1977).
These unstable species decay at different rates, emitting gamma rays and beta
particles in the process. Gamma rays are members of the family of photons that
are quantized manifestations of electromagnetic energy. Other members are
x-rays, utlraviolet, visible, and infrared rays. The energy of these photons
is expressed as E = hv = hc/A. Gamma rays travel at the speed of light, are
uncharged, and interact mainly with free electrons or electrons bound to an
atomic system. They may also interact with atomic nuclei.
Depending on their energy, gamma rays interact with matter in three
principal ways (Messenger and Ash, 1986):
(1) At the low-energy extreme for x-rays of the order of a few kiloelectron volts (keV) , their interactions are mainly through thephotoelectric effect. When an x-ray penetrates the usuallyinnermost electron shell structure of an atom, it may give upall its energy, thereby being annihilated. This energy excitesthe atom, causing it to expel one of its innermost shellelectrons, thereby ionizing the atom. The expelled, swiftlymoving electron carries off part of the energy supplied by theannihilated x-ray as kinetic energy. Another electron withinthe atom now essentially de-excites the atom by dropping intothe energy vacancy in the electron shell previously occupied bythe expelled electron. The energy difference of this latterelectron between its old and new state is now expelled from theatom in the form of a photon. This photon has less energy thanthe initial one, so that its wavelength is longer , usually inthe ultraviolet or visible region, depending on the material.This radiated photon is called fluorescence radiation.
(2) For higher energy photons, namely in the preponderant energyregime of those emanating from a nuclear burst, the maininteraction with matter is through the Compton effect. This is
19

simply a collision between an incident photon and an electronthat is free or relatively weakly bound to an atom. In theCompton effect, only part of the photon energy is transferred tothe electron, which even if weakly bound can be propelled out ofthe atom thus ionizing it. In any event, the x-ray photon, as aresult of the scattering (collision) careens off in a newdirection, but with less energy and a longer wavelength than ithad prior to the encounter.
(3). For very high energy photons, in the regime of gamma rays, athird interaction occurs called pair production, or paircreation. If a sufficiently energetic photon finds itself nearan atomic nucleus, it can be spontaneously annihilated. In itsplace instantly appears a fast-moving electron, plus a fastmoving positron. The positron is a particle with all theproperties of an electron, except that its charge is positive.
2.3.1 Energy Levels
The rate of accumulation of radiation dose depends upon the flux of
radiation particles (or photons), the kind of particle, and the energy per
particle (Englert, 1987). The unit of energy most commonly used when dealing
with radiation particles or photons is the electron volt (eV). One electron
volt is the energy acquired by one electronic charge residing in an electric
potential of one volt. The conversion of energy units is easily determined as
follows:
1 eV (electronic charge) x (1 volt)
(1.6 x 10- 19 coulombs x (1 volt)
1.6 x 10⁻¹⁹ joules
Energies of photons and particles found in atomic and nuclear emissions
have a rather wide range. Table 2 gives approximate ranges of energies
expected for various kinds of radiation along with sources and spectral ranges.
The fission radionuc1ides associated with fallout consist mainly of
refractory elements that readily condense on particle surfaces as the fireball
cools. Hence, any dust or debris entrained into the fireball is likely to be
contaminated with radioactivity. The largest debris particles fallout
quickly, while the smallest ones can remain aloft for months or years. The
initial rapid deposition of the radioactive fission debris, or fallout,
represents the most serious threat of delayed radiation.
20

Table 2. Radiation Sources and Approximate Energies(Englert, 1987)
Source Type of Approximate Spectral RangeRadiation Energy Range of Photon
Electron Photon < 1 eV to -103 eV MicrowaveTransition in x-rayAtoms
Nuclear Decay Photon -105 eV - -108 eV Gamma Rays
a-particle -106 eV - -108 eV
,a-particle -105 eV - -108 eV
From Table 2, it would appear necessary to know the distribution of gamma
ray photons in the fallout from a nuclear explosion in order to calculate the
exposure and the protection factors for communication system components (e.g.,
fiber, detectors, lasers, and other circuit components). The average photon
energy of the radionuc1ides found in the fallout from a nuclear explosion is
approximately 0.7 MeV (Glass tone and Dolan, 1977).
2.3.2 Gamma-Ray Sources for Testing
~adioactive isotopes provide substantive amounts of radiation exposure. A
popular isotope is 60Co , which emits two characteristic gamma rays of'l.17 and
1. 33 MeV, with a half-life of approximately 5.3 years. [For a point source
strength of 100 kilo-curies (kCi) , the effective gamma-ray flux is of the order
of 1013 photons per cm2 per second (presumably at about 30 cm from the source).
One curie corresponds to 3.7 x 10¹⁰ disintegrations of the source isotope per
second, each disintegration emitting one or the other of the above two gamma
rays.] In terms of the corresponding dose rate of 4 x 10- 3 rad (air) (1 rad =
0.01 joule/kg absorbed radiation) per second per curie, at about 1 ft from the
above 60Co source, dose rates of 500 to 1000 rad (air) per second can be
obtained. Other sources of gamma rays include operating nuclear reactors,
which provide fission product gamma rays. The average energy of fuel element
gamma rays is about 0.7 MeV. (This indicates that the use of 60Co as a test
source for irradiating optical fiber is a good selection which should provide
average measures of radiation response, i.e., the energy levels of the gamma
rays are slightly higher that the average nuclear fission product gamma rays.)
21

Another radioactive isotope source obtained from fission products whose
parameters are suitable in this context is 137Cs. The energy of gamma rays
from cesium is about 0.66 MeV, with a corresponding half-life of about 30
years.
2.4 Exposure Levels
The standard measure of exposure to radioactivity is the rad, equivalent
to the absorption of 0.01 Joule of ionizing radiation per kilogram of material;
this is equivalent to 100 ergs per gram. (Glasstone and Dolan, 1977). [The rad
is a CGS unit. The international system of units (SI) defines an essentially
MKS unit for absorbed dose called the ~ (GY). One GY is defined as the
deposition of 1 joule per kilogram in the absorbing media. Thus the
equivalence is: one GY = 100 rads (Messenger and Ash, 1986)]. The rem is a
biological dose unit equal to the absorbed energy in rads multiplied by a
"relative biological effectiveness" factor for a specific type of radiation
compared to gamma radiation. The rem for biological tissue located near the
surface of the body corresponds to 88 ergs per gram. For gamma rays, x-rays,
and beta particles, units of rads and rems are approximately equivalent.
The impact of radiation dose also depends on its rate of delivery.
Roughly 450 rads delivered at the surface of the body within a few days' time
(an acute whole-body dose) would be lethal to half the exposed population of
healthy adults; 200 rads would produce radiation sickness but would not by
itself be lethal (Glasstone and Dolan, 1977). Such total exposures spread over
a period of months or years (a chronic dose) would not cause acute effects, but
would eventually contribute to a greater frequency of pathologies such as
leukemia, other cancers, and birth defects. A summary of the personnel hazard
from radiation is given in Table 3.
2.5 Shielding
Gamma rays are removed or annihilated as they pass through matter as
discussed above. This results in a decrease in their intensity or fluence as a
function of distance of penetration, x, into the material. The intensity of
the radiation decreases exponentially with distance assuming that the radiation
is absorbed. This results in the expression
22

I(x) = 1(0) exp [- ~x] (2-1)
where 1(0) is the initial intensity
~ is an attenuation (absorption) ~oefficient.
Table 3. Summary of Relationship Between Exposureand Level of Radiation Sickness*
Exposure Range
o - 50 R (rad)
50 - 200 R (rad)
200 - 450 R (rad)
450 - 600 R (rad)
More than 600 rad
Type of Injury
No observable signsor symptoms
Level I Sickness
Level II Sickness
Level III Sickness
Levels IV & V Sickness
Probable MortalityRate Within 6 mos
of Exposure
None
Less than 5 percent
Less than 50 percent
More than 50 percent
100 percent
*Adapted from National Council on Radiological Protection andMeasurements, Radiological Factor Affecting Decision-Making in aNuclear Attack, Report No. 42, November 1974.
The fact that the attenuation is exponential implies that the percentage,
or fraction, of photons removed from the photon stream is constant. This
fraction is independent of the initial intensity 1(0).
23
Because the incident

Table 4. Gamma-Ray, Mass-Absorption Coefficientsfor Various Materials Used in Shielding
g/cm3Mass-Absorption
Material Density, Coefficient, p, cm- l
1 MeV 3 MeV 6 MeV
Air 0.001294 7.66.10- 5 4.3.10- 5 3.04.10- 5
Clay 2.2 0.130 0.0801 0.0590
Concrete (1 Portlandcement: 3 sand) 2.07 0.133 0.0760 0.0559
Lead 11.34 0.797 0.468 0.505
Steel (1% carbon) 7.83 0.460 0.276 0.234
The thickness of material that attenuates the intensity of radiation to 10
percent of its incident value is often specified for various shielding
materials. This thickness can be calculated for the above materials.
2.6 Radiation Environment for NSEP Study
The assumption of a 2 psi overpressure limit as a boundary for NSEP
restoral of communication systems provides limits on the radiation fields
against which protection is required. Initial nuclear radiation, emitted
within a minute of the nuclear detonation, is insignificant at the 2 psi
overpressure contour (Warren et al., 1985). [Note: This statement is
confirmed by Messenger and Ash (1986) in a table excerpted from Brode (1969).]
Residual radiation emitted later than 1 minute from the instant of a nuclear
detonation reaches the 2 psi overpressure contours in the form of fallout
radiation. This radiation is predominantly gamma radiation.
2.7 Summary
The sequence of physical effects that would accompany the detonation of a
nuclear weapon is thermal irradiation, blast, winds, radioactive fallout
(particularly in the case of surface bursts), and fire growth and spread. In
the explosion of a typical strategic nuclear warhead over a military or
industrial target, the effects of initial nuclear radiation (gamma rays and
fast neutrons) can generally be ignored in regions outside of the 2 -psi
24

overpressure boundary. The nuclear effects occur in more-or-less distinct time
intervals (over most of the area involved) (Glasstone and Dolan, 1977). The
thermal pulse is delivered in the first 1 to 10' seconds. The blast is delayed
by the travel time of the shock wave, and generally follows the thermal pulse;
the positive duration of the blast wave lasts for approximately 1 second.
Afterward, winds blow for several minutes. The most intense and lethal
radioactive fallout occurs during the first hour after a surface detonation.
Although many fires would initially be ignited in the ruins, it could take
several hours for mass fires to develop. In the case of surface bursts, during
the latter period, dense radioactive fallout would continue in areas downwind
of the blast destruction zone.
Estimates of the areas that would be subject to levels of blast
overpressure and radioactive fallout exceeding specific minimum values are
given in Table 5. It can be seen from this table that modern nuclear weapons
(i.e., those having yields less than about 1 Mt) detonated as air bursts would
create moderate to heavy blast damage over an area of approximately 500 km2/Mt
and ignite fires over a similar area. In g,eneral, smaller weapons produce
greater blast and thermal effects per unit energy yield than larger weapons.
The area in which blast overpressures exceed a given value (e.g., 2 psi) scales
approximately as y 2/ 3 , where Y is the yield in megatons (Gla~stone and Dolan,
1977) . The areas of blast and thermal effects for surface bursts are about
one-half the areas for air bursts of the same yield (Glasstone and Dolan,
1977) . Surface bursts also create large local areas of potentially lethal
radioactive fallout. Doses of up to 450 rad in 48 hours are possible over an
area of approximately 1000 km2/Mt in the fallout plumes. Lesser doses occur
over much larger areas.
For this study, the radioactive fallout at the 2-psi overpressure contour
for surface or near-surface bursts will be considered to be the primary threat
to fiber optic systems. It is assumed that buildings and equipment will
survive in this region and there will be need for NSEP communications. For
exoatmospheric bursts, the HEMP will be the threat of concern.
3. HIGH ALTITUDE NUCLEAR EXPLOSIONS
A nuclear explosion above an altitude of 40 km can expose a large area of
the Earth to an intense pulse of electromagnetic radiation. (The nuclear
effects, described in Section 2, of thermal irradiation, blast, winds,
25

Table 5. Areal Impacts of Nuclear Weapons Effectsa
Nuclear Area (km2 ) Area (km2 )Weapon of Blast of 450 radYield Overpressureb Fallout Dosec
(Mt) 5 psi 2 psi 48 h 50 yr
0.1 34 100(14) (40) (100) (200)
0.3 70 200(30) (aO) (300) (600)
0.5 .100 300(42) (115) (500) (1000)
1.0 140 480(65) (180) (1000) (2000)
5.0 415 1410(190) (525) (5000) (10000)
10.0 660 2240(300) (835) (10000) (20000)
a Areas are given in square kilometers for air bursts and surfacebursts (in parentheses). In the case of radioactive fallout,areas are given only for surface bursts (the eariy fallout fromair bursts is negligible, and prompt and long-term radiationeffects are ignored. Within the areas quoted, the magnitudes ofthe nuclear effects are greater than the limiting values shownabove each column. The limiting values apply at the perimetersof the circular contours centered on the explosion hypocenterwhich define the area of each effect.
b For air bursts, the optimum explosion height has been chosen tomaximize the area subject to the overpressure indicated.Areas are given only for surface bursts. No protection orshielding from fallout radiation is assumed. A fission yieldfraction of 0.5 is adopted. A dose reduction factor of 0.7 isalso applied for surface "roughness." The area in which anacute 48-hour whole-body dose of greater than 450 rad could bereceived is estimated f~om standard fallout patterns (Glasstoneand Dolan, 1977).
c The area in which a long-term integrated total dose of more than450 rad could result is also calculated from local falloutpatterns. Cumulative global fallout is not included.
26

radioactive fallout, etc., will generally not be present at the Earth's surface
for these exo-atmospheric bursts.) This electromagnetic radiation is in the
form of a plane wave that can be collected by conducting media such as power
lines, water pipes, electrical conduits, and, in the case of long-haul fiber
optic cables, by the metallic elements needed for strength or armoring of the
cable when it is directly buried. The optical waveguides, of course, are
dielectric materials and, therefore, impervious to such electric fields. The
complete transmission system including switches, regenerators, and electronic
terminations are vulnerable to the threat of these very high electromagnetic
fields. The fields are similar to those produced by lightning. Lightning
produces very high fields and currents at a point on the Earth's surface. The
pulse of concern here covers a very large area whereas the pulse from lightning
is generally localized.
3.1 High Altitude Electromagnetic Pulse (HEMP)
The prompt gamma radiation from a burst above 40 km is absorbed in the
Earth's atmosphere at heights of approximately 20 to 40 km. This deposition
region for gamma rays is also the source region for HEMP (Glasstone and Dolan,
1977) . Through collisions with air molecules, the gamma rays produce high
energy Compton electrons. The Compton electron currents interact with the
Earth's magnetic field, thereby generating electromagnetic fields that
propagate (toward the surface) as a coherent pulse of electromagnetic energy.
Figure 2 illustrates the physical origin of the HEMP. Because the rates of
gamma ray emission and deposition are so rapid, the electromagnetic pulse has
an extremely short rise. time (a few nanoseconds) and brief duration (a few
hundred nanoseconds). The magnitude of the HEMP is limited primarily by the
enhanced electrical conductivity of the atmosphere caused by secondary
electrons released in collisions of Compton electrons with air molecules.
Nevertheless, HEMP field intensities can reach several tens of kilovolts per
meter over the exposed areas of the Earth. The electric field strength of the
pulse can therefore be 109 to lOll times greater than typical field strengths
encountered in radio reception (Wik et al., 1985). The nuclear HEMP frequency
spectrum is also very broad and covers the entire radio frequency communication
band.
The bulk of HEMP energy lies within the radio-frequency spectrum, ranging
from a few hertz to the VHF (very high frequency) band. HEMP differs from any
27

- ~.Ground Zero
Nuc 1ear Exp los; on
~
EM Rad; aU on
EarthHorizon FromBurst Poi nt
(Tangent Point)
Figure 2. Origin and nature of the EMF (after Glasstoneand Dolan, 1977).
28

other source of electromagnetic energy, whether natural (i. e., lightning) or
man made (e.g., radar and broadcast radio). The HEMP's time waveform exhibits
a higher amplitude and shorter rise time. These high-intensity HEMP fields can
occur almost simultaneously over a large area since they propagate at the speed
of light.
Figure 3 shows the coverage areas for different high-altitude bursts of
nuclear devices. The circles represented here are tangents to the Earth's
surface drawn from the burst point. The fields are not uniform throughout
these circled areas but diminish to about 0.5 Emax at the boundaries. Figure 4
shows a contour map of the electric fields for the same surface zero location
(Messenger and Ash, 1986). A generalized high-altitude HEMP electric and
magnetic field time waveform is shown in Figure 5. A plot of high-altitude
electric field spectrum and a normalized cumulative energy density spectrum for
the HEMP waveform is shown in Figure 6 (BTL, 1975).
Important parameters affecting HEMP' interactions with systems include peak
amplitude and time behavior, particularly rise time and duration. All of these
parameters vary with weapon yield, height of burst (HOB), and weapon and
observer locations. The parameters described above generally apply to the
early- time behavior of the' HEMP. A generalized HEMP time and frequency
waveform for use in system assessment and hardening activities has been
developed by calculation of waveforms for several threat situations and
constructing the envelope of these waveforms in the frequency domain, while
ensuring consistency with important time-domain parameters (peak field and rise
time) (Dittmer et al., 1986). This procedure has been followed more than once
to develop a generalized HEMP waveform, with the most extensive effort
conducted in the early 1980' s. The resultant waveform is classified Secret
Restricted data. In a letter dated April 3, 1984, the Under Secretary of
Defense for Research and Engineering directed that this waveform be used in the
assessment and hardening of C3I systems and facilities performing strategic,
time-sensitive functions. The Defense Nuclear Agency (DNA) has developed a DOD
Standard (DOD-STD 2169) that formalizes the waveform under the Defense
Standards and Specifications Program.
For purposes of this study, an unclassified version of the recent waveform
contained in the DNA EMP Course Study Guide (Dittmer et al., 1986) is shown in
Figure 7. This figure shows three distinct portions of the waveform, namely:
(1) early-time, (2) intermediate-time, and (3) late-time. The early-time
29

· HOB =500 km /HOB =300 km".
--tr:-..-_~_HOB= 100 km
Figure 3. EMP ground coverage for high-altitude bursts at 100, 300,and 500 km.
30

5 kV!m12.5
--..... 2537.55025
Figure 4. Electric field contours at the Earth's surface from ahigh-altitude. nuclear detonation.
31

50120
,.-.... ,.-....
E E' ..... 40 100 ........> «:::L "-'"'-~ ..c..c +-'+-' 50 O"JO"J c:c: 30 Q)
Q) L+-'L(J)+-'
(J) 60 "0"0 ~
Q)~ 20 .-Q)
I..LI..L UL' 40 .-
+-''[ Q)
+-' c:u 10
0)
Q) «:I~ 20 I:w
0 0-10 -9 -8 -7 -6
10 10 10 10 10
Time (s)
Figure 5. Generalized high-altitude EMF electric and magneticfield time waveform.
32

80 1.0="....
':;:;E c
<1/(f) C
I =":> 0\
Electrlc-FleldI-
;::, <1/C
60 SpectrumwQI
Q) :0-:> :+;0 ",
.i:I SOJ Normalized E
:J(D U"0 Cumulatlve "<1/C
40 Energy-Denslty .~
~
'3' Spectrum El...
"-"0
I.LJz
0.1
204 5 6 7 8 9
10 10 10 10 10 10
Frequency (Hz)
Figure 6. High-altitude EMP spectrum and normalized energydensity spectrum.
33

110_"...,
E 10000...,>'-J 1008::r>.....(J) 110cQ.'
10.....C
'0 t (2)
Q.) Inlermediat.e-
I.L .1 Time
u1: .01.....(JQ.)
.001.-w
10 -8 10 -6 10 -4 .0 -2 .1 I II 2
T1me (S)
Figure 7. Current unclassified HEMP waveform(Dittmer et al., 1986).
34

portion is characterized by the very rapid rise time and extends out to about
1 microsecond. This is the dominant portion, and the only portion
characterized in the BTL reference above. Because of the very large amplitude,
short rise time, and the frequencies involved this early-time portion couples
readily into telecommunication cables and antennas. Because of this dominance,
this portion of the waveform has been referred to as the HEMP waveform but the
term more properly applies to the total waveform. The intermediate- time
portion of the waveform extends from 10- 6 to 1 second. The late-time portion
occurs after 1 second. This latter portion has been historically referred to
as MHD-EMP because of themagnetohydrodynamic processes that produce it. All
thTee portions of the waveform have wide area coverage, but the peak amplitude
of the intermediate-time and late-time portions is much smaller. The MHD-EMP
may be significant for long conducting cables because of the very large skin
depth in Earth and sea water.
Other forms of EMP include low altitude EMP, which generates very intense
fields over distances of several kilometers. These are generally of lesser
importance except in specific instances such as command, control, and
communication facilities that have been hardened against blast and thermal
effects but might still be vulnerable to EMP.
3.2 HEMP Effects
Nuclear HEMP induces currents in all metallic obj ects, which by accident
or design act as antennas. Aerial and buried power and telecommunication
networks in particular can collect considerable amounts of energy. Even short
radio antennas and other electrical lines may experience unusual induced
currents and voltages. The collected HEMP energy could upset, breakdown, or
burn out susceptible electrical and electronic components. Many systems
contain integrated circuits and other semiconductor devices that are subject to
failure at very low energy surges (down to the order of a millionth of a joule
for short pulses) (Wik et a1., 1985).
Apart from the difficulties inherent in designing accurate experiments of
HEMP effects over large spatial volumes, there are serious difficulties in
app'lying theoretical models and calculations: to' real systems, which are
exceedingly complex and undergo frequent modification.
The field strength of a HEMP can approach 50,000 volts/meter (Raiford,
1979) . To place this figure in perspective, consider that a radar beam of
35

sufficient power to cause bilogical hazards has a strength less than 100 Vim.
Additionally, a transmitted radio signal from a 40,000 watt commercial
broadcasting station has a field strength in close proximity of the
transmitting antenna of only 1-10 Vim.
The polarization of the high altitude EMP is a function of the location of
the burst, the location of the observer and the direction of the Earth's
magnetic field. As a rule of thumb, the polarization of the electric field is
normal to both the direction of propagation (radially outward from the burst
point) and the Earth's magnetic field at the location of the observer.
The polarization can vary from horizontal to vertical. For most of the
United States and western Europe, the expected polarization would range from
horizontal to 30-40 degrees off horizontal.
A system's vulnerability may be due to either burn-out of electronic
components, or arcing between conductors, or to temporary upset of a computer
memory (Carter, 1984). If the temporary upset can be corrected locally within
a few minutes, it is not considered tactically vulnerable. About a microjoule
of energy delivered to a single junction of an active solid-state element may
burn it out. Since a threat level HEMP wave has about a joule-meter2 energy in
it, very modest coupling efficiencies can lead to permanent damage or temporary
upset.
HEMP is not the only source of stress that can cause damage to sensitive
circuits. A recent article summarizes the EMP stress along with other likely
sources that may cause damage (Antinone, 1987). Recent success in making
electronic circuits smaller, faster, and more densely packed cause these
circuits to be more susceptible to damage by transient voltages or currents.
When an integrated circuit is subj ected to transient overstress, the failure
mechanism is usually electrothermal. The power that causes the damage is
delivered electrically, but the nature of failure is ultimately thermal: the
dissipation of the electric power causes localized heating, to the point of
melting or undesired alloying in the circuit.
The gates of Metal-Oxide-Semiconductor (MOS) transistors are especially
sensitive to electrical overstress. In an MOS transistor, the maximum that the
thin oxide layer can withstand is known as the dielectric standoff voltage.
Beyond this limit, current punches through the oxide, forming a permanent path
from the gate to the semiconductor below. Since a punch-through failure occurs
36

very quickly, MOS gates should be handled very carefully if they lack
protective networks.
Estimates of damage thresholds for various electronic components are shown
in Table 6 (Sims, 1987). These devices are not hardened to military
specifications. Such hardening greatly increases the cost of devices. The
cost increases may be justified for some critical system or subsystem elements.
For applications in common carrier, long-haul systems of interest to this
study, careful attention to bonding, grounding, and shielding seems more
appropriate. Electronic cabinets with specially designed conductive surfaces
or overlays may actually suffice for the regenerator electronics as well as the
electro-optic transceivers. Once shielding is in place, it is extremely
important not to violate its integrity by carelessly inserting conducting paths
such as power cords, antenna wires, or other penetrations that would negate the
intended shielding.
Table 6. Typical Vulnerability of Electronic Components
Damage Threshold in Joules
10Q 10.:.1 10.:2. 10..:2. 10 - 4 10..:..2. 10..:..2. 10.:..1 10.:Ji
I I I I I I I I II I I I I I I I I
RELAYS XXXXXXXXXX
VACUUM TUBES XXXXXXXXXXXXXXX
RECTIFIER +CONTROL DIODES XXXXXXXXXXXXXXX
ZENER DIODES XXXXXXXXXX
AF TRANSISTORS XXXXXXXXXX
RF TRANSISTORS xx.xxxxxxxx
INTEGRATED CIRCUITS
CMOS
MICROWAVE DIODES
37
xxxxxxxxxxxxxxx

3.3 HEMP Levels
The coupling of EMP energy to exterior structures has been treated in the
literature (BTL, 1975). The HEMP waveform (early-time) can be approximated
analytically by the difference between two exponentials:
where
e(t) = Eo(e-~t - e-at)u(t)
Eo = 5.25 x 10⁴ volts per meter
~ 4.0 x 10⁶ sec- 1
a = 4.76 x 10⁸ sec- 1
and u(t) is the unit step function.
(Note: The DNA EMP Course notes indicate that the ear1y- timehigh frequency (f > 100 kHz) p'ortion of this waveform is betterapproximated by ~ = 3 x 10⁷ s-l and u(t) = k = 1.285.)
Starting with this expression, the coupling to a buried coaxial cable
sheath was calculated in the reference (BTL, 1975). The results indicate that
peak currents of 1800 amperes are generated in a 3 - inch (7.6 em) diameter
sheath buried 1 meter in earth with conductivity = 10- 2 mho per meter and
permittivity = 1 (permittivity of free space). It is clear from these analyses
that care must be taken in grounding metallic sheaths on fiber optic cables.
Structures such as regenerator or terminal buildings may have other buried
penetrations in addition to the signal cable (e.g., fuel-oil casings, drain and
sewer pipes, and conduit enclosing power leads to outside lights and pumps or
standby generator equipment). These external structures act as unintentional
receiving antennas for EMP. Many of these structures are relatively short and
induced currents of less than 1000 amperes may be expected. It is necessary to
prevent such induced currents from entering the structure that houses sensitive
electronic equipment. The maximum peak short-circuit current induced on semi
infinite over~ead power lines or communications cables at a nominal height of
10 meters is about 10 to 15 kiloamperes for typical earth conductivity. This
maximum occurs for small elevation angles of the incident EMP (between 4 and
12 degrees). (No similar calculations were found corresponding to the extended
waveform, i.e., intermediate-time and MHD-portion of the waveform. The latter
portion of the waveform would likely couple strongly to long lengths, e. g. ,
30 km, of cable. Also, the much lower frequencies contained in this waveform
would make shielding by burying the cable ineffective because of the much
greater skin depths at these frequencies.)
38

3.4 System Evaluation
The intensity of the HEMP field is so large that it does not need an
antenna to collect the damaging energy (Ghose, 1984). Ghose indicates that it
is not unusual for the EMP energy to reach a circuit or equipment inside a
shield or enclosure by a direct penetration through the shield or through
cables· leading to equipment or through doors, windows and seams of shield
structure. Since the early 1960's, many theories, along with their
experimental verifications, have been advanced to assess quantitatively various
modes of entry of EMP energy into circuits and components. The exact
computation of the field or voltages or currents induced in a circuit or
component of a system, by almost any mode of entry, is difficult, even when the
incident, time-varying EMP field is exactly defined. This is often because of
the complexities of the formulation of the electromagnetic boundary value
problems for objects with irregular shapes and sizes and the simultaneous
presence of multiple modes of entry of EMP energy. The direct penetration of
an EMP field through a shield or an enclosure, for a given incident field at
the outer surface of the shield, can be solved exactly for only a few ideal
geometries, such as an infinite circular cylinder or sphere, most of which are
not encountered in real-life systems. Similar difficulties arise with the
analytical treatment of determining EMP- induced voltages and currents at the
output of an arbitrary, but conventional, antenna, or in cables of arbitrary
lengths and with arbitrary, but cornnionly occurring, terminations. Theories
developed during the 1960's, however, do provide an insight into the damaging
potential of the EMP by various modes of entry and suggest what measures are
important during the design of a system to assure EMP hardness.
There appears to be a significant body of information available to those.DOD contractors that build systems for aircraft or missiles that must work in
an EMP environment. These "black box" units are designed to meet specified
threats. Standards have been developed to allow the customer and manufacturer
to agree on the degree of hardness achieved and to qualify the system or
subsystem. EMP test facilities are available such as: ALECS, ARES, Small EMP
Test Facility, Long-Wire Antenna Simulators, Vertical Dipole Simulator, Cable
Driver, CW Tests, and Current Injection Tests (Ghose, 1984). These facilities
are designed to test obj ects that vary in size from a component up to a large
aircraft. None of these facilities can produce the very high electromagnetic
39

fields over large areas as needed to test the fiber optic common carrier
installations of interest to this program.
3.4.1 FT3C Multimode Lightwave System Evaluation
Tests have been performed (NCS, 1985) to determine the vulnerability of
the FT3C Multimode Optical-Fiber Communications System by AT&T. In these
tests, elements of the FT3C lightwave system such as the cable, regenerators,
line repeater stations, etc., were subj ected to the test conditions at the
AESOP Test Facility [Harry Diamond Laboratories (HDL) Woodbridge Research
Facility in Woodbridge, VA]. Bit error ratio measurements were conducted
during the tests in this facility to determine the system performance
degradation to be expected from an EMP event. The test program proceeded in
several stages that were conducted at HDL and AT&T Bell Laboratories in Indian
Hill, IL. The tests used two methods to stress the FT3C system: exposure to
the Army EMP Simulator Operation (AESOP) and current injection. A
communication network covers a large geographic area; hence, it can collect
large amounts of energy from the nearly uniform electromagnetic field that
would blanket it following a high-altitude nuclear burst. This energy is.
concentrated in the form of high-level currents at the termination of the long
lengths of cable that connect the network.
It is not practical to simulate the full-strength EMP waveform along a
cable of sufficient length that the current induced through electromagnetic
coupling reaches a saturation level. Consequently, large current inj ectors
must be used to attain representative levels in systems possessing long cables.
Conversely, the nature of the electromagnetic coupling to a particular cable is
best determined by direct measurement under an EMP simulator.
Testing at the AESOP facility was used to characterize the coupling of a
radiated electromagnetic field to the FT3G cable (so-called Transfer Function).
The currents induced by the test facility were relatively small. The data from
these tests provided the input for calculations that modeled the cable current
that would have resulted if the incident electromagnetic field had appeared as
the waveform presented in the threat defined in a memorandum of April 3, 1984,
from the Under Secretary of Defense, Research and Engineering, i.e., DOD-STD
2169. The particular lightguide cable to be tested contained metal wires to
increase its strength. It also contained a metallized vapor barrier that was
intended to be insulated from the metal wire strength members. Current
40

inj ection tests were made while these cables were terminated (optically and
electrically) as they would be in actual system installations.
A second purpose of the simulator testing was to determine" the effect of
HEMP on the central office equipment and the line repeater stations of the FT3C
system. The most significant aspect of the EMP response of the FT3C lightwave
transmission system was the sensitivity of the over-voltage-protection
circuitry in the power converters. The origin of this sensitivity was
electromagnetic coupling to the leads from the output terminals of the power
converters and lower-level coupling directly to the printed-circuit wiring of
the converter. This disablement was not viewed as a malfunction of the system,
since the protection circuits were performing the function for which they were
designed and can be readily modified to eliminate this malfunction.
Other than the issue of the power converters' deactivation; the only
sensitivity to EMP evinced by the FT3C system was a brief period of a few
tenths of a second of signal disruption following EMP exposure. The signal
persisted throughout the disruption and was compromised only to the extent that
a few thousand bits of information were lost; presumably this is the price paid
for a gross electromagnetic disturbance of delicate circuitry.
3.5 Conclusions
It appears from the tests reported above, that optical fiber common
carrier systems can be designed to survive the impact of HEMP events without
heroic measures in shielding. Clearly, emphasis on good engineering practice
is required. In order to meet other NSEP requirements, it seems highly
desirable to require that the transmission media, along with the regenerator
electronics, be buried. It seems appropriate to analyze the added protection
provided by the burial of the cable and electronics. Once a fiber optic system
is in place, it is essential that a program of periodic testing be implemented
to assure that the susceptibility of the system is not compromised.
4. PROPERTIES OF OPTICAL WAVEGUIDES
Fiber waveguides to be used in long-haul transmission systems where large
transmission capacity is required must be single mode because of the bandwidth
limitations of multimode waveguides due to modal distortion and disturbances
due to intermodal interference (mode noise) (Baack, 1985).
41

4.1 Material Attenuation
Very pure quartz (Si02) serves as the starting material for present-day,
high-quality light waveguides. To vary the refractive index, the material is
doped (Mahlke and Gossing, 1987) with germanium (Ge) and phosphorus (P) (to
increase the refractive index) and boron (B) and flourine (F) (to decrease the
refractive index). Thus, core dopants are primarily Ge and P and clad dopants:,~
are Band F. Figure 8 shows the variation with dopant levels.
Optical losses in the material arise due to scattering and absorption of
the light. Impurities involved in particular transition elements such as Cu,
Fe, Ni, and Cr as well as OH- ions lead to high losses in the. relevant
wavelength range from 0.8 to 1.6 ~m. Absorption losses, which as a fundamental
principle cannot be avoided, occur in the ultraviolet and infrared ranges due
to absorption by the quartz material itself.
For a Ge-doped, single mode fiber, the causes of loss as a function of
wavelength are demonstrated in Figure 9 .. In addition, the calculated resultant
total loss is also shown. The limiting lower loss level in each of the windows
used for telecommunications is that determined by Rayleigh scattering. (An
interesting rule of thumb is that this loss is about 1 dB/krn at a wavelength of
1 ~m.) At wavelengths greater than about 1.6 ~m, the loss increases rapidly
because of the infrared absorption in this region. The silica-fiber waveguides
. exhibit a minimum loss at about 1.55 ~m, as shown in Figure 9.
4.2 Material Dispersion
A limiting property of the waveguides for high capacity systems is the
material dispersion caused by the fact that the index of refraction of the
material is not constant with wavelength near the operating wavelength of the
driving source. The dependence of the index of refraction, and thus the group
delay time, upon the wavelength is called the material dispersion (tg ). For
materials used for production of current long-haul fibers, t g exhibits a zero
state near 1.3 ~m. Figure 10 shows the dispersion of pure and doped quartz as
a function of wavelength. In optical fiber technology the dispersion is
specified as a change in delay time in picoseconds per nanometer wavelength
change of the source and kilometers of fiber length (ps/nrn-krn). The zero-point
of the material dispersion can be shifted to higher wavelengths by doping the
quartz with Ge and to lower wavelengths by doping withB.
42

1.50
c 1.49~
xQ)
"0C
Q)
:>.....+Ju
1.47(0L~a-
Q)
ll:':
1.45
-
-
I-
GeQ --- --2 ".-.
---- PO2_5
------== B 0
~ 2 3
F
I I I I I
o 2 4 6 8 10 12
Figure 8.
Doplng Concentratlon. Mol. %
Refractive index of 8.02 with differentdopants (after Mah1ke
1and Gassing, 1987).
43

1.6 1.8 2.0
IR AbsorptionLoss
Loss Due toWaveguide Imperfections
1.4
Total
Loss ~
1.2
UV Absorpt ionLoss
RayleighscatteringLoss
1.0
0.5
0.02
1.0
0.05
((I(()
00.1-l
OJ 02D .
0"-".
Wavelength (urn)
Figure 9. Representation of loss components in aGe-doped,single-mode fiber as a function of wavelength(after Baack, 1985).
44

+20SiO + B 0
....... 2 2~-..
0E.::.i
X
E -20c...........~ 'SiO + Ge0(J)
-40a. 2 2
Cl)
I--60
-80
·-1000.8 1.0 1.2 1.4 1.6
Wavelength (urn)
Figure 10. Material dispersion of pure and doped silicaversus wavelength (after Baack, 1985).
45

4.3 Glass and Fiber Making
Low loss fiber waveguides are drawn from very pure quartz (Si02) rods or
boules that have been appropriately processed to deposit the dopants. Glass is
generally considered to be the material from which windows and drinking glasses
are made. Glass is technically not a particular material, but rather a state
(e.g., solid, liquid, or gas) of matter. In particular, glass is a solid state
of matter in which the atoms are not in a regular array (as in a crystal), but
where the interatomic spacings and bond angles are irregular (Personick, 1985).
Figure lla is illustrative of the compound silicon dioxide in both its
crystalline state, and the glassy state is shown in Figure llb. If cooled down
slowly, a liquid will form a crystalline solid at a temperature called the
freezing temperature. This change of state as a function of temperature occurs
abruptly and with an accompanying change in volume at the transition. However,
if a liquid is cooled down very rapidly, then at a temperature below the
freezing temperature, called the glass-forming temperature, the liquid may
gradually solidify in the glassy state. For example water, which normally
freezes at 273 oK, will form a glass if rapidly cooled to 140 oK from the
liquid state. Si02 will form a glass under similar cooling conditions at
135 oK.
4.3.1 OCVD Process
In 1970 Corning Glass Works demonstrated a method for forming low loss
« 20 dB/km) fibers from mixtures of silicon dioxide and oxides of germanium
and other atoms. Their process started out with very pure silicon
tetrachloride, a volatile liquid that can be purified of metallic contaminants
to below 1 part per billion (ppb) with proper processing. Through this liquid
they bubbled pure oxygen, which picks up some of the SiC14' The mixture is
burned in hydrogen to form tiny particles of very pure Si02. These particles,
formed in a burner, are directed at a rotating target mandrel where they are
deposited in the form of soot (fine particles), see Figure 12. As the mandrel
rotates and the burner translates back and forth over the mandrel, a soot
"preform" is built up which is typically about a meter long and perhaps
10 centimeters in diameter .. As the preform is built up, the composition of the
deposited soot particles can be varied. For example, germanium tetrachloride
and boron trichloride can be added to the oxygen stream to raise or lower the
refractive index of the deposited material. When a sufficiently large soot
46
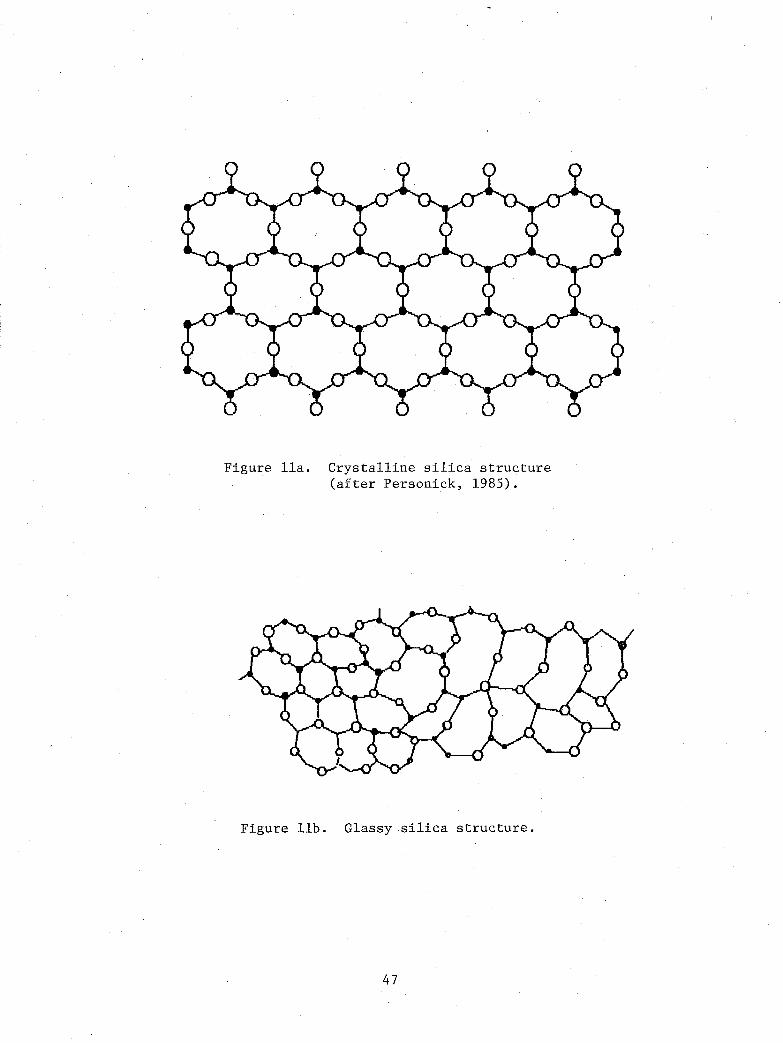
Figure lla. Crystalline silica structure(after Personick, 1985).
Figure llb. Glassy silica structure.
47

(\1====---\.;
Mandrel Soot Preform
Figure 12. CVD glass preform fabrication (after Personick, 1985).
48

preform has been deposited, the preform is pLaced in a furnace, which causes
the soot particles to melt together into a clear solid preform. This process
is called sintering. Finally the target mandrel is removed, and the preform is
again heated, causing it to collapse into a solid rod. It is from this solid
rod that a fiber can be drawn. Corning called this process the outside
chemical vapor deposition (OCVD) process.
4.3.2 MCVD Process
Bell Laboratories developed a modified chemical vapor deposition (MCVD)
process or inside chemical vapor deposition process. This is illustrated in
Figure 13. Pure oxygen is bubbled through silicon tetrachloride, germanium
tetrachloride .. and mixed with other materials, and allowed to flow through a
starting tube of high quality silica (fabricated by some other process). The
tube is held in a glass-working lathe containing two synchronous chucks. The
synchronous chucks rotate the tube while allowing access to the ends. Where
the cutting tool would be placed in a metal lathe, one places a torch that
traverses back and forth across the rotating tube. As gases flow past the
torch, they ignite to form particles of pure glass (soot particles) that
depos i t on the walls of the tube downs tream from the flame. As the flame
passes over the soot particles, it consolidates them into a solid clear glass.
In this way layer upon layer (possibly of varying composition) of new glass can
be deposited inside the tube. The inner cladding layers are deposited first,
followed by what will become the fiber core. After sufficient new glass has
been deposited inside the tube, the gases are shut off, the temperature of the
torch is raised, and the tube collapses into a solid rod (preform). A typical
tube is about 1 m long and 25 mm in diameter.
4.3.3 VAD Process
A third process has been developed by Nippon Telephone and Telegraph
(NTT) , in cooperation with Sumitomo, Furukawa, and Fujukura companies in Japan,
which is referred to as the vapor axial deposition (VAD) process. In this
process, illustrated in Figure 14, material is deposited on the end of a
growing preform. The resultant soot preform is sintered into a solid rod, as
in the outside chemical vapor deposition process.
Each of these processes is being used to make low loss, high quality,
single-mode fiber waveguides. Each can provide adequate control to accurately
49

Flow MetersMess Flow Contra 11 ersend Menifo1d EXhe7st
______F_~_~~~__~~_e rt 20: UDJeCI 2
DustDeposited CoreGlass Layer
Translati on
MultiBurner
Torch
io 0r r ( I
5i C14
GeC14
BC1 3....'-------"/
Bubblers
,Figure 13. MCVD glass preform fabrication (after Personick, 1985).
50

starting Silica Rod
T ransparEmt Pref orm
51C14
+ BBr 3
-r~ ~r-
t====j
Carbon Heater
Porous Preform
Fine Glass Particles
Oxy-Hydrogen Burners
Figure 14. VAn glass preform fabrication <after Personick, 1985).
51

form the core and cladding regions. Each process is constantly being improved
to increase the rate of deposition of materials, the efficiency of use of
starting materials, and the yield of the fabricated fibers. These factors
determine cost.
Having fabricated a clear glass preform by one of the methods described
above, a fiber drawing machine is used to form the waveguide under accurately
controlled conditions to assure uniformity of core and cladding diameter,
concentricity, etc., as necessary to meet rigid internationally adopted
standards so that connectors, splicing machines, and other processing can be
handled by crafts personnel in the installation and maintenance of the
subsequent fiber optic cables.
4.4 Single-Mode (SM) Fiber Waveguides
The condition for producing a dielectric waveguide is shown in Figure 15.
The core with the refractive index n c and the cladding with the refractive
index ncl are produced from correspondingly doped quartz material. To obtain a
SM waveguide, specific dimensions must be adhered to for the core diameter 2a
and the refractive index step (nc - ncl)' A normalized frequency parameter is
defined as follows (Baack, 1985):
NAwhere
and
v = ko • NA
[(nc )2 - (nc l)2]1/2
a = radius of core
A operating wavelength.
NA is the numerical aperture of the fiber for beam optics. (The factor k o can
be remembered as the core circumference expressed in free-space wavelengths of
the driving source.) For low doping percentages, n c ~ ncl so that
where(n ) 2 - (n 1) 2_-=c'-- ""c=-_ ~
2(n )2c
nc
52

CI
XQ)"0C fl CI ~Q)
>+J(.)(0L'+-mIX
I I
a (core rad1us)
F1ber Rad1us (r)
Figure 15. Schematic representation of a step-indexoptical waveguide (after Baack, 1985).
53
The radial field distribution in a SM fiber is described in the core by
the Bessel ·function J o and in the region of cladding by a Hankel function field
which decays exponentially. At the cut-off of the HE21-mode (V = 2.4)
approximately 20 percent of the power is carried in the cladding region. For
this reason, the cladding material must be low-loss similar to that of the core
in order that an overall low-loss waveguide be achieved. The driving source
wavelength must be chosen such that V ~ 2.4 as a condition for operation as a
single mode waveguide.
4.4.1 Radiation Damage in Optical Fibers
The immunity, of interference from electromagnetic fields is a much
publicized property of optical transmission media. It is tempting to conclude
that optical fiber transmission links are not subject to environmental
degradation. It has been known for a considerable period of time that glass
will discolor when exposed to nuclear radiation. Such discoloration represents
a change in the optical properties of the glass which in general results in
enhanced absorption of light passing through the glass. Thus exposure to
nuclear radiation may produce significant attenuation enhancement in optical
communication cables. A body of research literature is available (see
Bibliography). Actual measurements on commercially available single-mode fiber
representative of that which is actually being installed appears to be meager.
In order to interpret that which is available, some background is required.
Various models are invoked to explain the optical properties exhibited by
glasses, ranging from phenomenological treatments involving complex dielectric
constants to damped harmonic oscillator models of electronic states (Englert,
1987). The models at best lend some qualitative insight into the treatment of
light interaction with glass; however, no overall satisfactory quantitative
theoretical descriptions at the atomic level of such phenomena have been
offered.
The diagrams in Figure 11 are attempts to illustrate the difference
between crystalline and glassy materials. Thus the alteration of absorption
characteristics in opti~a1 fibers, after exposure to ionizing radiation, is to
be expected. In simple terms a color center is an impurity or imperfection
within an otherwise well-ordered system. This imperfection will generally have
a set of energy levels available for electronic transitions. These energy
54

levels then represent an absorption spectrum, so light not absorbed gives the
material its characteristic color.
Color centers can be formed by exposure to ionizing radiation. The
process is most likely one of bond-breaking i.n the solid as the high energy
(e.g., x-ray or ~-ray) photon or particle energy is absorbed. This results in
a local variation in the electronic energy level structure. Any rearrangement
of the electronic structure at localized sites within a solid might be thought
of as a defect. An electron, for example, trapped at some defect site, can
participate in the absorption of incident light. At a lower temperature the
electron will be bound to this site for a sta1tistically longer period of time
than if the material was at some higher temperature. The "recovery" of
radiation damaged optical fiber materials at higher temperatures must be a
process of thermal energy absorption resulting in the rearrangement of local
defects caused by radiation. Many forms of these defects are unstable and
thermal processes are sufficient to restore the material to its original state.
Some processes are quite stable and thermal "healing" is not nearly so
effective.
4.4.2 Scintillation
Optical fibers exposed to high dose rates of ionizing radiation have been
found to show a significant increase in extraneous light during the time of
exposure. The primary source of this extraneous light during irradiation is
due to the Cherenkov effect. This effect occurs when a charged particle passes
through a material at a speed faster than the speed of light in that material.
In effect, an optical shock wave results. This process is a common way of
detecting and measuring the energy of charged particles given off in nuclear or
other high energy processes.
Another possible source of the scintillation observed in optical fibers is
luminescence. The luminescence of materials generally arises from some form of
recombination or de-excitation of atomic systems after having absorbed energy r
from ionizing radiation. A three-step sequence of events occurs:
1. Energy, represented by ionizing radiation or particles, isincident onto material.
2. Energy is absorbed by an atomic or molecular structure resultingin a transition to some higher energy state.
55

3 . The atomic or molecular s trueture re turns to its ground s tateand emits radiation.
The time from the first to the last step varies from material to material.
For example, the afterglow of a television screen represents a rather long time
(on the average) transition to the ground state. In glasses, the luminesc'ence
generally takes place very soon after the absorption of ionizing radiation.
4.4.3 Fiber Reliability Considerations
Three reliability considerations have been identified by Nagel (1986).
These are mechanical strength and static fatigue, radiation-induced attenuation
effects, and hydrogen induced losses. Regarding the radiation-induced
attenuation effects, she states that the induced radiation effects in fibers
are influenced by a large number of variables such as the nature and energy of
the radiation; the dose and dose rate; the wavelength of operation; the
temperature, length, and uniformity of fiber exposed; the light inj ection
conditions and intensity; the previous radiation history of the fiber; and the
time relative to exposure. Such variables further underscore the need to know
very specifically not only the fiber response but the details of the
environment the fiber will function in. The radiation-induced losses in fiber
are composed of both a permanent and transient component. It is quite
important to also specifically account for losses due to steady state exposures
versus the loss at a given time after exposure. The recovery response after a
fiber has been exposed to a pulsed or temporary radiation exposure can change
the system response in a way to reduce the radiation effects. In some cases,
photo-bleaching due to the transmission of power through the fiber or exposure
to ambient light can enhance the recovery or electron-hole recombination
characteristics in the glass. This can affect both characterization and
performance of the fiber.
4.5 Experimental Measurements of Radiation Damage
When optical fiber waveguides are exposed to nuclear radiation, the
radiolytic electrons and holes can form color centers if they are trapped on
defects that either exist in the amorphous network or the glass prior to
irradiation or are created by the exposure (Friebele et al., 1985). These
color centers give rise to the radiation-induced optical attenuation that is
commonly observed in the three infrared operational wavelength windows of 0.85,
56
1.3, and 1. 5 ~m. The optical attenuation of irradiated waveguides can be
10-1000 times greater than the intrinsic losses (e.g., 10-1000 times 0.5 dB/km
at 1. 3 ~m).
The radiation-induced attenuation is composed of two components: (1) a
permanent component, which persists years after the initial exposure or grows
in during very low dose rate « 10 rad/day) steady state irradiations, and
(2) a metastable component. The latter consists of both a transient part,
which evidences decay times < 1 s after a pulsed irradiation and a component
which recovers in times > 10 s and is measured during and after steady state
exposures of 10-10,000 rads/min. The nature and extent of the transient and
steady state recovery processes depend strongly on the composition, dopants,
and fabrication process of the fiber core. The radiation response of fibers is
influenced by several factors such as (1) fiber structure and core and cladding
composition and dopants added to minimize the radiation sensitivity; (2) system
parameters such as operational wavelength, light intensity, and temperature;
and (3) radiation parameters such as total dose, dose rate, time after
irradiation, and the energy, nature, and history of the radiation.
4.5.1 High-Bandwidth Telecommunication Fibers
High-bandwidth telecommunication fibers typically consist of aGe-doped
silica core that may be co-doped with f10urine (F) or phosphorus (P) and either
a pure or doped silica cladding. In the case of mu1timode fibers the index of
the core is graded in a near-parabolic fashion, while the cores of single mode
waveguides usually have either a step or triangular profile. Extremely low
optical attenuations have been achieved in these fibers (e.g., 0.12-0.16 dB/krn
at 1.55 ~m) by removal of impurities and OH and by careful choice of dopants.
These fibers have achieved the theoretical attenuation.
The transient response of pure silica core fibers following pulsed
irradiation has been shown to be much less than that of any doped silica core
waveguide. Thus pure silica core fibers appear to be desirable for radiation
environments. The radiation response of doped silica core fibers is different
from that of pure silica core. In the case of the doped silica core fibers,
the concentration and nature of the dopants dictate the fiber behavior. In the
case of silica core fibers, impurities and defects intrinsic to the silica
network determine the radiation sensitivity.
57

4.5.2 Recovery of Multimode Fibers
Figure 16 shows the recovery of radiation-induced attenuation in Ge-doped
(multimode) fiber following an accumulated exposure of 3,700 rads. The induced
loss is the added loss following exposure. This fiber was doped with Ge in the
core and flourine in the cladding layer (levels of dopant were not specified in
the paper). The loss induced at 23°C is only 2.5 dB/krn, which decays to
< 1 dB/krn within a minute after the exppsure. It is interesting to note that
although the loss incurred -immediately after irradiation is substantially less
at 80°C, the recovery is less at 80 °C than at 23°C. The initial loss at
-55°C is 18 times that at 23°C and the recovery (the slope of the 'curve) is
substantially less (almost 5 dB/krn induced loss remains 24 hours after
exposure) . This fiber was pulled from a preform prepared by the modified
chemical vapor deposition (MCVD) process. A similar fiber pulled from a
preform prepared by a plasma chemical vapor deposition (PCVD) process had
identical radiation responses at 23 and 80°C, but less than half that of the
MCVD fiber at -55°C. The MCVD process fiber contained slight F doping
« 0.2%) in the cladding layer. The PCVD process fiber contained no F in the
cladding. This would suggest that flourine doping in the cladding may affect
the low temperature response; however, further testing of fibers prepared by
the aVD process without F-doped cladding gave identical response to the MCVD
fiber. This suggests that the low temperature response of the PCVD fiber is
due to the nature of the process.
Figure 17 shows the effect of adding phosphorus to the cladding. Both the
level of the induced loss and the recovery time have been increased. The
radiation response at -55°C is significantly less and may approach that of the
23°C after sufficient recovery time. This suggests that P doping may reduce
the temperature effect on the radiation response provided sufficient time is
allowed to permit the recovery and provided sufficient system margin can be
made available to allow for the enhanced loss.
4.5.3 Single-Mode Fiber Induced Loss
Figure 18 shows the results of tests on a proprietary fiber that consists
of Ge-doped silica core and silica cladding plus additional core dopants to
reduce the temperature dependence of the induced loss and to enhance recovery.
The loss measured at -55 and 23°C immediately after irradiation is slightly
higher than in the fiber of Figure 17. However, the recovery of this fiber is
58

10 21.3 urnDose = 3700 Rads
,.-, -55DCE~ I
......~
a::J 10'0,-J
(f) Multirnode Fiber(f)
23 DCa MCVD-J
~Core Dopant - Ge
(,J 0 Clad Dopant - F;:} 10'0C
80DC
-110 I
-1 0 1 2 3 -1 510 10 10 10 10 10 10
Time (5)
Figure 16. Recovery of the induced attenuation inGe-doped silica core fiber.
59

;-..
E2i 10 Icou-,.;
Multimode FiberCore Dopant - GeClad Dopant - F & P1.3 umDose =3700 Rads
...
-110
o10
110
210
Time (s)
310
Figure 17. Recovery of the induced attenuation inGe-doped silica core fiber with aP-F-doped cladding.
60

,.-..
E10 1:::L,
23°Cco~'0'-J
(J)(J)0-J BODe'0Q)t) Mult1moCie Ftber::J'0 Hadiation Hardenedc
1.3 umDose = 3700 Rads
10 0I I I I
-1 0 1 2 3 4 510 10 10 10 10 1.0 10
Time (5)
Figure 18. Recovery of the induced attenuation in Ge-dopedsilica core fiber (radiation hardened).
61

better so that the damage in the two is approximately equal to 1,000 s after
the exposure; at longer times this fiber is superior. The enhanced recovery
also results in less damage at 80 °G in this waveguide. The effect of core
dopants to enhance recovery is especially evident in the low response of the
waveguide at 80 °G.
Figures 19a and 19b show the growth of radiation-induced attenuation as a
function of dose for six single mode fibers obtained from different
manufacturers. Gore and cladding dopant levels (weight percent) are indicated
for each fiber. These measurements were made at 23 °G and the radiation source
was 60Go . The fibers were irradiated first at a dose of 300 rad/min to a dose
of 200-2000 rad and then at 9000 rad/min to a total dose of about 106 rad. The
preform for fiber number III was prepared by an inside vapor phase (IVP)
oxidation process. The preform for fiber number IV was prepared by the VAD
process. Fiber number V was drawn from a preform prepared by an outside vapor
phase (OVD) oxidation process. The other preforms were prepared by an inside
vapor deposition process. The induced loss after an exposure of 1000 rads
varies between 0.6 and 14 dB/km. The damage at this dose level in all but the
best of the fibers is at least an order of magnitude greater than the intrinsic
loss. Rough approximations for the induced loss vary from about 10 mdB/km-rad
for fiber number V to 0.55 mdB/km-rad for fiber number IV. Fiber IV tends to
saturate (or recover) above about 103 rads. Note that fibers IV, V, and VI in
Figure 19b contain no P-dopant and each tends to saturate compared with the
fibers in Figure 19a. There were. no published results regarding the
temperature effects on the radiation response of these fibers.
The P-concentration in the cladding of the II-fiber is approximately twice
that of the III-fiber leading to a factor of 2 higher radiation response of the
II-fiber. The results of the tests on these two fibers illustrate that the
cladding composition of single-mode fibers plays an important role in
determining the radiation response, a conclusion that is consistent with the
significant fraction of the optical power carried in the cladding of single
mode fibers. The effect of the cladding will depend on the degree of mode
confinement and hence on the V-number. The core composition has a greater
effect on the radiation response than that of the cladding. The damage is a
factor of 5 greater in the I~fiber, which has the same P-content in the core as
the III-fiber has in its cladding. (This correlates with the statement made
62

...10 r----------------------,
Single-Mode Fibers1.3 umTemp. = 23°C
Core: Ge=5.2; P= 1.5~F~Clad: Ge= 1.6; P=0.7; F=0.6
"Core: Ge=4.7Clad: P=2.9; F=O
10 -1 L- ---L. -&..-__-.J~____L_ ~ -~
o 1 2 3, ... 5 610 10 10 10 10 10 10
:310
;-.,.
E10 2.::.t:.......
II)'0""-J(f)to
10-l 10'0Q)U=-''0s::
10 0
Dose (rad)
Figure 19a. Growth of radiation-induced attenuation insingle-mode fibers.
63

410 r-------------------------,
(1")(f)
o.-J
UQ)
U~
UC
10 3
10 2
10 1
10 0
Single-Mode Fibers1.3 urnTemp. =23°C
VCore: Ge=7.0Clad: ------ VI
Core: Ge=7.9Clad: Ge=2. 1; F=0.7
o10
110
210
~
10
Dose (rad)
410
510
610
Figu~e 19b. Growth of radiation-induced attenuation insingle-mode fibers (no P-dopants).
64

earlier that about 20 percent of the power is carried in the cladding in a
single mode fiber.)
4.5.4 Single-Mode Fiber Recovery
Figure 20 shows the recovery of the radiation-induced attenuation in the
single-mode fibers shown in Figures 19a and 19b. The fibers were exposed to a
60Co source. Again the tests were run at 23 °G. Note the change in scales on
this figure. The recovery data were taken after an exposure of about 24 s at a
rate of 9000 rad/min, which results in a total dose of 3700 rads.
Note that there is no recovery in the fibers that contain phosphorus
dopant at least up to· the 24-hour period (105 s). The induced losses of the
IV, V, and VI fibers are substantially less than those of the other fibers at
short times following steady-state irradiation (due to recovery during the
irradiation), and significant decreases are noted over about 1 hour. The total
loss becomes < 1 dB/kmand approaches the intrinsic loss within this period.
This behavior i~ not unexpected, since low initial induced loss and substantial
recovery have been observed in mu1timode fibers doped with only Ge in the core.
The losses in these fibers are similar to the induced loss on Ge content in the
7-25 weight-percent range. Large transient absorptions in these types of fiber
occur following pulsed irradiations; however, it is likely that most of this
loss will have decayed by 1 to 10 s.
4.6 Recent Unpublished Results
The radiation sensitivity of a series of commercially available sing1e
mode fibers has been evaluated (Friebe1e, private communication 1987) and
compared with experimental fibers drawn by the Naval Research Laboratory (NRL).
The core and cladding compositions were determined by microprobe analysis.
These fibers were subj ected to a 2000-rad dose from a 60Co source. The
temperature at the time of exposure was -35°C. The recovery was monitored for
up to 105 s. A composite plot of the data representing seven of these fibers
is shown in Figure 21. (The names of the suppliers have been removed except
for the two experimental fibers -drawn at NRL.) Fibers I and lIon this figure
were designated as "radiation hardened" fibers. A second set of tests is shown
on Figure 22. These three fibers were all made by the same manufacturer.
Fiber VI is a standard fiber representative of much of the installed fiber in
commercial common carrier systems. Figure 23 shows test results on a fiber
65

510
410
IIICore: Ge=9.5
Clad: P= 1.5; F=O.4
310
210
Ttme (5)
110
¥ IVCore: Ge=4.9
IICore: Ge=4.7
Clad: P=2.9; F=O.l
o10
VI Core: Ge=7.9/Clad: Ge=2.1; F=0.7
-=
Single-Mode Fibers1.3 umTemp.... 23°C
I --;~ -.....".Core: Ge=5.2; P= 1.5; F=O.3Clad: Ge= 1.6; P=0.7; F=0.6,...,-.~----...------
o-1
10
50
70
60 -
20
30 -
40 -
80
10
(J)(f)
o-''0Q)(.)
::J"0C
Figure 20. Recovery of radiation-induced attenuation insingle-mode fibers.
66

15
yNRL 860814
5
10<4
103
10
Single-Mode Fibers1.3 um @ -30 dBmDose =2000 radsTemp. = -35°C
210
1
10o
10
NRL 860815
-110
o
5
10 _
(,0(I')o-J
"0Q)
U:>"0c
Time (s)
Figure 21. Recovery of single-mode optical fibers.
67

510
L--__-----"I~__----:..I __~I _.__1 _~_I
o 1 2 3 410 10 10 10 10 .
-110
o
30
Single-Mode FibersVI 1.3 urn @ -30 dBm
,...... Dose = 2000 radsE Temp. = -35°C.::¥.
"'....O:J 20'0--~(f) VII(f)
0.-J
'00.1(.1
:3'0C 10
Time (5)
Figure 22. Recovery of single-mode optical fibers.
68

8
6
(I)())
o-J 4'0Q)(.);:,.'0C
2
r-------""-..-------------:.-------.......Stngle-Mode Fiber1.3 um (t -30 dBmDose =2000 radsTemp. = -35°C
o-1
10o
101
10 102 3
1004
105
10
Time (8)
Figure 23. Recovery of single-mode optical fibers.
69

obtained from another large supplier. The fiber losses vary from 7.7 dB/km for
the fiber VI (Figure 22) to 0.8 dB/km for fiber II-RH (Figure 21). (The
intrinsic loss of these fibers is about 0.5 dB/km at 1.3 jlm.) The long-term
(permanent or low dose rate) response of the fibers varies between 2.3 dB/km
for the IV fiber to essentially 0.0 dB/km for the II -RH fiber. The VI fiber
would clearly be unacceptable for these exposure conditions. The II-RH fiber
appears to respond such that sufficient system design margin could be allocated
to maintain continuous operation.
The recovery response of the fibers shown in Figures 21, 22, and 23
indicate that recovery from induced attenuation can be achieved in a time frame
of 10 to 15 min. The loss remaining 10 min following the radiation exposure is
an indication of the system recovery following a weapons detonation. The loss
(and slope) following 105 s is indicative of the response to low dose rate
fallout exposure. The slope at 105 s is indicative of long- term recovery
processes. It is generally true that the fibers with the higher losses have
flatter slopes and would therefore experience greater damage under low dose
rate fallout exposure. Note that, except for the two NRL and the II-RH fibers,
all fibers have at least 1.5 dB/km permanent loss at this dose of 2000 rads.
This exposure was assumed to be the maximum dose to be expected for fiber
buried 36 in (1 m) for either prompt or fallout conditions as deduced from
Glasstone and Dolan (1977).
Dr. Friebele has attempted to fit the recovery data observed in these
tests to a general equation for n- th order kinetics, where n > 1 (private
communication). Hopefully, his work will be published soon.
In an effort to determine whether the data obtained under the 2000-rad
exposure can be extrapolated to other exposure levels, the test on number II
fiber was repeated at 400 rads. Within the experimental accuracy, the data for
the 400 rad exposure were identical with the 2000 rad exposure divided by 5.
Thus, extrapolations from the 2000 rad dose level to much lower doses are
valid.
4.7 Conclusions
Radiation sensitivity of single-mode fibers doped with P in either the
core or cladding can be somewhat less than that of P-doped multimode fibers due
to the lower P content in the single-mode fiber. P-doping in the cladding has
been found to be deleterious to the radiation resistance of single-mode fibers.
70

No effect on the radiation response has been found for F doping in either the
core or cladding.
Sit).gle-mode fibers consisting of binary Ge-doped silica cores with pure
silica claddings were found to recover quite well. This leads to low net
induced loss observed during steady-state irradiation, low initial induced loss
immediately following steady-state irradiation, and recovery to near intrinsic
levels within a relatively short period of time. These fibers, such as the IV,
V, and VI waveguides (in Figures 20 to 22), r,epresent the best candidates for
deployment in applications where slight downtimes can be tolerated.
Preliminary studies of the temperature dependence of single-mode fibers have. -
shown that extremely high losses can be induced in binary Ge-doped silica core
fibers at low temperatures. P-doping tends to suppress this large temperature
dependence.
From this brief summary, it can be concluded that radiation resistant
fibers with reasonably short recovery times (10-100 s) are feasible. Pure
silica core fibers with no P-dopant in the cladding appears to provide a fiber
that will recover to near its intrinsic value in a reasonable time. The long
term (permanent or low-dose rate) induced loss response of the best fibers vary
between 2.3 dB/kIn for a standard fiber, representative of currently installed
systems, to a dB/kIn for radiation hardened fiber tested in the laboratory.
Commercially available fiber cables designed specifically for radiation
environments are just now becoming available. Examples are the I (RH) and
II (RH) radiation hardened fibers whose radiation responses are compared in
Figure 21. The II (RH) fiber appears to be the only commercially available
fiber that fully recovers in the 24-hour time span.
It seems clear that measurements are needed on each of the major long-haul
fiber waveguides already installed. Measurements by a government or other
objective (unbiased) laboratory under uniform conditions are'needed to assure
the comparability of the commercially available fiber cables.
There is work in progress on an Electronic Industries Association, Fiber
Optics Test Procedure (EIA FOTP-49) for radiation hardened fiber. A draft of
this FOTP was presented to EIA SC FO-6.6 in June 1987. Similar work is under
way in the International Electrotechnical Commission (IEC) that will be
coordinated with the EIA work. There was no agreement on failure mechanisms
that cause the radiation degradation as of February 1987. There is relatively
little comparability of measurements made at different facilities, and
71

considerable research may be needed before a satisfactory test procedure can be
agreed upon.
5. RADIATION EFFECTS ON FIBER OPTIC SYSTEMS
NSEP radiation environments include background radiation from naturally
occurring radioactive substances, potential hazards from nuclear power plants,
research and testing facilities, or nuclear transport accidents, and limited
exposure from nuclear attack. Since radiation effects represent one of the
means by which fiber optic common carrier systems may be degraded, it is
important to assess these environments.
5.1 Terrestrial Background Radiation
The rocks and soils of the Earth's upper crust contain varying
concentrations of uranium (U), potassium (K), and thorium (Th) , the three
primary sources of nuclear radiation in the terrestrial environment (Haber,
1987). Rough estimates of average concentrations of these radioactive elements
in the continental United States are 3 ppm U, 2% K, and 6 ppm Th. These were
used along with estimates of contributions from cosmic radiation and
radioactive fallout to calculate an average annual dose rate to a cabled fiber
buried at a typical depth of 1 m. It is expected that under normal ambient
conditions, the average dose rate for a buried fiber cable is about
150 mrad/yr. Haber derived an upper bound of 500 mrad/yr dose rate for such
buried cables based on probability field for uranium. She has also provided
locations and levels of enhanced concentrations from concentration maps and
aerial measurements.
5.2 Fiber Measurements (Low Dose Rates)
Haber indicates that AT&T used low doses of gamma rays to estimate a
fiber's sensitivity to nuclear radiation under the above ambient terrestrial
conditions. Cobalt 60 was used as a source to irradiate the fibers at 20°C at
a rate of 2.3 rad/h for a 100-rad total dose. The 20°C radiation
sensitivities of the standard single-mode fiber are 0.45 mdB/kffi-rad at 1.3 ~m
and 0.7 mdB/km-rad at 1. 5 ~m. The radiation hardened design has 20°C
sensitivities of 0.25 mdB/km-rad at 1.3 ~m and 0.15 mdB/km-rad at 1.5 ~m.
Linear extrapolation from the above tests was used to predict long-term
span losses in the average and maximum radiation environments mentioned above.
72

The environmental dose rate is four to five orders of magnitude smaller than
the low dose rate and the total dose is roughly one order of magnitude smaller
than that applied during the fiber tests. The effects of long-term recovery
and photo-bleaching are not taken into account in the extrapolations. Thus it
was. concluded that the long- term loss calculated above should be an upper
bound. Radiation loss of a fiber is a function of temperature. No attempt was
made to estimate the impact of temperature on the long-term added loss
calculations in the referenced paper.
Estimates of added long-term loss in both standard and radiation-hardened
fiber (developed by AT&T) were presented for 30-km spans at 20°C for the
1. 3 ~m and 1. 5 ~m windows over a 20-year life expectancy of such links (Note:
This standard fiber has Ge dopant in the core and the cladding is effectively
phosphorus free). The results are shown in Table 7.
Table 7. Added Span Loss for 30-km Span, 20-Year Exposure
Standard Fiber Radiation-Hardened Fiber
(A) (B) (C) (D)150 mrad/yr 500 mrad/yr 150 mrad/yr 500 mrad/yr
1.3 ~m 0.04 dB 0.15 dB 0.02 dB 0.08 dB1.5 ~m 0.06 dB 0.21 dB 0.01 dB 0.05 dB
These estimates assume that a full 30-km span would be exposed to the dose
rates shown. It is unlikely that even a large portion of such a span would be
subj ected to the dose rates shown. Therefore, it was concluded that excess
loss due to terrestrial radiation exposure on AT&T single-mode fiber is
negligible.
5.3 Radioactive Contamination from Nuclear Expl~sions
For purposes of this study, the radiation environment outside of the 2 psi
overpressure level from a nuclear explosion will be considered. It was
concluded in Section 2 of this report that only radiation from fallout needs to
be considered. The radiological characteristics of the early fallout from a
nuclear weapon are those of the fission products and any induced activity
73

produced (Glasstone and Dolan, 1977). An air burst is by definition, a burst
at such a height above the Earth that no appreciable quantities of surface
materials are taken up into the .fireball. By the end of 1 min after an air
burst, essentially all of the weapon residues in the form of small particles
will have risen to such a height that the nuclear radiations no longer reach
the ground in significant amounts. Thus, gamma radiation outside the 2-psi
overpressure zone appears not to be a threat for air bursts. The concern then
is for the radiation effects on systems that are near to and outside of the
2-psi overpressure zone of surface bursts.
The fission products constitute a very complex mixture of more than
300 different forms (isotopes) of some 36 elements. The early fallout consists
of particles that are contaminated mainly, but not entirely, with fission
products. Glasstone indicates that the dose rate from a fixed quantity of the
actual mixture decreases with time according to the following approximate rule:
for every sevenfold increase in time after the explosion, the dose rate
decreases by a factor of 10. For example, if the radiation dose rate at 1 hour
(or other unit time) after the explosion is taken as a reference point, then at
7 hours after the explosion the dose rate will have decreased to one-tenth; at
7 X 7 ~ 49 hours (or roughly 2 days) it will be one-hundredth, etc. This rule
indicates that after 1 week (7 days), the dose rate will be about one-tenth of
that after 1 day. This dose rate, normalized by the dose rate after 1 hour,
decays as shown in Figure 24a. This shows that the time dependence of dose
rate decay follows the expression:
R(t) ~ const x t- l . 2 . (5-1)
This dose rate decay dependence on time holds out to about 6 months (1. 58 x
107 s) after which the decay rate is significantly faster (see Figure 24b).
Assuming that the material remains fixed (is not blown around by winds, washed
away by rain, or other mechanisms), the accumulated total dose would be the
integral over time .of the dose rate. This is represen'ted by Glasstone and
Dolan (1977) as shown in Figure 25. (Approximate calculations for many of the
nuclear bomb effects can be made using a circular slide rule available as part
of the book by Glasstone and Dolan.) The dose rate and total dose calculations
made by these approximations presumably refer to the total number of
disintegrations that occur. This does not address the partition of the
radiation into neutrons and gamma ray energies. The residual gamma radiation
74

10 1
,-.~
..c
""iJ)
10 0"0«:IL
'-../
(])....«:I~
(])(Q -10 100(])
E.....r-.........c
10 -2 _:J
""~..c~.~
00"0«:tL~-"
(]) 10 -3....«:Ia:::(1)
0000
10
10 -4 L..- -..L..
-1 010 10
1DAY lW1( lMO--.-J__...l... --','---_L.
1 10 2 103
T1me After Explos1on (h)
Figure 24a. Dependence of dose rate from early fallout upontime after explosion (after Glasstone and Dolan,1977) .
75

r ...r::.......CIJ"0(0 -4L 10...."
0.).....(0
~
Q)CIJ0 -5Q 100)
E.r-
r-.....5:::1
10 -6.........,-..s.::....-....(I)"0(0L
'_J
Q) -7-'«:1 10~
Q)
CIJ0Q
6MO lVR 5VR 25YR l00YR-8
l. I 'i 1.110 I2 3 4 5 10 610 10 10 10
Time After Exploslon (h)
Figure 24b. Dependence of dose rate from early fallout upontime after explosion - continued (after Glasstoneand Dolan, 1977).
76

10".... l=.c::......*''2<I-......Il.) 8+-"'1Ja:::'1'V)00IJ.)
Ej::: 6......~c::t......"....
V)"0'1JI- 4-Q)
~0
«;.....0I-
2"0Il.)
+-"'1J.....;:t
E;:tt)t)
-<t 01&-2 10-1 0 1 '2
103
10 10 10
Time After Explosion (h)
Figure 25. Curve for calculating accumulated total dose from earlyfallout at various times after explosion.
77

is of primary concern since shielding will be required in most fallout
situations to reduce the radiation dose to an acceptable level.
5.4 Protection Factors from Gamma Radiation
Calculation of the attenuation of the gamma radiation from fallout is
different and in some ways more complicated than for the initial radiations.
The latter come from the explosion point, but the residual radiations arise
from fallout particles that are widely distributed on the ground, on roofs,
trees, etc. The complication stems from the fact that the effectiveness of a
given thickness of material is influenced by the fallout distribution (or
geometry) and hence depends on the degree of contamination and its location
relative to the position where protection is desired.
The formalism for exploring the impact of the geometrical distributions of
gamma radiation sources above a buried fiber optic cable has been explored by
Nesenbergs as part of this study.
Estimates of the attenuation of residual gamma radiation in various
structures are presented .in Glasstone and Dolan (1977) and reproduced here as
Table 8. These results are based partly on calculations and partly on
measurements with simulated fallout. The reciprocal of the dose transmission
factor in this table has been added and it is called the protection factor.
5.5 Some Estimates of Environment
Glasstone and Dolan (1977) indicate that it is possible to estimate a dose
rate over contaminated surfaces (and by inference below a contaminated surface
based on the above protection factors). He assumes that an area is uniformly
contaminated with any radioactive material of known activity (in gamma
megacuries = 3.7 X 10¹⁶ photons per second) at a given time and that the
material is uniformly distributed over an area of 1 square mile. The results
of the calculations are shown in Figure 26. The gamma-ray activity from the
fission products will vary depending upon the nature of the fissionable
material; however, it has been calculated that a reasonable average would be
about 530 gamma-megacuries per kiloton (kt) fission yield at 1 hour after the
explosion. The average photon energy also depends on the fissionable material,
but at 1 hour after the explosion an average energy of about 0.7 MeV is a
reasonable approximation. Thus, if all the fission products from a l-kt
fission yield were spread uniformly over a smooth plane 1 square mile in area,
78

Table 8. Fallout Gamma-Ray Dose TransmissionFactors for Various Structures
(G1asstone and Dolan, 1977)
Structure
Three feet underground
Frame house
Basement
Multistory building(apartment type):
Upper storiesLower stories
Concrete blockhouse shelter:9-in walls12-in walls24-in walls
Shelter, partly above grade:With 2 ft earth coverWith 3 ft earth cover
79
DoseTransmission
Factor
0.0002
0.3-0.6
0.05-0.1
0.010.1
0.007-0.090.001-0.030.0001-0.002
0.005-0.020.001-0.005
ProtectionFactor
5,000
3.3-1.7
20-10
10010
143-111,000-3310,000-500
200-501,000-200
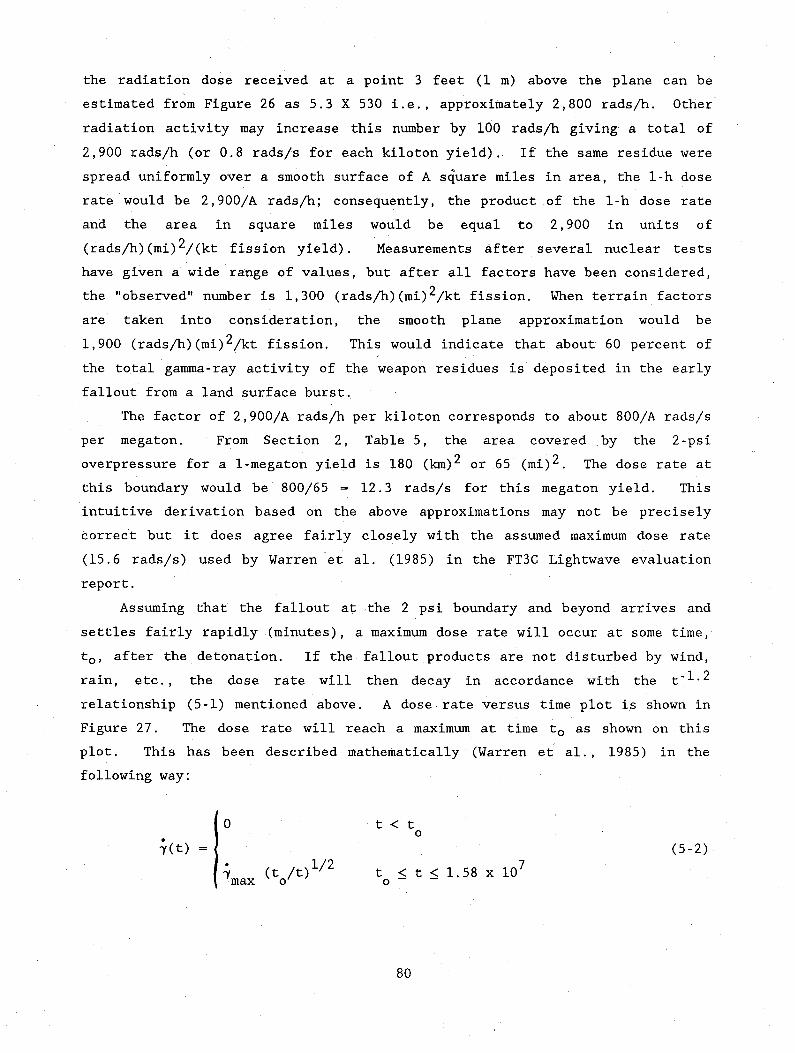
the radiation dose received at a point 3 feet (1 m) above the plane can be
estimated from Figure 26 as 5.3 X 530 i.e., approximately 2,800 rads/h. Other
radiation activity may increase this number by 100 rads/h giving a total of
2,900 rads/h (or 0.8 rads/s for each kiloton yield). If the same residue were
spread uniformly over a smooth surface of A square miles in area, the l-h dose
rate would be 2,900/A rads/h; consequently, the product of the 1-h dose rate
and the area in square miles would be equal to 2,900 in units of
(rads/h) (mi)2/(kt fission yield). Measurements after several nuclear tests
have given a wide range of values, but after all factors have been considered,
the "observed" number is 1,300 (rads/h)(mi)2/kt fission. When terrain factors
are taken into consideration, the smooth plane approximation would be
1,900 (rads/h)(mi)2/kt fission. This would indicate that about 60 percent of
the total gamma-ray activity of the weapon residues is deposited in the early
fallout from a land surface burst.
The factor of 2,900/A rads/h per kiloton corresponds to about 800/A rads/s
per megaton. From Section 2, Table 5, the area covered by the 2-psi
overpressure for a 1-megaton yield is 180 (krn)2 or 65 (mi)2. The dose rate at
this boundary would be 800/65 = 12.3 rads/s for this megaton yield. This
intuitive derivation based on the above approximations may not be precisely
correct but it does agree fairly closely with the assumed maximum dose rate
(15.6 rads/s) used by Warren et al. (1985) in the FT3C Lightwave evaluation
report.
Assuming that the fallout at the 2 psi boundary and beyond arrives and
settles fairly rapidly (minutes), a maximum dose rate will occur at some time,
to' after the detonation. If the· fallout products are not disturbed by wind,
rain, etc., the dose rate will then decay in accordance with the t- 1 . 2
relationship (5-1) mentioned above. A dose rate versus time plot is shown in
Figure 27. The dose rate will reach a maximum at time to as shown on this
plot. This has been described mathematically (Warren et al., 1985) in the
following way:
o
"(max(t /t)1/2
o
t < to
7t ~ t ~ 1.58 x 10
o
80
(5-2)

10ContaminationDensity of 1gamma-
8megacurie/sQuare mOe
,-.,.s::......(f)
"0«JL 6'-"'Q)+-'«JQ!Q)(f) 4,00
0.5
2
oo 6 12 18 24 30
Height Above Plane (ft)
Figure 26. Dose rates above an ideal plane from gammarays of variQus energies.
81

Q)......«:l0:::CD(1)
oD
~ max
Note: Maximum totaldose = area under curve
proximate time history before to
Actual time history before to
proximate·and actual time historiesnearly identical from t to 6 months
o
o to 2000 4000 6000
Time After Detonation (s)
'Figure 27. Typical free-field nuclear fallout radiationenvironment (after Warren et al., 1985).
82

where
Let
t = time after detonation in seconds
to = time in seconds when peak dose rate occurs
'Ymax = peak dose rate, rads/s.
500 s.
Then ~(t) 1733 t-1.2'Ymax(5-3)
Total dose of the fallout radiation is the area under the curve 'Y(t). Thus:
integrating (5-3) over the range t = 500 to t = 1. 58 x 107 s(6 months) gives a total radiation:
'Y = 2185 'Ymax' (5-4)
The authors of the AT&T report indicate that the additional radiation after the
6-month time period may add about 2 percent to the total radiation accumulated
during the first 6 months. The dose rate during this interval would be small
and can probably be neglected since fibers to be used in this environment would
have a significant recovery rate. For engineering purposes, then, the total
dose to be expected from the 12.3 rad/s dose rate estimated above is:
Total dose ~ 2185 (12.3) = 26,875 rads (5-5)
For purposes of the multitier specification, a total dose of 30,000 rads was
chosen.
5.6 System Degradation
Radiation exposure affects the transmission system in several ways. Gamma
radiation produces induced transmission loss in the fiber waveguides.
Section 4 of this report has dealt with this. There is extensive research
literature on these effects but little quantitative characterization of
commercially available fiber. Test results on commercially manufactured
radiation hardened fiber is just becoming available at this writing. Radiation
also affects the operation of the electronic components of the system. In the
case of photodiodes, radiation interferes with the photodiode's photogeneration
of electron-hole pairs. MOS and bipolar devices are also susceptible to
radiation.
83

System assessment was performed on the FT3C Lightwave system (Warren,
1985) by assessing the vulnerability of each individual component. This
approach was considered proper since the regenerator sections are arranged in
tandem, making the sections mutually dependent on one another. If a critical
component of one section fails, the system fails. The assessment process steps
included identifying the major elements and components of the system
susceptible to radiation, defining the radiation environment that the system
would encounter, and conducting radiation tests for fiber darkening/recovery,
photodiode susceptibility, and electronic device susceptibility.
System vulnerability was equated with the vulnerability of regenerator
sections that are minimally shielded and exposed to the strongest incident
radiation, operating at the lowest received signal power. If the electronic
devices survive, the system degradation in terms of BER depends on operating
wavelength, fiber type, bridge crossing length, and specified free-field
radiation environment. The conclusion was drawn that if single-mode fibers
were installed and operated at 1.3 J-Lm, transmission would be only moderately
degraded and would significantly improve after 10 hours for all bridge crossing
lengths and free-field radiation environments.
The methodologies used in relating the specific device or subsystem
degradation effects in the FT3C system evaluation to the BER performance as a
function of time have been incorporated into a computer program (Ingram, 1987)
by ITS. This program will allow the assessment of different fiber optic
systems having other radiation damage profiles. Thus new fiber waveguides that
have been radiation hardened can be considered for those segments of the system
where adequate depth of burial is not feasible. The program should be
particularly valuable in doing tradeoff studies on specific links that are
required to meet specified BER performance criteria. Much more detailed
descriptions of design and installation practices required to achieve the
several levels of hardening proposed in the multi tier specification are given
in the companion report by David Peach (1987).
6. FUTURE FIBER OPTIC SYSTEMS
Commercial fiber optic, long-haul systems being installed today use
single-mode fiber. The systems are designed to operate in the 1.3 J-Lm window.
The driver/receiver electronics operate at 417 or 565 Mb/s. One fiber is used
84

to transmit and one is used to receive. A full duplex system uses a fiber
pair.
One classification of systems is shown in Figure 28 (Keiser et al., 1985).
Note that generations one and two utilize multimc;>de fibers in the first and
second windows, respectively. The commercial systems mentioned above utilize
the second window and multifrequency lasers (typically about 2 to 4 nm spectral
width). The fourth generation systems indicated here could be achieved using
the multifrequency lasers and dispersion shifted fibers as described below.
6.1 Next Generation Systems
Several options exist for next-generation systems. Regenerator separation
distances for the current systems is generally about 30 km and is attenuation
limited (with a system margin of about 3 dB.) The fiber attenuation
coefficient at the 1.3 J.£m window is about 0.5 to 0.4 dB/km. These same fibers
have an attenuation coefficient at 1.5 J.£m of about 0.2 dB/km. Next-generation
(fourth-generation) systems will utilize this window and will permit
transmission of bit rates of 1.6 to 1.7 Gb/s over the same repeater distances.
This will permit the multiplexing of four of the present operational levels
onto one fiber. Only the final multiplexer and the demultiplexer plus the
electro-optic modulator circuitry are required to operate at the gigabit rate.
The remaining electronics can utilize the same hardware as that being installed
in the current system. Another option for increasing the throughput of each
fiber pair is that of wavelength-division-multiplexing (WDM). WDM can use
separate windows of the fiber for transmission at different wavelengths or,
ultimately, several channels can be multiplexed in one window. The rate per
channel would be equivalent to the present third- generation systems. Such
systems are not indicated on the chart. Recent announcements (Sanferrare,
1987) indicate that gigabit systems are about to be deployed.
6.1.1 Long-Wavelength Windows
The 1.3 J.£m window was selected for commercial development because of the
zero dispersion window for silica based fibers. This zero dispersion occurs
only at a very narrow band at 1.3 J.£m. It was mentioned in Section 4.2 above
that the wavelength at which this crossover (change from negative to positive
dispersion) occurs can be shifted by the use of suitable dopants.
85

j10
5th Generation (1.5 urn SM) Coherent
4th Generation
.... Single-Freq.~ser
10 2
Bit Rate (Mb/s)
3rd Generat jon---....... ( 1.3 urn SM)
2nd Generation ~MuJtifrequency
(1.3umtt1) ~
r---.-----_(1.5 urn SM)
(0.8 urnMM)10 L.,- -L----:!.._--.,..... -i ----J
1C1
ro.
E.::L......s::. 2~ 10cQ)
-JQ)
C.--J
Figure 28. Five generations of fiber optic systems(after Keiser, 1985).
86

When these· fibers are used at the 1. 5 j.£m window, material dispersion
becomes the limiting factor for the multifrequency laser driver. Two
approaches are being pursued to eliminate this dispersion limit. One is to
develop dispersion-shifted fibers that are optimized for least dispersion at
the operating wavelength in this window. This dispersion-shifted fiber permits
the use of multifrequency lasers as in the third-generation systems now in
operation. The second is to develop laser sources with very narrow spectral
widths « 10 kHz) as indicated in the fourth-generation systems of Figure 29.
(The latter narrow-bandwidth lasers are also required for fifth-generation
coherent detection systems mentioned below.) In addition to the shifting of
the zero dispersion, fiber waveguides can be dispersion flattened so that the
material dispersion (picoseconds/nm-km) is low over a broad spectrum from 1.3
to 1.5 j.£m. The significance of shifting the low dispersion region or
developing a narrow spectral width source is that gigabit bandwidths can be
achieved over the distances already established for the separation of the
regenerator stations.
6.1.2 Wavelength-Division Multiplexing
Commercial fiber systems are based on long-haul cables consisting of an
average of about 18 fiber pairs. Devices are being developed to allow full
duplex operation on each fiber. This is an optical directional coupler. If
these devices do not introduce too much insertion loss, the capacity of each
long-haul cable could be doubled by this technique. Another approach to
extending the capacity of each fiber is to use wavelength-division-multiplexing
(WDM) . Separate bands, in the same or different windows, may be used to
transmit information. The different channels can be separated at the receiver
by optical filtering techniques.
6.1.3 Direct Versus Coherent Detection
Current fiber optic systems are based on direct detection principles, that
is the detection of the presence or absence of an optical pulse. This requires
about 20 photons for a high probability of detection. The system sensitivity
is based on the signal to noise ratio (SNR) at the detector of the receiver.
This SNR is a characteristic of the receiver. Most fiber optic systems are
designed to provide bit error ratios (BERs) less than 10- 9 .
87

Fifth-generation fiber optic systems that will use coherent detection are
being developed. The laser source is modulated via frequency or phase
modulation in a manner similar to that used in radio systems. Heterodyne
detection at the receiver allows much greater sensitivity (- 20 dB) for a given
BER (Kobrinski, 1985). This allows much greater distances between regenerator
stations, or much higher capacity for the same regenerator separation. For
example, laboratory experiments (Li, 1987) have shown that 8 Gb/s rates over a
distance of 68 km are possible. Thus in fifth-generation upgrades to
commercial systems, it seems reasonable to multiplex four of the 1. 7-Gb/s bit
streams together and transmit 8 Gb/s over each fiber in existing installations.
Perhaps a more realistic use of these systems would be to develop very long
distance applications such as undersea cable with regenerator stations
separated by 400km. This would allow the placement of such stations on land
for all currently required routes.
6.2 Coherent Systems
Coherent fiber optic communication is certainly a challenging technology
that still requires more research and investigation. Data from experimental
systems indicate that theoretical system performances can be achieved. As the
trend toward higher data rates continues, coherent fiber optic techniques are
the only methods that can fully exploit the long-distance and wide-bandwidth
potential of fiber optic systems.
The technology for the fifth-generation systems is somewhat more advanced
than that required for the current direct detection systems. A very narrow
spectral bandwidth source is required. The fiber waveguides should have
polarization maintaining properties. Much of the electronics required will be
adaptable from existing radio communications technology.
Coherent fiber optic transmission techniques are similar to those used in
microwave systems. At the transmitter, the information is placed on the
carrier wave by altering the source's amplitude, frequency, or phase. The
signal is then carried over the medium. At the receiver, a local oscillator
locks with the incoming transmitted signal's phase. Both signals are mixed in
a nonlinear device, filtered, and the information is then recovered.
Figure 29 shows a ~ypical coherent fiber optic communication system. The
highly stable laser source emits a very narrow band of optical frequencies.
The optical wave of the laser source is temporally and spatially coherent.
88

--..-. 44 Detectoral- Duplexer //
IIr
~t~ ..
~
~ [..r' :..-0
Polar1zat1on .- :::;l)...,; ~
Control10...,;- ---or -or"-' .....
"CJ u
~to L
~C '.~
~:..-w
l,.; ~.IDQ
Local Automat1cOsc1llator ..... Frequency--Laser Control
~,
CO)I~ -.::- Opt1 C
F1be
tLaser
Source
Ampl1tudeor Phase
Modulator
LaserControl
Analog orD1g1tal Data In
Dr1veElectron1cs
00\0
Analog orD1 g1tal Data Out
Figure 29. A coherent fiber optic communication system.

This means that at a given time at a given point in space, the laser's field
will be in phase. By using the coherence properties of the laser's optical
carrier wave, information may be placed on the carrier wave by modulating its
amplitude, frequency, or phase. This is called coherent modulation. The
optical signal is then transmitted along single-mode optical fiber.
At the receiver, the incoming carrier wave is optically mixed with a local
oscillator wave emitted by a highly stable coherent laser. The nonlinear,
square-law detector detects the mixed optical signals as a single optical wave,
and converts it into an electrical signal. The resultant output electrical
current contains the square, sum, and difference frequencies of the transmitted
and local oscillator signals. Since the difference frequency is the lowest and
contains the desired information, it is more easily processed than the square
and sum frequencies that are filtered out. If the local oscillator and
transmitted signal frequencies are equal, then the difference frequency will be
zero and the information will be recovered at baseband. This process is called
homodyne detection. However, if the local oscillator and transmitted signal
frequencies are different, then the information must be recovered from the
difference frequency (or intermediate frequency) electrically. This process is
called heterodyne detection.
A coherent fiber optic system does not necessarily imply that coherent
demodulation is performed in the receiver. Rather, the term' "coherent" as
applied to fiber optic systems generally refers to any fiber optic system that
uses a laser source with a spectral linewidth considerably narrower than the
linewidth of the laser sources used in traditional intensity-modulatedjdirect
detection fiber optic systems.
6.2.1 Operational Advantages of Coherent Systems
In addition to the advantages that fiber optic communications have over
wire or microwave communications such as increased security, wide bandwidth,
lightweight, immunity to electromagnetic interference, and freedom from
electromagnetic pulse effects, coherent fiber optic communication systems have
additional advantages over intensity-modulatedjdirect-detection fiber optie
systems. Probably the most written-about advantage is increased receiver
sensitivity. Since the detector sees the combined local oscillator and
transmitted signal waves as a single wave, the signal detected at the receiver
may be greatly increased by raising the local oscillator power. This means
90

that only a very small amount of transmitted signal power has to reach the
receiver in order for the information to be re1:rieved. If the local oscillator
power is much greater than the transmitted signal power, shot-noise limited
detection will be achieved.
In a coherent fiber optic communication system, the receiver sensitivity
may increase by 10 to 19 dB over an intensity-modulated, direct-detection
(IM/DD) system depending upon the modulation format. In theory, any modulation
format used in radio can be used in coherent fiber optic systems. As shown in
Figure 30, a 10 to 25 dB improvement in receiver sensitivity is expected when
amplitude-shift-keying (ASK) modulation/ demodulation with heterodyne detection
is used. The best performance is predicted for phase-shift-keying (PSK)
modulation/demodulation with homodyne detection. The expected receiver
sensitivity is 19 to 34 dB better than for an IM/DD system. Figure 31 shows
the minimum detectable power required to achieve a BER of 10- 9 versus the data
rate for various coherent fiber optic systems.
As a result of the potential improvement in receiver sensitivity, the
transmission distance between regenerators can be significantly increased. This
is especially true at long wavelengths (1550 nm) where fiber loss is lowest.
Another potential advantage is that optical amplifiers may be easier to
implement in coherent fiber optic systems. A repeater could consist of a
simple optical amplifier such as a laser diode with optical fiber pigtails.
For short-distance links, the increased receiver sensitivity can be used
to increase the dynamic range of the system. A greater margin of loss can be
allowed in a given link.
Another advantage of coherent fiber optic systems is higher channel
capacity. Due to the very narrow optical bandwidth of the laser sources and
the wide bandwidth of the optical fiber itself, more channels could be
transmitted on carriers that are closely spaced in frequency. A thousand-fold
increase in channel capacity has been predicted when optical frequency
division-multiplexing (FDM) is used.
6.3 Coherent System Implementation
Coherent fiber optic systems are more expensive and complex to design and
build than IM/DD systems. Most of the additional cost and complexity is due to
the components used in the systems. For example, the lasers used as the
transmitter source and the local oscillator must be spectrally pure. Not only
91
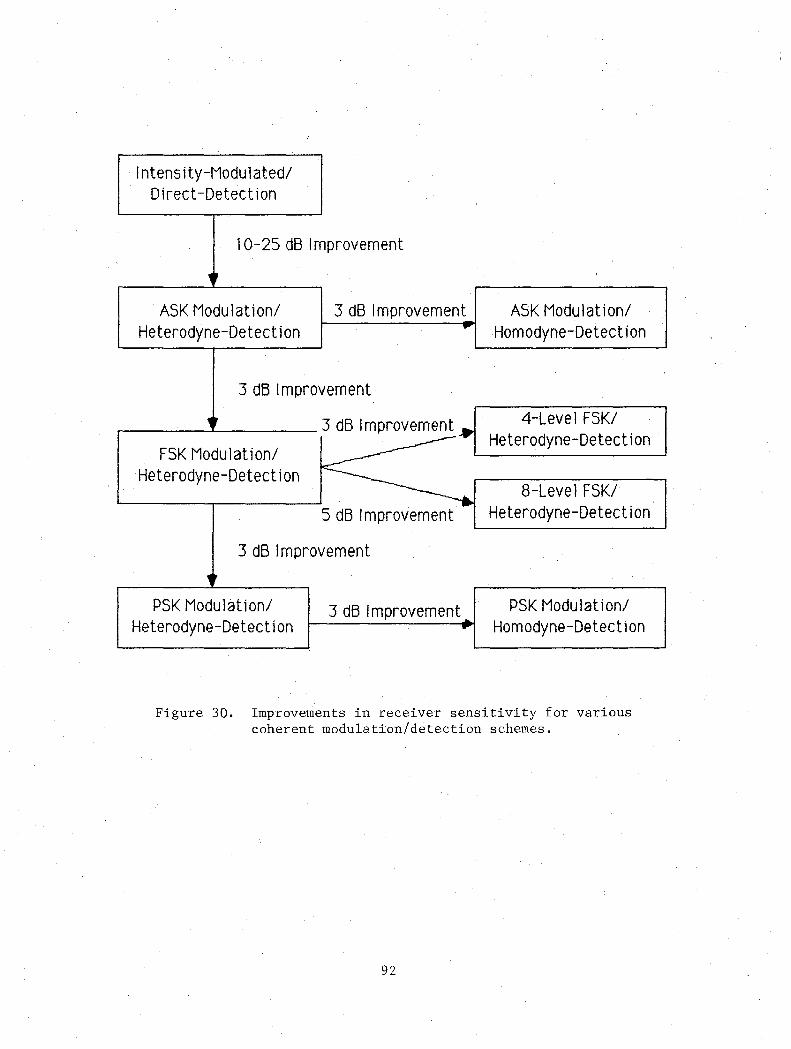
Intensity-Modulated/Direct-Detection
10-25 dB Improvement
"ASK Modulation/ 3 dB Improvement ASK Modulation/
Heterodyne-Detection. Homodyne-Detect ion
3 dB Improvement
"
R4-Level FSK/
FSK Modulation/Heterodyne-Detection
Heterodyne-Detection8-Level FSK/
5 dB Improvement Heterodyne-Detect ion
3 dB Improvement,
PSK Modulation/ 3 dB Improvement PSK Modulation/Heterodyne-Detection .. Homodyne-Detect j on
Figure 30. Improvements in receiver sensitivity for variouscoherent modulation/detection schemes.
92

-10
.....E -30lD"0-LQ)
~ PCM-IM Direct0a..Q),.....0 -50(Cl SK Heterodyne+oJu SK HeterodyneQ)+oJQ) SK HeterodyneQ
E PSK Homodyne;:,
E -70.....eL
---...one photo-electron/pulse-90 I
10M 100M lG lOG
Data Rate (blts/s)
Figure 31. Minim~~ detectable power required to achieve a BERof 10 versus data rate.
93

must the lasers emit optical power over an extremely narrow band of optical
frequencies, they must maintain their optical frequency stability for long
periods of time and over a wide range of temperature. At the receiver, the
local oscillator must lock with the incoming transmitted signal. The
polarizations of the two wave fronts must match very closely in order for the
system to work properly. Polarization-matching of the two waves can be
difficult. The detector itself must have a wide bandwidth and high quantum
efficiency for converting the low levels of received light into an electrical
signal. In addition, practical techniques for performing ASK, FSK, and PSK
modulation need to be developed.
The transmitter and local oscillator sources used in coherent fiber optic
communication systems must have a high degree of spectral purity and optical
frequency stability. A spectrally pure laser emits optical power over a very
narrow band of wavelengths. This band of wavelengths is called the spectral
linewidth. In 1M/DO systems, the laser's emission spectrum contains several
frequencies spaced approximately 1 nm apart. Each frequency may have a
spectral linewidth of around 0.1 nm. In a coherent fiber optic system, the
laser must be forced to emit at a single optical frequency. In addition, the
natural linewidth of the laser must be reduced. Phase noise due to spontaneous
emissions in the laser cavity may cause the natural linewidth to broaden. This
is particularly unsuitable for systems using frequency or phase modulation.
Thus, in order to use coherent modulation techniques, the unmodulated laser's
optical frequency must remain very stable over long periods and wide
temperature ranges while the laser is modulated. In order to achieve an
optical frequency stability of 200 kHz for a 1500 nm wavelength laser a
fractional stability of 1 in 109 is needed.
In order for a coherent fiber optic communication system to work properly,
the polarization states of the transmitted and local oscillator signals must be
nearly identical. If the signals are not matched, destructive interference
will occur due to the different polarization states. Excessive bit errors and
receiver fading may result.
There are two approaches to the polarization-matching problem. In the
first approach, polarization-matching is achieved by using a polarization
tracking receiver. Standard single-mode fiber is used as the transmission
medium.
94

In the second approach, specially fabricated single-mode fibers such as
polarization-maintaining single-mode fibers or absolutely single-polarization
single-mode fibers are used as the transmission medium. Polarization
maintaining single-mode fibers preserve the polarization state of the signal as
it travels through the fiber. Absolutely single-polarization single-mode
fibers force the optical signal to travel in only one polarization state.
6.3.1 Heterodyne/Homodyne Detection
Heterodyne or homodyne detection techniques are used in coherent fiber
optic communicatiop systems. The main advantage of heterodyne/homodyne
detection is that the receiver amplifier noise and photo-detector dark current
noise are effectively eliminated by optically mixing the transmitted signal
with a large local oscillator signal. At 1.3 p.m and 1.5 p.m wavelengths,
heterodyne or homodyne detection are the only methods by which shot-noise
limited detection can be achieved.
In heterodyne detection, the optical frequencies of the transmitted and
local oscillator signals are different. Figure 32 shows a block diagram of a
receiver using heterodyne detection. The local-oscillator optical signal is
combined with the incoming optical signal in a duplexer and detected. The
resultant electrical output signal contains the square, sum, and difference or
intermediate frequency (IF) between the two signals. Since the IF is lowest
and contains the desired information, the square and sum frequencies are
filtered out. Part of the filter's output signal may be sent back to the local
oscillator to stabilize the laser. The rest of the filter's output is
demodulated and sent to the decision circuitry.
In heterodyne detection schemes, the carrier-to-noise density increases as
the local oscillator power increases. However, a low-noise, front-end
amplifier and a high-power local oscillator with minimized AM quantum noise are
necessary in order to achieve an optimum carrier-to-noise ratio.
Receiver sensitivity using heterodyne detection is at least 10 to 15 dB
better than IM/DD systems. As shown in Table 9, PSK/heterodyne detection is
the most sensitive of the heterodyne detection schemes with only 18 photons per
bit theoretically required to achieve a BER better than 10- 9 .
Another advantage of heterodyne detection techniques over IM/DD techniques
is that a better BER can be achieved for a given signal-to-noise ratio.
95

In ~ ----... Photo- .. IF Amplifier •. 1 Dec1 s10n I..... Duplexer detector .. I - uemodul ator .
Fllter C1rcu1t IFl I
AF2I
PolarizationController
I '.
t vI Local Automat1cIOscillator - Frequency-..
i Laser Control
\00'\
OptlcalSlgnal F1 + F2
Figure 32. Optical heterodyne receiver.
Electr1 calSignal
Out
•

Table 9. Minimum Detectable Peak Power Level in Photonsper Bit for a 10- 9 Error Rate
~Direct
Heterodyne HomodyneDetection
Modulation
Intensity Modulation _.- -- - --- 21
Amplitude-Shift-Keying 72 36 - - --
Frequency-Shift-Keying 36 - - -- -- - -
Phase-Shift-Keying 18 9 --- -
In homodyne detection, the optical frequencies of the transmitted and
local oscillator signals are the same. Figure 33 shows a block diagram of a
receiver using homodyne detection. The loca.l oscillator optical signal is
combined with the incoming optical signal in a duplexer and detected. The
resultant IF is zero, and the electrical signal is recovered at baseband. The
electrical output of the baseband amplifier filter provides phase and frequency
control of the local oscillator laser.
Receiver sensitivity using homodyne detection is 3 dB better than in
heterodyne detection for the same modulation format. As shown in Table 9,
PSKfhomodyne detection is the most sensitive detection technique with only nine
photons theoretically required to achieve a BER better than 10- 9 . Homodyne
detection also has twice the data rate capability of a heterodyne detection
receiver for the same receiver bandwidth.
However, there have been indications that the linewidth requirements for
the laser source used in homodyne systems are much more stringent than for
laser sources used in heterodyne systems.
In addition, actual synchronization of the local oscillator wave with the
transmitted signal wave is difficult to achieve, particularly at low received
signal power levels.
97

ElectricalS1 gnal
BasebandSignal
• ! ... IBaseband IPhoto- I Decision- Duplexer • Amplifier -- detector I ... CircuitI Filter I
•FlI
r I
PolarizationIControll er I
i ~~
Local Phase andOsc11lator
..... Frequency...Laser Control
~
Op1:icalS1gnal
In
-0(Xl
Figure 33. Optical homodyne receiver.

6.3.2 Applications
Coherent fiber communication techniques are the only methods that can
exploit the potential long-distance and wide-bandwidth capabilities of optical
fibers. At the present time, the longest unrepeated transmission distance can
be achieved at l550-nm wavelength. The theoretical bandwidth of single-mode
fiber for wavelengths of 1550 nm to 1700 nm is 24,000 GHz.
Very long-distance, underwater, and terrestrial repeaterless links are
possible using coherent fiber optic communication systems. The number of
repeaters required for a transoceanic link can be substantially reduced by
increasing the transmission distance of each section of the link.
Fiber optic cables less than 300 km long can be used in underwater
communication links connecting either two on-shore locations or an on-shore
location with a platform located at sea. In such a configuration, no repeaters
are required--only the terminal equipment at the on-shore or platform locations
are needed. To upgrade to a higher data rate system, the terminal equipment is
simply changed.
Long-distance ground links 100 to 300 km long are another possible
application of coherent fiber optic systems. In a fixed installation or in the
field, this additional 15 to 24 dB link margin could be used to extend the
lifetime of a fiber optic system. Thus the system would be allowed a wider
margin to degrade before failure.
In a nuclear environment using a survivable fiber optic communication
system, a coherent fiber optic communication system is expected to recover more
quickly than an 1M/DO system. After a nuclear burst, the fiber attenuation
suddenly increases and then gradually decreases to a point where enough
detectable power reaches the photodetector. Since the receiver in a coherent
fiber optic system requires less detectable power than an 1M/DO system, the
coherent fiber optic system will resume operation sooner.
Coherent fiber optic communication systems are also suitable for short
distance applications. By using the wideband potential of this technology,
city-wide or local networks that provide CATV, interactive viewphone, or
teleconferencing facilities to many users in homes and offices are possible.
More channels can be distributed to more customers.
Because of the laser launch powers and receiver sensitivities of coherent
fiber optic systems, optical insertion losses of 40 dB or more can be
99

tolerated. This feature can be used to increase the optical switching and
branching capabilities of local area networks.
Coherent fiber optic techniques make possible true optical frequency
division multiplexing (FDM). Large numbers of channels can be frequency
multiplexed over a single-mode fiber. A possible military application is an
overlay-type system where different kinds of signals are transmitted. Such a
system might include a 20 Mb/s digital channel for backbone communications, a
video channel, and a 200 Mb/s digital channel for the computers in a local-area
network.
A multi-level-security (MLS) communication system is another potential
government application that utilizes the optical FDM capability of coherent
fiber optic systems. In an MLS system, one band of frequencies would be
dedicated to top-secret communications, another band of frequencies to secret
communications, and a third band would be used for unclassified communications.
6.4 Long Wavelength Optical Fibers
The ultimate limit of attenuation in optical fibers is set by Rayleigh
scattering losses as shown in Figure 9 of this report. This scattering loss
decreases as the reciprocal of the 4th power of the wavelength of the light
source. Thus, the attenuation limit at 1.5 jJm is significantly less than that
at 1.3 jJm. There is work in progress to develop materials with high
transparency at longer wavelengths, namely: 2 to 3 jJm. It is conceivable to
have ultralow-loss fiber that could increase repeater spacings 100 to
1,000 times what is possible today (Lay, 1986). Assuming that the engineering
of such low-loss fiber can be brought to a commercial (competitive) reality,
transmission loss in terrestrial systems may no longer be a factor. (Note:
Private communication from J. Friebele indicates that these ultralow-loss
fibers exhibit similar vulnerability to gamma radiation damage as do the
silica-based fibers.)
7. REFERENCES
Antinone, R. J. (1987), How to prevent circuit zapping, IEEE Spectrum 24,No.4, April.
Baack, C. (1985), Single-Mode Fibers, Optical Wideband Transmission Systems(CRC Press, Boca Raton, FL).
Bell, T.E. (1985), The main event, the decision to divest:inevitable?,IEEE Spectrum 22, No. 11, November.
100
Incredible or

Brode, H. L. (1969), C1ose- in weapon phenomena, Ann. Rev. Nucl. Sci. .§.,pp. 153-202.
BTL (Bell Telephone' Laboratories) (1975), EMP Engineering and DesignPrinciples, Second Printing, (Loop Transmission Division, TechnicalPublications department, Whippany, NJ).
Carter, W. W. (1984), EMP': What it is and what to do about it, Signal Mag.,June.
Dittmer, P., S. Clark, E. Dorchak, J. Schwarz, J. Lafferty, P. Dunn, ,F. Coffey,H. Wagnon, and W. Sweeney (1986), DNA EMP course study guide, The BDMCorporation, (BDMfW-85-1143-TR), Vol. II, May 27.
Dixon, F. (1985), World market forecastcommunications, 1985-2000, Proc. FiberMonterey, CA, June 17-18.
for lightwave components inOptics to the Year 2000,
Englert, T. J. (1987), Effectstutorial, NTIA contractorNo. PB 87-210308).
of radiationReport 87-38,
damageMay,
in optical fibers - -a62 pp. (NTIS Order
Friebe1e, E. J., K. J. Long, C. G. Askins, M. E. Gingerich, M. J. Marrone, andD. L. Griscom (1985), Critical review of technology, SPIE, OpticalMaterials in Radiation Environments, 541.
Ga1uszka, P. (1985), Unfazedby projections, carriers kindle the course oflightwave, Data Commun., (McGraw Hill), pp. 72-73, April.
Ghose, R. N. (1984), EMP Environment and System Hardness Design (InterferenceControl Technologies, Inc. , Don White Consultants, Subsidiary,Gainesville, VA 22065).
G1asstone, S., and P. J. Dolan, ed. (1977), The Effects of Nuclear Weapons,United States Department of Defense (U.S. Government Printing Office,Washington, DC 20402).
GSA (General Services Administration) (1986), Glossary of telecommunicationsterms, FED-STD-1037A, GSA Federal Supply Service, February.
Haber, J. B. (1987), Characterization of ambient terrestrial radiation for longhaul fiber optic transmission systems, Proc. MFOC 87, First InternationalMilitary and Government Fiber Optics and Communication Exposition,Washington, DC, March 16-19.
Horgan, J. (1985), Safeguarding the national security, IEEE Spectrum 22,No. 11, November.
Ingram, W. J. (1987), A program description of FIBRAM: A radiation attenuationmodel for optical fibers, NTIA Report 87 -216/NCS Technical InformationBulletin 87-22, June, [NTIS Order No. PB 87-230686 (report) orPB 87-230678 (report and floppy disk)].
101

Keiser, G. E., D. H. Rice, and S. White Quinn (1985), A review of coherentoptical communication, IEEE Military Communications Conference MILCOM 85,Boston, MA, October.
Kobrinski, H. (1985), Applications of coherent optical communication in thenetwork environment, SPIE, Coherent Technology in Fiber Optic Systems,568.
Lay, R. W. (1986), Breakthroughs drive communication systems' switch to fiber,(from an interview of David Thompson, Corning), Electron. Engr. Times,June 16.
Li, T. (1987), Advances in lightwave systems research, AT&T Tech. J. 66,Issue 1, January/February.
Mahlke, G., and P. Gossing (1987), Fiber Optic Cables, Fundamentals,Technology and Installation Practice, Siemens AktiengesellschaftWiley and Sons Limited, New York, NY).
Cable(John
Messenger, G. C., and M. S. Ash (1986), The Effects of Radiation on ElectronicSystems (Van Nostrand Reinhold Company, New York, NY).
Morriss, B. (1985), Industry-government joint planning for NS/EPtelecommunications, Signal 39, No. 12, August.
Nagel, S. R. (1986), Reliability issues in optical fibers, Proc. of SPIE 717-The International Society for Optical Engineering, Cambridge, MA,September 25-26.
NCS (1985), FT3C multi-mode optical-fiber communications system EMP test andassessment, Final Report, contract DAEA-18-75-A-0059-8Z0lAC, TIB 85-12,November.
Nesenbergs, M. (1987), Fiber optic networks and their service survival, NTIAReport 87-2l4/NCS Technical Information Bulletin 87-9, March, (NTIS OrderNo. PB 87-l86706/AS).
Peach, D. F. (1987), Multitier specification for NSEP enhancement of fiberoptic long-distance telecommunications network, NTIA Report (inpublication)/NCS Technical Information Bulletin 87-24, October.
Personick, S. D. (1985), Section 2.2: Glass and Fiber Making, Optical Fibers,Fiber Optics: Technology and Applications (Plenum Press, New York, NY).
Pittock, A. B., T. P. Ackerman, P. J. Crutzen, M. C. MacCracken, C. S. Shapiro,and R. P. Turco (1986), Environmental Consequences of Nuclear War, Vol. IPhysical and Atmospheric Effects (John Wiley and Sons).
Raiford, R. C. (1979), Some impact potential ofEMP, The Army Communicator,Spring.
Sanferrare, R. J. (1987), Terrestrial lightwave systems, AT&T Tech. J. 66,Issue 1, January/February.
102

Sims, R. (1987), HEMP hardened fiber optic repeater terminal, Proc. MFOC 87,First International Military and Government Fiber Optics and CommunicationExposition, Washington, DC, March 16-19.
Tipton, C. R. Jr. (Ed.) (1960), Reactor Handbook, Vol. 1, Second Edition(Interscience Publishers, Inc., New York, NY).
Warren, R. E., A. Beilis, and A. G. Stanley (1985), Assessment of nuclearfallout radiation on FT3C lightwave digital transmission system, FinalReport (Restricted Distribution), DNA Contract DAEA 18-75-A-0059-8Z01AC.
Wik, M., W. R. Stone, D. J. Gjessing, L. Lefeuvre, P. O. Luridborn,V. Mijulin,S. Schwartz, and F. L. Stumpers (1985), URSI factual statement on nuclearelectromagnetic pulse (EMP) and associated effects,Internationa1 Union ofRadio Science 232, March. (Note: This statement was prepared by acommittee as listed here. The chairman of the committee was Mr. Wik.)
8. BIBLIOGRAPHY
Barnes, C. E. (1985), Radiation effects on light sources and detectors, SPIE,Radiation Effects on Optical Materials, 541, pp. 138-149.
Dianov, E. M., L. S.Su1imov, and P. V.glass fiber-opticElectronics 13, p.
Kornienko, E. P. Niki tin, A. O. Ryba1 tovskii , V. B.Chernov (1983), Radiation-optical properties of quartz
wavesguides (review), Soviet Journal of Quantum274, March.
Fischer, T. A., and J. J. Wiczer (1984), Radiation response of radiationhardened Si photodiode incorporating a sinker diffusion, SPIE, FiberOptics in Adverse Environments II, 506, pp. 231-236.
Friebe1e, E. J., C. G. Askins, and M. E.' Gingerich (1984), Effects of low doserate irradiation on doped silica core optic fibers, App1. Optics 23,December.
Friebe1e, E. J., K. J. Long, C. G. Askins, and M. E. Gingerich (1984),Radiation response of optical fibers and. se1foc micro1enses at 1.3 p.m,SPIE, Fiber Optics in Adverse Environments II, 506, pp. 202-208.
Friebe1e, E. J. (1985), Radiation response prediction of single-mode fibers,Work Statement (Naval Research Laboratory, Washington, DC 20375), August.
Friebe1e, E. J., K. J. Long,C. G. Askins, M. E. Gingerich, M. J. Marrone, andD. L. Griscom (1985), Optical materials in radiation environments, SPIE,Critical Review of Technology, 506.
Friebe1e, E. J., K. L. Long, and M. E. Gingerich (1983), Radiation damage insingle-mode optical-fiber waveguides, App1. Optics 22, No. 11, pp. 17541757, June.
Friebe1e, E. J., K. L. Long, C. G. Askins, M. E. Gingerich, M. J. Marrone,D. L. Griscom (1985), Overview of radiation effects in fiber optics, SPIE,Radiation Effects in Optical Materials, 541, pp. 70-88.
103

Friend, G. (1985), The evolving long-haul telecommunications marketplace,Te1ecommun. 19, No.6, pp. 80j-80p, June.
Griscom, D. L. (1985), Nature of defects and defect generation in opticalglasses, SPIE, Radiation Effects in Optical Materials, 541, pp. 38-59.
Hopkins, A. A., R. E. Kelly, L. D. Looney, and P. B. Lyons (1984), Transientattenuation in optical fibers, SPIE, Fiber Optics in Adverse EnvironmentsII, 506, pp. 209-217.
Jinquji, K., and K. Okamoto (1980), Minimization of modal dispersion in gradedindex fibers over a wide wavelength range, J. of Optical Commun. 1.
Kan, H. K. A. (1985), Space environment effects on spacecraft surfacematerials, SPIE, Radiation Effects in Optical Materials, 541, pp. 164-179.
Keck, D. B. (1984), Fundamentals of fiber waveguides, A ~hort course given atthe University of California, Santa Barbara, CA, August.
Koge1nick, H. (1985), High speed lightwave transmission in optical fibers,Science 228, No. 4703, May 31.
Levy, P. w. (1985) , Overview of nuclear radiation damage processes:Phenomenological features of radiation damage in crystals and glasses,SPIE, Radiation Effects in Optical Materials, 541, pp. 2-17.
Lowdermilk, W. H. (1985), Effects of laser radiation on surfaces and coatings,SPIE, Radiation Effects in Optical Materials, 541, pp. 124-137.
Lyons, P. B. (1985), Fiber optics in transient radiation fields, SPIE,Radiation Effects in Optical Materials, 541, pp. 89-96.
Moerner, W. E. (1985), Laser light-induced physical processes in opticalmaterials: Persistent spectral hole-burning, SPIE, Radiation Effects inOptical Materials, 541, pp. 60-68.
Partin, J. K. (1985), Fiber optics in high dose radiation fields, SPIE,Radiation Effects in Optical Materials, 541, pp. 89-96.
Pruett, B. L., R. T. Peterson, D. E. Smith, L. D. Looney, and R. N. Shelton,Jr. (1984), Gamma-ray to Cerenkov-light conversion efficiency for puresilica-core optical fibers, SPIE, Fiber Optics in Adverse Environments II,506, pp. 10-17.
Rotter, M. D., and D. R. Jander (1984), Measuring transient radiation effectsin optical fibers, SPIE, Fiber Optics in Adverse Environments II, 506,pp. 18-21.
Schneider, W., U. Babst, O. A. Balk, and E. Hochauser (1984), Radiation-inducedlight emission in silica core fibers, SPIE, Fiber Optics in AdverseEnvironments II, 506, pp. 189-195.
Schultz, J. R., and H. N. Hodges (1984), EC-135 Fiber optic technology review,SPIE, Fiber Optics in Adverse Envirnoments II, 506, pp. 70-76.
104

Skutnik, B. J., and R. E. Hille (1984), Environment effects on hard clad silicaoptical fibers, SPIE, Fiber Optics in Adverse Environments II, 506,pp. 184-188.
Smiley, V. N., M. A. Peressini, and D. E. Whitaker (1984), Material dispersionmeasurements on fiber optic cables used at the Nevada test site, SPIE,Fiber Optics in Adverse Environments II, 506, pp. 2-9.
Soileau, M. J., E. W. Van Stry1and, and W.induced bulk damage to optics, SPIE,Materials, 541, pp. 97-109.
E. WilliamsRadiation
(1985),Effects
Laser lightin Optical
Statler, R. L. (1985), Radiation effects on solar cells, SPIE, RadiationEffects in Optical Materials, 541, pp. 150-163;
Utsumi, A., H. Hayami, H. Tanaka, H. Imai, and Y. Gono (1984), Radiationresistance of pure-silica core image guides, SPIE, Fiber Optics in AdverseEnvironments II, 506, pp.176-183.
Whitcomb, B. M., V. N. Smiley, R. L. Flurer, and L. K. Nelson (1964), Theapplication of commercial star couplers to increase signal dynamic range,SPIE, Fiber Optics in Adverse Environments II, 506, pp. 149-155.
Wiczer, J. J., C. E. Barnes, T. A. Fischer, L. R. Dawson, and T. E. Zipperian(1984), A1GaAs/GaAs radiation hardened photodiodes, SPIE, Fiber Optics inAdverse Environments II, 506, pp. 224-230.
Williams, R. T. (1985), Nature of defects and defect generation in opticalcrystals, SPIE, Radiation Effects in Optical Materials, 541, pp. 25-37.
105


FORM NTIA·29(4-80)
U.S. DEPARTMENT OF COMMERCENAT"L. TELECOMMUNICATIONS AND INFORMATION ADMINISTRATION
BIBLIOGRAPHIC DATA SHEET
1. PUBLICATION NO.
NTIA Report 87-227NCS TIB 87-26
2. Gov't Accession No. 3. Recipient's Accession No.
4 TITLE AND SUBTITLE,
NSEP Fiber Optics Sysiem Study, Background Report:Nuclear Effects on Fiber Optic Transmission Systems
7. AUTHOR(S)
Joseph A. Hull8. PERFORMING ORGANIZATION NAME AND ADDRESS
U.S. Department of CommerceNTIA/ITS.Nl325 BroadwayBoulder, CO 80303
11. Sponsoring Organization Name and Address
National Communications SystemOffice of Technology and StandardsWashington, DC 20305-2010
14. SUPPLEMENTARY NOTES
5. Publication Date·
November 19876. Performing Organization Code
ITS.Nl9. Project/Task/Work Unit No.
10. Contract/Grant No.
12. Type of Report and Period Covered
13.
15. ABSTRACT (A 200-word or less factual summary of most significant information. If document includes a significant bibliography or literaturesurvey, men/ion it here.)
The Na tiona 1 Communica tions System (NCS) is responsible for definingreasonable enhancements that could be applied to commercial common carrier (orcarriers '-carrier) fiber optic systems that will be leased or owned bygovernment agencies and which may be used for National Secur i ty/EmergencyPreparedness (NSEP) purposes. This report provides background excerpted frommany references used in the development of a multitier specification thatidentifies five levels of enhancement. (The multitier specification ispresented in a separate report.)' This report describes the nuclear environmentfor surface and in-atmosphere bursts outside of the blast region, wherebuildings and personnel would be expected to survive. In this environment, thevulnerabili ty of optical fiber waveguides to fallout radiation is a primaryconcern. An assessment of fiber darkening, based on a review of unclassifiedliterature, is presented. For exo-atmospheric nuclear bursts, the fiber opticsystem is exposed to High Ai ti tude Electromagnetic Pulse (HEMP) radiation.Unclassified levels of these nuclear effects have been obtained from publishedli terature. The character istics of future generations of optical fibersystems, as described in current literature, are outlined.
Key words: common carrier optical fiberradiation darkening; Nationalnuclear effects
systems; fiber optic systems; gammaSecurity/Emergency Preparedness;
17. AVAILABILITY STATEMENT 18. Security Class. (This report) 20. Number of pages
IZJ UNLIMITED. Unclassified 11519. Security Class. (This page) 21. Price:
0 FOR OFFICIAL DISTRIBUTION.
Unclassified
," u.s. GOVERNMENT PRINTING OFFICE: 1987-573-002/80,507 REGION NO.8
