nsiad-99-100 military infrastructure: real property management
TRANSCRIPT

GAOUnited States General Accounting Office
Report to the Chairman and Ranking Minority Member, Subcommittee on Readiness and Management Support, Committee on Armed Services, U.S. Senate
September 1999 MILITARY INFRASTRUCTURE
Real Property Management Needs Improvement
GAO/NSIAD-99-100


Page 1 GAO/NSIAD-99-100 Real Property Management
United States General Accounting Office
Washington, D.C. 20548
National Security and
International Affairs Division
B-280230 Letter
September 7, 1999
The Honorable James M. InhofeChairmanThe Honorable Charles S. RobbRanking Minority MemberSubcommittee on Readiness and Management SupportCommittee on Armed ServicesUnited States Senate
The Department of Defense’s (DOD) management of the maintenance of its properties has concerned the Congress because of the long-standing absence of accurate data for making funding decisions and increasing backlogs in infrastructure repairs. As requested, our review of real property maintenance (RPM) management focused on the properties that the services maintain and repair using RPM funds from DOD’s operation and maintenance (O&M) account.1 Specifically, we (1) analyzed how the services determine and prioritize maintenance and repair requirements and how they allocate resources to meet their needs, (2) identified promising practices2 in facility management that the services could consider, and(3) identified barriers to implementing promising practices and ways to address them.
To address our objectives, we sent questionnaires to 571 military bases and major commands3 worldwide; interviewed RPM personnel at 35 bases and commands nationwide;4 reviewed literature of RPM experts; and
1These funds cover expenses for a wide variety of property controlled by the military services, for example, barracks, administrative and training facilities, utility systems, runways, schools, and grounds maintenance. O&M RPM funds are not to be used for significant portions of property, such as family housing and medical facilities, which are paid for separately. RPM for many industrial-related activities is covered separately in contracts. O&M also covers civilian pay, fuel, supplies, repair parts, and military operations.
2Promising practices are not necessarily fully proven, but rather are those that appear to be designed logically to work well and that seem worthy of wider trial involving sound evaluation.
3We received responses from 529, or 93 percent. Major commands are the administrative entities for bases with similar missions, such as the fighter bases that are part of the Air Force’s Air Combat Command.
4A complete list of sites visited may be found in app. IX, Objectives, Scope, and Methodology.
Letter

B-280230
Page 2 GAO/NSIAD-99-100 Real Property Management
interviewed more than two dozen RPM experts and officials at U.S. corporate, university, religious and governmental entities. Appendix IX further describes our scope and methodology.
Results in Brief DOD does not have a comprehensive strategy for maintaining the services’ infrastructure. Rather, each service sets its own standards for maintaining infrastructure. As a result, the services differ in the way they rate property conditions, prioritize repairs, and allocate resources. For example, a barracks rated “satisfactory” by one service may be rated as “unsatisfactory” by another. Also, within each service, answers to our survey indicated that bases and major commands apply condition and/or criteria for rating repairs differently. As a result, the service headquarters cannot be certain that the most critical properties in need of maintenance and repair are targeted. Given incomplete and inconsistent data, and different RPM rating systems among the services, the Congress cannot be assured that it is funding maintenance and repairs that will provide the best return on its investment.
There is little relationship between identified RPM needs and the funds the services allocate for RPM. None of the services’ RPM spending plans provide sufficient funding to keep their total backlog of repairs at current levels; under new Navy plans, the total critical-rated backlog will crest in fiscal year 2003, and very slowly diminish thereafter.5 Although DOD instructed the services in July 1997 to fund RPM to enable them to meet75 percent of their RPM requirements by 2003, DOD removed that goal from an updated guidance in April 1999.6 Because the services’ headquarters consistently underfund requirements, base and command officials request funding to cover only a portion of RPM needs. For fiscal year 1997, major commands we surveyed reported they requested funding to cover an average of about one-fifth of the RPM needs of their bases and bases reported receiving funding equal to only about one-sixth of their needs. (In response to the draft version of this report, the Navy staff at its headquarters Facilities and Engineering Division stated that a message had been sent to major claimants and bases that all critical RPM needs should
5The Navy divides its backlog into “critical” and “deferrable”; only the critical backlog is officially reported to the Congress, although both types are tracked by the Navy.
6DOD, Defense Planning Guidances for Fiscal Years 1999–2003 and 2001–2005.
Letter

B-280230
Page 3 GAO/NSIAD-99-100 Real Property Management
be reported. However, this did not apply to non-critical RPM. Non-critical repairs can deteriorate into critical over time.)
Many promising practices exist in the RPM area, including
• establishing a single system for counting and categorizing inventory;• having a single, valid engineering-based system for assessing facility
conditions, with adequately trained personnel and multiple levels of review;
• prioritizing budget allocations based on physical condition, relevance of facilities to the mission, and life-cycle costing and budgeting;
• setting up a single property maintenance budget that is controlled by a central office with the power to shift resources to facilities in the greatest need;
• creating incentives to demolish or vacate excess space; • restricting the use of RPM funds for other maintenance purposes; and• charging an annual maintenance fee, based on square feet used, to
ensure adequate funding for facilities and to create an incentive for space conservation.
Two nonmilitary organizations—the Capital Needs Analysis Center of the Church of Latter-day Saints at Brigham Young University and Lawrence Livermore National Laboratory7—have facility management systems that collectively use all of these practices. Both report these practices enable them to maintain needed facilities at common levels, stabilize repair backlogs, accurately predict future RPM needs, satisfy customers that RPM funds are allocated fairly and based on actual need, and prepare credible budget requests. Similarly, a military organization—the U.S. Army Health Facility Planning Agency—is implementing a life-cycle investment strategy that it expects to reduce major repair costs by 50 percent and cut programming time from years to months.
None of the military services has implemented all the promising practices for RPM, and their adoption of these practices is hampered by several barriers, including
7The Laboratory, part of the University of California, is a management and operating contractor for the U.S. Department of Energy. It derives most of its budget from the Department and has a 5-year contract.

B-280230
Page 4 GAO/NSIAD-99-100 Real Property Management
• the use of RPM funds for other operations and maintenance purposes, complicating budget and contract stability;
• the lack of common standards for allotting space to certain types of facilities;
• the use of multiple budget accounts to pay for RPM, making it difficult to determine the cost of maintaining facilities;
• incomplete and noncomparable RPM data; • legal and administrative restrictions that, while having distinct
purposes, may hamper the services’ ability to cost-effectively address RPM issues; and
• insufficient training of personnel involved in assessing facility conditions.
DOD and the services have multiple options for addressing these barriers, including changing their facility rating and cost accounting systems. We are making recommendations to DOD to improve its management of infrastructure.
Background According to the Office of the Secretary of Defense (OSD), the military services are collectively responsible for maintaining more real property than any other entity in the world—more than 320,000 buildings (with about 2.1 billion square feet), tens of thousands of miles of roads, and1.1 million square yards of pavement (like runways). DOD estimates the plant replacement value8 (PRV) of this property at more than $500 billion. RPM—which includes daily maintenance, small repairs, and minor construction (projects under $500,000 or environmental and health projects under $1 million)—is funded through the O&M account. Facilities maintained by the O&M RPM funds include the services’ barracks, administrative space, classrooms, ports, hangars and runways, roads and railroads, day care centers, schools and churches, and utility structures and systems (but not the cost of utilities’ consumption). RPM for family housing, many industrial-related and military medical facilities is funded by separate accounts.
8No standard definition of PRV could be identified; however, the Federal Facilities Council cites two methods used by federal agencies in report no. 131, Budgeting for Facilities Maintenance and Repair Activities (Washington, D.C., 1996), pp. 10-11. In 1997, we defined PRV as “the cost to replace current facilities using today’s construction costs and standards.” See Defense Infrastructure: Demolition of Unneeded Buildings Can Help Avoid Operating Costs (GAO/NSIAD-97-125, May 1997), p. 7. Seeapp. VIII for a discussion of PRV-related issues.

B-280230
Page 5 GAO/NSIAD-99-100 Real Property Management
Each service headquarters sets the annual budget for maintenance and repairs based on funding constraints and other priorities. The budget is discussed among the headquarters, central facilities management offices, and bases and commands. Adjustments may be made if a base or command can prove that the funds to be allocated are insufficient to meet RPM needs.
Congressional concerns have been repeatedly expressed about DOD’s management of RPM. Despite net congressional increases of about$817 million for RPM over fiscal years 1992-98, the services’ reported repair backlog increased 164 percent during the same period in nominal terms.9 Covering more than 20 years, reviews by DOD, GAO,10 the Congressional Budget Office, and outside consulting organizations have found numerous problems with DOD’s management of its properties. (A list of related reports is at the end of this report.) These problems include the lack of an overall strategy for managing RPM; unreliable and inadequate data on facilities’ condition and inventory; lack of centralized data management and lack of access to basic data; insufficient funding to maintain facilities, in part resulting from moving RPM funds to other O&M accounts;11 and problematic service criteria for rating the condition of facilities or to allocate resources to facilities.
As a result of a 1989 review of its RPM activities, DOD stated that it would (1) collect RPM costs by facility investment category, (2) standardize reports on the backlog of maintenance and repairs, (3) institute 5-year maintenance planning, (4) standardize PRV computations, and (5) establish a meaningful goal for RPM investments.12 However, most of these actions
9Data provided by OSD. We did not validate service backlog estimates. Total reported backlog increased from $8.9 to $14.6 billion for fiscal years 1992-98. RPM increases by the Congress above requested amounts totaled $1.615 billion during this period, but decreases totaled $798 million, for a net plus up total of $817 million. For fiscal year 1999, according to OSD, the Congress provided a net increase of $455 million above the request for RPM, an amount equal to almost 57 percent of the total net increases of the previous 7 years. However, since these funds are only now being spent, the effect on backlog has not yet been determined.
10See High-Risk Series: Defense Infrastructure (GAO/HR-97-7, Feb. 1997), p. 10; Defense Infrastructure: Demolition of Unneeded Buildings Can Help Avoid Operating Costs (GAO/NSIAD-97-125, May 1997),pp. 3 and 21; and Deferred Maintenance Reporting: Challenges to Implementation (GAO/AIMD-98-42, Jan. 1998), pp. 32-34. Numerous other GAO reports on RPM problems date back to 1976.
11To prevent this practice, the Congress had included a statutory floor in each military service’s O&M section of DOD’s appropriation acts until the late 1980s (e.g. stating that “not less than” a certain amount “shall be available only for the maintenance of real property facilities”).
12DOD, Renewing the Built Environment, March 1989, Executive Summary.

B-280230
Page 6 GAO/NSIAD-99-100 Real Property Management
were not implemented at the time because DOD was concentrating on reducing its overall infrastructure through base realignments and closures. As noted in the Senate Appropriations Committee report on DOD’s fiscalyear 1992 appropriations,13 most of the management problems remained. To address the issues comprehensively, the Congress appropriated $50 million in fiscal year 1992 for an extensive pilot test of a system to evaluate the condition of all service facilities and to prioritize spending using a single set of criteria. Outside contractors developed an exhaustive condition assessment system with detailed standards and instructions that was tested at 10 military installations between July 1994 and April 1995. The services rejected the system (adoption was not mandatory), citing the estimated cost. However, no analysis was done to compare this cost to costs the services incurred for individual annual assessments.
Without an Overall Management Strategy, the Services’ RPM Is in Disarray
In the absence of an overall, comprehensive management strategy for maintaining the services’ infrastructure,14 each service has established its own criteria for assessing the condition of its properties and the urgency of repairs, prioritizing RPM needs, and deciding how much to allocate for RPM. As a result of the differences among the services’ systems, however, a facility’s condition may be rated as “satisfactory” by one service and “unsatisfactory” by another or might not be rated at all if the service rates a repair project’s urgency rather than a facility’s deficiencies. Furthermore, respondents to our survey reported weaknesses in their services’ assessment systems and a lack of trained inspectors and RPM personnel overall.
Even though service bases do annually assess facility conditions and estimate the costs of required maintenance, service headquarters fund maintenance and repairs at far less than the bases’ estimates of what is needed. Moreover, the major commands do not request the amount actually needed to accomplish required maintenance and repairs because
13S. Rept 102-154, pp. 79-80 (1991).
14DOD was to issue a strategic plan for infrastructure in early 1999; however, the plan has been delayed indefinitely, as funding intended for it was used for other purposes. We previously cited the absence of, but need for such a plan as well as measurable goals, milestones, and actions to specific DOD infrastructure problems in High-Risk Series (GAO/HR-97-7, Feb. 1997), p. 10, and in Defense Infrastructure (GAO/NSIAD-97-125, May 1997), pp. 3 and 21.

B-280230
Page 7 GAO/NSIAD-99-100 Real Property Management
they believe that their headquarters will not fund RPM at that level.15 This situation may lead to a bow wave of backlogged repairs, as facilities continue to deteriorate when they are not maintained properly. Consistently funding maintenance at levels below what is needed to maintain infrastructure vitiates the intent if not the letter of OSD guidance, which is meant to prevent further deterioration of infrastructure. In technical comments on the draft of this report, DOD stated that the April 1999 update of the Defense Planning Guidance for fiscal years 2001-2005 requires the services to fund RPM “to at least match” each year’s planned RPM spending that had been set forth in the fiscal year 2000 President’s budget Future Years Defense Program. However, since none of the services’ RPM funding plans for fiscal year 2000 will measurably reduce existing total backlog, the spending levels do not appear sufficient to keep the overall backlog steady.
Without data on the consistency of ratings of facilities across the services and a common standard by which to compare the services’ RPM facilities’ conditions, OSD and the Congress cannot reliably compare or prioritize the services’ budget requests for RPM. And if the services continue to delay maintenance on their facilities, costs for future repairs will increase.
Services’ Rating Criteria Are Different
The services’ rating systems differ in how they assess facility condition, rate the urgency of repairs, prioritize RPM needs, and allocate resources.16
• The Army rates facilities at three levels, from worst (red), to fair (amber), to best (green), using worksheets with both written criteria and illustrations. The Army’s Installation Status Report (ISR) provides color-coded summaries of conditions at bases and commands and for the Army as a whole, and its software generates the estimated costs of improving facilities. ISR summary data for every command and its component bases are maintained in an automated database and are accessible to facility management personnel at headquarters and to other authorized users.
15Although perhaps obvious, we mean the level of funding required to fully meet repair needs, rather than to partially address needs. In technical comments, the Navy had stated that its major claimants had based funding requests on the amounts needed to bring facilities to levels ranging from C1 (best) to C3. A C3 condition is not one in which all needed repairs have been made, since it is not C1.
16The service’s systems are discussed in detail in apps. I, II, III, and IV.
B-280230
Page 8 GAO/NSIAD-99-100 Real Property Management
• The Air Force rates facilities’ deficiencies with regard to their estimated impact on four mission areas, at three levels (critical, degraded, and minimal) in its Facility Investment Metric (FIM) system.
• The Navy uses an engineering-based assessment to determine facilities’ deficiencies, which it reports in the Annual Inspection Summary (AIS). Data from the summary is then used to rate the deficiencies’ impact on 28 mission areas at four levels, from has fully met demands (C1) to has not met vital demands (C4). These ratings are shown in the Navy’s Shore Base Readiness Report.
• The Marine Corps, a part of the Navy, uses its Commanding Officer’s Readiness Reporting System and, in addition, a version of the AIS. The system is modeled on the Navy’s Shore Base Readiness Report, rating readiness in 26 mission areas at four levels, from fully mission capable to not mission capable.
According to our survey, bases within the same service and between the services showed varying degrees of consensus with regard to how they ranked the reasons that facilities and/or mission areas received a “worst” rating. We grouped the responses from bases for eight criteria used to assign a “worst” rating into three categories—most important, moderately important, or least important reason for a “worst” rating for a facility or mission area. (Results for the Marines are not included because of the very few number of Marine bases that ranked these factors.) Figure 1 shows how the responding bases ranked eight criteria or factors in this regard.

B-280230
Page 9 GAO/NSIAD-99-100 Real Property Management
Figure 1: Bases’ Ratings of Importance of Criteria in Worst-Level Ratings
Source: Responses to question 6, GAO survey. Totals may not add exactly to 100 percent due to rounding.
As shown in figure 1, in terms of cross-service diversity, three times as many Army bases as Air Force bases (30 percent vs. 10 percent) rated “age exceeded guidelines” as a most important factor in assigning a “worst” rating. On the other hand, more than twice as many Air Force and Navy bases as Army bases (73 and 72 percent vs. 29 percent) cited mission impact as a most important factor in assigning a “worst” rating. Also, within the Army and the Air Force, bases lacked consistency on the
Air Force Army Navy
Severe physicaldeficiency
Age exceededguidelines
Configuration did not meetpurpose of structure
Configuration did not meet a goal
(e.g., restroom vs. latrines)
Significant safety/health/environmental defects
Appearanceseverely deficient
Inadequate space perguidelines
Conditions severelyimpede mission
Percent of respondents rating factor as most important
Percent of respondents rating factor as least important
Percent of respondents rating factor as moderately important
10 20 70 30 38 32 6 41 53
34 58 8 59 35 6 54 46 0
68 29 3 41 49 10 62 38 0
6 78 16 19 68 13 5 90 5
14 82 4 12 82 6 10 67 24
2 39 59 8 48 44 5 33 62
13 85 2 26 60 14 5 81 14
73 27 0 29 62 10 72 28 0

B-280230
Page 10 GAO/NSIAD-99-100 Real Property Management
importance of several factors leading to ratings of “worst.” For example,29 percent of the Army bases reported “conditions severely impede mission” as a most important reason for a “worst” rating, while 62 percent ranked it as of moderate importance. Similarly, 39 percent of Air Force bases rated “severe physical deficiency” as a most important factor, while 59 percent rated it as of “moderate importance.”
Bases within each service also showed mixed consistency about the importance of nine criteria for allocating funds for repair projects for facilities rated “worst” at their base. (See app.VI, table VI.1.) For example, 35 percent of Army bases cited physical condition as the most important criterion for determining RPM allocations, but 59 percent rated it as moderately important. Similarly, almost twice as many Air Force bases rated physical condition as moderately important as those citing it as the most important factor (63 percent vs. 36 percent). In the Navy, 19 percent of bases ranked a commander’s priority as a most important criterion, while more than two-thirds rated it as moderately important. In the Air Force, almost twice as many bases rated commander’s priority as moderately important as those that rated it most important (63 percent vs. 34 percent).
RPM Assessment System Has Several Weaknesses
In our questionnaire, we asked bases to indicate which weaknesses, if any, they associated with their facility condition assessment systems. Table 1 shows the percent of bases in each service that chose a given weakness.
Table 1: Weaknesses in Services’ C ondition Assessment Sys tems
Percent of responding bases that ch ecked weakness as relevant to RPM process
Type of weakness Army Air Force Navy Marines
Little or no linkage between condition assessments/ determination of requirements and RPM budget estimation 46 29 30 50
Little or no linkage between assessments/requirements and RPM allocation 61 39 41 56
Cost estimates generally not accurate 36 25 34 37
Ratings too subjective 30 34 40 56
Using one rating for multiple facilities oversimplifies conditions 51 37 38 37
Ratings not informative 53 32 27 25
Ratings too broad 32 30 28 44
Ratings not timely 15 14 22 44
(continued)

B-280230
Page 11 GAO/NSIAD-99-100 Real Property Management
Source: Responses to question 12, GAO survey. Vertical totals exceed 100 percent because more than one choice was possible.
Bases identified several weaknesses in their assessment systems. First, in all the services, respondents reported budget-related problems—that there is little or no linkage between condition assessments and/or the determination of RPM requirements with either RPM budget estimates or the final allocation of resources. Base officials told us that they were concerned that their major commands and headquarters do not adequately consider the bases’ identified needs in preparing RPM budgets or allocating resources. Also, 25-37 percent of respondents reported that cost estimates generated by condition assessments/requirements determination are generally not accurate.
Second, as also shown in table 1, many of the services’ bases identified four problems with their assessment systems. First, the criteria for condition assessment are too subjective, involving individual judgment. Second, the process of summing up ratings for a broad category (such as all community support buildings) with multiple facilities oversimplifies conditions. Third, the ratings (e.g., critical or degraded) do not make clear what is wrong with a specific facility (making it necessary to go back to the original paperwork). Finally, overall condition ratings are too broad (e.g., red, amber, and green). Substantial percentages among Army respondents also felt that the assessments lacked a robust engineering basis and overemphasized facility appearance.
In addition, when asked in a different question about ways to improve the RPM process, in each service except the Navy, nearly two-thirds of the respondents endorsed the idea of a system that places more emphasis on long-term, strategic maintenance planning and de-emphasizes annual assessments of facilities. Fifty percent of the Navy respondents endorsed this idea. Similarly, there was substantial agreement among bases that RPM funding should be based on facilities’ physical deficiencies (Air Force, 56 percent; Army, 53 percent; Navy, 48 percent; and Marines, 50 percent). There was even greater consensus that RPM funding should not be based
Percent of responding bases that ch ecked weakness as relevant to RPM process
Type of weakness Army Air Force Navy Marines
Assessments lack robust engineering base 40 25 18 19
Overemphasis on appearance 38 9 7 12
Others 21 25 18 25

B-280230
Page 12 GAO/NSIAD-99-100 Real Property Management
on a fixed increase above or below the previous year’s level (Air Force, 51 percent; Army, 59 percent; Navy, 61 percent; and Marines, 87 percent).
Survey responses from bases also indicated that bases lack procedures to ensure that assessments of facility conditions are valid and reliable, that is, that they actually reflect the facilities’ physical conditions. The responses are summarized in table 2.
Table 2: Percent of Bases Using Listed Methods to Ensure Condition Assessments Are Consistent
Source: Responses to question 10, GAO survey.
As table 2 shows, 55 percent of all survey respondents indicated that they had no formal standardized procedures to determine the reliability of inspectors’ ratings. Four percent reported that they used different inspectors for follow-up visits to verify reported problems.
Lack of Trained Inspectors Affects the Quality of RPM Assessments
According to our survey and discussions during visits to 35 bases and commands, training and resource shortages are an unresolved RPM problem for large majorities of service installations, and these problems constrain the quality of the assessment process. About 25 percent of survey respondents in the Army and the Air Force, 31 percent in the Marines, and about 51 percent in the Navy, reported that they do not provide or require some form of standardized training for personnel that assess the condition of facilities. Bases reported that 83 percent of the facility inspectors are building users who are not trained professionals such as engineers or craftsmen.17 Given this situation, we question how
Type of validation procedure Army Air Force Navy MarinesService-wide
average
No formal procedure used to ensure consistency of assessments, other than expertise/training of assessor 56 51 60 38 55
Some number of facilities are reinspected by different assessors to determine consistency with initial review 4 3 4 6 4
Random sample of facilities are reinspected by different assessors 23 7 7 19 12
Outside contractors used to validate initial ratings 2 1 6 13 3
17The Air Force bases reported that 86 percent of inspectors were building users; the Army, 82 percent; the Navy, 71 percent; and the Marines, 64 percent. Bases were asked to identify the qualifications of “persons who determine requirements or conduct assessments/inspections of facility conditions.”

B-280230
Page 13 GAO/NSIAD-99-100 Real Property Management
these inspectors can be expected to produce reasonably accurate and consistent ratings of facilities.
In our survey, many bases also reported shortages of personnel in the RPM area, sufficiently trained personnel, and personnel to carry out RPM administrative work. The responses are summarized in table 3.
Table 3: Percent of Bases Identifying Training and Resource Constraints
Source: Responses to question 11, GAO survey.
Insufficient RPM Funding The services’ plans for funding RPM could result in the further deterioration of infrastructure and an increase in backlogs of repairs. The Defense Planning Guidances since 1997 were intended, in part, to get the services to increase spending in areas considered as underfunded. The April 1999 guidance update for fiscal years 2001–2005 requires that RPM funding at least match the annual levels in the fiscal year 2000 President’s budget Future Years Defense Program while eliminating a previously established goal to meet 75 percent of RPM requirements. However, even if the service headquarters comply with the update, they do not plan to fund RPM at levels that will meet identified RPM requirements (both critical and noncritical). Furthermore, many bases and commands do not request funding to meet all their RPM needs and some receive uneven allocations of funds for RPM, relative to their identified needs.
Services’ Plans May Lead to Deterioration of Facilities and Increases in Backlogged Repairs
None of the services’ plans provide sufficient RPM funds to keep the backlog of repairs at current levels, as measured by their own rating systems. As a result, overall service infrastructure conditions may deteriorate over the next 4 to 5 years, although improvements in some specific type of facilities, such as barracks, may result from targeted spending. Delaying repairs is not cost-effective, as noted at a March 1999 congressional hearing, where an OSD official remarked that the lack of
Type of constraint Army Air Force Navy MarinesService-wide
average
Shortage of personnel for RPM 61 45 35 44 47
Shortage of trained personnel (i.e., with skilled craft or engineering expertise) 48 42 28 63 41
Shortage of resources—time, budget—to carry out assessments 72 61 71 75 67

B-280230
Page 14 GAO/NSIAD-99-100 Real Property Management
timely maintenance leads to expensive repairs in the future.18 Despite this situation, the services plan to fund RPM at varying levels as follows:
• The Air Force plans no funding for repair projects until fiscal year 2003; preventive maintenance is funded at 1 percent of PRV. The Air Force estimates that through fiscal year 2005, it will provide funding for only 40 percent of the repairs identified as critical or degraded.
• The Navy plans to fund RPM at 1.84 percent of PRV in fiscal year 2001, increasing that gradually to 2.59 percent by fiscal year 2005; under this plan, critical backlog will increase about 10 percent, from about $2.5 billion to about $2.75 billion in fiscal year 2003, and then begin to decline. While critical backlog in barracks will be virtually eliminated, according to the Navy, other facilities will continue to be at C2 and C3 levels,19 and noncritical backlog is not addressed.
• The Marine Corps estimates that by fiscal year 2005, backlogged repairs will increase 60 percent in dollar value.
• The Army plans to increase RPM spending from 64 percent of its requirements to about 84 percent over fiscal years 2000–2005, but because of the RPM requirements baseline the Army uses, it is unclear that this increase will stabilize backlog.20
Further backlog increases may produce a bow wave of more costly repairs in the future. It was estimated that the services’ reported backlog would increase by $2 billion (13.6 percent) in 1 year, to more than $16.6 billion in
18Prepared statement of Randall A. Yim, Acting Deputy Under Secretary of Defense (Installations), to Senate Armed Services Subcommittee on Readiness, March 10, 1999, p. 6.
19The Navy defines the C3 level as the one at which the condition of facilities permits meeting the demands of assigned mission “only marginally,” “but with major difficulty.” According to the Navy, the RPM funding levels for fiscal year 2001 are intended to bring aviation, waterfront operations, training facilities, and utilities to the C2 level (“has substantially met all demands”), “with all other facility categories at the C3 level.”
20The Army defines its RPM requirement as the “estimated cost for the minimum annual sustainment of facilities . . . at existing levels plus the cost of renovations that are not new construction.” The Army plans to fund this requirement on an upward slope; it estimates it will reach 84 percent of this requirement by 2005. According to the Army, however, it would today take about $14.8 billion to bring O&M RPM-funded facilities up to the highest level of its condition assessment system, the ISR. The Army requested extra annual funding of $1.4 billion to address these deficiencies, but it is slated to receive only $178 million annually, if it becomes available, or about 1.3 percent of total ISR-estimated needs. Therefore, it is unclear how backlog will be constrained. See app. I.

B-280230
Page 15 GAO/NSIAD-99-100 Real Property Management
fiscal year 1999.21 A contributing cause may be, as we reported in 1997, that total RPM spending decreased 38 percent during fiscal years 1987-96, while the services reduced the square footage they maintained only about10 percent during the same period.22
RPM Budgets Not Consistent With Requirements
The services’ future plans are a reflection of the services’ long-standing practice of failing to fund RPM at levels sufficient to meet identified total requirements. Responses to our survey showed little relationship between the known, identified RPM needs and the funds requested to address those needs. For example, major commands’ overall requested an average of20.4 percent of their bases’ total identified needs in fiscal year 1997.23 Similarly, bases reported receiving 16.2 percent of known RPM needs from their commands in fiscal year 1997. Of their needs, Army bases reported that they received funding equal to 15.4 percent; Air Force bases received 18.3 percent; Navy bases, 14.2 percent; and Marine Corps, 28 percent.
According to headquarters facility management officials of each service, funding RPM is not their service’s first priority. An Army official described it as the last of four priorities. The major commands and bases understand that this is the culture for RPM and have acted accordingly—as reflected in the data reported to us by the commands and the bases. For example, base officials said that in their view service headquarters do not adequately consider RPM needs identified during the assessment process in making decisions about budget and allocation of resources. In light of the lack of apparent connection between the assessments, requests, and actual subsequent RPM funding allocations, some base officials questioned the wisdom of expending resources on annual assessments.
21House Report 105-591, p. 48 (1998). We did not validate service backlog estimates. The calculation of changes in reported backlogs has become increasingly problematic since the Army’s method is different from that of the other services. The Army estimates backlog as the amount required to bring designated facilities to a higher level of condition according to its condition assessment system. The Army previously defined backlog as the unfunded cost of all identified repairs, regardless of their criticality or relevance to mission. The Navy reports only critical-rated project costs as backlog; it excludes noncritical “deferrable” repairs. The Air Force categorizes backlogs at three levels and reports only the most urgent top two as its backlog.
22Defense Infrastructure: Demolition of Unneeded Buildings Can Help Avoid Operating Costs (GAO/NSIAD-97-125, May 1997), p. 4.
23Request by Army, 9.3 percent; Air Force, 31 percent; Navy, 28 percent; and Marines, 30 percent. The overall average percentage was reduced because the Army’s identified needs were more than double the next highest of any service, and Army commands requested 9.3 percent of this total.

B-280230
Page 16 GAO/NSIAD-99-100 Real Property Management
In addition to the disconnect among RPM needs, requests, and allocations, responses to our survey suggest that the division of RPM funds among bases has been inequitable. Some bases reported allocations as much as 27 times the amount that other bases received relative to their needs. For example, for fiscal year 1997, bases in one Air Force command reported receipt of 7 percent to 191 percent of their needs; bases in one Army command reported receipt of 9 percent to 118 percent of their needs; and bases in a Navy command reported receipt of 3.5 percent to 39 percent of their needs. The scope of these differences suggests that funding is based on criteria other than need.
Promising Practices Could Help DOD Improve RPM Management
On the basis of experts’ recommendations and other criteria, we had discussions with almost 2 dozen nonmilitary entities about their facility assessment, planning, and budgeting systems.24 The other criteria included citations in the expert literature of entities with good reputations for RPM practices, size of the organization, and comparability of entities to the military services in terms of goals of maintaining infrastructure for long periods. Of these, we found two that have a set of particularly promising practices that bear consideration by the military services. These are (1) Brigham Young University’s Capital Needs Analysis (CNA) Center, Provo, Utah, and (2) the University of California’s Lawrence Livermore National Laboratory (LLNL), Livermore, California.25
Two Organizations’ Promising Practices
The practices used by CNA and LLNL are designed to ensure reliable and valid property assessments, rational prioritization of needs, equitable allocation of resources, and cost-effectiveness in terms of making repairs at the appropriate time to avoid the deterioration of facilities and thus more expensive repairs.
CNA and LLNL have incorporated the following six practices into facilities management, which they say have made maintenance management more efficient and cost-effective:
• established a single system for counting and categorizing inventory;
24App. IX contains a complete list of these experts and the organizations we queried.
25The CNA Center manages the worldwide facilities of the Church of Latter-day Saints at more than 7,000 locations, including 4 universities. The LLNL system encompasses 600 diverse buildings(6.2 million square feet) with a PRV of almost $3 billion.

B-280230
Page 17 GAO/NSIAD-99-100 Real Property Management
• have a single, valid engineering-based system for assessing facility conditions, using adequately trained personnel at multiple levels of review;
• prioritized budget allocations based on physical condition, relevance of facilities to the mission, and life-cycle costing and budgeting;
• set up a single property maintenance budget that is controlled by a central office with the power to shift resources to facilities in the greatest need;
• created incentives to demolish or vacate excess space; and• restricted the use of RPM funds for other maintenance purposes.
As discussed below, one of these practices—life-cycle planning—requires further explanation; and LLNL uses a seventh practice—an annual maintenance charge.
Life-Cycle Planning a Key Element to Managing Facility Maintenance
Life-cycle planning is a core element of LLNL’s and CNA’s management of facility maintenance. Under the life-cycle concept, a building’s useful life is limited by the durability of facility components such as electrical systems.26 The two organizations have created databases on facilities and their components (such as heating, ventilation, and air conditioning units) based on their inspections. With this data, the two organizations can estimate facility components’ remaining life cycles (taking into account previous results as well) and replace components only when necessary. For example, a component such as an air-conditioning system would be replaced only when its repair cost exceeded a given percentage of its replacement cost or it broke down so often that it was ineffective to repair it both in terms of cost and maintenance time.
With life-cycle data, both organizations can project peaks and valleys of future maintenance spending and estimate the RPM funding level required to sustain facilities through their life cycles. CNA budgets RPM based on a 40-year life cycle27 and a 4-year budget that it adjusts annually based on condition assessments and the resulting estimated future costs. The center states that the transparency of the life-cycle system and its objectivity in
26Sean C. Rush, Managing the Facilities Portfolio: A Practical Approach to Institutional Facility Renewal and Deferred Maintenance (Washington, D.C.: National Association of College and University Business Officers, 1991), p. 48.
27For more details, see app. VIII and Robert E. Hutson and Frederick M. Biedenweg, “Before the Roof Caves In: A Predictive Model for Physical Plant Renewal,” in APPA, Capital Renewal and Deferred Maintenance in Critical Issues in Facilities Management, vol. 4 (1989), pp. 12-29, and Managing the Facilities Portfolio, pp. 52-62.

B-280230
Page 18 GAO/NSIAD-99-100 Real Property Management
assessing RPM needs have helped reshape the culture of its component institutions; the change has permitted the center to base maintenance on real needs rather than on the internal influence of different entities within CNA. With this process, CNA as ensured overall systemwide minimum adequate conditions for all facilities; entities that choose higher standards must use external funding. Further, according to CNA, the use of life-cycle analysis has made its budget requests more credible, helping it to obtain adequate funding for true RPM needs.
Even though LLNL operates on a 1-year budget, as do most federal agencies and the military, it uses life-cycle data to prioritize RPM spending: that is, the components most likely to fail receive funding first. LLNL management has used the life-cycle process to demonstrate the need to adequately fund preventive maintenance and thus preclude costly component failures. Both LLNL and CNA also require departments and programs to use their own funds to pay for improvements that do not address a repair or maintenance need, such as replacing carpeting that is not worn out.
One government entity, the Army’s Health Facility Planning Agency (HFPA),28 uses life-cycle principles for facility management. HFPA has developed a costing and budgeting process based on life cycles that it is extending across 1,600 hospitals, clinics, and other health-related facilities worldwide. The agency prioritizes RPM spending based on a combined assessment of predicted needs over a life cycle, known physical deficiencies, and mission impact, and it targets funds for those facilities that serve the largest number of people. It assumes a 50-year facility replacement cycle and uses life-cycle estimates to optimize investments in operations, maintenance, repairs, and minor construction.29 HFPA reports that in the 5 years it has used life-cycle costing and budgeting, it has reduced its anticipated major repair costs by 50 percent.30
28HFPA is in charge of RPM for Army hospitals and clinics worldwide; its funding comes from the Defense Health Program, not from the Army’s O&M RPM account. HFPA also develops long-term strategic RPM plans and the methods used to assess the condition of facilities and allocation priorities.
29Army HFPA mission booklet, p. 4.
30Army HFPA mission booklet, second to last page. We did not validate the claimed savings but find that RPM experts emphasize that adequate preventive maintenance can reduce overall RPM costs by avoiding costly, catastrophic repairs resulting from neglect. Timely and adequate preventive maintenance is widely regarded as essential to making RPM cost-effective.

B-280230
Page 19 GAO/NSIAD-99-100 Real Property Management
Lawrence Livermore’s Annual Maintenance Charge
LLNL has another practice that stands out as potentially promising and cost-effective in managing facilities. It charges an annual fee of $6 per square foot for maintenance and repair, cleaning, grounds care, and waste disposal costs. According to Laboratory officials, the charge compares favorably to those incurred by other organizations for the same range of services. Also, external reviewers have twice examined the LLNL charge and found it to have been based on incurred costs. According to Laboratory officials, the charge has focused facility users’ attention on their maintenance costs and has, as intended, led to reductions in the amount of space claimed to be necessary. Through the fee, the Laboratory has generated sufficient revenue to pay for repairs, thereby preventing increases in its maintenance backlog. It has not reduced the existing backlog (at current rates) but does not consider this significant because the backlog includes deficiencies in buildings that are excess to its needs and that are being maintained at a minimum level.
Charging for maintenance by the square foot makes clear how much space costs, and such a charge could be a required component of any military base’s budget to create a minimum annual funding level to ensure adequate maintenance. Military entities that use working capital funds have a similar system in that RPM and other overhead costs are included in the rates that are charged to military customers for services rendered.
Barriers Hinder the Services’ Use of Promising Practices
None of the services use all of the promising maintenance practices we found at CNA and LLNL, and they would have to overcome several barriers to successfully adopt these practices. These barriers include the services’ differing cultures related to RPM standards for maintaining facilities, budget limitations and the low priority given to fund RPM, the lack of comparable and adequate data, the lack of common space allocation standards, and legal and administrative rules. These barriers would be a significant challenge to overcome; however, other organizations have faced similar challenges and met them.
Services’ Cultural Barriers DOD’s 1999 Annual Defense Report recognizes that base facility conditions affect quality of life and retention.31 At the same time, each service has different standards to which facilities are maintained. As a result, the
31DOD, 1999 Annual Defense Report, ch. 9, p. 10.

B-280230
Page 20 GAO/NSIAD-99-100 Real Property Management
services have created widely varying living and working conditions. For example, the Air Force emphasizes high-quality conditions in part because Air Force bases are collocated with their platforms (their aircraft). However, Air Force RPM spending plans, as well as those of the other services, permit increases in backlog, including critical-rated repairs, over the next several years.
RPM Budgeting Barriers
Migration of O&M RPM Funds The services have long used RPM funds for other O&M purposes (such as unfunded emergency military operations), moving funds from the RPM account for other purposes considered more pressing. Although the RPM funds are generally returned toward the end of the fiscal year, urgent repairs may be delayed if contracts are canceled. Thus, the flexibility afforded by fungibility makes cost-effective planning and management of RPM problematic. Migration or even the outright reduction of planned funding also greatly hinders the use of life-cycle costing and budgeting. Although the Army’s HFPA uses life-cycle principles to assess its facilities and to plan its RPM budgets, its ability to implement its plans was compromised in fiscal year 1999 by the arbitrary movement of its RPM funds to other accounts. As noted, both LLNL and CNA prohibit RPM fund migration because it creates budgeting and contracting instability.
Budget Process There is little, if any, clear connection between the detailed assessments of actual repair needs made at the base level and subsequent RPM budget requests or allocations. While RPM needs are reported by bases and major commands to headquarters, the service headquarters have funded only about one-sixth of the total known RPM needs, according to the budget data reported on the surveys. Moreover, we were told that commanders do not request the full amounts needed, knowing that funding will never be provided at those levels.
Federal Budget Cycle The single-year O&M budget constrains each service; all are barred from accumulating reserves to address future, predictable surges in repair needs. However, some organizations that are similarly constrained, such as LLNL and the Army’s HFPA, use life-cycle analyses for planning purposes to set RPM budgets at levels sufficient to address predicted RPM needs.
Multiple Accounts Military RPM is paid for from multiple accounts, some of which are quite large in dollar terms (e.g., military family housing, industrial activities

B-280230
Page 21 GAO/NSIAD-99-100 Real Property Management
under working capital funds, hospitals and health clinics) and not included in O&M. For example, the Army pays for RPM from 27 different accounts; O&M RPM accounted for just 55 percent of the Army’s expenses related to real property maintenance in fiscal year 1997. In addition, the Center for Naval Analyses found that the Navy had 110 different accounts for RPM use in 1995. Navy O&M RPM applied to just 45 percent of the estimated total of Navy plant value in 1995.32 As a result of these multiple accounts, funding for RPM is fragmented, creating problems in tracking how much is actually being spent.
Barriers Created by Incomparable, Inaccessible, and/or Incomplete Data
The services have different coding schemes to record their inventory of facilities; as a result, this information across the services is not comparable. In addition, inventory data are often inaccessible and/or incomplete. Only the Army published an annual report—called the Annual Summary of Operations (now discontinued)—that specified spending per square foot at every base worldwide, by type of facility and by different type of maintenance.33 The Army’s database contained separate costs in standard metrics (e.g., per square foot, per railroad mile, per square yard of pavement) for 113 different facility types and RPM-related activities. The Air Force and the Navy (and, the Marines, whose inventory is recorded in the Navy’s database) already have large property inventory databases, but they are neither on-line nor nearly as detailed as the Army’s in terms of RPM-related spending categories.34 In addition, OSD has not required the Navy to fully fill out budget exhibit data sheets, making it impossible to compare Navy RPM spending to the other services’ spending on aper square foot basis.
32Ackerman, Glenn, et.al., The Backlog of Maintenance and Repair: Preventing Its Growth and Measuring Its Impact, Center for Naval Analyses (Alexandria, Va.: Apr. 1995), p. 7.
33Department of the Army, Directorates of Public Works, Annual Summary of Operations, for any fiscal year through 1997. We found no comparable report by other services. The Army’s Installation Support Center reports that the requirement for publishing the annual summary has been withdrawn, as of fiscal year 1998, and that no comparable report will be forthcoming. The report was also available on-line.
34Although the Army’s database is more comprehensive, it requires greater clarity regarding who is paying for what, and over what time period, since RPM expenditures by DOD entities for which the Army has technical responsibility are listed as Army spending, when in fact the spending is by non-Army entities and is actually reimbursed. For example, at one base, we found that an intelligence entity made extensive renovations through RPM at an annual cost of $8 per square foot (four times more than the Army average for comparable space), and the cost was recorded as Army RPM spending. Although reimbursed, the spending was averaged into Army accounts, and the $8 cost noticeably increased the average cost per square foot for both that base and for the command in which its spending was averaged.

B-280230
Page 22 GAO/NSIAD-99-100 Real Property Management
Without valid, reliable data, OSD and the services cannot adequately evaluate the cost-effectiveness of real property management or even know how much is being spent on RPM. A March 1998 Logistics Management Institute analysis found that during the Quadrennial Defense Review (QDR), DOD analysts and managers often worked with databases 20 years behind modern systems and practices used in private industry. The Institute noted that the databases “lacked the capability, flexibility, and responsiveness to meet analysts’ needs.”35
In April 1999, OSD issued a cost factors handbook for facilities that reduced about 3,000 service facility category codes to about 400 and that reports average RPM costs per square foot for each of these codes, as well as new construction costs per square foot. These were based on commercial cost-estimating guidelines compiled by multiple expert sources, including the Building Owners Management Association, the International Facilities Management Association, R.S. Means, Whitestone, and the Army Cost and Economic Analysis Center.36 OSD intends to use these cost factors, once validated, to show the services the level of spending required to sustain facilities. However, the services have not yet decided whether to accept the revised facility category codes.
Barrier Due to Lack of Common Space Allocation Standards
The services set their own space standards for facilities and workers (e.g., the Army allocates 162 square feet per administrative worker; the Navy and the Marines allocate 110 to150 square feet). Without common standards, it is difficult to constrain the use of space, including identifying “excessive” use. (The Army uses space standards to determine RPM funding and penalizes bases that have excess space.) Although some facilities will always be service-unique (e.g., nuclear submarine repair facilities; intercontinental ballistic missile silos), many (such as barracks, standard classrooms, administrative space, and family housing) are common across the services.
Legal and Administrative Barriers
Certain laws and administrative restrictions can hamper the services’ ability to cost-effectively address RPM issues, even though they have other
35Gerald W. Westerbeck and Jordan W. Cassell, Infrastructure Planning and Real Property Management: New Facility Category Coding (Logistics Management Institute, McLean, Va.: Mar. 1998).
36DOD Facilities Cost Factors Handbook, DOD (Apr. 1999), p. 2.

B-280230
Page 23 GAO/NSIAD-99-100 Real Property Management
important purposes. For example, the National Historic Preservation Act37 places restrictions on the demolition of some buildings and imposes potentially costly standards of repair on some historic structures. At one base, for example, decorative fireplace tiles in officers’ homes were deemed historic, and replacements had to be ordered from England because no source for them could be found in the United States. At another base, windowsills for “historic” buildings required repair by craftsmen with special certification. However, the base could not afford the specialist craftsmens’ rates and chose to let the sills continue to fall apart. Under the McKinney Act,38 the services must rate properties slated for demolition in the contiguous 48 states, Alaska, and Hawaii, to determine their potential utility to house the homeless; in fiscal year 1998, the Army rated nearly 9,900 buildings for this purpose, including facilities at remote locations.
Conclusions and Recommendations
In the absence of a sound DOD strategy for managing the upkeep of its infrastructure, the services use different methods and criteria for assessing the condition of properties, prioritizing maintenance and repair needs, and allocating resources. Without standard assessment criteria, DOD cannot compare maintenance costs or facility conditions across the services. This hampers the development of a sound strategy for managing the upkeep of the military’s infrastructure. Moreover, the services cannot ensure that their ratings of facilities’ conditions or urgent repairs are valid or reliable either at individual bases or within each of the services because facility assessors do not apply their service’s criteria consistently. As a result, DOD does not have accurate and comparable databases on facility conditions, mission impact, and repair costs, and the Congress cannot be assured that it is funding maintenance and repairs that will provide the best return on its investment.
Bases report little connection between their efforts and actual budget allocations from their headquarters. Furthermore, RPM funds are reallocated for non-RPM purposes. Given the uncertainty and instability in RPM funding, contracting and rational planning for maintenance are made
37The National Historic Preservation Act (16 U.S.C. §470h-2) governs the preservation of historic buildings and can prevent the services from demolishing a historic building.
38The McKinney Act (16 U.S.C. §11411) requires DOD to work with the Department of Housing and Urban Development to determine whether unused or underused facilities scheduled to be demolished are suitable for use by the homeless.

B-280230
Page 24 GAO/NSIAD-99-100 Real Property Management
more difficult. When maintenance is deferred, facilities further deteriorate and become more expensive to repair.
DOD has the opportunity to improve its infrastructure management through the adoption of promising practices already in place in the private sector. We recognize that barriers to implementing these practices exist and that DOD will face challenges in overcoming some of these barriers. However, in the long term, the adoption of sound standards, measures, and processes will help DOD maximize its RPM investment and ensure that needed facilities are adequately maintained, and those that are unneeded are removed from inventory. Development and issuance of a meaningful, comprehensive cross-service strategic plan is essential to eliminating the disarray in the management of the services’ infrastructure. Such a strategic plan should provide for effective and equitable methods to connect actual repair needs to budget allocations to repair and maintain those facilities that are essential to the multiple missions of most bases, from operations to community welfare.
To improve DOD’s RPM management and address barriers to change, we recommend that the Secretary of Defense
1. fund the development of DOD’s strategic facilities plan and
2. develop a cross-service integrated strategy, in close coordination and consultation with the heads of facilities infrastructure of each service, to comprehensively address RPM issues; the strategy should provide, at a minimum, for
• uniform standards that set the minimum condition in which military facilities are to be maintained and standardized condition assessment criteria;
• standard criteria by which the services are to allocate space for different types of facilities (e.g., barracks, classrooms, administrative buildings) and against which RPM funding allocations will be measured;
• standard criteria for inventorying DOD and service property (except for relatively few service-unique facilities);
• computerized, on-line inventory and cost databases that permit meaningful comparisons, across and within the services, of RPM spending by type, size, and location of facility and RPM activity, including direct data access by OSD;
• standard cost accounting methods by which the services will record and track their RPM expenditures so that they and DOD know how much is

B-280230
Page 25 GAO/NSIAD-99-100 Real Property Management
being spent, where it is being spent, and on what type of facility or RPM-activity it is being spent, by common metric, using the Army’s Directorate of Public Works’ Annual Summary of Operations report (published through 1997) as a potential model;
• the identification of priorities for the services to use to explicitly link needs assessments with resource allocations and tracking systems that show whether or not identified high priority needs are allocated the funds intended for them by the Congress;
• mandated training standards (curriculum and hours) for all those involved in condition assessment and ratings of repair urgency; and
• the services’ adoption of a comprehensive, valid, engineering-based assessment system that incorporates life-cycle planning into facilities maintenance based on the well-developed methods already used by nonmilitary entities.
In addition, the Department’s RPM strategy needs to deal with the issue of funding instability, particularly the migration of RPM funds to non-RPM uses and the lack of RPM reserve funds. In this regard, the Department should consider the feasibility of adopting the promising practices identified in this report. To the extent that adoption of any of these practices would require changes to existing law, we recommend that the Department develop a legislative proposal for submission to the Congress.
Agency Comments and Our Evaluation
DOD stated that, overall, our report provides a good review of the Department’s real property maintenance program. In addition, it stated that our survey results provided the Department feedback on efforts to improve existing policy and methodologies.
DOD concurred or partially concurred with 9 of 12 components of two overall recommendations, nonconcurred with 3 of the 12, and provided a number of comments that it characterized as technical. Where appropriate, we made minor changes and clarifications in responses to these technical comments. However, we believe that some of the agency’s comments warrant further discussion.
DOD believes that our report does not give credit to the services for their accomplishments in better defining their RPM requirements and determining RPM funding allocation. DOD also stated that it has previously examined some of our recommendations but did not implement them because—in the case of condition assessment surveys—of their high cost or because of “policy decisions regarding devolution of DOD-wide

B-280230
Page 26 GAO/NSIAD-99-100 Real Property Management
standards or establishment of working capital funding.” DOD also expressed the view that “anomalies of the survey results may be attributable to misunderstandings of the survey instrument by installation level personnel rather than an indicator of a lack of clear policy for field activity personnel.”
With regard to crediting the services’ efforts to better define RPM requirements, we recognized the services’ efforts in our report. We analyze the systems used by each service in detail, with a separate appendix on each system, citing the strengths we found, such as the Army’s annually published RPM inventory database. We also noted advanced techniques for RPM used by the Army’s Health Facility Planning Agency, which could be used as a model by other service branches and other Army components.
With regard to the cost of implementing a DOD-wide standardized Condition Assessment Survey (CAS), we found that no cost comparison had been made by DOD of a CAS to the systems used by the services when a CAS was field tested in the early 1990s. Moreover, we note that without a standard CAS, conditions, mission impact, and inventory data cannot be compared from one service to another and, therefore, DOD cannot prioritize the RPM needs of the services.
We do not agree that answers to our questionnaire were due to “misunderstandings of the survey instrument.” DOD does not cite any particular issue on which they believe personnel were confused by the survey. In order to eliminate potential misunderstanding in the survey instrument, we pretested it at 15 Army, Navy, and Air Force bases and commands, and provided for its review by each services’ headquarters facility management staffs. Revisions were made based on feedback from the field pretests and from the headquarters’ RPM experts. Moreover, at some bases, facility management personnel told us orally that they found the regulations and policies confusing and contradictory.
DOD nonconcurred with our recommendations that
1. DOD’s strategy for RPM should, at a minimum, provide for standard cost accounting methods by which the services will record and track their RPM expenditures, stating that “the level of recommended detail is too great to provide a meaningful evaluation;”

B-280230
Page 27 GAO/NSIAD-99-100 Real Property Management
2. DOD should consult with the Congress on the most feasible method by which to restrict the use of RPM funds for non-RPM purposes, stating that commanders need the maximum flexibility possible; and
3. DOD should mandate training standards (curriculum and hours) for all those involved in RPM assessments, stating that it is not certain such training is needed and is unwilling, without further study, to commit resources to it.
We continue to believe that requiring standard cost accounting methods to track how much each service is spending on RPM and by what type of facility will help DOD provide oversight responsibility. Also, we believe that meaningful evaluation of the comparative costs of maintaining the same types of facilities across services (e.g., barracks, classrooms, and administrative space) requires the kind of detail provided in the Army’s Directorate of Public Works annual reports. The same data are required for major commands to be able to compare expenditures of their bases. With current databases and budget data, it is not possible to readily compare RPM spending per square foot for like facilities across the services. OSD’s new facility category code system, which includes industry cost standards, will have no clear purpose unless these costs—which are per square foot—can be compared to what military installations spend. The Army’s databases permit such comparisons and are on-line; these should be used as the model for the other services.
We note that many officials told us migration of funds out of RPM for other purposes routinely disrupts rational planning and contracting. Therefore, while we appreciate the need for flexibility, we continue to believe that fund migration is an issue for DOD to address. As the National Research Council notes, “Spending below targets set for normal maintenance . . . may substantially increase costs of repair, replacement, and loss of use, costs that might have been avoided.”39 It would appear, therefore, that better management of fund migration could prove cost-effective in both the short and long term. We have modified our recommendation to suggest that DOD consider the feasibility of adopting the promising practices identified in this report and seek legislative changes, if needed.
Concerning the need for DOD to mandate standard training for personnel conducting RPM assessments, we note that common training will help
39Quoted in DOD Facilities Cost Factors Handbook, Version 1.0, April 1999, p. 3.

B-280230
Page 28 GAO/NSIAD-99-100 Real Property Management
ensure consistency in the assessment of facility conditions and RPM needs. The Navy noted in its technical comments that its guidance on RPM inspector qualifications “addresses such things as technical trade background, formal education in theory, experience in maintenance and repair operations, and skills in inspection techniques, planning and estimating, maintenance standards, and building codes.” This guidance could well serve as the model for a DOD-wide standard for all facility inspectors.
DOD’s comments and our evaluation can be found in appendix XI.
We conducted our review from May 1997 to March 1999 in accordance with generally accepted government auditing standards.
We are sending copies of this report to the Honorable William S. Cohen, Secretary of Defense; the Honorable William J. Lynn III, Under Secretary of Defense (Comptroller); the Honorable F. Whitten Peters, Secretary of the Air Force; the Honorable Louis Caldera, Secretary of the Army; the Honorable Richard Danzig, Secretary of the Navy; General James L. Jones, Commandant of the Marine Corps; the Honorable Jacob J. Lew, Director, Office of Management and Budget; and interested congressional committees and members. We will also make copies available to others upon request.
Please contact me at (202) 512-3092 if you or your staff have any questions concerning this report. GAO contacts and staff acknowledgments are listed in appendix XII.
Kwai-Cheung Chan Director, Special Studies and Evaluations

Page 29 GAO/NSIAD-99-100 Real Property Management

Page 30 GAO/NSIAD-99-100 Real Property Management
Contents
Letter 1
Appendix IArmy Strategy, Methods, and Criteria for Determining Real Property Maintenance Requirements
36Background 36Army RPM Funding Strategy 37Army Systems to Determine RPM Needs 38ISR System 39Facility Inspections 42ISR Ratings 42Review and Validation Process 46Resource Allocation 51Bases Visited 54
Appendix IIAir Force Strategy, Methods and Criteria for Determining Real Property Maintenance Requirements
56Background 56Air Force RPM Funding Strategy 58FIM Assessment System 59Allocation of RPM Resources 70Bases Visited 72
Appendix IIINavy Strategy, Methods, and Criteria for Determining Real Property Maintenance Requirements
74Background 74Navy RPM Funding Strategy 75Methods and Criteria to Determine Maintenance Needs 76Validation of Inspection Results 81Allocation of RPM Resources 83Bases Visited 86

Contents
Page 31 GAO/NSIAD-99-100 Real Property Management
Appendix IVMarine Corps’ Strategy, Methods, and Criteria for Determining Real Property Maintenance Requirements
88Background 88RPM Funding Strategy 88RPM Assessment System 89CORRS: A New System 89Survey 93RPM Needs Exceed Requests Fivefold 93Bases Visited 93
Appendix VSummary Comparison of Service Methods and Criteria
95
Appendix VICriteria for Allocation of Funds
96
Appendix VIIPercent of Value Measures for Estimating RPM Requirements
99
Appendix VIIIPromising Practices in Facilities Management
106Sources of Expertise on Promising Practices 106Criteria Used to Select Entities for Interviews 107Experts and Expert Organizations Consulted 107Entities Contacted for Information on Management Practices 108Fragmented Knowledge Base of Promising Practices 109Federal Facilities Council’s Promising Practices 110Life-Cycle Principles of Facility Management 111Preventive Maintenance and Life-Cycle Management 113Summary: Identified Promising Practices 118

Contents
Page 32 GAO/NSIAD-99-100 Real Property Management
Appendix IXObjectives, Scope, and Methodology
119Scope of the Study 119Methodology 119
Appendix XOur Survey on Real Property Maintenance for Installations
127
Appendix XIComments From the Department of Defense
136
Appendix XIIGAO Contacts and Staff Acknowledgments
149
Bibliography 150
Related GAO Products 160
Tables Table 1: Weaknesses in Services’ Condition Assessment Systems 10Table 2: Percent of Bases Using Listed Methods to Ensure Condition
Assessments Are Consistent 12Table 3: Percent of Bases Identifying Training and Resource
Constraints 13Table I.1: Steps to Ensure Assessments Are Valid 47Table I.2: Steps to Ensure Assessments Are Consistent 47Table I.3: Army Installation Views on Constraints 49Table I.4: How Army Bases Would Change Methods 50Table I.5: Fiscal Year 1997 Requirements Versus Funding Requested 52Table I.6: Army Bases’ Views on ISR Weaknesses 53

Contents
Page 33 GAO/NSIAD-99-100 Real Property Management
Table I.7: How Army Bases Would Change the Funding AllocationProcess 54
Table II.1: Air Force FIM Spending Plans Versus Needs Fiscal Years 1998-2005 58
Table II.2: Fiscal Year 1998 Air Force FIM Project Ratings and Cost 60Table II.3: Steps to Ensure FIM Project Ratings Are Valid 66Table II.4: Steps to Ensure Consistency 67Table II.5: Factors That Constrain Assessment Quality 67Table II.6: How Bases Would Change Determining RPM Requirements 68Table II.7: Additional Assessment Tools That Supplement FIM 68Table II.8: Top Five Frequently Cited Weaknesses 71Table II.9: How Bases Would Change Funding Allocations 72Table III.1: Type and Frequency of Inspection 80Table III.2: Steps to Ensure Inspections Are Valid 82Table III.3: Steps to Ensure Consistency 82Table III.4: Factors That Constrain the Quality of Assessments 83Table III.5: Top Weaknesses in RPM System 85Table III.6: Bases’ Choices to Proposed Changes in Allocation Process 86Table IV.1: Dimensions and Ratings in CORRS 91Table IV.2: How Installations Would Change Methods to Determine
Requirements 93Table V.1: Basic Characteristics of Services’ Condition Assessment
Systems 95Table VI.1: Ranking of Factors Affecting Allocation of Funds,
by Service 96Table IX.1: Responses to GAO Questionnaires 121
Figures Figure 1: Bases’ Ratings of Importance of Criteria in Worst-LevelRatings 9
Figure VIII.1: Life-Cycle Model for a Single Building 112Figure VIII.2: Effect of Adequate and Timely Maintenance and
Repairs on the Service Life of a Building 114

Contents
Page 34 GAO/NSIAD-99-100 Real Property Management
Abbreviations
AIS Annual Inspection SummaryANG Air National GuardASIP Army Stationing and Installation PlanBASEREP Shore Base Readiness ReportBCE base civil engineerCAS Condition Assessment SurveyCEAC Cost and Economic Analysis CenterCFA Commander’s Facility AssessmentCNA Capital Needs AssessmentCNET Chief, Naval Education and TrainingCPV current plan valueDOD Department of DefenseFCG facility category groupFDM facilities degradation moduleFII facility investment indexFIM facility investment metricFOMA facility operation and maintenance activitiesHFPA Health Facility Planning AgencyISR Installation Status ReportLLNL Lawrence Livermore National LabortoryLMI Logistics Management InstituteMARM Mission Area Rating MatrixNASA National Aeronautics and Space AdministrationNAVFAC Naval Facilities Engineering CommandNRC National Research CouncilO&M operation and maintenanceOSD Office of the Secretary of DefensePCMS Projects by Contract Management SystemPM preventive maintenancePML preventive maintenance levelPRV plant replacement valuePWC Public Works Center QDR Quadrennial Defense ReviewRDT&E research, development, test, and evaluationRPLANS Real Property Planning and Analysis SystemRPM real property maintenanceUSAF U.S. Air ForceUSMC U.S. Marine Corps

Page 35 GAO/NSIAD-99-100 Real Property Management

Page 36 GAO/NSIAD-99-100 Real Property Management
Appendix I
Army Strategy, Methods, and Criteria for Determining Real Property Maintenance Requirements Appendix I
In this appendix we discuss the Army’s strategy, methods and criteria for determining its real property maintenance (RPM) requirements and for allocating resources to those needs. We also include the responses to our questionnaire on RPM-related issues that we sent to Army bases.1 In particular, we examine a key part of the Army’s system for evaluating infrastructure conditions and estimating costs for facility sustainment and improvement, the Installation Status Report (ISR), Part I--Infrastructure. (A Part II--Environment--addresses compliance with environmental rules and regulations and was outside the scope of this report. Part III, under development, addresses performance standards.) For brevity, we refer henceforth to part I as the “ISR.”
Background The Army owns and manages a very large amount of real property at about 1,900 installations and sites worldwide (including active, Reserve, and National Guard-related sites), on 14.1 million acres of land. This property is managed by over 200 parent installations in 15 major commands.2 As of September 30, 1997, the real property at these locations consisted of 178,256 buildings (including 53,999 family housing buildings), with 1.039 billion square feet and an average age of 40 years. The Army’s infrastructure also includes 3,016 miles of railroads, 965 vehicular bridges, 623 central heating plants, and 77,114 miles of surfaced areas (such as roads). The Army estimates its plant replacement value (PRV) at about $212 billion.3 (We did not verify the accuracy of the Army’s inventory report, or its PRV estimate. However, in 1998, we reported that, with regard to all of DOD’s property, plant and equipment, DOD’s Inspector General stated that control procedures over assets were inadequate and cause inaccurate reporting of real property, capital leases, construction in progress, inventory, and preparation of footnotes.)4
Army RPM is funded by several sources. The Army’s operation and maintenance (O&M) account is the largest funding source, representing about 55 percent of the total real property maintenance activity costs in
1The survey, which asked about bases’ facility inventory, RPM processes and funding, was sent to 180 Army bases; 149 returned the questionnaires, or 83 percent. See app. X for a copy of the survey.
2Parent installations have responsibility for managing and supporting several subinstallations.
3Army Directorate of Public Works, Annual Summary of Operations, Fiscal Year 1997, vol. I, p. 2-13. The Army defines PRV as the cost of replacing current facilities with state-of-the-art facilities. Ibid., p. 1-3.
4See Deferred Maintenance Reporting: Challenges to Implementation (GAO/AIMD-98-42, Jan. 30, 1998, p. 32).

Appendix I
Army Strategy, Methods, and Criteria for
Determining Real Property Maintenance
Requirements
Page 37 GAO/NSIAD-99-100 Real Property Management
fiscal year 1997. The remainder is funded through other sources, such as the Army’s Defense Health Program, Military Family Housing, and Army Working Capital Fund. The Army's fiscal year 1999 O&M RPM appropriation was $1.446 billion (active, Reserves and National Guard). Currently, the Army estimates that it would cost $14.8 billion to improve all O&M RPM-funded facilities from their current levels to the “C-1” (i.e., best level) in the Army’s condition assessment report, the ISR.5
Army RPM Funding Strategy
The Army defines its RPM requirement as the amount needed “for the minimum annual sustainment of facilities” to maintain them “at existing levels plus the cost of renovations that are not new construction.” Estimates are adjusted annually for inflation.
For fiscal year 1999, the Army’s RPM appropriation was $1.446 billion, or64 percent of the $2.26 billion estimated as its requirement to sustain facilities, according to the Office of the Assistant Chief of Staff for Installations Management (ACSIM), the office responsible for the Army’s infrastructure.6 However, the Army currently plans to increase O&M RPM funding over the next 6 years to about 84 percent of its RPM sustainment requirement, which is expected to increase to about $2.7 billion. As a result, annual O&M RPM funding would increase 53 percent (in nominal terms) from $1.446 billion in fiscal year 1999 to $2.21 billion in fiscal year 2005, if the Department of the Army provides the funds. However, these plans appear uncertain, as the Army reduced the goal from 91 percent in March 1999 to 84 percent in August 1999.
The Army’s RPM sustainment requirement is only a fraction of the amount required to fix all identified repair needs, as of fiscal year 1997, that Army bases reported in responses to our survey. Army bases reported to us that they had $12.4 billion in outstanding repair needs, compared with the estimated Army-wide sustainment requirement of about $2.26 billion, or less than one-fifth that amount.7 The responses were from 83 percent of
5This amount is different than backlog of maintenance and repair, which is the estimated cost to fix all identified repairs, regardless of urgency or mission relevance. The Army no longer reports this as backlog, rather, it cites the ISR-generated estimate.
6Figures cited are for all Army components—active, Reserve, and National Guard.
7The $2.26 billion was calculated by taking the Army’s statement that $1.446 billion in fiscal year 1999 RPM funding represented meeting 64 percent of its RPM requirement. One hundred percent would be $2.26 billion.

Appendix I
Army Strategy, Methods, and Criteria for
Determining Real Property Maintenance
Requirements
Page 38 GAO/NSIAD-99-100 Real Property Management
the Army bases to which we sent questionnaires, suggesting that additional needs were not reported, given 17 percent nonrespondents. Therefore, while the Army plans to significantly increase its RPM funding, the 53-percent increase by 2005 does not appear to come near to fully funding currently identified repair needs. The Army states that because it has other priorities, it chooses to accept a risk of deterioration in some facilities in order to fund these other priorities.
In addition, the Army’s ACSIM stated that it would cost $14.8 billion to bring all O&M RPM-funded facilities from the current ISR levels, ranging from C-4 to C-2, up to the highest (C-1). (The ISR software estimates costs for going from one C-level to a higher C-level.) The ISR estimate is not the same as backlog; these are different ways to estimate RPM needs. The Army used the $14.8 billion as the basis for competing for “unfinanced requirements” in fiscal year 1999, requesting one-tenth that amount($1.48 billion) from the Office of the Secretary of Defense, if extra monies became available. However, the Army stated that OSD reduced the requested amount by first cutting it to the estimated cost of bringing facilities up to the C-2 level (versus C-1), which was $7.12 billion, and spreading that over 40 years. As a result, the Army’s “request” for unfunded requirements was reduced from $1.48 billion to $178 million.
Army Systems to Determine RPM Needs
The Army uses a number of computerized databases to determine its RPM needs and allocate resources to them. These have been referred to as the Infrastructure Decision Architecture (IDA). This architecture assists “in management and funding decisions and enables leadership to implement non-incremental, comprehensive decisions on Army infrastructure management issues.”8 The IDA databases and related decision support systems include:
• An on-line computerized database of the total inventory of real property, called the Integrated Facilities System.
• The Real Property Planning and Analysis System (RPLANS), a decision support system that provides a 7-year estimate of needed space at installations, based on predetermined space allowances for each type of Army facility. RPLANs calculate how much excess (or deficit) space an
8Army contractor paper for FDM, p. 1. According to the Army, the term IDA is not currently widely used, but that no other term has replaced it to describe the “broad conceptual framework” of databases and decision support systems that make up the IDA.

Appendix I
Army Strategy, Methods, and Criteria for
Determining Real Property Maintenance
Requirements
Page 39 GAO/NSIAD-99-100 Real Property Management
installation has or will have by comparing existing and projected space to the permitted amount.
• The Army Stationing and Installation Plan (ASIP), which defines and projects installation population, also over a 7-year period, based upon Army force structure databases.
• The facilities degradation module (FDM), a computerized database that predicts the life-cycle condition of facilities over specified time periods, given different funding levels for maintenance, based in part on data from 80,000 Army facilities.
• The ISR, a facilities rating database that includes software that generates condition ratings and estimated cost of repairs of facility categories.
• The Headquarters Executive Information System (HQEIS), an on-line decision support tool that allows users to access a variety of institutional data sources and to view it at multiple levels (Army headquarters, major commands, bases, etc.). Data that are on-line include the Headquarters ISR (summary data), Integrated Facilities System, and the Army Stationing and Installation Plan.9
The Army emphasizes that it manages property, including maintenance and repair, by using all of these systems. The ISR was the central focus of our analysis because the Army uses it to assess the condition of its facilities and its data can be used to predict the consequences of funding at levels below (or above) those required to maintain facilities in their current state.
ISR System Implementation of part I of the ISR began in 1995. It assesses the physical condition of certain facilities or facility category groups (FCG) using the same standards.
The objectives of the ISR are to:
1. assess and report the current condition of Army facilities and nonbuilding infrastructure (such as roads), measured in terms of quality and quantity;
2. provide Army-wide indicators on such things as conditions, trends, facility shortfalls, and deviations from standards;
9We did not verify the reliability of the data in the various Army databases. Access to the HQEIS data requires a password.

Appendix I
Army Strategy, Methods, and Criteria for
Determining Real Property Maintenance
Requirements
Page 40 GAO/NSIAD-99-100 Real Property Management
3. assist in allocating resources and prioritizing infrastructure programs;
4. provide information for determining changes in Army policy or needs for new policies; and
5. provide information for use in stationing and force structure decisions.
The majority of Army installations are required to complete the ISR. (In general, only installations scheduled for closure under the Base Realignment and Closure program or coded as “Lay Away” are exempt.) However, government-owned, contractor-operated installations have not conducted ISR assessments, contrary to ISR instructions.
Management of ISR System The ACSIM is responsible for overall ISR policies, standards, and procedures. Army headquarters develops facility standards and issues guidance to meet Army-wide infrastructure goals and objectives. Army major commands are responsible for program management and administration. Each command is to ensure that the ISR is implemented at the installations it controls and that the bases comply with ISR requirements. Each installation commander is responsible for completing the ISR as required, certifying the results, and forwarding it to the major commands. Parent installations are responsible for ISR assessments at their subinstallations.
ISR Structure To achieve the objectives of the ISR, Army installations annually evaluate the quality (physical condition) and quantity of real property and enter the results into a database. These data, along with data from the other Army databases, are used to generate overall ratings for each base, including the extent to which facilities meet unit needs, Army standards, and mission requirements. The ISR system includes software that estimates the costs to improve facilities from the level they are rated at in the ISR up to any higher level—such as from C-4 to C-3, or C-4 to C-1.
ISR results are generated for four infrastructure levels:
• 5 broad top-level areas (mission, mobility, housing, community, and installation support);
• 28 categories; • 60 subcategories; and • 219 facility category groups.

Appendix I
Army Strategy, Methods, and Criteria for
Determining Real Property Maintenance
Requirements
Page 41 GAO/NSIAD-99-100 Real Property Management
In some categories, there is no FCG lower than the subcategory; this is the case for unaccompanied personnel housing (i.e., barracks.) The installations evaluate facilities by FCG and these ratings form the basis for all ratings/calculations rolled-up in the ISR software to subcategory, category, and area levels.
ISR Assessment Criteria The ISR established common Army-wide standards for assessing facility quality. Criteria for quality evaluations are contained in separate standards booklets for most of the 60 ISR subcategories (e.g. operations buildings, small arms ranges, maintenance facilities, and barracks). Facility groups are rated in terms of green, amber, or red:
• red indicates dysfunctional or substandard, “overall poor condition”;• amber indicates that the facility “does not fully meet standards,” but is in
“overall fair condition”; and• green indicates that it “complies with standards” and is in “overall good
condition.”
These color levels are further defined in considerable detail in ISR standards booklets with narrative statements that characterize the area being assessed and, in most cases, pictures that illustrate the general condition for each rating level. For example, four criteria are spelled out for each of the 3 color levels for the lobby of an administrative facility; there are eight criteria for a green rating for building exteriors. Criteria are written in layman’s terms, such as “building walls, windows and doors in sound condition”; “entry in good repair”; “inadequate exterior signage.” According to the Army, the ISR “articulates facility conditions and RPM requirements through an affordable and understandable process.” “It provides data showing possible problem areas and trends, which at HQDA [Headquarters, Department of the Army] level, influence development of facility investment programs.”10
Only permanent and semi-permanent assets identified in the ISR database are to be assessed. Temporary structures are generally not rated because they are not considered long-term solutions to facility requirements. Certain other facilities at installations using he ISR also are not required to be rated. For example, World War II wooden structures, even if in use, do
10Army technical comments on the draft of this report.
Letter

Appendix I
Army Strategy, Methods, and Criteria for
Determining Real Property Maintenance
Requirements
Page 42 GAO/NSIAD-99-100 Real Property Management
not have to be rated under ISR because they are expected to be demolished.
Facility Inspections Under the ISR system, inspections can be done by anyone designated to do the ratings, including engineers, contractors, and building users (occupants). The installation’s ISR coordinator identifies which offices are responsible for base facilities within the ISR categories and each unit designates who will inspect what facilities. According to ISR instructions, the inspectors should be the primary users of the facility and knowledgeable of the facilities’ condition and uses. For example, the base facilities maintenance staff (engineers or other skilled craftsmen from public works or the engineering offices) should rate all base utilities and other facilities managed by this office.
Having building users do the inspections is intentional, according to headquarters staff, as this is more likely in the Army’s view to ensure that those most familiar with a facility’s condition over time are doing the rating. Among the 149 Army installations that responded to our questionnaire, 82 percent of inspectors were described as building users.
Inspector Training Each inspector should receive a short training session on the facility inspection process. Headquarters level training is provided for the installation ISR team/coordinator. These staff can then train unit inspectors at the base. This training generally includes a briefing (about2 hours), a video, and a self-teaching computer-based training package. According to some facilities management personnel, it is challenging to get all inspectors to attend training and the preponderance of building-user inspectors change annually.
ISR Ratings The ISR requires inspectors to rate the physical condition of facilities against Army-wide standards/criteria for that type facility. For example, the ISR Standards Booklet 5 contains rating criteria for maintenance facilities that apply to 14 FCGs, including aircraft maintenance facilities, vehicle maintenance shops, and depot ammunition maintenance shops. Inspectors are to use the appropriate standards booklet to evaluate facilities and record the results on an inspection worksheet. In some instances, if a required “critical” component, such as a restroom, is not in the facility, the item is rated red automatically. Similarly, a barracks cannot

Appendix I
Army Strategy, Methods, and Criteria for
Determining Real Property Maintenance
Requirements
Page 43 GAO/NSIAD-99-100 Real Property Management
be rated above red if it has a common latrine. The overall facility rating cannot exceed that of the worst critical component.
A separate inspection and rating is to be prepared for each purpose/FCG in the same building; these are not averaged to produce one rating for the facility. Therefore, if a building/facility were multipurpose, there would not be a building-specific rating. Separate color ratings for each FCG are to be entered into the ISR database. However, at one of the Army sites we visited, one unit did not complete separate ratings for each FCG within a building. The unit inspector said that if the building housed more than one FCG, the user who occupied the largest part of the facility also included the other area in his rating (in other words, there was a “building” inspection).
When there are a number of similar facilities for the same FCG, a representative sample may be taken if the number is large enough and the facilities are of the same design. The color ratings of the sample are to be proportionately entered into the ISR database to generate an overall C-rating for the FCG. For example, in fiscal year 1996, one base we visited inspected about 5 percent of family housing units (139 out of 2,924) because these were all from the same FCG.
As we observed during our site visits, most base ISR files contained the Summary Mission facilities worksheets, and, in some cases, supporting documentation (the pertinent standards booklets with checkmarks of each related element indicating the reason(s) for the inspection rating results). At one base, many files also contained a copy of the engineering report on the building’s structural condition (e.g., walls, window, mechanical, electrical, and fire alarm).
Once the inspection worksheets are completed, they are returned to the installation ISR coordinator. Based on discussions during our site visits, the ISR coordinating office generally reviews selected worksheets to ensure they accurately reflect the conditions of the facilities. The reviewers focus on any significant changes or apply their expertise or personal knowledge of the facilities. Some subsequent checks are made. However, because of limited resources, facilities’ staff told us that it is not possible to check them all. The ISR coordinating office and the public works directorate then check if there are any disconnects with the inspection results and work orders.

Appendix I
Army Strategy, Methods, and Criteria for
Determining Real Property Maintenance
Requirements
Page 44 GAO/NSIAD-99-100 Real Property Management
Software Generated Quality and Quantity Ratings
The ISR software calculates separate quality and quantity ratings (C-1, the highest, to C-4, the lowest), and then an overall C-rating (the lower of the two ratings) using installation ratings and information from existing Army databases. A C-1 rating indicates that an infrastructure group requires little immediate attention; a C-4 rating highlights a significant problem area for the installation. C-ratings are calculated for all four infrastructure levels, beginning with the FCG. The C-ratings for the three higher levels are an aggregation of all the lower level ratings. For example, the “area” C-ratings result from the aggregation of FCG, subcategory, and category ratings that comprise the area. However, the base commander can adjust the overall area C-ratings (raise or lower) with a written justification. No C-rating overwrites are allowed below the area level.
The method of calculating quality C-ratings and area and category level C-ratings changed for the 1998 ISR cycle. Rather than using the percentage of inventory rated green, amber, or red, it is now based on a numerical (weighted) value assigned to each color rating. Area and category level C-ratings are now a weighted average of the lower level ratings rather than a nonweighted average. This change is intended to correct having a small, less important FCG counting the same as a large important group. The C-ratings from previous years will be normalized to reflect the changes.
The quality C-ratings are generated by comparing the facility condition ratings for each FCG to space allowances specified in the Headquarters Real Property Planning and Analysis System. The color ratings are first linked to system data on the number of facilities in a given FCG and the ISR software calculates the amount that is green, amber, and red. Next, quality points are awarded based on the amount of inventory rated green, amber, and red. For example, facilities rated green are given three quality points; amber and red get two and one quality point(s), respectively. The total points are summed and the C-rating is awarded. The cut-off values for ratings are
• C-1 equals 90 percent or greater,• C-2 equals 75 percent or greater,• C-3 equals 60 percent or greater, and• C-4 less than 60 percent.
The quantity C-ratings are calculated by the ISR software, which compares reported space to installation mission requirements. The inventory data

Appendix I
Army Strategy, Methods, and Criteria for
Determining Real Property Maintenance
Requirements
Page 45 GAO/NSIAD-99-100 Real Property Management
are obtained from the Integrated Facilities System.11 The quantity C-ratings—based on a percentage requirement satisfied by either permanent or semi-permanent—are defined as follows:
• C-1—95 percent or more of required facilities are available and meet the unit’s needs and Army standards. There are very minor, if any, functional deficiencies. Infrastructure fully supports mission performance.
• C-2—80 percent or more of required facilities are available and meet the unit’s needs and Army standards, but there are some minor functional deficiencies. Infrastructure supports the majority of assigned missions.
• C-3—60 percent or more of required facilities are available and meet the majority of the unit’s needs and Army standards. However, there are some functional deficiencies and mission performance is impaired.
• C-4—less than 60 percent of required facilities on hand do not meet needs or Army standards and significantly impair mission performance.
• C-5—an installation is undergoing major reorganization, inactivated, or closure.
Software-Generated Cost Estimates
The C-ratings are then linked to ISR cost factors to calculate the cost of new construction requirements, renovation, and annual sustainment (maintaining permanent/semi-permanent facilities as well as temporary facilities at current condition). All cost factors are at the FCG level of detail. Cost factors for new construction are expressed as dollars per unit of measure for each FCG (e.g., for FCG F7218P—enlisted barracks, trainee, there is a designated dollar cost per sleeping space). Local cost factors are built into the software to reflect geographic differences. The Army Cost and Economic Analysis Center (CEAC) develops the cost factors to estimate the costs for installation infrastructure sustainment and improvement.
ISR Reporting The ISR is a computerized system. Its rating results and inventory are transferred by disk from individual bases to their major commands and then to a central computer maintained by the Department of the Army and available to ACSIM staff and other authorized users.
11The ISR does not include the condition rating for each Army building/facility listed in the Integrated Facilities System database. The system uses a five-level rating scale (A= serviceable/excellent, B=serviceable/fair, C=serviceable/poor, I=functionally inadequate, and N= physically not serviceable) for each item.

Appendix I
Army Strategy, Methods, and Criteria for
Determining Real Property Maintenance
Requirements
Page 46 GAO/NSIAD-99-100 Real Property Management
The installation commander submits the ISR report to the major command with a cover memorandum containing the commander’s narrative statement prioritizing five broad infrastructure areas (1) mission facilities, (2) mobility facilities, (3) housing, (4) community facilities, and(5) installation support—and highlighting mission impacts due to infrastructure deficiencies. Each major command aggregates data from its installations, prepares a written assessment of the status of its installations, and submits the reports to Army headquarters.
Other reports include the category/subcategory report, the assets/requirement report, the renovation/new construction cost report, and the sustainment cost report. The facility quality condition report, used at the installation level, lists the ratings from inspection worksheets for each permanent/semi-permanent asset at the installation. It includes the facility number, FCG, size of asset, color rating, and unit identification code. Other reports can be generated from the ISR software such as appropriations reports.
Once the ratings have been reviewed and approved at the headquarters level, the results for every rated installation are available on-line to authorized users.12 This makes it possible to compare installations worldwide across various outcome and cost measures, both by command and by base, and by type of mission. ISR data can be viewed in many ways. For example, it can provide information on how many sleeping spaces in barracks are rated at what level, either at an individual installation, across all bases within a command, or across the entire Army.
Review and Validation Process
At the installations we visited, we were told that the ISR coordinating office generally reviews selected worksheets to ensure they accurately reflect the conditions of the facilities, based on their personal knowledge of the facilities, including work that may have been done during the year. Some subsequent checks are made. However, facilities staff at bases we visited stated that because of limited resources, it is not possible for them to check all the facilities.
Responses from Army installations to our survey reflected what we were told in field visits, with most bases stating that the primary validation
12According to the Army Installation Support Center, any Army employee in facilities management is assigned a password for access to the ISR results that are kept on-line upon request.

Appendix I
Army Strategy, Methods, and Criteria for
Determining Real Property Maintenance
Requirements
Page 47 GAO/NSIAD-99-100 Real Property Management
method was review of selected worksheets by facility management staff, based on the staff knowledge of facilities. Table I.1 summarizes the bases’ responses.
Table I.1: Steps to Ensure Assessments Are Valid
Source: Responses to question 9, GAO survey.
Ensuring Consistency of Assessments
We also asked installations how they ensured that the consistency of facility condition assessments given by one rater would be, on average, the same reported by other raters. Most respondents said they had no formal procedures or mechanisms other than the expertise and/or training of their staff who do the ratings. Table I.2 shows the responses.
Table I.2: Steps to Ensure Assessments Are Consistent
Source: Responses to question 10, GAO survey.
Step taken to ensure validity Percent citing step
Selected worksheets are reviewed by facility management office staff
65
Rely on expertise of assessor; no formal procedures used 24
Facility staff makes follow-up visits to verify reported problems on a sample of selected rating worksheets
20
Other validation methods. 18
Outside contractors are used to validate facility ratings. 5
Steps taken to ensure consistency Percent citing step
No formal procedures other than expertise and/or training of the assessors
56
Other method to ensure consistency 26
A random sample of facilities is reinspected by different assessors from our base to determine whether the second set of ratings is similar to the first
23
A set number of percentage of facilities are reinspected by different assessors from our base to determine if second set of ratings were similar to the first
4
Outside contractors are used to validate facility ratings 2

Appendix I
Army Strategy, Methods, and Criteria for
Determining Real Property Maintenance
Requirements
Page 48 GAO/NSIAD-99-100 Real Property Management
As the table shows, the Army respondents rely primarily on the expertise/training of its raters to ensure assessments are consistent. Outside contractors are used relatively infrequently.
However, despite the detailed instructions and worksheets, during our site visits we found a lack of consistency in assessments. Some inspectors were very conscientious about using the standards booklets whereas others did not use them at all. Consistency and accuracy in ratings were a prominently cited concern in an Army analysis of the 1994 field testing of the ISR, as was a related concern about adequate personnel understanding of ISR “standards and processes” in a September 1998 After Action Report.13
At the installations we visited, the inspectors used several different approaches to complete their ISR ratings. Based on a comparison of several ratings to the appropriate standards booklets and our observations of actual facility conditions, we found there were some cases where individual building areas could have been rated differently or worksheets were incorrectly summarized and the overall quality rating should have been different (in some cases higher, in some, lower). We also found that some Army units believe that they do not have the resources to adhere to all ISR instructions (such as having enough facility inspectors). In one case, according to base officials, staff from the base assigned amber ratings to all the facilities at various subinstallations. They said that this was done without inspecting the buildings and with no input from building users, because there were not enough resources (staff, time, or money) to comply with ISR instructions. Based on our inspection of building conditions at one of these sub-installations, the amber ratings did not reflect the actual, more deteriorated condition of some buildings.
At another installation, we were told that some ratings were questioned because the facility was rated green; yet, there were several high-cost repair projects scheduled for the building. Based on our observations, the exterior of this facility was in extreme disrepair, having crumbling concrete walls, cracks, and leaking windows.
13Army, “ISR Test After Action Review,” June 8, 1994, pp. 5 and 7, and September 2, 1998, p. 1.

Appendix I
Army Strategy, Methods, and Criteria for
Determining Real Property Maintenance
Requirements
Page 49 GAO/NSIAD-99-100 Real Property Management
Army Installations Comments on the ISR
We asked installations to cite any or all of four factors that might constrain the quality of facility condition assessments at their bases. Regarding the overall quality of the ISR process, 72 percent of the Army respondents reported the primary factor affecting overall quality was the shortage of resources—insufficient time and/or budget to carry out assessments.(See table I.3.)
Table I.3: Army Installation Views on Constraints
Source: Responses to question 11, GAO survey.
It is readily apparent that a large majority of Army installations reported a shortage of resources and personnel as a constraining factor on the quality of condition assessments.
How to Improve Assessment Methods and Criteria
We also asked facilities management personnel at bases to choose what they would change about the methods or criteria used to determine real property maintenance requirements.
Constraining factorPercent that checkedfactor as a constraint
Shortage of personnel 61
Shortage of trained personnel with engineering or craft backgrounds
48
Shortage of resources (i.e., insufficient time and/or budget to carry out assessments)
72
Other 11
Does not apply—no factors create a significant constraint on the quality of reviews of facility conditions
13

Appendix I
Army Strategy, Methods, and Criteria for
Determining Real Property Maintenance
Requirements
Page 50 GAO/NSIAD-99-100 Real Property Management
Table I.4: How Army Bases Would Change Methods
Source: Responses to question 13, GAO survey.
These responses show that 64 percent of Army respondents agree that the role of appearance should be reduced in facility assessments and the same percentage agree that “much more emphasis” should be placed on long-range maintenance.
At one base we visited, the facilities staff said that because the deficiencies causing poor ratings are not identified, the urgency of the repair work cannot be assessed. They suggested that each red rating be accompanied by a work order to fix the condition. They also suggested including a standardized deficiency database as part of the ISR process to better manage problems identified. In their view, such a system would allow sorting by type of deficiency and priority, provide trend data, and post correction of deficiencies.
Other Systems Used to Determine Repair and Maintenance Needs
In addition to the ISR, the Army National Guard maintains a Project Inventory Evaluation Report for all guard units for use in preparing budget submissions. Each state prepares a comprehensive list of repair projects that includes data such as individual project description, costs, installation name and location, and status. The report is updated periodically and sent to the National Guard Bureau annually.
Yet another system is used to fund RPM for Army government-owned, contractor-operated installations, such as industrial plants that produce ammunition. In general, these sites have contracts that govern what the contractor is required to do, with maintenance included as part of the operator’s responsibility. Some survey government-owned, contractor-operated respondents stated that they use some type of assessment/inspection of facility conditions.
Change in method Percent choosingproposed change
Rate building/facilities primarily according to engineering, life-safety, and health criteria, while decreasing the role of aesthetics
64
Place much more emphasis on long-range maintenance, while de-emphasizing annual assessments of facilities
64
Other 20

Appendix I
Army Strategy, Methods, and Criteria for
Determining Real Property Maintenance
Requirements
Page 51 GAO/NSIAD-99-100 Real Property Management
Resource Allocation According to ACSIM personnel, there is no direct link between the ISR assessments and the allocation of resources. The emphasis of the ISR, they said, is to take a "snapshot" of the condition of the inventory; its software then estimates what it would cost to improve facilities to C-1 or to intermediate levels, from the rated level. In budget terms, the installations do not actually request RPM funds. Instead, Army officials told us, the Department of the Army decides how much “risk” to infrastructure they are willing to tolerate, given other competing funding needs, and this leads to an overall Army RPM spending total. This total is then divided downwards, with each major command receiving a “target” figure; in turn, each major command informs its component bases how much each will receive in RPM funding.
How Bases Prioritize Spending
Certain bases we visited had formal systems to review projects and priorities or make funding decisions. At one base, resources are allocated after projects are prioritized by a project priority list determined by their installation planning board. The panel includes members from the major staff directorates and tenants (such as the school house dean) and is chaired by the base commander. There are about 20 voting members and 20 nonvoting members. The board is supported by working panels.
Customer work requests are evaluated using a local “project priority matrix.” Projects are categorized (medical, operations/training, housing, utilities, maintenance, administrative, supply, and community support) and classified by type of work--health/safety, force protection, mission/readiness, infrastructure). The matrix “points” are then weighted according to the seriousness of the problem to be corrected (complete failure, component failure, failure is imminent, system functional, or little deterioration).
Work orders for repairs are not linked to the ISR and can be prepared at any time. However, a customer can reference the ISR results as a basis for the work (which could help when prioritizing all base projects). Other bases implied that there simply is too little money to focus on prioritizing spending. Substantial funds are used to pay for “must pay” items such as utilities. Finally, the major command and base level commanders have the authority and can use RPM funds for other needs.

Appendix I
Army Strategy, Methods, and Criteria for
Determining Real Property Maintenance
Requirements
Page 52 GAO/NSIAD-99-100 Real Property Management
Maintenance Needs Versus Requested Funding
We asked installations to report the funding they requested for RPM and the amount they would need to meet all identified repairs. This unconstrained RPM requirement is how much it would cost to fix all deficiencies previously identified but not funded and is commonly referred to as backlog. These data are no longer officially collected or reported by the Army to OSD or to the Congress. Instead, the ISR software generates the estimated cost to bring ISR-rated facilities to the C-1 condition level (or any lower level above the rated one).
At the Army bases we visited, we found a general sense among facilities staff that although they made a significant effort to identify deficiencies, the subsequent funding was so low that it appeared their efforts were meaningless. The large difference between total backlog requirements and the funding actually requested by bases for RPM, as reported on the surveys, is shown in table I.5.
Table I.5: Fiscal Year 1997 Requi rements Versus Funding Requested
Source: Responses to question 15, GAO survey.
As the table shows, Army bases reported that they requested funding equal to only about one-sixth (15.8 percent) of their identified RPM needs. We were told by facilities staff that these differences were due to the fact that everyone knows the funding environment is low and that total needs are not expected to be funded given the gap between available funding and identified requirements. It is also the case, however, that total repair and maintenance needs are not a statement of priority, but rather what it would cost to fix all known things that need fixing, regardless of importance to mission or severity of defect.
We asked installations to indicate which of several factors they saw as weaknesses in their facility condition assessment system. The results with regard to the top rated items, in descending order of percent, are shown in table I.6.
Army bases’ unconstrained RPM requirements (total cost of fixing all identified deficiencies)
$12.4 billion
RPM funding requested by bases from major commands, fiscal year 1997 $1.96 billion
Funding requested as a percent of unconstrained requirement 15.8%

Appendix I
Army Strategy, Methods, and Criteria for
Determining Real Property Maintenance
Requirements
Page 53 GAO/NSIAD-99-100 Real Property Management
Table I.6: Army Bases’ Views on ISR Weaknesses
Source: Responses to question 12, GAO survey.
The major ISR weakness, according to Army base respondents, is that there is little or no linkage between condition ratings and subsequent resource allocations. A majority of respondents also reported that the system does not reflect the reason(s) for the ratings and that “rollup” ratings for a category with multiple facilities oversimplify conditions.
Installation Views on Proposed Changes to Allocation Processes
We also asked installations about their views with regard to how they would change the RPM funding allocation process. Table I.7 shows the percentage of installations that cited any of four alternatives.
Weakness Percent that checked
option
Little or no linkage between condition assessment and allocation of resources
61
Ratings do not tell what is wrong within facility or mission category; reasons not readily available
53
Rollup oversimplifies conditions 51
Little or no linkage between condition assessment and budget estimation
46
Assessment process lacks robust engineering base 40
Focuses too much on facility appearance 38
Cost estimates are generally not accurate 36
Overall condition ratings are too broad 32

Appendix I
Army Strategy, Methods, and Criteria for
Determining Real Property Maintenance
Requirements
Page 54 GAO/NSIAD-99-100 Real Property Management
Table I.7: How Army Bases Would Change the Funding Allocation Process
Source: Responses to question 22, GAO survey. Total exceeds 100 percent because more than one choice could be made.
The top choice among Army respondents was that RPM funding should not be based on a fixed increase above or below the previous year’s level. A majority of respondents also favored basing funding on physical deficiencies, with more for “needier” bases.
Consequences at Base Level Personnel responsible for real property maintenance at bases we visited were virtually unanimous in pointing out that they could not adequately maintain their facilities at the funding levels allocated to them in recent years. For example, at one base, we were told that there is simply not enough money to maintain all the required facilities. The major command allocates a recurring base amount by activity; officials said that resources were not adequate to provide the amount needed to take care of requirements. At another base, the real property maintenance budget level is “incremental”; i.e., it receives a fixed increase above or below the previous year’s allocation.
Bases Visited The following sites were visited to ask facilities management officials at each about how RPM requirements are determined, how funds are allocated, and their views on the RPM process in their service. The questionnaire was pretested at some, and subsequently validated at others, as indicated. In addition, we visited Fort Bragg (Forces Command), Fayetteville, North Carolina, and Fort Belvoir (Military District of Washington), Alexandria, Virginia, to gain a better understanding of the ISR and the Army’s RPM processes from personnel involved in RPM, as well as to see a diverse selection of Army property and facilities.
Suggested change Percent checking option
Funding should not be based on a fixed increase above or below the previous year’s level
59
Funding should be based primarily on the physical deficiencies, with “needier” bases receiving more funds than those in better condition
53
Funding should be based on average age, total square footage and number of facilities
45
RPM funding/allocation should not be centrally managed by major command.
39

Appendix I
Army Strategy, Methods, and Criteria for
Determining Real Property Maintenance
Requirements
Page 55 GAO/NSIAD-99-100 Real Property Management
Sites visited to pretest questionnaires
Fort McPherson, (Forces Command), Atlanta, Georgia;Fort Hood, (Forces Command), Killeen, Texas;Fort Sam Houston, (Medical Command), San Antonio, Texas;U.S. Army Forces Command, Atlanta, Georgia; andU.S. Army Medical Command, San Antonio, Texas.
Sites visited to validate survey responses
Fort Sill (Training and Doctrine Command), Lawton, Oklahoma;Texas Army National Guard, Austin, Texas; andRock Island Arsenal (Army Materiel Command), Rock Island, Illinois.

Page 56 GAO/NSIAD-99-100 Real Property Management
Appendix II
Air Force Strategy, Methods and Criteria for Determining Real Property Maintenance Requirements Appendix II
In this appendix, we discuss the Air Force’s strategy, methods and criteria for real property maintenance (RPM), including the responses to the questionnaire on RPM-related issues that we sent to Air Force bases and major commands.1 In particular, we focus on the Air Force’s Facility Investment Metric (FIM) system that is used to rate the urgency of repair projects funded from the operation and maintenance (O&M) RPM account.
Background As of fiscal year 1998, worldwide Air Force installations had over 105,000 buildings totaling just over 650 million square feet. Approximately 51,500 of the buildings were family housing units and were paid for from the military family housing account, meaning O&M RPM funds paid for the repair and maintenance of the other 54,000 buildings with 480 million square feet.2 The O&M RPM-funded facilities had an estimated plant replacement value (PRV)3 of $146.4 billion. The Air Force’s Real Property Maintenance Account Program/Programs and Analysis Branch administers O&M RPM-funded facilities and serves as the advocate for RPM funding within the Air Force. According to the Air Force, RPM appropriations for fiscal year 1999 were $1.52 billion. Of this total, $1.359 billion was for the active Air Force, $66 million for the Air Force Reserve and $95 million for the Air National Guard.
In the Air Force, O&M RPM funding consists of spending for (1) preventive maintenance level repairs (PML) and (2) repair and minor construction projects.4 To better determine repair and minor construction needs, the service implemented the Commander’s Facility Assessment (CFA) in fiscal
1The survey, which asked about base facility inventory, RPM processes and funding, was sent to 202 Air Force bases (including Air Force reserve and Air National Guard); 200 returned the questionnaires, or 99 percent. See app. X for a copy of the survey.
2Air Force data provided to GAO.
3PRV is defined by the Office of the Secretary of Defense (OSD) as “the cost to replace the current physical plant (facilities and supporting infrastructures) using today’s construction cost (labor and materials) and standards (methodologies and codes).”
4Preventive maintenance is defined as the planned, periodic inspection, adjustment, and minor repair of equipment and systems. It is “the minimum level of maintenance required to sustain the day-to-day operation of the Air Force facilities and infrastructure between periodic repairs and replacement.” (Air Force: FIM Executive Overview, p. 5.) Air staff said that repair and minor construction projects are those that the Air Force bases contract out for a number of reasons, such as the size or dollar amount of the project. The service also allocates funds to support the civil engineering workforce at each base. This amount is based on historical amounts allocated for this purpose and base size factors, such as square feet and average age of the facility.
Appendix II
Air Force Strategy, Methods and Criteria for
Determining Real Property Maintenance
Requirements
Page 57 GAO/NSIAD-99-100 Real Property Management
year 1993, which was then replaced in 1998 with FIM, which the Air Force views as a more objective method to assess and present its RPM needs.
CFA, used from fiscal year 1993 to 1997, required bases to gather condition assessment data on buildings and rank the impact of building conditions on their missions. However, CFA had two major limitations, according to the Air Force. The rating criteria were considered too subjective and the method used to summarize data was problematic. The Air Force felt that CFA criteria allowed commanders overly wide interpretation of CFA ratings. CFA also grouped multiple requirements into one level, which placed lower-impact requirements in the same category as more critical requirements. Air Force RPM officials stated that these limitations reduced the credibility of the system with the Air Force senior leadership.
According to the Air Force, the FIM’s purpose is “to put a mission face on existing facility and infrastructure requirements in order to advocate for funds at the Air Force Corporate Structure.”5 The FIM is used to rate only RPM O&M funded repair projects that are not PML work. In contrast to the CFA, the Air Force states that the FIM measures specific requirements (rather than rating an entire facility or infrastructure system); has more objective ratings; and provides feedback to leaders.6 According to the FIM operational guide, it is intended to link RPM spending to the Air Force’s “investment philosophy: to address the most urgent facility needs of the Air Force.”
The FIM guide appears to endorse the need for a comprehensive strategy, stating that the Air Force will use the data gathered under FIM “to develop a corporate investment strategy, measure adherence to this strategy, and ascertain the adequacy of long-term levels of investment to meet facility requirements.”7 Given that FIM had only been used for 1 year at the time of our review, it was not possible to determine the extent to which it had met these goals.
5“Air Force Facility Investment Metric: Implementation and Operations Guide,” August 1997, p. 1. In this regard, it is very similar to the Army’s Installation Status Report, which was also implemented as part of a strategy to advocate for RPM funding. The Air Force corporate structure is, according to the Air Force, “the Secretariat and HQ USAF leadership structure, to include the Air Force council, Board, Panels, and integrated product teams.”
6Air Force: FIM Executive Overview, August 1997, p. 4.
7Air Force: FIM Executive Overview, August 1997, p. 1.

Appendix II
Air Force Strategy, Methods and Criteria for
Determining Real Property Maintenance
Requirements
Page 58 GAO/NSIAD-99-100 Real Property Management
Air Force RPM Funding Strategy
Using the FIM infrastructure rating system, Air Force bases identified$355 million in critical-rated projects for fiscal year 1998. However, the Air Force funding plan provides no funding for FIM-rated repair projects from fiscal year 1998 to fiscal year 2003, while funding the PML portion of RPM at 1 percent of the PRV of each installation. According to the Air Force Installations and Logistics office, repair projects are zeroed out until fiscal year 2003 because “we must look at overall needs, and the need is [weapons] modernization.”
The Air Force’s December 1997 Annual Planning and Programming Guidance states that bases should use the FIM “to identify and accommodate RPM projects that satisfy the most urgent needs of the Air Force.” The Air Force estimates that the planned FIM-based spending of $1.694 billion for fiscal years 2003-2005 is 40 percent of the $4.22 billion total of FIM-estimated needs for projects rated “critical” or “degraded.” Table II.1 shows the Air Force spending plan through fiscal year 2005 versus the estimated cost of projects rated critical or degraded using FIM criteria.
Table II.1: Air Force FIM Spending Plans Versus Needs Fiscal Years 1998-2005
aNo estimate provided for these 2 years. However, critical and degraded FIM projects for fiscalyear 1998 alone totaled just over $4 billion (see table II.2).
Source: Air Force.
Table II.1 shows that the estimated cost of FIM critical and degraded level projects will increase until fiscal year 2004, when resumed funding for FIM begins to reduce the total. However, due to the zeroing-out until fiscalyear 2003, the total of backlogged repairs will be about $4.22 billion by fiscal year 2005. Moreover, this funding is only for FIM projects rated critical or degraded—excluding those rated “minimal,” which were estimated to cost $3.4 billion in fiscal year 1998 (see table II.2). Using this funding strategy, therefore, the amount of critical and “degraded’ repairs increases, while “minimal” ones remain unfunded.
Dollars in millionsFiscal year 1998 1999 2000 2001 2002 2003 2004 2005 Total
FIM funding planned by Air Force 0 0 0 0 0 246 666 782 1,694
Need above funding level (for critical/degraded projects)
a a 1,700 800 800 800 120 0 4,220

Appendix II
Air Force Strategy, Methods and Criteria for
Determining Real Property Maintenance
Requirements
Page 59 GAO/NSIAD-99-100 Real Property Management
An OSD official expressed skepticism about the wisdom and realism of the Air Force RPM funding strategy, noting that since the Air Force had only funded PML repairs, emergency repairs remain unfunded. Therefore, in the view of the OSD official, when emergencies occur, PML funds would be used for them—providing even less for PML. This, in turn, could increase the cost of repairs due to insufficient funds for PML.
FIM Assessment System
The Air Force’s FIM requires active and reserve bases to identify and prioritize repair and minor construction projects based on the impact that deficiencies are having on the capability of units to carry out missions of different types, in four broad categories.
Under FIM, repair projects (rather than individual buildings or facilities) are rated as “critical,” “degraded,” or “minimal,” referring to the existing impact of conditions on mission, defined as follows:
• A critical rating indicates a significant loss of installation mission capability and frequent mission interruptions; continuous work-arounds are needed.
• A degraded rating indicates a limited loss of installation mission capability; work-arounds to prevent mission disruption and degradation are often required.
• A minimal rating indicates marginal or no adverse impact to installation mission capability; work-arounds are seldom needed.
Impact ratings are not further quantified, and, to some degree, reflect the judgment of those doing the ratings. In contrast, the Marines use similar categories for impact on mission, but define most with specific quantified measures (e.g., critical impact is interfering with a mission specified percent of the time, in a year). (See app. IV.) FIM projects are funded from O&M and are for repair and minor construction. They do not include military construction, PML (day-to-day repair and maintenance), or funds from other accounts, such as family housing.
To determine FIM impact ratings, engineers may consult with the facility users and/or other engineering staff to determine how the project impacts the installation’s mission. For example, at Scott Air Force Base, several civil engineering staff met and collectively determined the ratings. The base civil engineer then approved them and forwarded them to the base’s major command.

Appendix II
Air Force Strategy, Methods and Criteria for
Determining Real Property Maintenance
Requirements
Page 60 GAO/NSIAD-99-100 Real Property Management
Mission Categories The impact ratings are used to rate the condition of four major mission categories—primary mission, mission support, base support, and community support—as follows:
• Primary mission—facilities and infrastructure that directly accomplish or indirectly support the installation’s primary mission. Examples include airfield pavements, navigational aids, and missile alert facilities.
• Mission support—facilities that support the installation’s primary mission, some infrastructure, and primary emergency response facilities that provide immediate life support and rescue service. Examples include aircraft maintenance facilities, fire stations, and the base communication center.
• Base support—facilities and some infrastructure that are not directly tied to the primary mission, but are necessary to keep the installation functioning properly (e.g., administrative facilities and chapels).
• Community support—facilities that support the installation, such as lodging facilities and theaters.
As noted, the FIM ranks projects in terms of the impact that the deficiencies they are intended to address are having on current mission readiness, as well as their estimated cost. This is then rolled up into a “Mission Area Rating Matrix” (MARM), which also includes the PRV of RPM-funded facilities, and a facility investment index (FII) for each mission area, critical projects, and critical and degraded projects. (The FII is the estimated cost of FIM projects divided by the PRV of the facilities in which they will be done.) The FIM data for the estimated cost of projects from the MARM for the entire Air Force for fiscal year 1998 is shown in table II.2.
Table II.2: Fiscal Year 1998 Air Force FIM Project Ratings and Cost
Source: Headquarters, Air Staff, Office of the Civil Engineer.
Dollars in millionsFIM Rating
Mission category Critical Degraded Minimal Estimated total cost
Primary mission $178 $1,025 $544 $1,747
Mission support 134 1,459 1,120 2,713
Base support 33 1,102 1,444 2,580
Community support 10 94 290 394
Total $355 $3,681 $3,398 $7,434

Appendix II
Air Force Strategy, Methods and Criteria for
Determining Real Property Maintenance
Requirements
Page 61 GAO/NSIAD-99-100 Real Property Management
According to the FIM operational guide, “the Air Staff must use the MARM to develop” its facility investment strategy—that is, to prioritize repair projects based on the criticality of the impact on mission.8
FIM Data On-line The data from FIM are available on-line in summary form to the Air Force Office of the Civil Engineer, Programs Divisions, permitting rapid comparisons of the needs of different installations rated under FIM. Unlike the Army’s ISR (see app. I), the FIM on-line data do not provide an overall condition rating for the base. Instead, the FIM on-line data show the ratings for individual repair projects (i.e., critical, degraded, or minimal) and the estimated cost of these repairs. The system also shows the cost of all FIM projects in a given mission area at an installation. Moreover, the data can be easily “sliced and diced,” permitting comparison and analysis of the repair projects at any number of chosen installations or major commands. This makes it comparable to the way ISR data can be analyzed.
Further, the data gathered by FIM show a 7-year estimate of all the projects at an installation identified with regard to their level of urgency, their estimated cost, and the year in which the money will be spent on them. Since the year assigned for doing a repair project is based in large part on the base’s estimate of its urgency—including when a component or facility may fail—these timeline projections are a form of life-cycle analysis. Repair urgency is also based on what mission it affects and how important that mission is relative to other missions.
After a FIM rating of a given installation is reviewed and approved by the Facility Board or equivalent, the data that go into the FIM are inputted from the installation to the FIM computerized system. The data are administered by Gunter Air Station, Alabama, which maintains both the FIM and the Air Force’s RPM inventory data. The data are also simultaneously “released” to the installation”s major command for review. However, the data are not funneled through the major command. Once sent to the on-line system, the data are also available to the Programs and Analysis Branch.
Major commands review the ratings and can change them. Air Staff use the data to create an Air Force-wide MARM that they present to Air Force leaders to advocate for FIM funds. For fiscal year 1998, the FIM raters
8FIM guide, August 1997, p. 5.
Letter

Appendix II
Air Force Strategy, Methods and Criteria for
Determining Real Property Maintenance
Requirements
Page 62 GAO/NSIAD-99-100 Real Property Management
estimated that FIM projects would cost $7.4 billion, of which only 540(2 percent of 27,000) were rated as critical, estimated to cost $355 million, or about 5 percent of total FIM-estimated repairs. Forty percent of the projects were rated as “degraded,” and 58 percent as minimal. According to headquarters staff, the MARM can and should be used to prioritize RPM spending, so that funds are expended on critical and degraded categories. This, the staff told us, would also help reduce future repair costs for catastrophic failure.
Criterion to Determine Preventive Maintenance Needs
In addition to the rating and prioritizing of repair projects, the Air Force allocates funding for PML—a component of RPM—at 1 percent of the estimated PRV of infrastructure at a base. According to Air Force Civil Engineering staff, this level is adequate to satisfy PML requirements, given the recommendation of the 1989 DOD infrastructure study that recommended that the services annually budget a minimum of 1.75 percent of PRV for maintenance and repair, excluding any additional funds required to reduce existing backlog.9
While this 1-percent method for allocation provides a guaranteed minimum, it is based on a set percent of PRV rather than on a determination of physical deficiencies. It is a shorthand way of assuring a given funding minimum, which may equal, exceed or fall below actual needs. (See app. VII for more discussion.)
Preventive Maintenance May Not be Fully Funded
Although the Air staff uses the same 1 percent of PRV to allocate to its major commands, according to the Air Staff, the Air Force does not require major commands or bases to spend that allocated 1 percent of PRV for PML; commanders can use the funds in other areas. An Air Mobility Command official told us that they try to allocate one percent of PRV to PML, but that other needs may have a higher priority.
At Scott Air Force Base, a civil engineer estimated they actually receive only about a half percent of PRV for PML. Further, of the PML money, most is not used for this purpose, but rather to replace and repair items that are broken due to prior insufficient PML. For example, a 10-inch water main, now a $1-million critical FIM project, is being replaced because of inadequate PML.
9DOD, Renewing the Built Environment, March 1989, p. 28.

Appendix II
Air Force Strategy, Methods and Criteria for
Determining Real Property Maintenance
Requirements
Page 63 GAO/NSIAD-99-100 Real Property Management
A base civil engineer from the Alabama National Guard said that they had replaced overhead doors that would not have been needed if adequate PML had been done to preserve the existing doors. When PML is not done, the work will (eventually) show up as a FIM project and typically cost more than the amount of PML needed, according to the Alabama official.
Another factor in Air Force RPM decision-making is the criterion for repair versus replacement. The Air Force has a guideline that requires reconsideration of a project when the estimated cost of the project exceeds 70 percent of the PRV of a building.10 As in the other services, this is a guideline.
Installation Views on FIM Some facilities management engineers at bases we visited expressed the view that the FIM ratings may be too restrictive, citing the fact that only2 percent of the 27,000 Air Force-wide FIM projects were rated critical for fiscal year 1998; these represented about 5 percent of the total estimated cost of repairs ($355 million of $7.4 billion). However, headquarters Air Staff told us that the Air Force intentionally made the ratings more restrictive than under CFA and that FIM was to intended to reflect only the Air Force’s most urgent needs. In their view, CFA ratings were too subjective, resulting in many facilities rated as critical.
Some base engineers told us that because FIM ratings were too restrictive, few projects would get a critical rating and a chance of being funded. For example, at one base that we visited, of the total 103 projects, none were rated critical as of November 1997. Civil engineering staff at another Air Force Base said that they were concerned that few critical ratings might appear to make the Air Force look in better shape than it was. At yet another base we visited, 6 of 88 projects were rated critical and engineering officials expressed concern that FIM would make their base look in better shape that it was. They said that the FIM did not show that 132 roofs were leaking and were concerned that the system would not convey an accurate overall picture of conditions at the base.
Using the FIM rating system, although total estimated Air Force repair backlog increased about 278 percent from fiscal year 1997 to fiscal
10Air Force Instruction 32-1032, 11 May 1994, “Planning and Programming Real Property Maintenance Using Appropriated Funds,” p. 6.

Appendix II
Air Force Strategy, Methods and Criteria for
Determining Real Property Maintenance
Requirements
Page 64 GAO/NSIAD-99-100 Real Property Management
year 1998 ($2.667 billion to $7.434 billion), only 5 percent in dollar value($355 million) under FIM was rated critical.
Engineering officials at three bases we visited said they were concerned the Air Force would only fund those projects with critical ratings in the primary mission category. They expressed concern that other mission areas, especially community support, would not receive funds. (As noted, for fiscal years 1998-2002, the Air Force has “zeroed out” all funding for repair projects.) An official at headquarters stated that bases can spend more on repair projects if they choose, noting that the amount of funding received by bases through their major commands is not the maximum spending allowed. He added that bases can move funds from other O&M accounts, if available.
At one of the bases we visited, facilities officials said that in their view, many base support and community support projects could not get a critical rating because funding was being reserved only for critical projects, and base commanders wanted to reserve it for facilities connected to operations. Further, because ratings were too restrictive, in their opinion, funding all critical projects in all mission areas still would not provide them with sufficient funds for repairs that they felt needed to be made.
Air National Guard Bureau Uses Additional Criteria
Facilities held by the Air National Guard (ANG) represents about 5 percent of the Air Force’s total PRV. However, the ANG accounts for about half of Air Forces bases (103 of 202 identified to us for the purpose of our questionnaire). In the ANG, FIM projects and large PML projects are normally contracted out and are 100 percent federally funded. Other activities, such as smaller PML—changing filters, adjusting equipment, etc.—are covered by the state/federal agreement for Facility Operation and Maintenance Activities (FOMA). Under this agreement, the state and federal government share costs for a variety of items such as utilities, rental of equipment, state employees’ salaries, and supplies and materials. The cost-share ratio depends on the mission of the unit, but according to the ANG Bureau (i.e., headquarters), the typical share is 75 percent federal and 25 percent state.11
11The federal share of FOMA is based on manpower standards, actual salary rates for the state, and historical/predicted costs for utilities, services, supplies, and materials.
Appendix II
Air Force Strategy, Methods and Criteria for
Determining Real Property Maintenance
Requirements
Page 65 GAO/NSIAD-99-100 Real Property Management
For maintenance and repair that is 100-percent federally funded, such as FIM projects, the ANG Bureau uses a mix of factors as criteria to determine the annual amount each base receives—square footage and condition, pavement area and condition, area cost factors, and overall real property funds availability.
Daily Repair and Maintenance
In the Air Force, base civil engineers (BCE) and building users identify repair and minor construction projects. Building users report problems to civil engineering, and civil engineering staff, through their day-to-day work, report problems. Among the 200 Air Force installations that responded to our survey, approximately 12.4 percent of inspectors were reported to be engineers or skilled craftsmen, with the remainder being building users, and about a half percent being contractors.
Typically, work orders for repairs are entered daily into a base’s work order system, upon receipt of a request for repair. When building users identify repairs, civil engineering staff determine whether the requested repair or minor construction is valid through personal knowledge of the facility or inspection. For example, at a small base, the civil engineer would have personal knowledge of the age of systems, such as an air conditioning system in the command building. If the system historically had not cooled the building adequately, the base engineer would know that a work order to repair the system to properly cool the building is a valid request. At larger bases, civil engineers may have to visit the site to validate the request.
Through a work order board that meets as needed, BCEs prioritize projects according to whether in-house engineering can handle or whether the projects need to be contracted out. BCEs enter the estimated cost of the contract projects into the Air Force’s Projects by Contract Management System (PCMS).12 (These data are also centralized at a Gunter Air Station facility that maintains the FIM database.)
Civil engineers use PCMS and real property records to create the FIM database.13 BCEs update PCMS projects to reflect FIM mission impact ratings, and real property records provide the specific mission category
12PCMS was implemented around 1989 and is the Air Force civil engineering system that tracks contract work from design to completion. All FIM projects are in PCMS.
13One FIM objective was to use existing databases and reduce the workload of gathering the information. We did not verify data in PCMS or in real property records.

Appendix II
Air Force Strategy, Methods and Criteria for
Determining Real Property Maintenance
Requirements
Page 66 GAO/NSIAD-99-100 Real Property Management
codes for each base. In fiscal year 1998, base engineers assigned initial FIM mission impact ratings to all projects in PCMS.
Methods to Ensure Rating Validity
FIM ratings are validated through a review and approval process. After base engineers assign an initial rating to all PCMS projects, the base commander reviews/approves the ratings. Typically, each base in the Air Force has a facility board that consists of all the base’s unit commanders. This board assists the base commander in making facility infrastructure decisions, including approval of FIM project ratings. BCEs present the FIM ratings at a board meeting and resolve any differences in opinions. The base engineer also obtains the commander’s priorities for the projects and includes this ranking in the FIM database.
Our survey results reflected the use of a FIM review and approval process. Installations reported a number of ways in which initial ratings are reviewed, with use of outside contractors ranking the lowest, at about3 percent. Table II.3 summarizes base responses.
Table II.3: Steps to Ensure FIM Project Ratings Are Valid
Source: Responses to question 9, GAO survey.
Methods to Ensure Consistency in Ratings
When asked about the steps taken to ensure ratings given by one rater would be, on average, the same reported by another rater, 51 percent of respondents said they had no formal procedures or mechanisms other than the expertise and/or training of their staff who do the ratings. Forty-eight percent wrote in about other methods used to ensure consistency. Table II.4 shows the responses.
Step to ensure validityPercent of respondents
citing method
Rely on expertise of assessor; no formal procedures used 21
Selected worksheets are reviewed by facility management office staff
46
Facility staff makes follow-up visits to verify reported problems on a sample of selected rating worksheets
25
Outside contractors used 3
Other validation methods 34

Appendix II
Air Force Strategy, Methods and Criteria for
Determining Real Property Maintenance
Requirements
Page 67 GAO/NSIAD-99-100 Real Property Management
Table II.4: Steps to Ensure Consistency
Source: Responses to question 10, GAO survey.
Installation Views on Constraints
Regarding the overall quality of the FIM process, 61 percent reported the primary factor affecting overall quality was the shortage of resources—insufficient time and/or budget to carry out assessments. Table II.5 shows the responses.
Table II.5: Factors That Constrain Assessment Quality
Source: Responses to question 11, GAO survey.
When asked how methods could be changed, 64 percent of the responding bases reported that the Air Force should place much more emphasis on long-range planning, while de-emphasizing annual assessments of facilities. Thirty-nine percent responded that buildings and facilities should be rated primarily according to engineering, life-safety and other factors, as shown in table II.6.
Step to ensure consistencyPercent of respondents
citing step
No formal procedures used other than expertise of the raters 51
Set number or percent of facilities are reinspected by different assessors
3
Random sample of facilities are reinspected by different assessors
7
Outside contractors used 1
Other method to ensure consistency 48
Constraining factorPercent that checked
factor
Shortage of personnel 45
Shortage of trained personnel, that is, engineering or skilled craft background
42
Shortage of resources (that is, insufficient time and/or budget to carry out assessments)
61
Other 9
Does not apply--no factors create a significant constraint on the quality of reviews of facility conditions
22

Appendix II
Air Force Strategy, Methods and Criteria for
Determining Real Property Maintenance
Requirements
Page 68 GAO/NSIAD-99-100 Real Property Management
Table II.6: How Bases Would Change Determining RPM Requirements
Source: Responses to question 13, GAO survey.
Some Major Commands Supplement FIM With Other Assessment Tools
We found the Air Force allows major commands to use assessment tools in addition to FIM to rate the condition of their facilities and prioritize RPM spending. Three major commands—the Air Force Materiel Command, the Air Combat Command, and the Air Force Academy—use non-FIM assessments. Command officials told us these systems provide more detailed information about projects than FIM does and helps them make more informed decisions regarding project funding. The Air Force Academy uses a system that includes life-cycle principles of property management.
The systems used by Air Force Materiel Command and the Academy are based on engineering assessments as to whether facilities are working adequately. In contrast, FIM prioritizes projects based on how deficiencies are impacting missions. Air Staff stated that commands are allowed to use other tools if it helps them to better manage their facilities. Table II.7 outlines the three systems’ major features.
Table II.7: Additional Assessment Tools That Supplement FIM
Source: Air Force civil engineering officials at each of the cited commands.
Proposed change Percent agreeing
Rate building/facilities primarily according to engineering and life-safety criteria, while decreasing the role of aesthetics
39
Place much more emphasis on long-range maintenance planning while de-emphasizing annual assessments
64
Other 28
Major command Name of system Principle characteristic
Air Force Materiel Command Infrastructure Condition System (ICS) Provides engineering assessment/ratings on the physical condition of the system on a scale of 0 to 10.
Air Combat Command Civil Engineering Risk Matrix (CERM) Rates projects impact on mission more extensively than FIM and provides a measure indicating probability of funding from low to high.
Air Force Academy Facility Investment Strategy Rates buildings not projects, updated each year by a contractor; buildings managed to extend maximum life of facility.

Appendix II
Air Force Strategy, Methods and Criteria for
Determining Real Property Maintenance
Requirements
Page 69 GAO/NSIAD-99-100 Real Property Management
Inspection Condition System The Air Force Materiel Command Inspection Condition System is a series of checklists that establish detailed rating criteria for evaluating the physical condition of the components and subcomponents of five designated infrastructure systems—building systems, utility systems, pavement and grounds, airfield systems, and water and wastewater system. Inspectors read physical condition descriptions and assign a rating scaled from 0 to 10 (0 is complete failure; 10 is new condition) that best describes the subcomponents physical condition. Each subcomponent is then assigned a weighting factor that best represents the importance of the subcomponent to the overall component system. Component ratings are then used to determine project ratings. The Air Force Materiel Command will continue to use its system along with FIM because, officials told us, it gives the command an engineering-based technical assessment of projects. An Air Force Materiel Command official said that FIM provides the impact on the mission and Inspection Condition System tells them technically how well the system, such as a heating and air conditioning system, is performing.
Civil Engineering Risk Matrix System
The Air Combat Command planned to require its bases to use its Civil Engineering Risk Matrix System in addition to the FIM through fiscalyear 1998, after which it would transition to FIM only. The matrix system was similar to FIM in that it rates projects according to mission impact. It has five mission areas and impact ratings, each with a numerical value. When combined, the values produce a funding probability from low to maximum. The five impact ratings are catastrophic, critical, essential, required, and desired. Catastrophic is valued at seven, whereas desired is valued at one. The Air Combat Command developed the matrix to provide it with a risk-based methodology to advocate for project funding.
Facility Investment Strategy In 1995, the Air Force Academy developed a Facility Investment Strategy that gave it an engineering analysis of facility and infrastructure conditions and that utilizes some elements of life-cycle planning. In this system, buildings have an estimated lifespan, and maintenance is geared to maximizing the lifespan. The system determines all work that needs to be done for buildings, regardless of the urgency. In contrast, FIM determines projects that need to be done and prioritizes them by mission impact.
With the information the system provides, the academy developed condition indices that monitor the effects of various levels of investment. The indices are also used to predict the anticipated condition of the asset

Appendix II
Air Force Strategy, Methods and Criteria for
Determining Real Property Maintenance
Requirements
Page 70 GAO/NSIAD-99-100 Real Property Management
based on the amount of investment made to renew the asset.14 According to the academy, they plan to continue to use their system along with FIM. They told us that their system gives them more detailed building information than does FIM and that they continue to add to the detail each year as they do annual updates. Each year the academy pays a contractor about $25,000 to $30,000 to update and analyze the program data.
Allocation of RPM Resources
The Air Force plans to allocate RPM resources based on two factors—the1 percent of estimated installation PRV and the prioritization scheme created under FIM. However, through fiscal year 2002, no funding will be provided to FIM-rated repair projects; the only RPM funding will be for preventive maintenance level repairs. According to FIM guidance, the Air Force will use the FIM Mission Area Matrix to establish investment targets for each mission area tied to an Air Force investment strategy. Headquarters will then allocate funding to the major commands based on their share of the targeted requirement. According to headquarters, targets have not yet been established since FIM is still new.
Almost Half of Air Force PRV Estimate Needs “Correction”
Since the Air Force allocates a very substantial portion of total RPM spending on the basis of PRV (100 percent through fiscal year 2002), it is critical that installations calculate accurately. However, this may not be the case, as noted in a contractor analysis of the Air Force’s PRV model, which found that only 55 percent of the Air Force’s estimated $204 billion (fiscal year 1996) PRV “has been determined . . . to be acceptable”; “the Air Staff has determined that the remaining 45 percent of the PRV data is in need of review and validation.”15 “The most recent calculation of PRV . . . contains anomalies that required validation or correction.”16 The Air force indicated that it is addressing this issue.
In addition, the contractor’s report notes that some PRV estimates are unreliable because the real property records “do not contain the level of
14This system and the use of condition indices influenced the development of FIM. After being briefed on the academy’s system, the Air Force Vice Chief of Staff directed the Air Force Office of the Civil Engineer to develop an index, similar to the one developed by the academy, for use by commanders to analyze future facility construction and repair requirements.
15USAF: “Short Term Analysis Report: Air Force PRV Model,” October 1997, p. 2.
16Delta Research Division of BTG, Inc.: “Short Term Analysis Report: Air Force PRV Model,” October 1997, p. 1.

Appendix II
Air Force Strategy, Methods and Criteria for
Determining Real Property Maintenance
Requirements
Page 71 GAO/NSIAD-99-100 Real Property Management
detail required to accurately match an appropriate unit cost to the real property record quantity.”17 As an example, the report cites the fact that water lines are only identified as a “generic type,” but not the size or type of water line, which it notes can range in cost from $7 per linear foot to about $60 per linear foot for 24-inch cast iron pipe. The report provides no estimate of the potential range of inaccuracy in the PRV estimates for Air Force facilities. In sum, the PRV measure’s estimate appears open to misinterpretation and, hence, miscalculation.
RPM Needs Exceed Requests
Air Force bases’ responses to our survey reported that in fiscal year 1997, they had $5.9 billion in repair needs, and had received 18.3 percent of that total ($1.08 billion) in RPM funding. In responses to the survey, as shown in table II.8, the lack of linkage between requirements and allocation of resources was one of the top five most frequently cited weaknesses in the Air Force’s RPM management.
Table II.8: Top Five Frequently Cited Weaknesses
Source: Response to question 12, GAO survey. Total exceeds 100 percent because more than one choice was possible.
Air Staff uses FIM to advocate for resources. When we asked bases what they would change about the method used to allocate RPM resources, about 50 percent wrote that they would not change the system. Of the other 50 percent, about half (48 percent) recommended a variety of changes ranging from the receipt of a lump-sum amount at the beginning of the year to simply increasing the dollar amount they received.
17Delta Research Division of BTG, Inc., op. cit., p. 4.
Weakness Percent citing weakness
Little or unclear linkage between RPM needs assessment and resource allocation
39
Rollup oversimplifies conditions 37
Condition assessments/requirements determination are too subjective
34
Ratings do not tell what is wrong within facility or mission category
32
Little/unclear linkage between condition determination and budget estimation
29

Appendix II
Air Force Strategy, Methods and Criteria for
Determining Real Property Maintenance
Requirements
Page 72 GAO/NSIAD-99-100 Real Property Management
When asked to suggest methods on how funding is allocated by their major commands, there appeared to be no clear consensus with regard to four proposed alternatives, other than a 60- to 40-percent opposition to decentralizing control of RPM funds downwards from the major commands. Table II.9 shows the percent of bases’ that agreed with four specified alternatives.
Table II.9: How Bases Would Change Funding Allocations
Source: Responses to question 22, GAO survey.
Bases Visited We visited Eglin Air Force Base, Fort Walton Beach, Florida; Pope Air Force Base, Fayetteville, North Carolina; and Air Combat Command, Langley Air Force Base, Langley, Virginia, to ask facilities management officials how RPM requirements are determined, how funds are allocated, and their views on the RPM process. We asked similar questions at the following sites, where we also pretested our survey at some, and subsequently validated it at others, as indicated.
Sites visited to pre-test the questionnaire
Maxwell Air Force Base (Air Education and Training Command), Montgomery, Alabama;Seymour-Johnson Air Force Base (Air Combat Command), Goldsboro, North Carolina;Wright-Patterson Air Force Base (Air Materiel Command), Dayton, Ohio; andAir Force Materiel Command, Wright-Patterson Air Force Base, Dayton, Ohio.
Suggested changePercent of respondents
citing change
Funding for RPM should be based primarily on the physical deficiencies present in facilities
56
Funding should not be based on a fixed increase above or below the previous year’s level
51
Funding be based on average age, total square footage and number of facilities
45
RPM funding/allocation should not be centrally managed by major command
40

Appendix II
Air Force Strategy, Methods and Criteria for
Determining Real Property Maintenance
Requirements
Page 73 GAO/NSIAD-99-100 Real Property Management
Sites visited to validate questionnaire
Alabama Air National Guard, Birmingham, Alabama;Scott Air Force Base (Air Mobility Command), Belleville, Illinois;Tinker Air Force Base (Air Force Materiel Command), Oklahoma City, Oklahoma; and Air Mobility Command, Scott Air Force Base, Belleville, Illinois.

Page 74 GAO/NSIAD-99-100 Real Property Management
Appendix III
Navy Strategy, Methods, and Criteria for Determining Real Property Maintenance Requirements Appendix III
In this appendix we discuss the Navy’s strategy, methods and criteria for determining RPM requirements and allocating resources, including the responses to a questionnaire on RPM-related issues that we sent to Navy installations and major claimants.1 In particular, we examine the key components of the Navy's system for evaluating base infrastructure conditions and estimating RPM costs, its Annual Inspection Summary (AIS) and Shore Base Readiness Report (BASEREP).
Background At the end of fiscal year 1998, the Navy managed 31,040 buildings totaling almost 343 million square feet. According to the Navy Budget Office, the Navy’s operations and maintenance (O&M) fiscal year 1999 appropriation for Navy and Navy Reserve RPM is $973.3 million. The Navy estimates that its backlog of critical-rated repairs will be just over $2.5 billion at the end of fiscal year 1999.2 The Deputy Chief of Naval Operations (Logistics) Facilities and Engineering Division has oversight responsibility for RPM. According to the Navy, the plant replacement value (PRV)3 of Navy facilities, as of fiscal year 1998, was estimated at about $103 billion.4
Navy RPM needs can be funded through six appropriations: O&M, Navy; O&M, Naval Reserve; Research, Development, Test and Evaluation, Navy; the Navy Working Capital Fund; Military Construction, Navy; and Naval Reserve. Not all installations receive funds from all six appropriations. The working capital fund and Navy O&M also fund property inspections to identify and report backlogs. While military construction funds are not intended for RPM, they may reduce RPM needs when used to replace or extensively renovate an existing facility.
1We sent the survey, which asked about installation facility inventory, RPM processes, and funding, to 132 Navy installations; 126, or 95 percent, returned the questionnaires. See app. X for a copy of the survey. Major claimant is the Navy’s equivalent term for major command in the Air Force and Army. These are the headquarters for a larger number of installations with similar functions.
2The Navy rates backlog as either critical or deferrable; only the critical backlog is officially reported to the Congress.
3PRV is defined by OSD as “the cost to replace the current physical plant (facilities and supporting infrastructures) using today’s construction cost (labor and materials) and standards (methodologies and codes).”
4This includes family housing ($10 billion in PRV), but excludes facilities funded by working capital funds, which have an estimated PRV of $35 billion.

Appendix III
Navy Strategy, Methods, and Criteria for
Determining Real Property Maintenance
Requirements
Page 75 GAO/NSIAD-99-100 Real Property Management
Navy RPM Funding Strategy
The Navy estimates that it would take annual funding equivalent to about 2.1 percent of PRV to keep the conditions of its facilities stable, but was funding RPM at about 1.5 percent of PRV in 1998 for O&M-funded properties. However, according to the Navy, it will increase RPM spending to 1.84 percent of PRV in fiscal year 2001, with the total gradually rising to 2.59 percent of PRV by fiscal year 2005. The Navy estimates that this will result in holding increases in critical-rated backlog to no more than about 10 percent over end of fiscal year 1998 levels by fiscal year 2005.5 The spending planned for fiscal years 2001-2005 would cap the growth in critical backlog at about $2.75 billion. The Navy has targeted some of the planned RPM spending to barracks, with the goal that critical-rated repairs for barracks will be “virtually eliminated” by fiscal year 2004, if the funding is provided as planned.
While the Navy RPM funding strategy appears to be reasonably consistent with a stated Navy goal to prevent an increase in repairs rated “critical,” it is not clear that noncritical rated backlog growth will be adequately addressed. The Navy stated that even with the increased funding for critical-rated repairs, most facilities’ RPM would be funded at a level resulting in either a C2 or C3 readiness level. C3 means that the facilities in the category (e.g., aviation, waterfront operations, training) have only marginally met the demands of the mission, but with major difficulty. For fiscal year 2001, RPM funding will keep 4 of 11 facility categories at theC2 level, with the remainder at C3.6 The Navy told us that eventually some noncritical repair needs could become critical, as conditions worsen. The Navy funding strategy for RPM is the result of balancing RPM needs against the other competing priorities of the Navy.
5Estimate is from a Navy November 1998 briefing and technical comments on draft of this report. A June 1999 Navy graph shows total critical backlog increasing from just under $2.5 billion at the start of fiscal year 1999 to about $2.75 billion for fiscal years 2002-2003 and declining slightly thereafter.
6According to the Navy, for the purpose of calculating these ratings, it reduced its facilities from 28 to 11 mission categories. These include barracks, aviation (runways and associated facilities) training, and utilities.
Appendix III
Navy Strategy, Methods, and Criteria for
Determining Real Property Maintenance
Requirements
Page 76 GAO/NSIAD-99-100 Real Property Management
Methods and Criteria to Determine Maintenance Needs
Overview of Navy RPM The Naval Facilities Engineering Command (NAVFAC) is responsible for the technical direction of the Navy’s real property inventory. The Command maintains a database of all Navy real property, including property of the Marine Corps. The database contains various data elements, including the unit identification code of the plant property accounting unit, date acquired, government cost, current plant value (CPV), investment category, use, and size (square feet, statute miles).
NAVFAC’s objective is to make optimum use of available resources for RPM. Its goals include ensuring the most efficient use of resources, performing scheduled maintenance to avoid breakdowns, and performing routine maintenance to avoid having to perform major repairs. These tasks involve inspecting facilities, setting work priorities, planning and estimating work, and reporting facility condition.
The Navy has maintained two facility condition reporting systems since 1982: the Annual Inspection Summary (AIS) and the Shore Base Readiness Report (BASEREP). These systems serve different purposes, but overlap in that they both involve installations’ reports on aspects of facilities’ condition. Both are based on engineering inspections of facilities. AIS, the Navy told us, is based on a fence-to-fence inspection of facilities to rate deficiencies, rather than individual buildings. Deficiencies are rated as either critical or deferrable; critical are those that must be funded within12 months. The purpose of the AIS is to develop realistic, long-term maintenance plans that will reduce the Navy's RPM backlog. AIS is the summary of work and costs to correct deficiencies for each facility. The BASEREP’s purpose is to link installation resources with readiness and workload. BASEREP reports on facility quantity and condition, major equipment quantity and condition, and personnel. BASEREP is the installation commander's assessment of the installation's ability to execute assigned missions; it includes explanations of remedial actions needed to

Appendix III
Navy Strategy, Methods, and Criteria for
Determining Real Property Maintenance
Requirements
Page 77 GAO/NSIAD-99-100 Real Property Management
correct deficiencies. Ratings are by mission areas and include the status of all the facilities supporting the assigned missions.7
The Navy’s AIS does not include Marine Corps activities, industrial and research plants owned and operated by private contractors, military assistance advisory groups and defense attache offices, petroleum reserves, Reserve Officer Training Corps units, family housing, fleet moorings, and property funded through the Naval Telecommunications Command and Naval Security Group Command activities.
NAVFAC publishes guidance and handbooks on managing real property, including procedures and guidance for conducting and documenting facilities inspections. Navy instructions require installation commanding officers to accomplish missions assigned by their major claimant, including the management of related budgeting and obligation of funds. They are responsible for efficiently and effectively managing installation facilities to ensure they are adequate to accomplish the missions.
Navy RPM Definitions The Navy has defined maintenance, repair, and construction as follows:
• Maintenance: the recurring, day-to-day, periodic, or scheduled work required to preserve or return a real property facility to such a condition that it may be used for its designated purpose.
• Repair: the return of a real property facility to such condition that it may be effectively utilized for its designated purpose, by overhaul, reconstruction, or replacement of constituent parts or materials that are damaged or deteriorated to the point where they cannot be economically maintained.
• Construction: the erection, installation, or assembly of a new real property facility; or the addition, expansion, extension, alteration, conversion, or replacement of an existing real property facility; or the relocation of a real property facility.
The Navy has established criteria, including funding limits, for facilities projects to comply with laws and regulations. Major claimants set the limits of funds obligation for each base. A deficiency under the limits and within the Navy definitions for maintenance and repair may be funded by
7Navy briefing, June 1998 and Navy email communication to GAO, September 1997.

Appendix III
Navy Strategy, Methods, and Criteria for
Determining Real Property Maintenance
Requirements
Page 78 GAO/NSIAD-99-100 Real Property Management
the installation. Projects over the limits must be approved and funded by the major claimant as a special project.
BASEREP The BASEREP is an annual report of each installation's ability to perform its missions and shows the level of mission readiness, listed by three categories, including the quantity and condition of facilities, personnel, and quantity and the condition of major equipment. Its purpose is to link financial and personnel resources with readiness and workload. BASEREP criteria define 28 mission areas and major claimants assign mission areas to their installations. Installation commanding officers rate their installations’ abilities to perform the assigned missions according to C-ratings. The four C-ratings are
• C1—has fully met all demands throughout the reporting period.• C2—has substantially met all demands, with only minor difficulty.• C3—has only marginally met the demands, but with major difficulty.• C4—has not met vital demands.
The C-ratings apply to the installation's asset categories—(1) personnel, both military and civilian; (2) facilities’ quantity and condition; and(3) major equipment quantity and condition. In applying the ratings to facilities, quantity addresses the number and size regarding mission and condition addresses deficiencies that should be corrected to achieve mission requirements. The commanding officers provide additional narrative assessments describing the problems and the proposed solutions for all missions rated C3 or C4.
Because these ratings are not quantified and involve individual judgments by commanders, a Navy RPM official at one installation described the BASEREP as “a very subjective assessment.”
Three Navy sites we visited had some C4 mission ratings. The Norfolk Naval Shipyard reported C4 in its port operations mission area; NAS Oceana reported C4 in its bachelor housing mission area; and Public Works Center San Diego reported C4 in its research, development, test, and evaluation (RDT&E) and administrative services missions.
According to BASEREP criteria, AIS data should not drive the BASEREP assessment, but BASEREP deficiencies should be addressed in the AIS. Major claimants provide supplemental guidance to their installations on reporting criteria. According to base officials, the Chief, Naval Education
Appendix III
Navy Strategy, Methods, and Criteria for
Determining Real Property Maintenance
Requirements
Page 79 GAO/NSIAD-99-100 Real Property Management
and Training (CNET) directed that only facilities’ condition and quantity ratings be provided on its installations’ September 30, 1997, BASEREPs; the major claimant did not want the personnel or equipment ratings.
AIS AIS is the Navy's means of identifying and reporting its cumulative backlog of real property maintenance and repair. It is also the tool through which installation commanders identify and report RPM deficiencies and plan, budget, and fund their RPM. AIS contains the critical and the total maintenance and repair backlog as of the fiscal year’s end. AIS also includes the names of the organizations that performed facility inspections, the percentage of inspections completed, and explanations of large increases in the backlog.
The AIS divides all deficiencies into two types: critical and deferrable. A deficiency is rated critical if it “must be corrected within 12 months” and “will impact mission, affects quality of life or has safety or environmental hazard potential” according to the Naval Facilities Engineering Command’s Inspection of Shore Facilities manual.8 The estimated cost of fixing the deficiencies that qualify as critical is reported to OSD as the backlog of maintenance and repair. If a critical deficiency has not been addressed for 4 years, it is to be classified as deferrable.
Inspections to Identify Deficiencies
The three volumes of the Inspection of Shore Facilities manual describe the criteria and procedures for performing the three types of facilities inspections—operator, preventive maintenance, and control. The latter is the primary source for AIS and budget data.
Navy inspection criteria require a thorough examination of each facility, evaluation of the operator, and preventive maintenance inspections, and identify related resource requirements as a basis for funding requirements. Inspections are expected to be planned, scheduled, and performed by qualified inspectors and are required for structural, mechanical, electrical, and roof repairs.
According to Navy criteria, inspectors should (1) have a technical trade background; (2) be experienced in maintenance and repair operations, including maintenance standards, safety, health, and building codes; and
8NAVFAC M0-322, vol. I, March 1993, p. 3-5.
Letter

Appendix III
Navy Strategy, Methods, and Criteria for
Determining Real Property Maintenance
Requirements
Page 80 GAO/NSIAD-99-100 Real Property Management
(3) have the ability to write clear reports of facility conditions. The criteria include requirements for a facility condition report and describe its three components: a facility condition detailed deficiency list, facility inspection checklists, and facility condition summary sheet. These documents are to be used to identify packages of work for planning, estimating, and programming maintenance and repairs into the installation's work control system as well as identifying budget-oriented resource requirements. They form the basis for AIS and BASEREP.
Navy inspection criteria also cover the requirements for compliance with regulatory standards and safety codes; that is, national building codes for corrosion, electrical elevator, plumbing, track safety standards, Occupational Safety and Health Administration requirements, and environmental regulations. NAVFAC publishes other manuals containing inspection and maintenance guides for many facilities, including maintenance of railroads, building maintenance, structures, paints and protective coatings.
The criteria for frequency of facility inspections are shown in table III.1. These are suggested frequencies and installations may deviate when resources are not available.
Table III.1: Type and Frequency of Inspection
Source: Navy.
Navy criteria call for inspectors to prepare for inspections by reviewing facility records, including floor plans, the status of major alterations and maintenance projects, lists of related contracts and warranties, and lists of tenants and maintenance persons. The six installations and the Public Works Center we visited used in-house staff or contractors to conduct their control inspections. Our review indicated that in-house inspectors scheduled their inspections, reviewed property records, and other files they maintained for each facility. After conducting the inspections, they
Type and frequency of inspection (in years)
Facility’s mission relationship Structural Electrical Mechanical Roof
Direct mission support 2 2 2 1
Indirect mission support 3 3 3 1
Nonmission support 4 4 4 2
Inactive or excess 5 5 5 3

Appendix III
Navy Strategy, Methods, and Criteria for
Determining Real Property Maintenance
Requirements
Page 81 GAO/NSIAD-99-100 Real Property Management
typically prepared the worksheets, preliminary cost estimates of the work they identified, and entered the data into the installation's work order system. The Public Works Center submitted its inspection reports and prepared work orders for the deficiencies.
Estimating Costs to Correct Deficiencies
Navy criteria call for inspectors to prepare preliminary cost estimates of the work identified and suggest four sources for estimating labor and material costs, including NAVFAC P-716, Unit Price Standards, R.S. Means Company, Inc., or Richardson Dodge (the latter two are private companies that research and publish cost estimates). Officials told us their inspector/estimators use the manuals to estimate costs of needed work. They determine the scope of the maintenance and repair work they identified and use the manuals to price the costs of the various types of crafts and materials. Projects that cost more than the installation commanding officer's approval limits are special projects and generally must be approved and funded by the installation's major claimant.
Installation commanders submit their lists of needed special projects to their major claimant for review and funding. Major claimants review the special projects, assign priorities, and fund those to the extent they have remaining funds. Review boards evaluate the projects and recommend priorities.
Relationship Between BASEREP and AIS
Officials at one of the installations we visited said that BASEREP objectives should support and be consistent with the AIS submission. However, because there are 28 mission areas in BASEREP but only 18 in AIS, with the latter encompassing the BASEREP’s areas, it is clear the 2 do not match exactly. AIS and BASEREP use the same data from inspections but rate different RPM-related elements. According to the Navy, both AIS and BASEREP ratings are used “at all levels of the chain of command to allocate resources among competing projects.”9
Validation of Inspection Results
Navy criteria call for inspectors to have training and experience in the craft trades. The staff inspectors at the locations we visited were engineering technicians who were experienced in the trades and in facilities inspection,
9Navy email communication to GAO, September 1997.

Appendix III
Navy Strategy, Methods, and Criteria for
Determining Real Property Maintenance
Requirements
Page 82 GAO/NSIAD-99-100 Real Property Management
according to Navy officials. At one installation that contracted for its inspections, officials told us the inspectors had equivalent experience.
Responses to our questionnaire showed that the installations used different control inspection review and approval procedures. About 53 percent reported that facility management staff reviewed selected worksheets and judged ratings based on personal knowledge. About 20 percent said they used other methods such as facility boards and higher commands to validate inspection results. Eleven percent said they used outside contractors. Table III.2 shows the responses.
Table III.2: Steps to Ensure Inspections Are Valid
Source: Responses to question 9, GAO survey.
When asked about the steps taken to ensure ratings given by one staff would be, on average, the same reported by another staff, 60 percent said they had no formal procedures or mechanisms other than the expertise and/or training of the staff who did the ratings. About 38 percent wrote about other methods used to ensure consistency. Most described an inspection review process in which ratings are reviewed up the chain of command. Table III.3 summarizes these answers.
Table III.3: Steps to Ensure Consistency
Source: Responses to question 10, GAO survey.
Step to ensure validity Percent citing step
Rely on the expertise of assessor; no formal procedures used 23
Facility management staff review selected worksheets 53
Facility staff make follow-up visits to verify reported problems on a sample of selected rating worksheets
19
Outside contractors are used 11
Other validation methods. Specify. 20
Step to ensure consistency Percent citing step
No formal procedures used other than expertise of the assessor 60
Different assessors reinspect facilities 4
Different assessors reinspect a random sample of facilities 7
Outside contractors are used 6
Other method used to ensure consistency 38

Appendix III
Navy Strategy, Methods, and Criteria for
Determining Real Property Maintenance
Requirements
Page 83 GAO/NSIAD-99-100 Real Property Management
Regarding the overall quality of the control inspection process, 71 percent of the respondents reported the primary factor affecting overall quality was the shortage of resources. Table III.4 illustrates these responses.
Table III.4: Factors That Constrain the Quality of Assessments
Source: Responses to question 11, GAO survey.
When asked how methods could be improved, 76 percent of the respondents reported that they agreed with combining AIS and BASEREP, while 50 percent said long-range planning should get more emphasis.10
Allocation of RPM Resources
The Navy Comptroller allocates obligation authority to various major claimants, which in turn allocate it to their installation commanders. The Navy Facilities and Engineering Division told us that most commands withhold 4 to 4.5 percent of total annual RPM spending for mid-year release. After mid-year review of competing needs, they release the reserve funds; these may be used for either general RPM, or for special projects, or emergency repairs. Special projects are construction, repair, maintenance, or equipment installation projects that exceed the funding authority of the installation commander but fall below the threshold for military construction. Navy guidelines restrict special project funding to no more than 10 percent of total RPM annual spending.
Six of the installations we visited received Navy O&M obligation authority from their major claimants. They also received funds from tenants that paid for some services on a reimbursable basis. RPM funds were managed
Constraining factorPercent that checkedfactor as a constraint
Shortage of personnel 35
Shortage of trained personnel, that is, those with engineering or skilled craft backgrounds
28
Shortage of resources (i.e., insufficient time and/or budget to carry out assessments)
71
Other 7
Does not apply. No factors creating a significant constraint on the quality of reviews of facility conditions
21
10Responses to question 13, GAO survey.

Appendix III
Navy Strategy, Methods, and Criteria for
Determining Real Property Maintenance
Requirements
Page 84 GAO/NSIAD-99-100 Real Property Management
by the installation's engineering officer (public works officer), base civil engineer, or staff civil engineer, who directed the application of resources. Officials at all the installations we visited told us their RPM funding has been insufficient to keep the RPM backlog from increasing over the last few years. For example, officials at the Norfolk Naval Shipyard told us they implemented an aggressive demolition program to reduce future RPM needs, but even with that they could not keep up with RPM needs.
Three of the seven sites we visited were funded through Navy Working Capital Fund (1) Norfolk Naval Shipyard, (2) Public Works Center San Diego, and (3) Naval Air Station Patuxent River. These three were funded through revenue they generated by providing services to customers. The Public Works Center prepared annual budgets based on rates and quantities of products and services they expected to sell to their customers, including facility control inspections. The Center funding for its RPM was included in its utilities and overhead rates.
The Norfolk Naval shipyard, like the Public Works Centers, funds most of its RPM through its overhead rates. The shipyard also received some O&M funding for RPM on some other facilities, including bachelor housing (barracks). It expected to receive military construction funding for some other maintenance projects.
Naval Air Station Patuxent River was funded by four sources: Navy Working Capital Fund; Research, Development, Test and Evaluation, Navy; O&M; and Military Construction, Navy. The capital fund was the largest source of RPM funds, collected through its overhead rates, according to public works personnel. Research, Development, Test and Evaluation was provided to fund all the related base operations support functions, including RPM. Its O&M funded RPM for other base operations support, including aviation operations, bachelor housing, training, administration, and community services.
The other four bases performed the largest portion of their RPM with O&M funds. At two, Dam Neck and Northwest, officials told us their funding allocations were stable, that is, they almost always got the funding they expected to receive before the fiscal year began, and they were able to execute RPM efficiently and economically. Officials at those installations also said that their RPM backlog was increasing but they believed they were better off than fleet-funded installations because their funding was more stable. Operational commitments at fleet-funded bases, they said, compete for the same O&M funds as RPM.

Appendix III
Navy Strategy, Methods, and Criteria for
Determining Real Property Maintenance
Requirements
Page 85 GAO/NSIAD-99-100 Real Property Management
We asked bases to choose from a list of weaknesses that characterize their RPM system (or to write in their views). The responses are shown in table III.5.
Table III.5: Top Weaknesses in RPM System
Source: Responses to question 12, GAO survey.
Needs Exceed Allocations With regard to the allocation of RPM funds, Navy installations reported receiving RPM funding equal to 14.2 percent of their identified RPM needs in fiscal year 1997.11 The Navy Facilities and Engineering Division emphasized that “the amount requested and received by the base commander is only a part of the total equation,” noting that “the major claimants hold a portion of the RPM budget for special” projects.12 Similarly, major claimants have a portion of their RPM budgets withheld by higher levels for the centralized demolition program.
We asked Navy installations to indicate whether or not they agreed with four potential alternative changes to their RPM funding system. The responses are shown in table III.6.
WeaknessPercent that checked
weakness
Little or unclear linkage between RPM needs assessment and allocation of resources
41
Rollup oversimplifies conditions 38
Condition assessments/requirements determination are too subjective
25
Ratings do not tell what is wrong within facility or mission category
27
Little or unclear linkage between condition assessment and budget estimation
30
11Responses to question 15, GAO survey.
12Navy email communication to GAO, September 1997.

Appendix III
Navy Strategy, Methods, and Criteria for
Determining Real Property Maintenance
Requirements
Page 86 GAO/NSIAD-99-100 Real Property Management
Table III.6: Bases’ Choices to Proposed Changes in Allocation Process
Source: Responses to question 22, GAO survey. Responses exceed 100 percent because more than option could be chosen.
Bases Visited We pretested and post-tested the survey at selected locations as part of our work to ensure the reliability of the survey. We pretested the survey at six Navy sites:
U. S. Atlantic Fleet, Norfolk, Virginia;Naval Air Station Pensacola (Chief, Naval Education and Training), Pensacola, Florida;Naval Air Station Oceana (U.S. Atlantic Fleet), Virginia Beach, Virginia;Naval Air Station North Island (U.S. Pacific Fleet), San Diego, California;Public Works Center San Diego (Naval Facilities and Engineering Command), San Diego, California; andNorfolk Naval Shipyard (Naval Sea Systems Command), Portsmouth, Virginia.
We performed survey post-tests to validate survey responses at four locations:
Naval Air Systems Command, Naval Air Station Patuxent River, Lexington Park, Maryland; Fleet Combat Training Center, Atlantic, Dam Neck, Virginia Beach Virginia;Naval Security Group Activity Northwest (Naval Security Group Command), Chesapeake, Virginia; and Naval Air Station Patuxent River (Naval Air Systems Command), Lexington Park, Maryland.
During our pre- and post-tests, we visited facilities causing, or contributing to, a C3 or C4 mission area in the BASEREP, at seven sites:
Suggested change Percent citing change
RPM funding should be based on physical deficiencies, with “needier” bases receiving more funds
48
Funding should not be based on a fixed increase above or below the previous year’s level
61
Funding should be based on the average age, total square footage, and number of facilities
32
RPM funding/allocation should not be centrally managed by major command
30

Appendix III
Navy Strategy, Methods, and Criteria for
Determining Real Property Maintenance
Requirements
Page 87 GAO/NSIAD-99-100 Real Property Management
Naval Air Station Oceana, Virginia Beach, Virginia;Naval Air Station North Island, San Diego, California;Public Works Center San Diego, San Diego, California; Norfolk Naval Shipyard, Portsmouth, Virginia;Fleet Combat Training Center, Atlantic, Dam Neck, Virginia Beach, Virginia; Naval Security Group Activity Northwest, Chesapeake, Virginia; andNaval Air Station Patuxent River, Patuxent River, Maryland.
During these visits we also reviewed related property records, documented backlog information and the recorded deficiencies, and visited the facilities to observe the condition and deficiencies. We interviewed installation engineering staff as they showed us the deficiencies and documented additional information when necessary. We observed and confirmed the deficiencies recorded at 17 of the 18 facilities we visited through direct observation.
We also visited three other sites where we interviewed relevant officials, observed facility conditions, and were briefed on RPM processes and issues. The three were Naval Station Norfolk, Norfolk, Virginia; Naval Amphibious Base Little Creek, Norfolk, Virginia; and Public Works Center Norfolk, Norfolk, Virginia.

Page 88 GAO/NSIAD-99-100 Real Property Management
Appendix IV
Marine Corps’ Strategy, Methods, and Criteria for Determining Real Property Maintenance Requirements Appendix IV
In this appendix, we discuss the Marine Corps’ strategy, methods, and criteria for determining RPM requirements and allocating resources to those needs. We examine the Marine Commanding Officer’s Readiness Reporting System (CORRS), a key component of the Marines’ system for evaluating base infrastructure conditions, including the responses to our questionnaire on RPM-related issues that we sent to Marine Corps bases and the Corps’ single major claimant.1
Background As of 1998, Marine Corps installations worldwide managed about 11,000 buildings totaling about 104 million square feet, with an estimated plant replacement value (PRV)2 of $28 billion (or about 5.6 percent of the services’ total PRV). Although the Corps has its own bases and (one) major claimant, it is a part of the Navy and is therefore closely linked to the Navy in almost every regard, including the fact that the Naval Facilities Engineering Command (NAVFAC) maintains the real property inventory for the Corps. The Corps headquarters Facilities Branch has overall responsibility for Marine Corps RPM programs. According to the Navy Budget Office (which maintains the Marines’ fiscal data), the Marine Corps fiscal year 1999 RPM appropriation was $351.2 million, of which$6.9 million was for the Marine Reserve and $344.3 million was for its active forces.
RPM Funding Strategy The Marine Corps’ funding strategy through fiscal year 2005 is to underfund RPM compared to what it estimates is required to keep the amount of backlog repairs at current levels. According to the Corps, estimated unfunded repair backlogs rise 60 percent during 1998-2005, from$711 million to $1.1 billion. According to the Corps headquarters Facilities Branch, about 80 percent of this amount is critical-rated repair; the remainder is deferrable repair.
1We sent the survey, which asked about base facility’s inventory, RPM processes, and funding, to 16 Marine Corps bases; all returned the questionnaire. See appendix X for a copy of the survey. A claimant is the equivalent to a major command in the Army or Air Force.
2PRV is defined by the Office of the Secretary of Defense (OSD) as “the cost to replace the current physical plant (facilities and supporting infrastructures) using today’s construction cost (labor and materials) and standards (methodologies and codes).”

Appendix IV
Marine Corps’ Strategy, Methods, and
Criteria for Determining Real Property
Maintenance Requirements
Page 89 GAO/NSIAD-99-100 Real Property Management
The Marine Corps compares its RPM spending level to the private sector to demonstrate that it requires more funds for RPM.3 The Corps noted that in fiscal year 1998, it planned to spend the equivalent of 1.2 percent of PRV on RPM, comparing it to the 1.75 percent level recommended in a 1989 DOD report,4 and a private industry level of 3.5 percent cited in the same report.5 It subsequently allocated about 1.4 percent of PRV to RPM, and plans to gradually increase this to about 1.8 percent by fiscal year 2005. However, this is not a sufficient funding level to constrain the growth of backlog. The Corps states that “all bases are underfunded” with regard to RPM and that with “insufficient funds, backlog grows.”
RPM Assessment System
The Marine Corps uses two systems to assess its RPM needs—a version of the Navy's Annual Inspection Summary (AIS) (see app. III), and CORRS. CORRS is modeled on the Navy's Shore Base Readiness Report (BASEREP). It rates the ability of an installation, on a scale of one to four, to carry out its mission. According to the Corps headquarters Facilities Branch staff, the Marine version of AIS is less detailed than the Navy’s but is otherwise similar. It uses inspections to generate an estimate cost for repairs. Critical-rated repairs that are not funded become the reported backlog. Unlike AIS, the data are not inserted into a servicewide database. Rather, each base reports its estimated backlog to Corps headquarters at a given point during the year.
CORRS: A New System The Marine Corps’ CORRS facilities assessment system was tested at various installations in 1996, and bases initially submitted data to the system in April 1997. According to the Corps, CORRS was created to
• link facility conditions directly to mission requirements;• rate Corps facilities at all installations against a uniform set of
requirements;• make Marine Corps-wide investment decisions factoring in facilities’
effect on readiness; and
3June 1997 briefing to GAO.
4DOD, Renewing the Built Environment, 1989, p. 31
5DOD, Renewing the Built Environment, 1989, p. 16.

Appendix IV
Marine Corps’ Strategy, Methods, and
Criteria for Determining Real Property
Maintenance Requirements
Page 90 GAO/NSIAD-99-100 Real Property Management
• enable the Marines to compete with the Navy, the Army, and the Air Force for very limited resources.6
According to a memorandum issued by the Commandant of the Marine Corps, the advantages of CORRS are that it provides (1) comparability of requirements with other services and a detailed defense for budget submissions and (2) helps base commanders “identify problem areas and facility deficiencies that impact mission areas.” The memorandum also states that CORRS will provide headquarters facilities planning staff with the data needed to provide “an opportunity to make informed resource allocation decisions and identify deficiencies to higher headquarters.” Further, it states that “the Planning, Programming, and Budget System (PPBS) fails if the consequences of inadequate funding cannot be clearly, logically and uniformly presented by an installation. With the implementation of CORRS, all Marine Corps installations will have identical classification formats.”
In CORRS, facilities are rated on their condition and quantity, and commanders assess the ability of their plant facilities to achieve mission requirements. According to CORRS instructions, quantity ratings use a scale of one (best) to four (worst), and “should reflect the size and number of facilities required by the mission . . . compared to what actually exists.” CORRS has a four-point scale to rate the impact of facility condition on readiness, with results placed in a mission area assessment matrix, which appears similar to the matrix used by the Air Force for its deficiency rating system, the facility investment metric (FIM). The four levels are defined as follows:
• Level 1: Full mission capability; no major facility deficiencies.• Level 2: Full mission capability; any existing facility deficiencies are
minor and within the activities’ capability to correct with available resources.
• Level 3: Reduced mission capability with major facility deficiencies; the activity does not possess the resources to correct those failures.
• Level 4: Not mission capable; there are major facility deficiencies that require external resource support to eliminate.
6The purpose of CORRS was virtually identical to the Army’s rationale for its Installation Status Report, and the Air Force’s rationale for its facility investment metric system, both implemented recently (1995 and 1998, respectively).

Appendix IV
Marine Corps’ Strategy, Methods, and
Criteria for Determining Real Property
Maintenance Requirements
Page 91 GAO/NSIAD-99-100 Real Property Management
CORRS rating worksheets show ratings on a 1 to 4 scale for individual facilities within a 24 mission areas (versus 28 in the Navy's BASEREP). Individual facility ratings are then combined, following a formula, to produce an overall condition rating of 1 to 4 for mission areas at installations, and quantity ratings. Although the mission-capable levels are stated in broad terms, the facility condition worksheets for each of the26 mission areas quantify with considerable precision how the rater is to decide which of the four levels is correct in many cases and with somewhat less precision in those that involve a less readily quantifiable situation. For example, for aircraft operations, CORRS shows how to calculate the rating level for each of seven specific operational dimensions. The instructions for the first and seventh dimensions are shown in table IV.I.
Table IV.1: Dimensions and Ratings in CORRS
Source: CORRS Facility Condition Readiness Worksheet.
According to the CORRS instructions, the overall rating for the mission is calculated as “enter worst rating [of the seven dimensions in the mission] if that rating occurs more than once.” “Otherwise, enter worst rating minus one.” Similar methods of calculation apply to the other mission areas.
As shown, written rather than percentage estimates are used for some dimensions of mission areas; in some cases, the entire mission area uses written rather than percentage definitions. For example, ratings of the three indicators for morale, welfare, and recreation are all written definitions: seldom; occasional; frequent; and continuous problem. It is evident, therefore, that some rating levels can be calculated with greater
Indicator (measure) Rating CORRS level
Percentage of days when required air operations are restricted or curtailed due to condition of runways, taxiways, arresting gear, or aprons
Less than 5% 1
5–10% 2
10-20% 3
Greater than 20% 4
Risk that mission will be curtailed over next year due to document structural, safety, or environmental hazards
Almost none 1
Some risk 2
Serious risk 3
Almost certain 4

Appendix IV
Marine Corps’ Strategy, Methods, and
Criteria for Determining Real Property
Maintenance Requirements
Page 92 GAO/NSIAD-99-100 Real Property Management
accuracy—assuming the operational records are available—than others, which require a judgment about the dividing lines for the levels among the definitions of risk or unacceptability of conditions. In addition, some of the indicators themselves require interpretation, such as “morale and welfare levels unacceptably low due to BOQ/BEQ [bachelor officers’ quarters/ bachelor enlisted quarters] conditions.” In this latter case, the term unacceptably is open to subjective judgment.
Base Views on CORRS On the surveys returned to us, officials at one Marine installation commented that, CORRS “is not flexible enough to reflect base-specific requirements.” Further, the “drop- down menu restricts detailed reporting.” Another base made these comments with regard to both detail and current utility:
to date [early 1998] CORRS has not been used in the process of determining our maintenance real property requirements due to the general nature of the information was inputted. Currently, CORRS does not identify specific deficiencies and necessary repairs. CORRS has been a useful tool for validating planned repair and construction projects.
At a Marine base we visited, the facilities staff expressed some reservations about the vagueness of the CORRS worksheets, noting that they were not rating physical condition but the impact of conditions on mission readiness. They noted that under this rating system, a building could actually be in fine physical condition but rated as low or unacceptable under CORRS because it was housing an activity for which it was not well designed. For example, a warehouse would be inappropriate as a library or as a day care center but could be fine as a warehouse. They said that CORRS did not make clear whether they were to rate the facility in terms of the facility's original mission—for which it was designed—or in terms of the mission of the people now in it.
Facilities officials further stated that they found CORRS ambiguous in some regards. If they had 100 administrative buildings at the installation, they had the time to interview only a sample of the occupants to determine how well the buildings were meeting their needs. They said that they had to figure out who the "top" administrative people were and that it was unclear how to rate an entire mission area if only 2 of 77 buildings did not meet the mission. They said it was hard to justify a rating of 3 or 4 (indicating poor conditions) when 75 of 77 buildings were acceptable. (Because CORRS is a new system, the headquarters Facilities Branch stated that changes are being made to it as they get feedback from the field on what works and what does not.)

Appendix IV
Marine Corps’ Strategy, Methods, and
Criteria for Determining Real Property
Maintenance Requirements
Page 93 GAO/NSIAD-99-100 Real Property Management
Another installation expressed concern about whether base commanders would report accurately on the impact of facilities on readiness, stating that “No CO [commanding officer] will confess to being ‘not mission capable’.”
Survey A total of 16 Marine installations received questionnaires and all returned them. Despite the high response rate, the relatively small total number of respondents introduces a cautionary note about generalizing from the results. When asked how methods could be improved, there appeared to be no strong consensus among Marine respondents. Eight of the 16 favored rating facilities primarily according to engineering-based criteria, but the other 8 did not. Ten Marine installations favored more emphasis on long-term planning, but 6 did not. Table IV.2 shows the Marine responses.
Table IV.2: How Installations Would Change Methods to Determine Requirements
Source: Responses to question 13, GAO survey.
RPM Needs Exceed Requests Fivefold
Marine bases reported a large gap between the RPM dollars they asked for from their major claimant and their unconstrained requirements. The respondents reported that in fiscal year 1997, they received $174 million for RPM from headquarters (the sole major claimant), but that their unconstrained RPM requirement was $622 million. Thus, they received about 28 percent of their identified needs; this was about double the ratios received by Army bases or Navy installations, and about 1.5 times more than was received, as a ratio, by Air Force bases.
Bases Visited We reviewed relevant policies and other service guidance and records, and interviewed responsible RPM-related staff at the Marine Corps
Proposed change in method Percent approvingproposed change
Rate building/facilities primarily according to engineering, life-safety, and health criteria, while decreasing the role of aesthetics
50
Place much more emphasis on long-range maintenance planning, while deemphasizing annual assessments of facilities
63
Other 13
Letter

Appendix IV
Marine Corps’ Strategy, Methods, and
Criteria for Determining Real Property
Maintenance Requirements
Page 94 GAO/NSIAD-99-100 Real Property Management
headquarters, and the Marine Corps base Quantico, Virginia, where we also compared the data reported to us in the questionnaire with base records.

Page 95 GAO/NSIAD-99-100 Real Property Management
Appendix V
Summary Comparison of Service Methods and Criteria Appendix V
Each service uses different methods and criteria by which to rate the condition of its facilities, prioritize repairs, and allocate funds to those repairs. The core systems for assessing and rating the condition of facilities and/or the urgency of repairs are: the Army’s Installation Status Report (ISR), the Air Force’s Facility Investment Metric (FIM), the Navy’s Annual Inspection Summary (AIS) and Shore Base Readiness Report (BASEREP), and the Marine Corps’ Commanding Officer’s Readiness Reporting System (CORRS). These generally combine assessments of the physical condition of facilities and those conditions’ impact on mission. However, the Air Force’s system rates repair deficiencies only in terms of estimated impact on mission rather than rating the condition of each facility. Table V.1 compares some of these systems’ basic characteristics.
Table V.1: Basic Characteristics of Services’ Condition Assessment Systems
Source: Service reports, manuals, and briefings.
As table V.1 shows, with the exception of the Navy, assessment systems currently used by the services have been recently implemented. In general, these rating scales rank the severity of the condition of a facility or the urgency of a repair project. However, because they use different criteria to arrive at the ratings, and because the scaling systems vary, the ratings they generate are not comparable from service to service.
Service
Characteristic of rating system Army Air Force Navy Marines
Name(s) & date implemented
ISR, 1995 FIM, 1998 AIS; BASEREP,1982
CORRS, 1997
What is rated by the assessment system
Facilities and mission areas
Deficiency impact in four mission areas(based in part on work orders generated by facility users)
Repair projects and mission areas(based on facility inspections)
Facilities, equipment, and personnel in terms of capability to meet designated mission
Who inspectsfacilities
Building users and engineers/skilled craftsmen
Users and engineers/skilled craftsmen
Users and engineers/skilled craftsmen
Users and engineers/skilled craftsmen
Number of levels in rating system
Three-point scale for facility condition; four points for mission areas
Three-point scale for urgency of repairs/ impact on mission
Four-point scale for mission areas; Two-point scale for repair backlog urgency
Four-point scale for each rated category

Page 96 GAO/NSIAD-99-100 Real Property Management
Appendix VI
Criteria for Allocation of Funds Appendix VI
In response to our survey on real property maintenance (RPM) issues that we sent to 530 service bases worldwide, bases ranked nine criteria to determine how RPM funds were allocated. (The text of the survey can be found in app. X.) The rankings of one through nine were collapsed into three broad levels representing the respondents’ assessment of the importance of each factor in allocating RPM funds—most important, moderately important, and least important. Table VI.1 shows the percent of respondents, by service, that assigned these three levels to each of nine criteria.
Table VI.1: Ranking of Factors Affecting Allocation of Funds, by Service
Percent of bases ranking factors’ importance in allocation of funds
Factor ServicePercent ranking factor
as most importantPercent ranking factor as
moderately importantPercent ranking factor
as least important
Mission priority and/or readiness
Air Force 86 14 0
Army 59 40 1
Navy 89 11 0
Marines 93 7 0
Facility appearance Air Force 4 62 34
Army 4 60 36
Navy 2 53 45
Marines 0 87 13
Low repair cost Air Force 1 48 50
Army 5 63 32
Navy 4 61 35
Marines 0 64 36
Physical condition of facility Air Force 36 63 2
Army 35 59 6
Navy 36 63 1
Marines 40 60 0
Type of facility Air Force 9 84 7
Army 10 82 8
Navy 12 81 7
Marines 7 87 7
(continued)

Appendix VI
Criteria for Allocation of Funds
Page 97 GAO/NSIAD-99-100 Real Property Management
Source: Responses to question 19, GAO survey. Totals may not add exactly to 100 due to rounding.
These data suggest that importance of mission was the most important factor in allocating RPM funds for the Air Force, Marine Corps, and Navy respondents, with 86 to 93 percent ranking this as “most important.” No other factor came close to receiving this high a percentage of ranking as the most important in affecting funding allocation. However, only 59 percent of Army bases, or about one-third less than the other services, assigned a comparably high ranking to mission impact.
Compared to the 59 to 93 percent assigned to mission impact across the services as a most important factor, there was a narrower spread for the importance assigned to the Department of Defense (DOD) guidance, with 31 to 46 percent of bases ranking this factor as one of moderate-level importance and 0 to 11 percent ranking it as the most important. There was slightly more variation in the importance of service guidance, with44 to 61 percent of bases ranking it as of moderate importance, and 0 to10 percent ranking it as most important. There was considerable similarity across the services in terms of the ranking assigned to physical condition as an allocation factor, with 35 to 40 percent of the bases rating it as the most important, and 59 to 63 percent in each ranking it as moderate. There
Percent of bases ranking factors’ importance in allocation of funds
Factor ServicePercent ranking factor
as most importantPercent ranking factor as
moderately importantPercent ranking factor
as least important
Type of deficiency Air Force 22 75 3
Army 31 65 4
Navy 29 70 1
Marines 20 73 7
Base commander’s priorities Air Force 34 63 3
Army 35 60 5
Navy 19 74 6
Marines 40 53 7
Service guidance Air Force 4 61 35
Army 10 44 45
Navy 6 47 47
Marines 0 46 54
DOD guidance Air Force 7 38 55
Army 11 34 55
Navy 7 46 47
Marines 0 31 69

Appendix VI
Criteria for Allocation of Funds
Page 98 GAO/NSIAD-99-100 Real Property Management
was less consensus on the importance of a commander’s priorities, with twice as many Marine bases citing it as of highest impact compared to Navy bases (40 vs. 19 percent), and 34 to 35 percent of Army and Air Force bases ranking it as most important.
Within each service, consistency on the rankings of these criteria varied by the bases. For example, 35 percent of Army bases cited physical conditions as most important, but 59 percent rated these as moderately important. Similarly, almost twice as many Air Force bases assigned physical condition as a moderate rank as those citing it as the most important(63 vs. 36 percent). In the Navy, 19 percent of the bases ranked a commander’s priority as the most important allocation criteria, while74 percent said it was moderate. In the Air Force, almost twice as many bases ranked commander priority as moderately important as those that assigned it the highest level rating (63 percent vs. 34 percent).
On DOD guidance as a criterion, 11 percent of Army bases rated it as most important while 55 percent rated it as least important. Similarly, among Air Force bases, there was little agreement—7 percent ranked it as most important, 38 percent as moderately important, and 55 percent at least important in allocating funds. In the Navy, 46 percent ranked it as of moderate importance, and 7 percent ranked it as most important. Differences in the Marine Corps were somewhat less obvious on the rankings of almost every criterion.

Page 99 GAO/NSIAD-99-100 Real Property Management
Appendix VII
Percent of Value Measures for Estimating RPM Requirements Appendix VII
The percent of plant replacement value (PRV) or similar measures of facility value spent on real property maintenance (RPM) are commonly cited by the Department of Defense (DOD) and the services with regard to the adequacy of RPM funding levels in the services. There is no fixed standard for defining PRV, although most definitions are similar. The Office of the Secretary of Defense (OSD) defines PRV as “the cost to replace the current physical plant (facilities and supporting infrastructure) using today’s construction cost (labor and materials) and standards (methodologies and codes),” and developed a standard formula to calculate it.1
Perhaps the most widely cited percentage spending guideline for RPM2 was recommended by the Building Research Board of the National Research Council in its 1990 report, Committing to the Cost of Ownership—Maintenance and Repair of Public Buildings.
An appropriate budget allocation for routine maintenance and repair for a substantial inventory of facilities will typically be in the range of two to four percent of the aggregate current replacement value of those facilities (excluding land and major associated infrastructure). . . . Where neglect of maintenance has caused a backlog of needed repairs to accumulate, spending must exceed this minimum level until the backlog has been eliminated.3
1The OSD formula is: Scope (size of a facility)
x Unit cost factor (cost per unit to construct)x Area cost factor (locality adjustment)x Inflation factor (adjustment to the year in question)x 1.2 (overhead factor) (standard inspection and overhead, design, contingency, supporting facilities)
= plant replacement value.Source: OSD (Installations) Directorate of Analysis and Investment: “Plant Replacement Value,” July, 1997.
2Harvey H. Kaiser A Foundation to Uphold (Alexandria, Va.: APPA,) 1996, p. 46. See also, Level of Investment Study Facilities and Infrastructure Maintenance and Repair, Civil Engineering Research Foundation, August 1996, pp. 6, 3-7, which notes that the Board’s guideline of 2 to 4 percent of current plant replacement value is "a widely-used benchmark . . . often cited in the literature pertaining to building maintenance for public agencies, colleges, and universities." (pp. 3-6).
3Committing to the Cost of Ownership: Maintenance and Repair of Public Buildings, Committee on Advanced Maintenance Concepts for Buildings, Building Research Board, Commission on Engineering and Technical Systems, National Research Council, (Washington, D.C.: National Academy Press, 1990) p. xii.

Appendix VII
Percent of Value Measures for Estimating
RPM Requirements
Page 100 GAO/NSIAD-99-100 Real Property Management
Current replacement value is defined by the Building Research Board as “the amount in current dollars it would cost to duplicate the facilities.”4 This value was described to us by a Federal Facilities Council official as having the same meaning as PRV.5 The Council reported in 1996 that federal agencies were using two different methods to calculate current replacement value.6
The Air Force uses a percentage guideline as a benchmark against which to determine the adequacy of its preventive maintenance spending, funding it at 1 percent of PRV. This was based on a 1989 DOD infrastructure report that compared military RPM spending as a percent of PRV to other governmental entities, major private corporations, and major universities.7 The Air National Guard budgets RPM with a baseline of 1 percent of PRV; that is, all installations receive no less than 1 percent of PRV for annual RPM. The Navy has used a 2-percent current plant value benchmark8 based in part on an April 1995 Center for Naval Analyses study that concluded that funding at 2 percent of current plant value was required to arrest the growth of backlog in Navy facilities, thereby sustaining them at current conditions.9 The Navy tracks both the current plant value as well as the plant replacement value of its inventory.10
DOD’s 1997 Quadrennial Defense Review explicitly cited the percentage of PRV spent by the services (1.16 percent) on RPM compared to that spent by
4Federal Facilities Council, Budgeting for Facilities Maintenance and Repair Activities (Washington, D.C.: National Academy Press, 1996), Report Number 131, p. 10.
5Similarly, the Civil Engineering Research Foundation stated that current replacement value is “equivalent to the term PRV” and used the terms interchangeably in its Level of Investment Study: Facilities and Infrastructure Maintenance and Repair (Washington, D.C.: CERF, Aug. 1996), pp. 3-6.
6Budgeting for Facilities Maintenance and Repair Activities (Washington, D.C.: National Academy Press, 1996), Report Number 131, pp. 10-11.
7DOD, Renewing the Built Environment, March 1989, pp. 11, 15, 31.
8Current plant value is defined by the Navy as the cost of the facility’s “original acquisition, plus major improvements, inflated to current dollars” (June 1998 briefing, p. 6). Similarly, current plant value is defined by the Center for Naval Analyses as "the facility's original construction cost plus the cost of its capital improvements (e.g., a roof replacement)." Glenn H. Ackerman, Jino Choi, and Ty D. Weis, The Backlog of Maintenance and Repair: Preventing Its Growth and Measuring Its Impact (Alexandria, Va.: Center for Naval Analyses,) Apr. 1995, p. 9.
9The Backlog of Maintenance and Repair: Preventing Its Growth and Measuring Its Impact (Alexandria, Va.: Center for Naval Analyses,) Apr. 1995, p. 1.
10Base Operating Support Shore Maintenance and Repair Trends, Navy, fiscal year 1996, p. 16 of 36, Inventory.

Appendix VII
Percent of Value Measures for Estimating
RPM Requirements
Page 101 GAO/NSIAD-99-100 Real Property Management
the private sector as evidence that service RPM spending was inadequate,11 noting that this level exceeds the nonmilitary sector in just one category—county jails. Similarly, in a 1989 infrastructure report, DOD recommended that the services spend 1.75 percent of their PRV on maintenance and repair; this did not include additional spending that would have been required to eliminate repair backlogs.12
RPM experts, the National Aeronautics and Space Administration (NASA), and OSD have identified multiple problems with the concept of basing the level of RPM funding on a percentage of estimated PRV or other comparable percentage estimates of the value of facilities. (As noted, PRV is also referred to as current replacement value or current plant value, both of which calculate the value of a facility differently but are comparable measures.)
Percentage Measures Are Not Based on Condition
The decision to base RPM funding on a percentage of replacement value (whether PRV or current plant value or an equivalent) has certain drawbacks. For example, the NASA facilities maintenance guidebook explicitly cites the Building Research Board guideline, while cautioning that actual condition assessments may lead to a different funding level.
NASA headquarters recognizes the annual funding level of 2 to 4 percent of current replacement value recommended by the Federal Facilities Council (formerly the Building Research Board), National Research Council, as a reasonable funding target necessary to maintain facilities in a steady-state condition at an adequate maintenance standard until an independent analysis of facilities condition assessment trends indicates otherwise.13
NASA’s caveat is noteworthy, for it is clearly the case that budgeting for maintenance on the basis of a percentage of PRV is not based on the actual condition of the facilities in question; rather, it assumes that (1) some minimum amount—in this case, 2 to 4 percent of PRV—is required to maintain a large inventory of facilities annually and (2) the backlog is already so low that additional spending is not required to eliminate it (a caution noted by the Building Research Board in the original formulation).
11DOD, Quadrennial Defense Review, Infrastructure Panel, “Installation Support Task Force Final Report,” February 24, 1997, Attachment 1, Issue Paper, p. 1-1.
12DOD, Renewing the Built Environment, March 1989, p. 31.
13NASA: Facilities Maintenance and Energy Management Handbook, section 1.2.4, issued Oct. 1, 1994.

Appendix VII
Percent of Value Measures for Estimating
RPM Requirements
Page 102 GAO/NSIAD-99-100 Real Property Management
A 1996 analysis of the Board’s 2- to 4- percent guideline by the Civil Engineering Research Foundation noted that the Board’s report recognized that a percentage guideline cannot take into account factors relevant for determining the RPM funding level for a facility. These were
• size and complexity,• current age,• condition,• use,• historical or community value,• geographic location,• climate,• mechanical and electrical technologies needed,• telecommunications and security systems technologies needed, and• criticality of building role or function.14
The problematic nature of using a percentage of PRV (or other similar methods of estimating facility value) was also noted by Federal Facilities Council officials in an interview with us. They stated that the Building Research Board’s 1990 recommendation was based on a guess at best. They said that the Board had decided that 1 percent was too little and5 percent was more than any (public) entity would be allocated, so it set the level at 2 to 4 percent. However, in the case of facilities with estimated PRV in the hundreds of millions of dollars, 2 to 4 percent is a large range for annual maintenance spending. Council officials said that as a result they were reconsidering the Board’s recommendation in an effort to be more precise.
OSD also identified a major drawback to determining maintenance funding on the basis of a percentage of PRV in a July 1997 analysis, noting that “as an allocation tool, PRV has so far demonstrated only marginal utility.” “Having an accurate PRV sheds little light on the question of an appropriate budget level for facilities, nor does it provide much assurance about where specifically to spend facility dollars.”15 Further, even if percent of facility value was an accurate measure of RPM needs—which it inherently is not—there is also the difficulty of ensuring that the value of like facilities, both within and across services, is calculated identically.
14Level of Investment Study: Facilities and Infrastructure Maintenance and Repair (Washington, D.C: Civil Engineering Research Foundation, Aug. 1996), pp. 3-7.
15“Plant Replacement Value,” OSD (Installations) Directorate of Analysis and Investment, July 18, 1997.

Appendix VII
Percent of Value Measures for Estimating
RPM Requirements
Page 103 GAO/NSIAD-99-100 Real Property Management
Although OSD told us that each service had been told to use the exact same formula to calculate PRV,16 it is also the case that “in the weeds, they [the services] don’t have standardized facility codes [to identify similar facilities], and, as a result, they can have different replacement costs for similar facilities.” This means that uniformity in such estimates is not ensured for similar types or classes of facilities (e.g., barracks) across the services, although the scope of variation is not known.
OSD officials said that the PRV estimating process is analogous to creating a recipe for a cake, in which minor variations could occur from chef to chef. However, an Army misunderstanding of OSD’s PRV formula led to a 20-percent underestimate of the Army’s overall PRV in fiscal year 1996; this was corrected (upwards) in fiscal year 1997. Further, although OSD’s formula states that the overhead factor component of PRV should be a multiplier of 1.2, the Air Force instructions to a contractor on developing PRV calculations, provided to us in October 1997, state that “overhead markup was established by the Air Force as 25 percent (1.25 multiplier).” While the difference may not seem large, it is not consistent with the OSD policy that the services are to calculate PRV using the same formula and can result in significant differences in PRV estimates when PRV totals billions of dollars.
We did not attempt to validate the accuracy of the PRV estimates of the services; this was beyond the scope of this report. However, the Air Force’s PRV instruction on calculation reported that only 55 percent of the Air Force’s estimated $204 billion (fiscal year 1996) PRV was acceptable; and that the Air Staff had determined that the remaining 45 percent of the PRV data needed to be reviewed and validated.17 The Air Force is actively addressing the problem.
In addition, the Air Force report notes that some PRV estimates are unreliable because the real property records “do not contain the level of detail required to accurately match an appropriate unit cost to the real property record quantity” (p. 4). As an example, the report cites the fact that water lines are only identified as a “generic type,” but not the size or type of water line, which it notes can range in cost from $7 per linear foot to about $60 per linear foot for 24-inch cast iron pipe. The report provides
16“Plant Replacement Value,” OSD (Installations) Directorate of Analysis and Investment, July 18, 1997.
17"Short Term Analysis Report: Air Force PRV Model," Air Force, Oct. 1997, p. 2.

Appendix VII
Percent of Value Measures for Estimating
RPM Requirements
Page 104 GAO/NSIAD-99-100 Real Property Management
no estimate of the potential range of inaccuracy in the PRV estimates for Air Force facilities.
Similarly, the Navy noted that while estimates for many of its facilities are reasonable in some areas, such as utilities and specialized research and development (R&D) facilities, their accuracy is questionable. In addition, for overseas installations in countries where the currency has depreciated, the Navy said that there could be significant reductions in PRV without any real reduction in facilities or the cost of maintaining those facilities.18 For example, the PRV of a Navy base in Japan dropped 25 percent from one year to the next year because of changes in currency exchange rates. As a result, allocating RPM funding on the basis of a percentage of PRV could lead to large and unpredictable swings in allocating RPM at some locations.
Two entities that we identified as having what are termed promising practices in facilities management (see app. VIII)—those that appear to offer improvements over current ones—do not use PRV or similar metrics as an RPM funding guideline. For example, the Lawrence Livermore National Laboratory does not use PRV in this way because no one can agree on estimating it, even with specific guidelines. The Capital Needs Analysis Center does not use it because it is not a measure of need. Further, basing RPM needs on PRV can create incentives to overestimate the value, since the larger the PRV, the greater the potential RPM funding.
Further, as OSD explained regarding PRV, the formula contains many variables unrelated to size, for example, a shift in standard from barracks with common latrines to private rooms would increase PRV because replacement cost is computed at the new standard and higher unit cost. In this case, facility PRV would increase even though its size did not change. OSD also found that in some cases DOD’s real property databases are inadequate to precisely filter the PRV estimates for these kinds of analyses. Similarly, OSD stated that any DOD PRV is actually a blend of the PRV formula and the cost of acquisition plus inflation because one-third of DOD’s physical plant is not covered by standard unit costs upon which a PRV estimate can be made from DOD’s PRV cost model.19
18Navy email communication to GAO, July 10, 1998.
19“Plant Replacement Value,” OSD, (Installations) Directorate of Analysis and Investment, July 1997,p. 2. The facilities not covered are mainly utilities and service-unique facilities.
Letter

Appendix VII
Percent of Value Measures for Estimating
RPM Requirements
Page 105 GAO/NSIAD-99-100 Real Property Management
Because PRV measures structure value and is therefore not a measure of condition, using a percentage of PRV or variations of it (e.g., current plant value) to estimate RPM spending would not determine whether the resulting funding level is under, over, or equal to the spending required to fix actual deficiencies. As a result, using a percent of PRV or similar measures as a benchmark against which to evaluate the adequacy of RPM spending is just one tool in estimating RPM needs.
In sum, in addition to the fact that PRV measures structure value, not condition, there are other grounds for caution in using a percentage of PRV to estimate RPM needs. First, there can be problems with the reliability of the data that go into the PRV estimate. Second, in the military services, the lack of specificity in the property codes does not permit accurate estimates of the cost of certain types of infrastructure. Third, there is no clearly agreed upon standard by which to estimate PRV; the Federal Facilities Council reported on two methods being used by federal agencies. Despite OSD’s directive specifying a PRV calculation formula, variations in calculating PRV could occur among hundreds of bases doing these calculations. Fourth, as the Building Research Board stated, PRV does not take into account multiple factors potentially relevant to RPM needs. Fifth, basing RPM allocations on PRV creates an incentive to overestimate it, as this would generate a calculated figure showing a need for higher funding. In sum, PRV percentages should not be the only method used to determine the funding level required to maintain facilities. As the Navy noted, PRV and other comparable measures are tools, each having unique limitations, and as long as this is understood and are not viewed as a cure-all answer, they can be useful.20
20Navy email communication to GAO, July 10, 1998.

Page 106 GAO/NSIAD-99-100 Real Property Management
Appendix VIII
Promising Practices in Facilities Management Appendix VIII
We identified promising practices in facilities management among nonmilitary entities that might be appropriate for use by the services. In this appendix, we define promising practice; identify the sources of expertise used to find promising practices among nonmilitary organizations and other criteria used to identify potentially useful examples; and discuss two entities with practices that appear to be particularly worthy of consideration by the services for better facilities management.
In a 1991 report, we defined promising practice as a practice that does not signify proven effectiveness but rather the appearance of promise. The goal is not to judge outcomes but to locate and describe specific initiatives that are designed logically to work well and seem worthy of wider trial involving sound evaluation.1
In terms of real property maintenance (RPM), a promising practice would be one that makes it possible to manage property more cost-effectively. In addressing the issue of cost-effective RPM, a February 1997 Department of Defense (DOD) paper on installations noted that ideally, DOD would like to determine the minimum cost of operating each installation without putting mission accomplishment at risk or sacrificing quality of life.2
Sources of Expertise on Promising Practices
We identified entities that might be using promising practices from
• a review of the expert literature on facility management and condition assessment systems;
• interviews of experts in facility management regarding what they considered promising practices as well as their knowledge of entities that have good reputations for such management or that were using or systems with demonstrated effectiveness;
• contacting a variety of entities recommended by the experts and the literature to determine how they manage their property and/or what they know about practices that might be promising;
1Older Americans Act: Promising Practice in Information and Referral Services (GAO/PEMD-91-31 Aug. 1991), p. 2.
2DOD, “What Does the Future Hold for Defense Installations? A White Paper for DOD Commanders,” February 1997, p. 3.

Appendix VIII
Promising Practices in Facilities
Management
Page 107 GAO/NSIAD-99-100 Real Property Management
• knowledge gained from symposia sponsored by the National Research Council’s Federal Facilities Council3 —widely regarded as a source of expertise on facilities management; and
• criteria intended to meet the objective of finding promising practices that might be used by the military services.
Criteria Used to Select Entities for Interviews
The criteria used to aid in selecting entities for interviews about potential promising practices included the following:
• Size. The entities we contacted were generally large, in terms of the number of buildings, square footage, and/or locations of buildings that they control.
• Consistency. We sought to find condition assessment systems used across all the facilities and/or sites of the same entity.
• Duration. We looked for systems that have been in place for 2 or more years so that there was a track record of performance that could be assessed.
• Documentation. We looked for well-documented systems.• Life/Safety. We did not seek data from entities that had serious
life-safety/environmental problems, such as structure collapses over 1997-99.
Experts and Expert Organizations Consulted
Among the experts and expert entities we consulted regarding promising practices and entities using such practices were the following:
• Applied Management Engineering, Virginia Beach, Virginia;• Association of Higher Education Facilities Officers,4 Alexandria,
Virginia;• Civil Engineering Research Foundation, Washington, D.C.;• Richard Coullahan, Senior Vice President, Parsons Brinckerhoff Energy
Services, Herndon, Virginia;• Edward R. Damphousse, Manager, Consulting Services Group, R.S.
Means Company, Inc., Kingston, Massachusetts;
3The Council’s purpose is to promote continuing cooperation between federal and private entities of the building community to advance building science and technology. It is a continuing activity of the Board on Infrastructure and the Constructed Environment of the National Research Council.
4Formerly named the Association of Physical Plant Administrators of Universities and Colleges. The Association changed its name but not its acronym.

Appendix VIII
Promising Practices in Facilities
Management
Page 108 GAO/NSIAD-99-100 Real Property Management
• Marc M. Fagan, President, and Thomas K. Davies, Executive Vice President, Vanderweil Facility Advisors, Boston, Massachusetts;
• Federal Facilities Council of the National Research Council, Washington, D.C.;
• Dr. Harvey H. Kaiser, HHK, Syracuse, New York;• Logistics Management Institute, McLean, Virginia;• Peter Lufkin, Principal, Economics, Whitestone Research, Santa
Barbara, California;• Private Sector Council, Washington, D.C.;• Leif Steinert, Senior Consultant, WorkPlace: A Bentley Strategic
Affiliate, Littleton, Massachusetts; and• Eric Teicholz, President, Graphic Systems, Inc., Cambridge,
Massachusetts.
Entities Contacted for Information on Management Practices
Taking the recommendations of the experts and expert organizations as well as the expert literature, we contacted the following entities to discuss their facility management practices.
Universities
George Washington University, Washington, D.C.Harvard University, Cambridge, MassachusettsMassachusetts Institute of Technology, Cambridge, MassachusettsUniversity of California, Facilities Management and Construction, Oakland, CaliforniaUniversity of California, Berkeley, CaliforniaUniversity of California, San Diego, CaliforniaUniversity of North Carolina, Chapel Hill, North Carolina
Corporations
Hughes Electronics CorporationLockheed Martin CorporationMobil Business Resources CorporationThe Boeing CompanyTrammel Crow Company (Washington, D.C.)

Appendix VIII
Promising Practices in Facilities
Management
Page 109 GAO/NSIAD-99-100 Real Property Management
Governmental Agencies and Entities
Army Health Facility Planning Agency, Falls Church, VirginiaConstruction Engineering Research Laboratories, Champaign, Illinois (Army Corps of Engineers)Department of Energy, Washington, D.C.Facilities Management, Ronald Reagan Building and International Trade Center, Washington, D.C.General Services Administration, Washington, D.C.Lawrence Livermore National Laboratory (LLNL),5 Livermore, CaliforniaNASA, Facilities Engineering Division, Washington, D.C.NASA, Goddard Space Flight Center, Greenbelt, MarylandNational Institutes of Health, Division of Engineering Sciences, Rockville, MarylandCity of San Jose, California, Department of Public Works
Nonprofit Entities
Capital Needs Analysis Center, Brigham Young University, Provo, Utah6
Of these entities, we visited three—Lawrence Livermore National Laboratory (LLNL); the Capital Needs Analysis Center, which manages the property of the Church of Latter-day Saints; and George Washington University.
Fragmented Knowledge Base of Promising Practices
The knowledge base of facility management practices was fragmented, with each expert or entity most familiar with the practices of a limited number of institutions. The entities that experts were most familiar with were generally their customers for developing facility management systems or those that had answered questionnaires in various surveys. There was agreement that the field of facilities management is exploring a wide variety of ways in which to manage property.
5LLNL is a part of the University of California that operates under a 5-year contract to the Department of Energy. Since it is clearly not a university as generally understood, we list it here with government entities.
6The Center manages the property of the Church of Latter-day Saints. It is a part of Brigham Young University but also supervises the University’s property management.

Appendix VIII
Promising Practices in Facilities
Management
Page 110 GAO/NSIAD-99-100 Real Property Management
In our review of the facility management literature we found no fixed standards for the methods, criteria or frequency with which condition assessments should be carried out. Nor, as the Federal Facilities Council noted in an October 1998 study, is there a “single, agreed upon guideline to determine how much money, is, in fact necessary to maintain public buildings.”7 (We also found no standard for nonpublic sector buildings.)
Federal Facilities Council’s Promising Practices
We did find reasonably widespread agreement in the literature and among experts regarding the basic types of information that should be gathered—such as interior square footage of buildings and cost—to effectively manage property. In a 1998 study, the Council proposed four characteristics that are key components for a condition assessment and capital assets management program. Based on our interviews with experts and the cited entities, we found that these four components were a good summary of promising practices for facility management. They are
• a standardized, documented inspection process that provides accurate, consistent, and repeatable results;
• a detailed, ongoing inspection of real property assets that is validated at predetermined intervals;
• standardized cost data based on an industry-accepted cost estimating system to determine repair and replacement costs; and
• a user-friendly information management system or process that prioritizes current and anticipated maintenance and repair requirements to maximize the use of resources and minimize the cost of irreversible loss of service life.8
The Council’s list appears promising for the military because, if fully implemented, such practices would address facility management deficiencies cited by DOD in 1997. These deficiencies include
• unavailable data,• incomplete data,
7National Research Council, Stewardship of Federal Facilities (Washington D.C.: National Academy Press, Oct. 1998), p. 2. The study was supported by a contract between the National Academy of Sciences and the Department of State on behalf of the Federal Facilities Council (p. ii). The National Research Council is shown on the cover as the author, but the Federal Facilities Council is the distributing agency.
8National Research Council, Stewardship of Federal Facilities (Washington D.C.: National Academy Press, Oct. 1998), p. 43.

Appendix VIII
Promising Practices in Facilities
Management
Page 111 GAO/NSIAD-99-100 Real Property Management
• nonstandard data, • inaccessible information,• lack of data integrity, and• lack of performance measures.9
In addition, the literature and experts agree that using the same criteria to assess facility conditions across all the facilities of an entity is required to produce meaningful comparisons from building to building or site to site.
Life-Cycle Principles of Facility Management
The last element of the Council’s list describes life-cycle facility management, which seeks to minimize the cost of irreversible loss of service life by estimating the future point in time at which a building component will likely fail and thereby scheduling maintenance or replacement in advance of that point. It is a methodology aimed at maximizing cost-effectiveness: building “service life can be optimized through adequate and timely maintenance and repairs.”10
DOD’s early 1990s Condition Assessment Survey effort explicitly incorporated life-cycle principles, as described in an OSD report:
The system also automatically determines whether a deficient assembly should be repaired or replaced based on return on investment, and when replacement is recommended, will identify which year the replacement should be accomplished . . . The system automatically extrapolates the estimated repair costs for the facilities not inspected to produce a multi-year maintenance and repair plan, which is an eight-year plan to schedule repairs and replacements.11
With a life-cycle-based database, entities are able to project peaks and valleys of future maintenance spending and to budget at a level that will provide for facility renewal over a multidecade period. Figure VIII.1 shows how life-cycle based costing can project a 50-year budget for a building:
9“What Does the Future Hold for Defense Installations? A White Paper for DOD Commanders,” DOD, February 1997, p. 11.
10National Research Council, Stewardship of Federal Facilities (Washington D.C.: National Academy Press, Oct. 1998), p. 12. See also, Building Research Board, Pay Now or Pay Later: Controlling Cost of Ownership from Design Throughout the Service Life of Public Buildings (Washington, D.C.: National Academy Press, 1991).
11OSD (Installations) Directorate of Analysis and Investment, p. 6, undated but clearly written after April 1995.
Letter

Appendix VIII
Promising Practices in Facilities
Management
Page 112 GAO/NSIAD-99-100 Real Property Management
Figure VIII.1: Life-Cycle Model for a Single Building
Note: Vertical axis shows estimated costs per square foot in dollars; horizontal axis shows years, 1 to 50.
Source: Army Health Facility Planning Agency.
Figure VIII.1 shows estimated maintenance costs per year per square foot for a 50-year period for the Army’s Health Facility Planning Agency. The costs portrayed are based on the life cycles of the components of the facility in question (such as heating-ventilation-air conditioning, roofing, or window frames). A database is constructed using the known costs of how long a component lasts and how much it costs to replace it (both parts and labor).
The Army Health Facility Planning Agency does not yet have a systemwide condition assessment of all facility components, and it does not have budget protection for its RPM funding. For example, its fiscal year 1999 funding for preventive maintenance and repairs was cut almost two-thirds and shifted to other programs. Thus, it cannot meet its life-cycle based funding levels; the forced migration of RPM funds hinders its life-cycle based system.
$0.00
$2.00
$4.00
$6.00
$8.00
$10.00
$12.00
$14.00
$16.00
$18.00
1 3 5 7 9
11 13 15 17 19 21 23 25 27 29 31 33 35 37 39 41 43 45 47 49
Years
Cost/SF

Appendix VIII
Promising Practices in Facilities
Management
Page 113 GAO/NSIAD-99-100 Real Property Management
With regard to assessing facilities, the Army Health Facility Planning Agency is now extending life-cycle component assessments to all locations. It prioritizes repair spending on the basis of a combination of the physical deficiencies that need to be fixed and the mission impact to be addressed. Because its mission is to provide adequate health care facilities to a specific population, it can make decisions about repairs that benefit the greatest number of clients, and its takes into account the health services available in a geographic area from nonmilitary providers.
Preventive Maintenance and Life-Cycle Management
The Capital Needs Analysis Center emphasized the importance of developing a database of component life cycles based on actual inspections; it found that almost all components last significantly longer than manufacturers’ specifications. Through regular inspection and careful monitoring of buildings and their components, the Center can reasonably estimate when repairs should be made or components should be replaced. These life-cycle estimates can then be used to plan repair and maintenance budgets. This, in effect, constitutes the essence of life-cycle maintenance.12 These systems provide “an accurate prediction of total future M&R [maintenance and repair] needs . . . necessary to produce meaningful budgets. Condition prediction allows managers to find out what, where and when facilities, systems and components will need M&R.”13
Regular preventive maintenance is an essential component of life-cycle management. Figure VIII.2 from the National Research Council’s 1998 study illustrates how maintenance extends the service life of a building.
12For a more technical discussion, see Donald G. Iselin and Andrew C. Lemer, eds., The Fourth Dimension in Building: Strategies for Minimizing Obsolescence, Committee on Facility Design to Minimize Premature Obsolescence, National Research Council (Washington, D.C.: National Academy Press), pp. 14-25, and Eric Teicholz "Facility Condition Assessment Technology," (http://www. graphsys.com/articles), February 1999.
13Federal Facilities Council, Budgeting for Facilities Maintenance and Repair Activities, Report No. 131 (Washington D.C.: National Academy Press, 1996), p. 25. Similarly, “The remaining life [of a component] identifies when the next funding will be needed. The life cycle suggests how often that item needs to be replaced over a 40-year life cycle. The costs are set at the current replacement cost. . . .the replacement cycle file . . . allows use of a database to evaluate and project replacement needs." Douglas K. Christensen, “Integrating Capital Studies Within Physical Plant Operations,” Capital Renewal and Deferred Maintenance, Critical Issues in Facilities Management, No. 4 (Alexandria, Va.: 1989), p. 93.

Appendix VIII
Promising Practices in Facilities
Management
Page 114 GAO/NSIAD-99-100 Real Property Management
Figure VIII.2: Effect of Adequate and Timely Maintenance and Repairs on the Service Life of a Building
Source: Stewardship of Federal Facilities, p. 13.
As figure VIII.2 shows, a building that is not adequately maintained will likely experience what amounts to premature deterioration, generating costly repairs that could have been avoided through timely maintenance.
Among the entities that we contacted regarding facility maintenance practices, we identified elements from several that could be of use to the military services.
Useful Examples Two nonmilitary entities in particular have facility assessment and budgeting processes systems that appear to be particularly promising. These are the Capital Needs Analysis Center, located at Brigham Young University, Utah, which manages the facilities of the Church of Latter-day
Service Life Lostto Poor Maintenance
irreversible
DesignService Life
Time(not to scale)
Likely Aging(Without Renewal) With
Normal Maintenance
Likely AgingWithout
Normal Maintenance
MinimumAcceptable
Performance
Optimum Performance
Per
form
ance

Appendix VIII
Promising Practices in Facilities
Management
Page 115 GAO/NSIAD-99-100 Real Property Management
Saints (LDS) worldwide,14 and the University of California’s Lawrence Livermore National Laboratory (LLNL), which uses a system based on one developed by the Department of Energy (DOE). Both had all of the Federal Facilities Council’s listed elements in their systems, and both used them across many of their facilities and locations. In addition, as noted, the Army’s Health Facility Planning Agency bases its facility management system on life-cycle principles. The Center has used life-cycle management since 1981 at its universities and religious centers, and extended the system to 7,000 LDS chapels about 2 years ago.
Online Databases Both the Center and LLNL have their data online and therefore accessible to managers. These centrally controlled, online databases show the inventory of facilities and components, including physical condition. The data can be “sliced and diced” using multiple criteria—such as building type, component type and age, and remaining life-cycle years. This permits almost instantaneous generation of portraits of facility conditions and comparative costs of life facilities.
Reserve Funds The Capital Needs Analysis Center is permitted by its management to allocate projected RPM spending over a 4-year period, based on its life- cycle cost projections, with any leftover funds from the current year applicable to the remaining 3 years. This allows for flexibility and application of life-cycle budgeting, since the system is built on the concept that expenses will be higher in some years than in others. Logically, therefore, expenditures can be anticipated, but since they do not necessarily occur in the forecast year, RPM monies that have been banked can then be used when needed. The 4-year period is adjusted annually, based on condition assessments and revisions of forecast component life cycles and estimated future costs. Although this feature is not available to government entities that operate on a single-year budget, both LLNL and the Army HFPA use life-cycle costing and budgeting for planning purposes.
Common Rating System for Facilities
Although the Center and LLNL have separate systems, both apply the principle of using engineering-based facility condition rating systems to their own facilities. This principle provides for a level playing field for the evaluation of RPM needs and to allocation of monies among their facilities and sites. The Center compares facilities of same or similar type and shifts
14The Center manages approximately $30 billion in property at more than 7,000 locations of chapels and a half dozen universities and religious centers, at diverse locations (Provo, Utah; London, England; Jerusalem, Israel; and Hawaii). Temples were not included when we interviewed Center officials.

Appendix VIII
Promising Practices in Facilities
Management
Page 116 GAO/NSIAD-99-100 Real Property Management
RPM spending to those locations most in need. Center officials told us that the idea was to maintain a common minimum standard; to do so, monies must be moved from relatively physically adequate facilities to those not as adequate.
Center officials said that while there was initial resistance from some entities, the change in the culture of allocation had become widely accepted. We observed a number of facilities at Brigham Young University, including the Missionary Training Center. These facilities appeared to be in sound condition and none were notably better than the others. Some, such as dormitories, were quite spartan in terms of amenities. Most of the observed facilities appeared to be both modest in appearance and functional in nature.
Repair Force and Validation Reviews
Another characteristic that both LLNL and the Center have in common is reliance on craft tradespersons or journeymen to perform daily maintenance and to report on the conditions of buildings in the role of inspectors. Both entities emphasized that using the expertise of their tradespersons had met the goal of getting buy-in for their RPM assessment systems from those that fix the buildings daily as well as utilizing their practical expertise in estimating the remaining life cycle of components. Further, both systems use multiple layers of review and validation of identified repair needs to ensure that conditions are rated consistently across multiple facilities.
Nonfungible RPM Monies At both LLNL and the Center, RPM funds are treated as nonfungible; that is, they may not be used for non-RPM purposes, and appeared to be fairly strictly limited to repairs as opposed to renovations or upgrades. Enhancements could be funded by individual schools at Brigham Young University, but only from departmental funds; in effect, the RPM allocation in a given year for special projects is set by the Center, and any changes must be paid for out of the subentity’s own budget.
Both LLNL and the Center have found that they can reduce subjectivity in maintenance decisions by requiring programs to pay for aesthetic fixes, while confining RPM spending to addressing physical deficiencies. Thus, if a program wants new or higher quality carpeting in its building(s), it must use program, not maintenance funds, unless the existing carpeting is worn out.

Appendix VIII
Promising Practices in Facilities
Management
Page 117 GAO/NSIAD-99-100 Real Property Management
Maintenance Fee at LLNL Beyond the common elements at LLNL and the Center, one factor at LLNL stood out as a potentially useful tool in managing facilities—an annual charge per square foot charge for maintenance, custodial, grounds care, and garbage disposal costs. This charge was instituted in 1991; it began at $1 per square foot and has since increased to about $6 per square foot. We were told that, of the total, about $2.10 is for maintenance alone. The square footage charges are assessed against program budgets; LLNL officials said that the charged cost compares favorably to other entities’ costs determined through a 1995 benchmarking study that compared21 private and public research entities along numerous dimensions of facility management and cost.15 Similarly, LLNL meters utility use by programs and charges that to the programs. According to LLNL facilities management, the charge has had the effect of focusing the attention of users on the maintenance cost of their facilities and has, as intended, constrained the use of space. Through the square foot charge, LLNL can maintain facilities at existing levels; that is, it can prevent further increases in backlogged repairs as a result of unfunded maintenance needs. LLNL stated that while it does not have the money to address all existing deficiencies, some are of low priority or are in buildings used by programs that are being terminated. Therefore, it would not be a good business decision, they said, to fix all the deficiencies in every facility, given higher priority needs, or in buildings that will no longer be used in some cases, once current funding ends for certain programs.
The LLNL practice of charging a fixed maintenance/custodial fee per square foot could be considered by the services. This fee has several potentially useful effects:
• it makes transparent the true costs of maintaining facilities;• it can be set high enough to address RPM needs, precluding growth of
backlogged repairs; and• it creates an incentive to save, as programs are charged for the space
used.
In contrast, the practice of allocating on a basis of a percent of PRV or current replacement value is not based on actual facility conditions and
15“Research Facilities Benchmarking Conference,” sponsored by Eastman Kodak and IBM, October 1995. No place of publication listed. Provided to GAO by LLNL. We did not validate the data reported in the study, which provides only a coded system of identification of participating entities.

Appendix VIII
Promising Practices in Facilities
Management
Page 118 GAO/NSIAD-99-100 Real Property Management
rewards entities that claim a high PRV.16 While some flexibility and ingenuity would be required to administer a fee per square foot at military installations, administering a maintenance fee would have the inherent advantage of assessing costs across the full range of facilities at a base while creating an incentive to use space frugally. Assessment of such a charge, which is a form of overhead, would not be unusual, since the military services’ working capital funds already incorporate such overhead charges as integral to their billing system.
Summary: Identified Promising Practices
From our interviews with the Capital Needs Analysis Center, Lawrence Livermore National Laboratory, the Army’s Health Facility Planning Agency, the other entities cited above, the relevant literature, the Federal Facilities Council list, and our discussions with experts, we synthesized several principles and processes that appear to constitute promising practices for a cost-effective program of facility management. These are
• a detailed inventory of facilities and their components;• a centrally controlled, online computerized inventory and inspection
database; • a common rating system applied to facilities with standardized,
objective, repeatable, engineering-based criteria to evaluate physical conditions;
• life-cycle principles of costing and budgeting for planning;• trained personnel for inspections, with multiple layers of review to
ensure consistency and validation;• nonfungibility of RPM funds;• allocation of repair funds based on an identified need and prioritized
according to severity/impact of deficiency, which can take mission impact into account; and
• an annual space management fee based on square footage used that covers RPM costs.
16The Army Health Facility Planning Agency determined its life-cycle requirements prior to converting them to a percent of PRV over a 50-year facility replacement life cycle.

Page 119 GAO/NSIAD-99-100 Real Property Management
Appendix IX
Objectives, Scope, and Methodology Appendix IX
As requested by the Senate Subcommittee on Readiness, Committee on Armed Services, we examined (1) the methodologies and criteria used by the military services to determine the need for real property maintenance (RPM) of facilities and to allocate available resources within each service and (2) the methods and criteria used by other organizations that are promising practices in facilities management and that therefore may be appropriate for use by the services.
Scope of the Study We focused on the services’ facilities around the world for which RPM is funded from the operation and maintenance (O&M) account. These facilities include barracks, administrative offices, airfields and terminals, classrooms and other training buildings, libraries, child development centers and dependent schools. They do not include facilities funded by non-O&M RPM accounts, such as revolving and management funds, the Defense Health Program (hospitals and medical clinics), or military family housing.
Methodology To address our first objective, we conducted analyses of DOD and service data. We also
• interviewed and were briefed by knowledgeable officials involved in real property management from all the services and
• obtained and reviewed key RPM-related documents and RPM-related manuals for each service, guidance, and other relevant reports and documents.
We also collected data for this objective through questionnaires based in part on surveys related to RPM performed by other professional organizations and information obtained from independent experts, DOD, and service officials. Two versions were developed—one for bases (installations) and one for major commands in the Army and Air Force and the Navy-Marine Corps equivalent, major claimants. During September-December 1997, we pretested the installation questionnaire at 11 bases, 3 bases in the Army and Air Force each, and 5 Navy bases. We also pretested the command questionnaire at four major commands(2 Army, 1 Air Force, and 1 Navy) for clarity, length of time of
Appendix IX
Objectives, Scope, and Methodology
Page 120 GAO/NSIAD-99-100 Real Property Management
administration, and acceptability to the respondents.1 Pretest versions were also submitted for review and comment to each service point of contact (POC) (including the Marines), and revisions were made based on the input from the POCs and from the pretests. We wanted to ensure that the questions would allow us to address the objectives and would make sense to those we sent it to.
The survey contained three groups of questions on methods and criteria used to (1) assess facility conditions, (2) estimate RPM budget and prioritization of needs, and (3) allocate resources to those needs. The text of the survey that was sent to installations can be found in appendix X.
Two questionnaires were sent; one to 530 military installations and one to 41 major commands/major claimants worldwide (Air Force, Army, Navy, and Marines) that are holders of RPM O&M funded facilities and that are “parent installations” (subinstallations are components of parent installations, and their property is included as part of the parent installations). This was the universe of bases in the services that hold and evaluate O&M RPM-funded property, according to the service RPM headquarters offices. Bases scheduled to be closed by the end of 1998 and scheduled for realignment or closure under the Base Realignment and Closure (BRAC) Act were excluded.
Although we asked that the questionnaire be returned within 10 days of receipt, it actually required more than 6 months to achieve a return rate of over 80 percent from each service. Our service POCs helped by repeatedly contacting bases and commands. The final tally of returned but not necessarily completely answered questionnaires is shown in table IX.1.
1Bases that were visited for pretests are listed at the end of the appendix on each service.

Appendix IX
Objectives, Scope, and Methodology
Page 121 GAO/NSIAD-99-100 Real Property Management
Table IX.1: Responses to GAO Questionnaires
Note: BRAC bases excluded from both mailed and returns.
In addition to the questionnaire, to determine the methods and criteria of the services and their allocation of resources for RPM needs, we visited installations and major commands of all the services (with the exception of the Marine Corps, where we visited one base), across the continental United States between July 1997 and August 1998. During those visits we
• reviewed related property records, documented backlog information, and the recorded deficiencies;
• visited facilities to observe their condition and deficiencies to compare assessments to actual building conditions;
• discussed the evaluation methods/condition assessment process with the raters/reviewers; and
• interviewed installation engineering staff as they showed us the deficiencies and documented additional information when necessary.
We also pretested and validated our questionnaires at a number of these installations and major commands/claimants.
We visited the following offices, bases, major commands, and claimants:
Office of the Secretary of Defense
Office of the Deputy Under Secretary of Defense (Installations) Directorate of Analysis Investment, Arlington, Virginia Office of the Secretary of Defense, Readiness Programming and Assessment Division, Washington, D.C.
Department of the Army Office of the Assistant Chief of Staff for Installation Management, Washington, D.C.
ServiceTotal number of
questionnaires mailedTotal returned
to GAOReturned as percent
of those mailed
Army bases 180 149 83
Navy installations 132 126 95
Marine Corps installations 16 16 100
Air Force bases 202 200 99
All services 530 491 93
Major commands/major claimants of all services 41 38 93

Appendix IX
Objectives, Scope, and Methodology
Page 122 GAO/NSIAD-99-100 Real Property Management
Department of Public Works, Alexandria, VirginiaInstallation Support Center, Alexandria, Virginia
Bases Fort Belvoir, (Military District of Washington), Alexandria, VirginiaFort Bragg (Forces Command), Fayetteville, North CarolinaFort Hood (Forces Command), Killeen, TexasFort McPherson (Forces Command), Atlanta, GeorgiaFort Sam Houston (Medical Command), San Antonio, TexasFort Sill (Training and Doctrine Command), Lawton, OklahomaRock Island Arsenal (Army Materiel Command), Rock Island, IllinoisTexas Army National Guard, Austin, Texas
Major Commands U.S. Army Forces Command, Fort McPherson, Atlanta, GeorgiaU.S. Army Medical Command, Fort Sam Houston, San Antonio, Texas
Department of the Air Force Air Force Deputy Chief of Staff for Installations and Logistics, Office of the Civil Engineer, Programs Division, Crystal City, Virginia Air Force Deputy Chief of Staff for Installations and Logistics, Office of the Civil Engineer, Operations Division, Crystal City, VirginiaAir Force Real Estate Agency, Bolling Air Force Base, Washington, D.C.
Bases Alabama Air National Guard, Birmingham, AlabamaEglin Air Force Base (Air Force Materiel Command), Fort Walton Beach, FloridaMaxwell Air Force Base (Air Education and Training Command), Montgomery, AlabamaPope Air Force Base (Air Mobility Command), Fayetteville, North CarolinaScott Air Force Base (Air Mobility Command), Belleville, IllinoisSeymour Johnson Air Force Base (Air Combat Command), Goldsboro, North CarolinaTinker Air Force Base (Air Force Materiel Command) Oklahoma City, OklahomaWright-Patterson Air Force Base (Air Force Materiel Command), Dayton, Ohio
Major Commands Air Combat Command, Langley Air Force Base, Langley, VirginiaAir Force Materiel Command, Wright-Patterson Air Force Base, Dayton, Ohio Air Mobility Command, Scott Air Force Base, Belleville, Illinois

Appendix IX
Objectives, Scope, and Methodology
Page 123 GAO/NSIAD-99-100 Real Property Management
Department of the Navy Navy Budget Office, Washington, D.C.Deputy Chief of Naval Operations (Logistics), Facilities and Engineering Division, Crystal City, Virginia
Bases Fleet Combat Training Center (Chief, Naval Education and Training), Atlantic, Dam Neck, Virginia Beach, VirginiaCalifornia Naval Air Station North Island (U.S. Pacific Fleet), San Diego, CaliforniaNaval Air Station Oceana (U.S. Atlantic Fleet), Virginia Beach, VirginiaNaval Air Station, Patuxent River (Naval Air Systems Command), Lexington Park, MarylandNaval Air Station Pensacola (Chief, Naval Education and Training), Pensacola, FloridaNorfolk Naval Shipyard (Naval Sea Systems Command), Portsmouth, VirginiaNaval Security Group Activity Northwest (Naval Security Group Command), Chesapeake, VirginiaNaval Station Norfolk (U.S. Atlantic Fleet), Norfolk, Virginia Norfolk Naval Shipyard (Naval Sea Systems Command), Portsmouth, Virginia
Major Claimants U.S. Atlantic Fleet, Norfolk, VirginiaNaval Air Systems Command, Patuxent River, Lexington Park, Maryland
Other Navy2 Public Works Center (Naval Facilities and Engineering Command), San Diego, CaliforniaPublic Works Center (Naval Facilities and Engineering Command), Norfolk, Virginia2
Commandant of the Marine Corps
Base Marine Corps Base, Quantico, Virginia
2Navy Public Works Centers are not installations; for this reason, they are here listed as “Other Navy.” They perform RPM on a reimbursable basis to Navy and Marine Corps bases and major claimants.

Appendix IX
Objectives, Scope, and Methodology
Page 124 GAO/NSIAD-99-100 Real Property Management
Nonmilitary Entities and RPM Experts
To identify promising practices in repair and maintenance of facilities that could be of potential use to the services, we contacted experts in the field of facilities management to help identify nonmilitary entities with reputations for high quality and innovation in facility management. These experts were identified on the basis of their reputations in the field and their publications, especially those by facilities management expert organizations such as the Federal Facilities Council of the National Research Council, the Logistics Management Institute, and the Association of Higher Education Facilities Officers (formerly the Association of Physical Plant Administrators of Universities and Colleges). We also contacted facility management experts at universities, private companies, and government agencies and surveyed relevant literature. We focused on large entities, as requested, because they are more directly comparable to the military services, with thousands of facilities around the world, than are single-location institutions with just a few dozen buildings.
Among the experts or expert entities with which we spoke to identify promising practices in facilities management, and/or from which we obtained reports, were the following:
Applied Management Engineering, Virginia Beach, VirginiaAssociation of Higher Education Facilities Officers, Alexandria, VirginiaArmy Health Facility Planning Agency, Falls Church, VirginiaBuilding Owners and Managers Association International, Washington, D.C.Capital Needs Analysis Center, Brigham Young University, Provo, UtahCivil Engineering Research Foundation, Washington, D.C.Construction Engineering Research Laboratories, Champaign, Illinois Congressional Budget Office, Washington, D.C.Richard Coullahan, Senior Vice President, Parsons Brinckerhoff Energy Services, Inc., Herndon, VirginiaEdward R. Damphousse, Manager, Consulting Services Group, R.S. Means Company, Inc., Kingston, MassachusettsDepartment of Energy, Washington, D.C.Federal Facilities Council, Washington, D.C.Mark M. Fagan, AIA, President, and Thomas K. Davies, AIA, Executive Vice President, Vanderweil Facility Advisors, Boston, MassachusettsGeneral Services Administration, Washington, D.C.Harvey H. Kaiser, Ph.D., HHK, Syracuse, New York and Reston, VirginiaInternational Facility Management Association, Houston, TexasLawrence Livermore National Laboratory, Livermore, CaliforniaLogistics Management Institute, McLean, Virginia
Letter

Appendix IX
Objectives, Scope, and Methodology
Page 125 GAO/NSIAD-99-100 Real Property Management
Peter Lufkin, Principal, Economics, Whitestone Research, Santa Barbara, California NASA, Facilities Engineering Division, Washington, D.C.NASA, Goddard Space Flight Center, Greenbelt, MarylandNational Institutes of Health, Division of Engineering Sciences, Rockville, MarylandPrivate Sector Council, Washington, D.C.Ronald Reagan Building and International Trade Center, Washington, D.CCity of San Jose, California, Department of Public WorksLeif Steinert, Senior Consultant, WorkPlace: A Bentley Strategic Affiliate, Littleton, MassachusettsEric Teicholz, President, Graphic Systems, Inc., Cambridge, Massachusetts
We visited the Capital Needs Analysis Center, Brigham Young University, Provo, Utah; the Lawrence Livermore National Laboratory, Livermore, California; and George Washington University, Washington, D.C.
We spoke to facility management officials from the following universities about their RPM practices:
Harvard University, Cambridge, MassachusettsMassachusetts Institute of Technology, Cambridge, MassachusettsUniversity of California, Facilities Management and Construction (Office of the President), Oakland, CaliforniaUniversity of California, Berkeley, CaliforniaUniversity of California, San Diego, CaliforniaUniversity of North Carolina, Chapel Hill, North Carolina
We spoke to officials from the following corporations about their facilities management:
Hughes Electronics CorporationLockheed Martin CorporationMobil Business Resources CorporationThe Boeing CompanyTrammel Crow Company (Washington, D.C.)
Other Literature and Internet Searches
In addition to the methods cited above to identify promising practices, we attended relevant conferences sponsored by the Federal Facilities Council, and conducted an extensive review of the literature on facilities management, using libraries, database searches, and the Internet. We also

Appendix IX
Objectives, Scope, and Methodology
Page 126 GAO/NSIAD-99-100 Real Property Management
obtained reports prepared by some private consulting firms. A bibliography can be found at the end of this report. We reviewed relevant legislation and legislative history with regard to RPM issues over the past 45 years.
We conducted our work between May 1997 and March 1999, in accordance with generally accepted government auditing standards.

Page 127 GAO/NSIAD-99-100 Real Property Management
Appendix X
Our Survey on Real Property Maintenance for Installations Appendix X

Appendix X
Our Survey on Real Property Maintenance
for Installations
Page 128 GAO/NSIAD-99-100 Real Property Management

Appendix X
Our Survey on Real Property Maintenance
for Installations
Page 129 GAO/NSIAD-99-100 Real Property Management

Appendix X
Our Survey on Real Property Maintenance
for Installations
Page 130 GAO/NSIAD-99-100 Real Property Management

Appendix X
Our Survey on Real Property Maintenance
for Installations
Page 131 GAO/NSIAD-99-100 Real Property Management

Appendix X
Our Survey on Real Property Maintenance
for Installations
Page 132 GAO/NSIAD-99-100 Real Property ManagementLetter

Appendix X
Our Survey on Real Property Maintenance
for Installations
Page 133 GAO/NSIAD-99-100 Real Property Management

Appendix X
Our Survey on Real Property Maintenance
for Installations
Page 134 GAO/NSIAD-99-100 Real Property Management

Appendix X
Our Survey on Real Property Maintenance
for Installations
Page 135 GAO/NSIAD-99-100 Real Property Management

Page 136 GAO/NSIAD-99-100 Real Property Management
Appendix XI
Comments From the Department of Defense Appendix XI
Note: GAO comments supplementing those in the report text appear at the end of this appendix.

Appendix XI
Comments From the Department of Defense
Page 137 GAO/NSIAD-99-100 Real Property Management

Appendix XI
Comments From the Department of Defense
Page 138 GAO/NSIAD-99-100 Real Property Management
See comment 1.
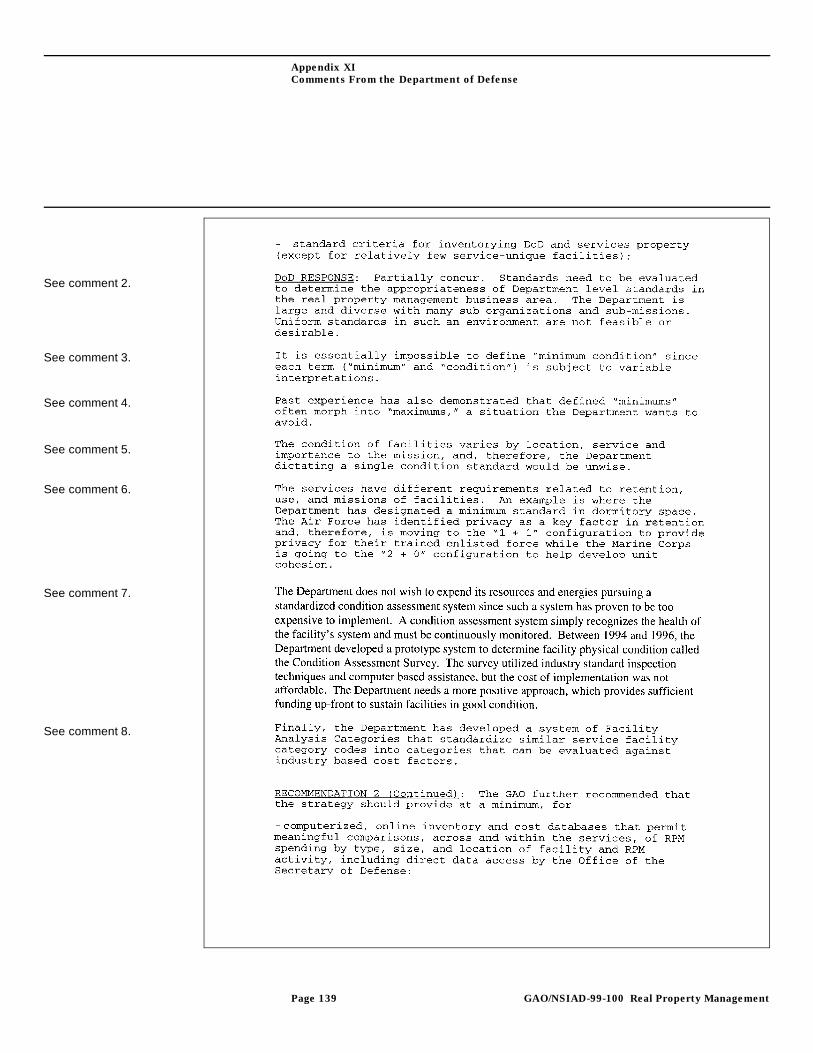
Appendix XI
Comments From the Department of Defense
Page 139 GAO/NSIAD-99-100 Real Property Management
See comment 2.
See comment 3.
See comment 4.
See comment 5.
See comment 6.
See comment 7.
See comment 8.

Appendix XI
Comments From the Department of Defense
Page 140 GAO/NSIAD-99-100 Real Property Management
See comment 9.
See comment 10.

Appendix XI
Comments From the Department of Defense
Page 141 GAO/NSIAD-99-100 Real Property ManagementLetter
See comment 11.
See comment 11.
See comment 12.
See comment 13.

Appendix XI
Comments From the Department of Defense
Page 142 GAO/NSIAD-99-100 Real Property Management
See comment 14.
See comment 15.
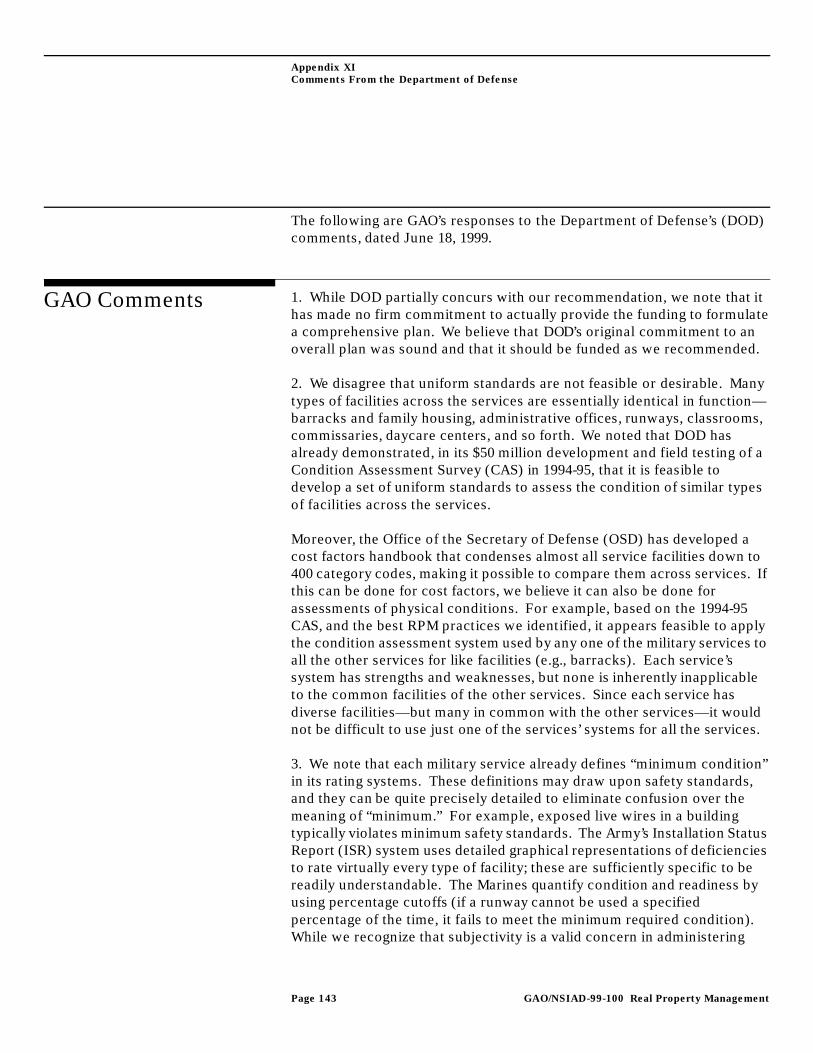
Appendix XI
Comments From the Department of Defense
Page 143 GAO/NSIAD-99-100 Real Property Management
The following are GAO’s responses to the Department of Defense’s (DOD) comments, dated June 18, 1999.
GAO Comments 1. While DOD partially concurs with our recommendation, we note that it has made no firm commitment to actually provide the funding to formulate a comprehensive plan. We believe that DOD’s original commitment to an overall plan was sound and that it should be funded as we recommended.
2. We disagree that uniform standards are not feasible or desirable. Many types of facilities across the services are essentially identical in function—barracks and family housing, administrative offices, runways, classrooms, commissaries, daycare centers, and so forth. We noted that DOD has already demonstrated, in its $50 million development and field testing of a Condition Assessment Survey (CAS) in 1994-95, that it is feasible to develop a set of uniform standards to assess the condition of similar types of facilities across the services.
Moreover, the Office of the Secretary of Defense (OSD) has developed a cost factors handbook that condenses almost all service facilities down to 400 category codes, making it possible to compare them across services. If this can be done for cost factors, we believe it can also be done for assessments of physical conditions. For example, based on the 1994-95 CAS, and the best RPM practices we identified, it appears feasible to apply the condition assessment system used by any one of the military services to all the other services for like facilities (e.g., barracks). Each service’s system has strengths and weaknesses, but none is inherently inapplicable to the common facilities of the other services. Since each service has diverse facilities—but many in common with the other services—it would not be difficult to use just one of the services’ systems for all the services.
3. We note that each military service already defines “minimum condition” in its rating systems. These definitions may draw upon safety standards, and they can be quite precisely detailed to eliminate confusion over the meaning of “minimum.” For example, exposed live wires in a building typically violates minimum safety standards. The Army’s Installation Status Report (ISR) system uses detailed graphical representations of deficiencies to rate virtually every type of facility; these are sufficiently specific to be readily understandable. The Marines quantify condition and readiness by using percentage cutoffs (if a runway cannot be used a specified percentage of the time, it fails to meet the minimum required condition). While we recognize that subjectivity is a valid concern in administering

Appendix XI
Comments From the Department of Defense
Page 144 GAO/NSIAD-99-100 Real Property Management
rating systems, the definitions can be set reasonably precisely, as currently demonstrated by each service’s system.
4. While DOD states that defined minimums often become maximums, this does not appear to be a sound ground on which to avoid setting minimum standards or goals. If minimums becoming maximums is indeed a problem, then DOD can exercise the oversight to correct it.
5. While we recognize DOD’s concerns about “dictating” common standards, we believe that there is a compelling need to set common standards for assessing facility conditions, to permit the Congress to be able to evaluate requests for RPM funding across the services. Since each service annually rates, in one way or another, the condition of thousands of facilities around the world, it is not clear why the like facilities of each service (e.g., barracks) should be rated by different systems that preclude meaningful comparisons of physical condition. Specifically, the purpose of like facilities is essentially the same. While impact on mission may vary in some regards, depending on location and other factors, this has no relevance to the actual condition of the buildings. (It can be a factor in deciding how to prioritize RPM spending.) Personnel need sound, decent facilities in which to live and work; the condition of these facilities should be known by DOD based on common criteria.
6. The configuration of barracks space is more a quality of life than a repair and maintenance issue. As DOD notes, changing configuration is part of efforts to improve retention; a barracks with a central latrine could be in excellent condition but would still be rated unacceptable given the standard of 1+1 (two rooms, one bathroom). The services are permitted to use both RPM and military construction funds to pay for such changes in barracks space. We note that according to current service estimates, no service will meet the 1+1 standard before 2013 at the earliest. The Marines will not meet the goal of providing its lower standard (2+0, or two persons per room, one bathroom) until the year 2035. In contrast, the other services will meet the DOD 1+1 standard by 2020 (Army), 2013 (Navy), and 2019 (Air Force).
7. While DOD states that the standardized condition assessment system it developed was too expensive to implement, it never compared this system’s costs to the costs of administering the four separate systems in the services. Such a comparison is necessary to be able to conclude that a single system would be too costly compared to the four major systems currently used. In addition, while DOD states that it needs a “more positive

Appendix XI
Comments From the Department of Defense
Page 145 GAO/NSIAD-99-100 Real Property Management
approach” that “provides sufficient funding up-front to sustain facilities in good condition,” it is also the case that a single set of standards would permit determining which facilities are in the worst condition and, therefore, are in greater need of limited funds than others. Without such cross-service standards, the Congress is unable to prioritize among the competing requests.
8. We have noted the development of the cost factors handbook by the OSD (Installations) Directorate of Analysis and Investment, and we regard it as an important step in the standardization of RPM data.
9. We believe that a computerized on-line database accessible to both OSD and each service is essential to better and more effective RPM management by DOD. Under current arrangements, “data calls” or requests are issued by OSD in order to gather basic inventory and budget data. We found that the data held by OSD and the services on inventory and RPM spending often did not match or could not be readily compared. Even the services’ headquarters RPM offices reported problems with obtaining basic and reliable data from their components. In contrast, at both Lawrence Livermore and Brigham Young University’s Capital Needs Analysis Center (CNA), all RPM inventory and condition data were available immediately on-line to central management. Similarly, the Army’s ISR data are computerized and summary data are available to headquarters and other facility management personnel. These are management practices that clearly constitute a minimum requirement for effective RPM management across DOD. A system with common facility codes—which OSD is attempting to implement—should be readily and inexpensively amenable to being kept on-line. Comparisons of data are an essential component of RPM management. Until such comparisons are made, DOD will not know where RPM dollars are truly needed, where they are being spent, or how much property it actually has.
OSD has developed a system of common facility category codes (published in DOD Facilities Cost Factors Handbook, Version 1.0, Apr. 1999) that the services are now reviewing, but have not yet agreed to use. The purpose of this system is to compare service RPM and construction spending on similar types of facilities (e.g., administrative space, classroom buildings, and barracks) to, as DOD states, industry standards. The data required to make these comparisons must be gathered and inputted into a computer database if the effort is to be manageable. Further, if “meaningful” comparisons are to be made, it is essential that these cost and inventory data be computerized and put on-line.

Appendix XI
Comments From the Department of Defense
Page 146 GAO/NSIAD-99-100 Real Property Management
10. Tracking how much each service is spending on RPM by type of facility and by square foot (or other common metric) will enable DOD to exercise effective oversight. We note that OSD has published cost factors and is now using them to assess the adequacy of each service’s RPM spending by facility type. We further note that meaningful evaluation of the comparative costs of maintaining the same types of facilities across services requires a high level of detail in order for major commands to be able to compare expenditures of their bases. Without consistent, comparable data for like facilities, no meaningful evaluations are possible. With current databases and budget data, it is not possible to readily compare RPM spending per square foot for like facilities across services. OSD’s new facility category code system, including industry cost standards, will have no clear purpose unless these costs—which are per square foot—can be compared to what military installations spend. The Army’s Directorate of Public Works’ inventory/cost per square foot databases permitted such comparisons and were on-line; these databases should be restored and expanded to include the other services.
11. We appreciate the need for flexibility in funding decisions, but in some cases this can lead to insufficient repairs or cancellation of repair contracts. Migration of RPM funds is at least partly responsible for the accumulation of $16 billion in repair backlogs. This is an issue that DOD needs to address. Although restricting the migration of RPM funds may reduce flexibility, some of the organizations we reviewed found the practice yielded beneficial results. Accordingly, we continue to believe that the Department ought to consider the feasibility of adopting some form of this promising practice. We have modified our recommendation to that effect.
12. We commend DOD—more specifically, OSD’s (Installations) Directorate of Analysis and Investment office—for the cost factors handbook they published in April 1999. They are also investigating methods to put this handbook on-line, which is essential to its effective use by military personnel worldwide. However, given the costs per square foot identified, we believe that many will exceed the level of actual spending by the military services, rather than validate current spending levels. For example, the Army spent $1.81 per square foot for RPM for administrative buildings in the United States and its territories according to the fiscal year 1997 annual summary issued by the Army’s Directorate of Public Works

Appendix XI
Comments From the Department of Defense
Page 147 GAO/NSIAD-99-100 Real Property Management
(the last year of publication available).1 In contrast, OSD’s cost factors show RPM spending for such buildings nationwide at $2.46 per square foot, or 36 percent higher. Even taking into account the (low) inflation over the past 2 or 3 years, this would not narrow the difference measurably. Therefore, we question whether OSD’s cost factors will validate the levels of RPM spending by the services. At the same time, it is exactly these kinds of comparisons that DOD should be undertaking as part of a more vigorous RPM oversight management program.
13. DOD states that it has considered the “taxing” arrangement used by LLNL (which assesses facility costs to activities based on the square footage occupied, and total facility maintenance costs) and also states that working capital funds were deemed unsuitable as a funding mechanism for base operations. However, the Navy has used working capital funds for many years at numerous locations and continues to do so. At a minimum, DOD needs to reinvent the way in which facilities maintenance is carried out across the services, to ensure that repair spending is prioritized on the basis of which facilities are needed, and of those, which need repair the most. The U.S. Army’s Health Facility Planning Agency has developed metrics to prioritize such spending in line with its mission. Its work might be taken as a potential model.
14. We note that consistent training standards are common throughout the military for virtually every activity it undertakes. Common training for RPM personnel will help ensure consistency in the assessment of facility conditions and RPM needs. Responses to our questionnaire showed variations in training within the services. Since training is widely understood as essential to competent job performance and is generally treated as such for other activities in the military, it is not clear why DOD objects to common training for RPM. The Navy noted in its technical comments that its guidance on RPM inspector qualifications “addresses such things as technical trade background, formal education in theory, experience in maintenance and repair operations, and skills in inspection techniques, planning and estimating, maintenance standards, and building codes.” This guidance could well serve as the model for a DOD-wide standard for all facility inspectors.
1The average for worldwide spending was $1.96 per square foot, or about 8.2 percent more than for just the United States and territories. See Department of the Army, Directorates of Public Works, Fiscal Year 1997 Annual Summary of Operations, vol. II, p. 2 and p. 5.

Appendix XI
Comments From the Department of Defense
Page 148 GAO/NSIAD-99-100 Real Property Management
15. In examining the documents associated with DOD’s efforts in the mid 1990s to implement a Condition Assessment Survey (CAS), we found that no cost comparison had been made between the cost of the CAS and systems used by the services to evaluate the condition of their properties. Further, no evaluation was presented in the materials we were provided by DOD of the costs versus benefits of such a system. We were told by a number of persons involved in the CAS effort that the services had no interest in a servicewide RPM needs assessment system that would require common standards.

Page 149 GAO/NSIAD-99-100 Real Property Management
Appendix XII
GAO Contacts and Staff Acknowledgments Appendix XII
GAO Contacts Kwai-Cheung Chan, (202) 512-3092Dr. Sushil K. Sharma, (202) 512-3460Dr. Jonathan R. Tumin, (202) 512-3595
Acknowledgments In addition to those named above, Mary K. Quinlan, Lorelei St. James, Robert C. Mandigo Jr., Venkareddy Chenareddy, and Raymond J. Wyrsch made key contributions to this report.

Page 150 GAO/NSIAD-99-100 Real Property Management
Bibliography
Reports and References Consulted
Ackerman, Glenn, et. al., The Backlog of Maintenance and Repair: Preventing Its Growth and Measuring Its Impact, Alexandria, Virginia: Center for Naval Analyses, April 1995.
Adams, Matthew C., Successful Funding Strategies for Facility Renewal; Alexandria, Virginia: APPA, 1997.
American Public Works Association:
• “Good Practices in Public Works.” Special Report 54, 988 (np).• Committing to the Cost of Ownership: Maintenance and Repair of Public
Buildings: Building Research Board, National Research Council, Special Report #60 (np; nd).
APPA (The Association of Higher Education Facilities Officers):
• Capital Renewal and Deferred Maintenance, Vol. 4 in “Critical Issues in Facilities Management” (Alexandria, Virginia: 1989).
• Operations and Maintenance, Vol. 8 in Critical Issues in Facilities Management (Alexandria, Virginia: 1992).
• “Proceedings of the 1997 Educational Conference and 84th Annual Meeting” (collected papers).
• Same, 1996.• Facilities Stewardship in the 1990s (Washington, D.C.,1990).• Facilities Management: A Manual for Plant Administration, vols. 1 and 2,
second ed. (Alexandria, Virginia: 1995).• Facilities Management: A Manual for Plant Administration (3rd edition),
Part II: Maintenance and Operations of Buildings and Grounds (Alexandria, Virginia: 1997).
Audet-Lapointe, Patrice, “A Condition Assessment Process Developed for Use in the Private Sector,” in Kelley, Stephen J. and Marshall, Philip C., eds., Service Life of Rehabilitated Buildings and Other Structures (Philadelphia, Pennsylvania: American Society for Testing and Materials, 1990), pp. 25-35.
Biedenweg, Rick, and Cummings, Alan A., “Before the Roof Caves in Part II: A Predictive Model for Physical Plant Renewal,” in APPA, “Proceedings of the 1997 Educational Conference and 84th Annual Meeting, July 1997,pp. 13-20.
Letter

Bibliography
Page 151 GAO/NSIAD-99-100 Real Property Management
“Budgeting for Maintenance and Repair of Facilities (Summary of a Symposium),” Federal Construction Council Technical Report No. 88 (Washington, D.C.: Naval Academy Press, 1988).
Bowlin, Maj. Wm. F., “Evaluating the Efficiency of RPMA in the Tactical Air Command,” Air University, USAF, March 1985.
1998 BOMA Experience Exchange Report: Operating a Cost Effective Office Building (Washington, D.C.: Building Owners and Managers Association (BOMA) International, 1998).
Burco, Al, “Budgeting for Facility Repair and Maintenance,” Journal of Management in Engineering, July-August 1994.
Cable, John and Wilson, Thomas P., Benchmarking of Facilities Support Services at the National Institutes of Health (McLean, Virginia: Logistics Management Institute, July 1996).
Cable, John, et.al., Repair and Alteration Services at the U.S. Postal Service (McLean, Virginia: Logistics Management Institute, April; 1995) (PS406MR1).
Cable, Jon, et.al, Benchmarking Results at Four Defense Logistics Support Command Sites (McLean, Virginia: Logistics Management Institute: August 1998).
Chouinard, L.E., Anderson, G.R., and Torrye, V.H. III; “Ranking Models Used for Condition Assessment of Civil Infrastructure Systems,” Journal of Infrastructure Systems, Vol. 2, No. 1, March 1996, pp. 23-29.
Christensen, Douglas K., “Integrating Capital Studies Within Physical Plant Operations,” in Capital Renewal and Deferred Maintenance, Vol. 4 in “Critical Issues in Facilities Management” (Alexandria, Virginia: APPA),pp. 89-104.
Christian, John, and Pandeya, Amar, “Cost Predictions of Facilities;” Journal of Management Engineering, Vol. 13, No. 1, Jan.-Feb. 1997, pp. 52-61.
Civil Engineering Research Foundation (CERF): Level of Investment Study Facilities and Infrastructure Maintenance and Repair (Washington, D.C.: August 1996).
Letter

Bibliography
Page 152 GAO/NSIAD-99-100 Real Property Management
Cuciti, Peggy, and Overman, E. Sam, “The Assessment of Investment Needs: A Review of Current Estimates and Approaches” (np: National Council on Public Works Improvement), Oct. 20, 1986.
Derrick, Robert R., “Military Infrastructure: Is It as Bad as the Nation's Infrastructure?,” Master’s Thesis, U.S. Army Command and General Staff College (Fort Leavenworth: 1990).
Federal Facilities Council:
• Budgeting for Facilities Maintenance and Repair Activities (Washington, D.C.: National Academy Press, 1996), Report No. 131.
• Government/Industry Forum on Capital Facilities and Core Competencies (Washington, D.C.: National Academy Press, 1998), Report No. 136.
Facilities Manager, official publication of The Association of Higher Education Facilities Officers (APPA), especially March/April 1997, “Attacking Deferred Maintenance,” and May/June 1998, “Assessment & Evaluation: Measuring Up in Today’s Facilities.”
Frye, Major David C., “Decision Support for Infrastructure Renewal in the US Army” (West Point, NY: U.S. Military Academy, June 1992), Operations Research Center Technical Report No. FY92/91-1.
Goodhart, Christopher A., “Allocation of Navy Real Property Maintenance Funding,” Master’s Thesis, Naval Postgraduate School, Monterey, California, March 1997.
Harmon, Wm. E., “Decision Support for Installations of the U.S. Army” (West Point, NY: U.S. Military Academy, June 1993) Operations Research Center Technical Report No. FY93/92-1.
Hawkins, Jeffrey A., et. al, “Managing Real Property Maintenance: Meeting the Challenge of Declining Budgets" (McLean, Virginia: Logistics Management Institute, March 1990).
Iselin, Donald G. and Lemer, Andrew C., eds., The Fourth Dimension in Building: Strategies for Minimizing Obsolescence,) Committee on Facility Design to Minimize Premature Obsolescence, National Research Council (Washington, D.C.: National Academy Press), pp. 14-25.

Bibliography
Page 153 GAO/NSIAD-99-100 Real Property Management
Kaiser, Harvey H., A Foundation to Uphold: A Study of Facilities Conditions at U.S. Colleges and Universities, (NACUBO, APPA, and Sallie Mae) (Alexandria, Virginia: APPA, 1996).
Kaiser, Harvey H., The Facilities Audit: A Process for Improving Facilities Conditions (Alexandria, Virginia: APPA, 1993).
Kaiser, Harvey H., “Capital Renewal and Deferred Maintenance Programs,” in Glazner, Steve, ed., Maintenance and Operations of Buildings and Grounds (Alexandria, Virginia: APPA, 1997).
Kinnaman, Margaret, P.: “S.A.M. [strategic assessment model]: Benchmarking with APPA’s Strategic Assessment Model,” September 1997, APPA website (www.appa.org).
Lufkin, Peter and Silsbee, Robert M., The Whitestone Building Maintenance and Repair Cost Reference 1998, Fourth Annual Edition, Whitestone Research, Santa Barbara, California, April 1998.
Managing the Facilities Portfolio: A Practical Approach to Institutional Facility Renewal and Deferred Maintenance (Washington, D.C.: National Association of College and University Business Officers), 1991. Applied Management Engineering, Virginia Beach, Virginia. Rush, Sean, principal investigator.
McCauley, Janet M., “Backlog of Maintenance and Repair (BMAR): The Navy’s Approach to Funding,” Master’s Thesis, Naval Postgraduate School, Monterey, California, June 1980.
“Minutes of the Annual Meeting of the Association of Superintendents of Buildings and Grounds of the Universities and Colleges,” University of Rochester, Rochester, NY, May 1932. (From the APPA library.)
Neely, Edgar Samuel Jr. and Neathammer, Robert, “Life-Cycle Maintenance Costs by Facility Use,” Journal of Construction Engineering and Management, Vol. 117, No. 2, June 1991, pp. 310-320.
O'Hara, Thomas E., Kays, James L., and Farr, John V., “Installation Status Report,” Journal of Infrastructure Systems, Vol. 3, No. 2, June 1997,pp. 87-92.

Bibliography
Page 154 GAO/NSIAD-99-100 Real Property Management
Owens, James W. II and Shultz, Robert L., “Backlog of Maintenance and Repair (BMAR) at PWC San Diego, Definition and Methodology for Reduction,” Master’s Thesis, Naval Postgraduate School, Monterey, California, March 1979.
"Paying for Military Readiness and Upkeep: Trends in Operation and Maintenance Spending," Congressional Budget Office, September 1997.
"Pavement Maintenance Prediction and Runway Repair Materials" (Washington, D.C.: National Academy of Sciences, Transportation Research Board), 1984, Transportation Research Record 943.
"Pay Now or Pay Later: Controlling Cost of Ownership From Design Throughout the Service Life of Public Buildings," (Washington, D.C.: National Academy Press), 1991, Building Research Board, Committee on Setting Federal Construction Standards to Control Building Life-Cycle Costs, National Research Council.
Price, Lynn A., "Managing Backlog of Maintenance and Repair (BMAR) in the Marine Corps," thesis, Naval Postgraduate School, Monterey, California, Dec. 1987.
R.S. Means Company, Inc.:
• Cost Planning and Estimating for Facilities Maintenance (Kingston, Massachusetts) 1996.
• Facilities Construction Cost Data, 13th Annual ed., 1998.• Facilities Maintenance and Repair Cost Data, 1998.
Saito, Mitsuru, ed., Infrastructure Condition Assessment: Art, Science, and Practice (NY: American Society of Civil Engineers), 1997.
Selman, Jon R., Cable, Jon H., and Silverman, Robert P., “Public Sector Benchmarking: A Diagnostic Approach,” Logistics Management Institute (McLean, Virginia: nd, c. 1998).
Serving the American Public: Best Practices in Customer-Driven Strategic Planning (Washington, D.C.: Federal Consortium Benchmarking Study Team, February 1997).
Simon, Benjamin M., “Infrastructure Investment Decisions: Setting Facilities Repair and Rehabilitation Priorities for the Department of the

Bibliography
Page 155 GAO/NSIAD-99-100 Real Property Management
Interior,” Public Budgeting and Financial Management, vol. 5, No. 3, 1993, pp. 529-549.
“Special Report : Deferred Maintenance,” American Association of State Colleges and Universities,” April 1997, http://www.aascu.nche.edu/home.htm.
Stewardship of Federal Facilities (Washington, D.C.: National Academy Press), 1998, National Research Council.
Syme, Preston T., and Oschrin, Jay, "How to Inspect Your Facilities and Still Have Money Left to Repair Them," (Alexandria, Virginia: 1996), APPA, in "Proceedings of the 1997 Educational Conference and 83rd Annual Meeting, July 1996, APPA.
Teicholz, Eric, "Facility Condition Assessment Technology," (http://www. graphsys.com/articles), February 1999.
Trainor, Major Timothy E., "Decision Support for Installations of the U.S. Army: The Installation Status Report Part I—Infrastructure" (West Point, NY: U.S. Military Academy), Operations Research Center Technical Report No. FY 94/93-1, June 1995.
The Urban Institute, Washington, D.C.:
• Literature Review on Deferred Maintenance (Washington, D.C.: July 1994) & Guides to Managing Urban Capital Series, Hatry, Harry P. and Steinthal, Bruce G., ed.
• Guide to Assessing Capita Stock Condition (Washington, D.C.: 1985). • Guide to Maintenance Strategies for Capital Facilities (Washington,
D.C.: 1985).• Guide to Setting Priorities for Capital Investment (Washington, D.C.:
1985).• Guide to Benchmarks of Urban Capital Condition (Washington, D.C.:
1985).
VW International, “Military Health Services System Facility Life-Cycle Maintenance: Investment Strategy and Maintenance Cost Model” (VWI, Alexandria, Virginia, 31 Dec. 1996), prepared for Office of the Assistant Secretary of Defense (Health Affairs).

Bibliography
Page 156 GAO/NSIAD-99-100 Real Property Management
Westerbeck, Gerald W., and Cassell, Jordan W., “Infrastructure Planning and Real Property Management: New Facility Category Coding” (McLean, Virginia: Logistics Management Institute), March 1998.
Armed Services Documents/Guidances/Reports
Department of the Army: Plant Replacement Value Analysis for Fiscal Year 1996 (Army Center for Public Works) (13 August 1997).
DOD:
• Renewing the Built Environment, March 1989 • Quadrennial Defense Review Infrastructure Panel, “Installation Support
Task Force Final Report,” dated February 24, 1997.• Annual Defense Report, 1999.• “What Does the Future Hold for Defense Installations?: A White Paper
for DOD Commanders,” February 26, 1997, OSD, Directorate for Installations Management.
OSD: "Report on Real Property Maintenance Migration of Funds," (April 7, 1997) (Office of the Deputy Under Secretary of Defense) (Logistics), Analysis and Investment Directorate.
Air Force:
• "The Air Force Plant Replacement Value: Short Term Analysis Report," Oct. 1997
• "Facility Investment Metric Program," Implementation and Operation Guide (August 1997).
"Validation of the Army's Fiscal Year 1989 Reported Backlog of Maintenance and Repair," U.S. Army Audit Agency, 31 Jan. 1991.
Data on Assessment procedures and/or guidelines from:
Tennessee Air National Guard, HQ 134th Air Refueling Wing (Oct. 1997).
Air Combat Command HQ, dated 6 Aug. 1997: "Real Property Maintenanceby Contract (RPMC) Methodology" and "CERM Implementation" SeymourJohnson AFB, 1994-1997.

Bibliography
Page 157 GAO/NSIAD-99-100 Real Property Management
“Facilities Condition Assessment Program for Naval Station Mayport, Florida,” prepared by Navy Public Works Center, Norfolk, Virginia, Fiscal Year 1998.
“Strategic Maintenance Execution Plan: 1998-2000, Commander Fleet Activities Yokosuka Japan,” prepared by PAE Facility Management Services, May 1997.
Army Health Facility Planning Agency.
U.S. Army Corps of Engineers
• Construction Engineering Research Laboratories (CERL): "Facility Cost Simulation Models: A Basis for Replacement Policy," October 1988 (technical report P-89/01).
• CERL: An Analysis of the Building Renewal Problem, June 1987, Technical report P-87/11.
• Water Resources Support Center, Institute for Water Resources: "The Federal Role in Funding State and Local Infrastructure: Two Reports on Public Works Financing" (Ft. Belvoir, Va) August 1993.
The Federal Infrastructure Strategy Program series:
• "Framing the Dialogue, Strategies, Issues and Opportunities," May 1993.• "Infrastructure in the 21st Century Economy: A Review of the Issues
and Outline of a Study of the Impacts of Federal Infrastructure Investments," July 1993.
• "Challenges and Opportunities for Innovation in the Public Works Infrastructure—Vol. I," June 1993.
• "Challenges and Opportunities for Innovation in the Public Works Infrastructure—Vol. II," June 1993.
• "Federal Public Works Infrastructure R&D: A New Perspective," July 1993.
• "Consolidated Performance Report on the Nation's Public Works: An Update," December 1994.
• "Public Works Management Practices—Vol. I: A Public Works Perspective of the Road Blocks and Opportunities to Improve Performance," August 1994 (co-published with American Public Works Association--APWA--written by Melvin, Eric and Throne, James D., APWA).

Bibliography
Page 158 GAO/NSIAD-99-100 Real Property Management
• "Public Works Management Practices—Vol. II: Local Government Public Works Agencies: The Effect of Federal Mandates on Their Activities and Improving Their Management Performance," August 1994.

Page 159 GAO/NSIAD-99-100 Real Property Management

Page 160 GAO/NSIAD-99-100 Real Property Management
Related GAO Products
Deferred Maintenance Reporting: Challenges to Implementation (GAO/AIMD-98-42, Jan. 1998).
Defense Infrastructure: Demolition of Unneeded Buildings Can Help Avoid Operating Costs (GAO/NSIAD-97-125, May 1997).
Financial Audit: 1997 Consolidated Financial Statements of the U.S. Government (GAO/AIMD-98-127, Mar. 1998).
High-Risk Series: Defense Infrastructure (GAO/HR-97-7, Feb. 1997).
Older Americans Act: Promising Practice in Information and Referral Services (GAO/PEMD 91-31, Aug. 1991).
(713021) Letter

Ordering Information
The first copy of each GAO report and testimony is free.Additional copies are $2 each. Orders should be sent to the following address, accompanied by a check or money order made out to the Superintendent of Documents, when necessary, VISA and MasterCard credit cards are accepted, also.
Orders for 100 or more copies to be mailed to a single address are discounted 25 percent.
Orders by mail:
U.S. General Accounting OfficeP.O. Box 37050Washington, DC 20013
or visit:
Room 1100700 4th St. NW (corner of 4th and G Sts. NW)U.S. General Accounting OfficeWashington, DC
Orders may also be placed by calling (202) 512-6000or by using fax number (202) 512-6061, or TDD (202) 512-2537.
Each day, GAO issues a list of newly available reports and testimony. To receive facsimile copies of the daily list or any list from the past 30 days, please call (202) 512-6000 using a touchtone phone. A recorded menu will provide information on how to obtain these lists.
For information on how to access GAO reports on the INTERNET, send an e-mail message with “info” in the body to:
or visit GAO’s World Wide Web Home Page at:
http://www.gao.gov

United StatesGeneral Accounting OfficeWashington, D.C. 20548-0001
Official BusinessPenalty for Private Use $300
Address Correction Requested
Bulk RatePostage & Fees Paid
GAOPermit No. GI00

PAGE 163 GAO/XXXX-98-??? NAME OF DOCUMENT