nsse 2013 u.s. grand...
TRANSCRIPT
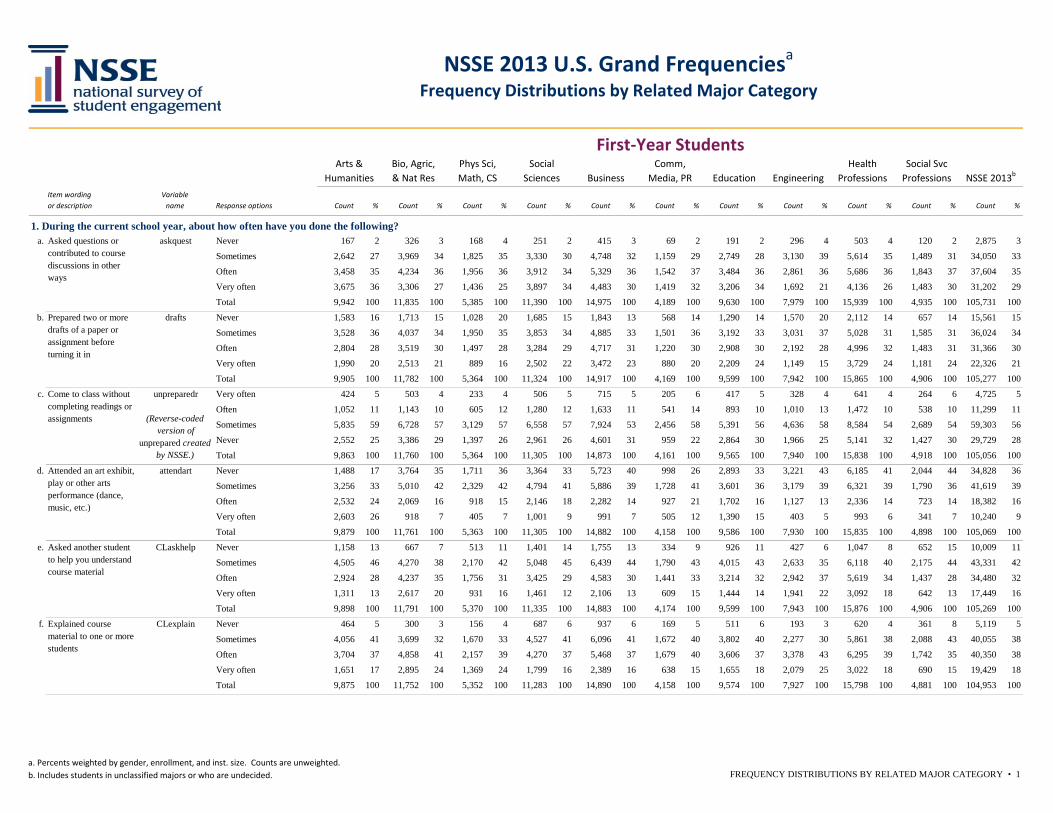
a. Percents weighted by gender, enrollment, and inst. size. Counts are unweighted.b. Includes students in unclassified majors or who are undecided. FREQUENCY DISTRIBUTIONS BY RELATED MAJOR CATEGORY • 1
Item wording or description
Variable name Response options Count % Count % Count % Count % Count % Count % Count % Count % Count % Count % Count %
1. During the current school year, about how often have you done the following?a. Never 167 2 326 3 168 4 251 2 415 3 69 2 191 2 296 4 503 4 120 2 2,875 3
Sometimes 2,642 27 3,969 34 1,825 35 3,330 30 4,748 32 1,159 29 2,749 28 3,130 39 5,614 35 1,489 31 34,050 33
Often 3,458 35 4,234 36 1,956 36 3,912 34 5,329 36 1,542 37 3,484 36 2,861 36 5,686 36 1,843 37 37,604 35
Very often 3,675 36 3,306 27 1,436 25 3,897 34 4,483 30 1,419 32 3,206 34 1,692 21 4,136 26 1,483 30 31,202 29
Total 9,942 100 11,835 100 5,385 100 11,390 100 14,975 100 4,189 100 9,630 100 7,979 100 15,939 100 4,935 100 105,731 100
b. Never 1,583 16 1,713 15 1,028 20 1,685 15 1,843 13 568 14 1,290 14 1,570 20 2,112 14 657 14 15,561 15
Sometimes 3,528 36 4,037 34 1,950 35 3,853 34 4,885 33 1,501 36 3,192 33 3,031 37 5,028 31 1,585 31 36,024 34
Often 2,804 28 3,519 30 1,497 28 3,284 29 4,717 31 1,220 30 2,908 30 2,192 28 4,996 32 1,483 31 31,366 30
Very often 1,990 20 2,513 21 889 16 2,502 22 3,472 23 880 20 2,209 24 1,149 15 3,729 24 1,181 24 22,326 21
Total 9,905 100 11,782 100 5,364 100 11,324 100 14,917 100 4,169 100 9,599 100 7,942 100 15,865 100 4,906 100 105,277 100
c. Very often 424 5 503 4 233 4 506 5 715 5 205 6 417 5 328 4 641 4 264 6 4,725 5
Often 1,052 11 1,143 10 605 12 1,280 12 1,633 11 541 14 893 10 1,010 13 1,472 10 538 10 11,299 11
Sometimes 5,835 59 6,728 57 3,129 57 6,558 57 7,924 53 2,456 58 5,391 56 4,636 58 8,584 54 2,689 54 59,303 56
Never 2,552 25 3,386 29 1,397 26 2,961 26 4,601 31 959 22 2,864 30 1,966 25 5,141 32 1,427 30 29,729 28
Total 9,863 100 11,760 100 5,364 100 11,305 100 14,873 100 4,161 100 9,565 100 7,940 100 15,838 100 4,918 100 105,056 100
d. Never 1,488 17 3,764 35 1,711 36 3,364 33 5,723 40 998 26 2,893 33 3,221 43 6,185 41 2,044 44 34,828 36
Sometimes 3,256 33 5,010 42 2,329 42 4,794 41 5,886 39 1,728 41 3,601 36 3,179 39 6,321 39 1,790 36 41,619 39
Often 2,532 24 2,069 16 918 15 2,146 18 2,282 14 927 21 1,702 16 1,127 13 2,336 14 723 14 18,382 16
Very often 2,603 26 918 7 405 7 1,001 9 991 7 505 12 1,390 15 403 5 993 6 341 7 10,240 9
Total 9,879 100 11,761 100 5,363 100 11,305 100 14,882 100 4,158 100 9,586 100 7,930 100 15,835 100 4,898 100 105,069 100
e. Never 1,158 13 667 7 513 11 1,401 14 1,755 13 334 9 926 11 427 6 1,047 8 652 15 10,009 11
Sometimes 4,505 46 4,270 38 2,170 42 5,048 45 6,439 44 1,790 43 4,015 43 2,633 35 6,118 40 2,175 44 43,331 42
Often 2,924 28 4,237 35 1,756 31 3,425 29 4,583 30 1,441 33 3,214 32 2,942 37 5,619 34 1,437 28 34,480 32
Very often 1,311 13 2,617 20 931 16 1,461 12 2,106 13 609 15 1,444 14 1,941 22 3,092 18 642 13 17,449 16
Total 9,898 100 11,791 100 5,370 100 11,335 100 14,883 100 4,174 100 9,599 100 7,943 100 15,876 100 4,906 100 105,269 100
f. Never 464 5 300 3 156 4 687 6 937 6 169 5 511 6 193 3 620 4 361 8 5,119 5
Sometimes 4,056 41 3,699 32 1,670 33 4,527 41 6,096 41 1,672 40 3,802 40 2,277 30 5,861 38 2,088 43 40,055 38
Often 3,704 37 4,858 41 2,157 39 4,270 37 5,468 37 1,679 40 3,606 37 3,378 43 6,295 39 1,742 35 40,350 38
Very often 1,651 17 2,895 24 1,369 24 1,799 16 2,389 16 638 15 1,655 18 2,079 25 3,022 18 690 15 19,429 18
Total 9,875 100 11,752 100 5,352 100 11,283 100 14,890 100 4,158 100 9,574 100 7,927 100 15,798 100 4,881 100 104,953 100
Health Professions
Social Svc Professions
Explained course material to one or more students
CLexplain
Come to class without completing readings or assignments
unpreparedr
(Reverse-coded version of
unprepared created by NSSE.)
Attended an art exhibit, play or other arts performance (dance, music, etc.)
attendart
Asked another student to help you understand course material
CLaskhelp
Engineering NSSE 2013b
Asked questions or contributed to course discussions in other ways
askquest
Prepared two or more drafts of a paper or assignment before turning it in
drafts
First-Year StudentsArts &
HumanitiesBio, Agric, & Nat Res
Phys Sci, Math, CS
Social Sciences Business
Comm, Media, PR Education
NSSE 2013 U.S. Grand Frequenciesa
Frequency Distributions by Related Major Category
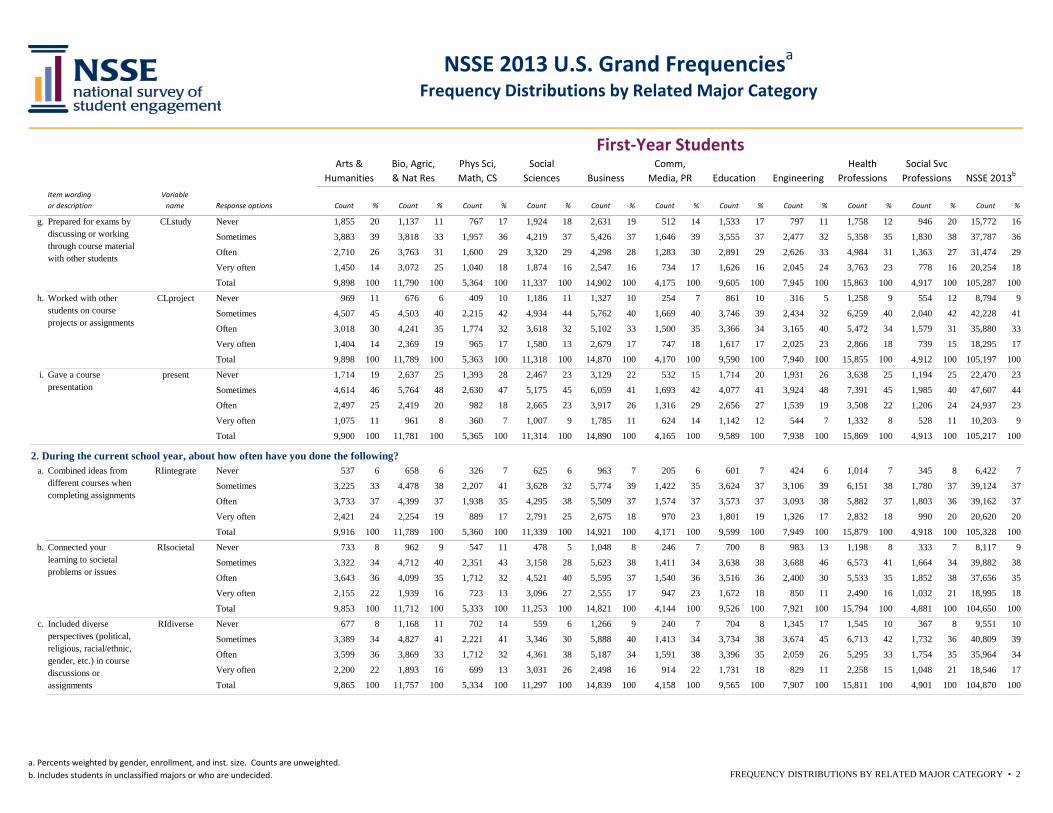
a. Percents weighted by gender, enrollment, and inst. size. Counts are unweighted.b. Includes students in unclassified majors or who are undecided. FREQUENCY DISTRIBUTIONS BY RELATED MAJOR CATEGORY • 2
Item wording or description
Variable name Response options Count % Count % Count % Count % Count % Count % Count % Count % Count % Count % Count %
Health Professions
Social Svc ProfessionsEngineering NSSE 2013b
First-Year StudentsArts &
HumanitiesBio, Agric, & Nat Res
Phys Sci, Math, CS
Social Sciences Business
Comm, Media, PR Education
NSSE 2013 U.S. Grand Frequenciesa
Frequency Distributions by Related Major Category
g. Never 1,855 20 1,137 11 767 17 1,924 18 2,631 19 512 14 1,533 17 797 11 1,758 12 946 20 15,772 16
Sometimes 3,883 39 3,818 33 1,957 36 4,219 37 5,426 37 1,646 39 3,555 37 2,477 32 5,358 35 1,830 38 37,787 36
Often 2,710 26 3,763 31 1,600 29 3,320 29 4,298 28 1,283 30 2,891 29 2,626 33 4,984 31 1,363 27 31,474 29
Very often 1,450 14 3,072 25 1,040 18 1,874 16 2,547 16 734 17 1,626 16 2,045 24 3,763 23 778 16 20,254 18
Total 9,898 100 11,790 100 5,364 100 11,337 100 14,902 100 4,175 100 9,605 100 7,945 100 15,863 100 4,917 100 105,287 100
h. Never 969 11 676 6 409 10 1,186 11 1,327 10 254 7 861 10 316 5 1,258 9 554 12 8,794 9
Sometimes 4,507 45 4,503 40 2,215 42 4,934 44 5,762 40 1,669 40 3,746 39 2,434 32 6,259 40 2,040 42 42,228 41
Often 3,018 30 4,241 35 1,774 32 3,618 32 5,102 33 1,500 35 3,366 34 3,165 40 5,472 34 1,579 31 35,880 33
Very often 1,404 14 2,369 19 965 17 1,580 13 2,679 17 747 18 1,617 17 2,025 23 2,866 18 739 15 18,295 17
Total 9,898 100 11,789 100 5,363 100 11,318 100 14,870 100 4,170 100 9,590 100 7,940 100 15,855 100 4,912 100 105,197 100
i. Never 1,714 19 2,637 25 1,393 28 2,467 23 3,129 22 532 15 1,714 20 1,931 26 3,638 25 1,194 25 22,470 23
Sometimes 4,614 46 5,764 48 2,630 47 5,175 45 6,059 41 1,693 42 4,077 41 3,924 48 7,391 45 1,985 40 47,607 44
Often 2,497 25 2,419 20 982 18 2,665 23 3,917 26 1,316 29 2,656 27 1,539 19 3,508 22 1,206 24 24,937 23
Very often 1,075 11 961 8 360 7 1,007 9 1,785 11 624 14 1,142 12 544 7 1,332 8 528 11 10,203 9
Total 9,900 100 11,781 100 5,365 100 11,314 100 14,890 100 4,165 100 9,589 100 7,938 100 15,869 100 4,913 100 105,217 100
2. During the current school year, about how often have you done the following?a. Never 537 6 658 6 326 7 625 6 963 7 205 6 601 7 424 6 1,014 7 345 8 6,422 7
Sometimes 3,225 33 4,478 38 2,207 41 3,628 32 5,774 39 1,422 35 3,624 37 3,106 39 6,151 38 1,780 37 39,124 37
Often 3,733 37 4,399 37 1,938 35 4,295 38 5,509 37 1,574 37 3,573 37 3,093 38 5,882 37 1,803 36 39,162 37
Very often 2,421 24 2,254 19 889 17 2,791 25 2,675 18 970 23 1,801 19 1,326 17 2,832 18 990 20 20,620 20
Total 9,916 100 11,789 100 5,360 100 11,339 100 14,921 100 4,171 100 9,599 100 7,949 100 15,879 100 4,918 100 105,328 100
b. Never 733 8 962 9 547 11 478 5 1,048 8 246 7 700 8 983 13 1,198 8 333 7 8,117 9
Sometimes 3,322 34 4,712 40 2,351 43 3,158 28 5,623 38 1,411 34 3,638 38 3,688 46 6,573 41 1,664 34 39,882 38
Often 3,643 36 4,099 35 1,712 32 4,521 40 5,595 37 1,540 36 3,516 36 2,400 30 5,533 35 1,852 38 37,656 35
Very often 2,155 22 1,939 16 723 13 3,096 27 2,555 17 947 23 1,672 18 850 11 2,490 16 1,032 21 18,995 18
Total 9,853 100 11,712 100 5,333 100 11,253 100 14,821 100 4,144 100 9,526 100 7,921 100 15,794 100 4,881 100 104,650 100
c. Never 677 8 1,168 11 702 14 559 6 1,266 9 240 7 704 8 1,345 17 1,545 10 367 8 9,551 10
Sometimes 3,389 34 4,827 41 2,221 41 3,346 30 5,888 40 1,413 34 3,734 38 3,674 45 6,713 42 1,732 36 40,809 39
Often 3,599 36 3,869 33 1,712 32 4,361 38 5,187 34 1,591 38 3,396 35 2,059 26 5,295 33 1,754 35 35,964 34
Very often 2,200 22 1,893 16 699 13 3,031 26 2,498 16 914 22 1,731 18 829 11 2,258 15 1,048 21 18,546 17
Total 9,865 100 11,757 100 5,334 100 11,297 100 14,839 100 4,158 100 9,565 100 7,907 100 15,811 100 4,901 100 104,870 100
Included diverse perspectives (political, religious, racial/ethnic, gender, etc.) in course discussions or assignments
RIdiverse
Gave a course presentation
present
Combined ideas from different courses when completing assignments
RIintegrate
Connected your learning to societal problems or issues
RIsocietal
Prepared for exams by discussing or working through course material with other students
CLstudy
Worked with other students on course projects or assignments
CLproject

a. Percents weighted by gender, enrollment, and inst. size. Counts are unweighted.b. Includes students in unclassified majors or who are undecided. FREQUENCY DISTRIBUTIONS BY RELATED MAJOR CATEGORY • 3
Item wording or description
Variable name Response options Count % Count % Count % Count % Count % Count % Count % Count % Count % Count % Count %
Health Professions
Social Svc ProfessionsEngineering NSSE 2013b
First-Year StudentsArts &
HumanitiesBio, Agric, & Nat Res
Phys Sci, Math, CS
Social Sciences Business
Comm, Media, PR Education
NSSE 2013 U.S. Grand Frequenciesa
Frequency Distributions by Related Major Category
d. Never 330 3 542 5 285 6 351 3 612 4 143 4 377 4 513 7 765 5 164 4 4,546 5
Sometimes 2,652 27 3,799 31 1,789 33 2,984 26 4,785 32 1,205 29 3,121 32 2,916 36 5,602 35 1,464 30 33,542 32
Often 4,307 43 4,997 43 2,220 41 4,950 43 6,486 44 1,821 43 4,150 43 3,242 41 6,653 42 2,156 43 44,954 43
Very often 2,585 26 2,408 21 1,050 20 3,006 27 2,944 20 979 24 1,903 21 1,237 16 2,801 18 1,117 24 21,815 21
Total 9,874 100 11,746 100 5,344 100 11,291 100 14,827 100 4,148 100 9,551 100 7,908 100 15,821 100 4,901 100 104,857 100
e. Never 253 3 429 4 240 5 203 2 505 4 96 3 316 4 415 5 545 4 142 3 3,539 4
Sometimes 2,396 24 3,491 29 1,612 30 2,603 23 4,516 31 1,148 28 2,975 30 2,704 34 5,155 32 1,378 28 30,958 30
Often 4,242 43 4,978 42 2,213 41 4,883 43 6,496 43 1,775 42 4,049 42 3,211 40 6,754 42 2,095 42 44,652 42
Very often 2,986 30 2,836 25 1,267 24 3,601 32 3,328 23 1,127 28 2,222 24 1,587 21 3,372 22 1,297 26 25,732 25
Total 9,877 100 11,734 100 5,332 100 11,290 100 14,845 100 4,146 100 9,562 100 7,917 100 15,826 100 4,912 100 104,881 100
f. Never 218 3 297 3 174 4 199 2 341 2 84 2 207 3 304 4 409 3 111 2 2,650 3
Sometimes 2,637 27 3,504 30 1,721 33 2,880 26 4,655 32 1,171 30 2,920 31 2,762 35 5,054 32 1,453 30 31,834 31
Often 4,166 42 5,047 43 2,198 40 4,753 42 6,404 43 1,817 43 4,120 42 3,269 41 6,814 43 2,062 41 44,608 42
Very often 2,844 28 2,889 24 1,243 23 3,443 30 3,404 23 1,067 25 2,303 24 1,571 20 3,523 22 1,264 26 25,640 24
Total 9,865 100 11,737 100 5,336 100 11,275 100 14,804 100 4,139 100 9,550 100 7,906 100 15,800 100 4,890 100 104,732 100
g. Never 109 1 143 1 77 2 78 1 183 1 48 1 99 1 125 2 190 1 49 1 1,253 1
Sometimes 1,471 16 2,083 18 1,048 21 1,720 16 3,159 22 713 19 1,921 21 1,794 23 3,434 22 1,021 22 20,487 20
Often 4,190 42 5,291 45 2,402 44 4,777 43 6,860 46 1,881 45 4,248 44 3,609 45 7,349 46 2,183 44 47,077 45
Very often 4,077 41 4,201 36 1,800 33 4,675 41 4,598 31 1,499 35 3,276 34 2,366 30 4,807 30 1,639 33 35,787 34
Total 9,847 100 11,718 100 5,327 100 11,250 100 14,800 100 4,141 100 9,544 100 7,894 100 15,780 100 4,892 100 104,604 100
3. During the current school year, about how often have you done the following?a. Never 2,008 21 2,032 19 1,230 26 2,442 23 3,576 25 802 20 1,425 16 2,015 27 2,803 19 988 21 21,673 22
Sometimes 4,584 46 5,554 47 2,542 46 5,395 47 6,660 45 1,924 46 4,278 44 3,795 47 7,418 46 2,185 45 48,777 46
Often 2,140 21 2,787 23 1,093 20 2,358 21 3,126 20 947 23 2,557 26 1,507 19 3,779 23 1,125 22 23,237 21
Very often 1,152 12 1,391 11 480 8 1,114 10 1,487 10 487 12 1,314 14 603 8 1,810 12 611 12 11,305 11
Total 9,884 100 11,764 100 5,345 100 11,309 100 14,849 100 4,160 100 9,574 100 7,920 100 15,810 100 4,909 100 104,992 100
b. Never 4,911 51 5,727 51 2,758 53 6,017 55 7,767 54 1,861 46 4,803 51 4,131 54 8,444 55 2,665 56 54,424 53
Sometimes 3,017 30 3,762 30 1,616 29 3,305 28 4,279 28 1,374 32 2,876 29 2,474 30 4,719 29 1,325 26 31,384 29
Often 1,241 12 1,499 13 635 12 1,274 11 1,820 12 580 14 1,229 13 945 12 1,761 11 566 11 12,534 12
Very often 699 7 739 6 323 6 670 6 940 6 339 8 640 7 356 5 844 6 340 7 6,374 6
Total 9,868 100 11,727 100 5,332 100 11,266 100 14,806 100 4,154 100 9,548 100 7,906 100 15,768 100 4,896 100 104,716 100
Worked with a faculty member on activities other than coursework (committees, student groups, etc.)
SFotherwork
Learned something that changed the way you understand an issue or concept
RInewview
Connected ideas from your courses to your prior experiences and knowledge
RIconnect
Talked about career plans with a faculty member
SFcareer
Examined the strengths and weaknesses of your own views on a topic or issue
RIownview
Tried to better understand someone else's views by imagining how an issue looks from his or her perspective
RIperspect
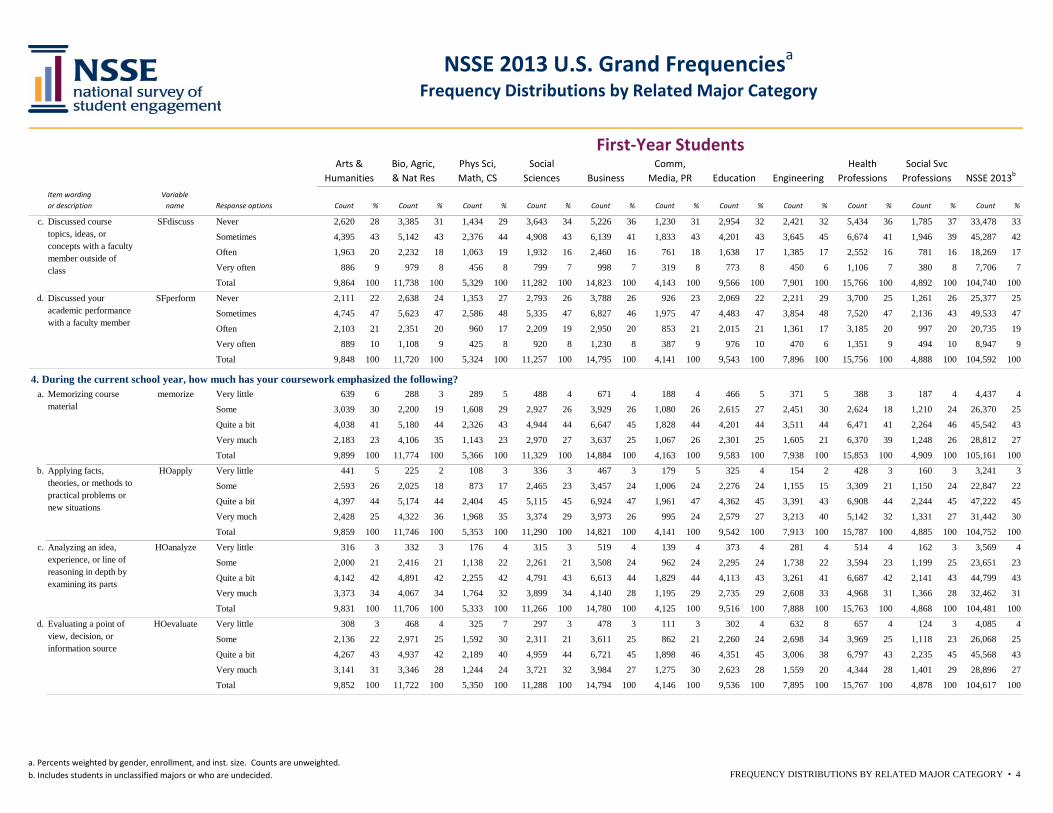
a. Percents weighted by gender, enrollment, and inst. size. Counts are unweighted.b. Includes students in unclassified majors or who are undecided. FREQUENCY DISTRIBUTIONS BY RELATED MAJOR CATEGORY • 4
Item wording or description
Variable name Response options Count % Count % Count % Count % Count % Count % Count % Count % Count % Count % Count %
Health Professions
Social Svc ProfessionsEngineering NSSE 2013b
First-Year StudentsArts &
HumanitiesBio, Agric, & Nat Res
Phys Sci, Math, CS
Social Sciences Business
Comm, Media, PR Education
NSSE 2013 U.S. Grand Frequenciesa
Frequency Distributions by Related Major Category
c. Never 2,620 28 3,385 31 1,434 29 3,643 34 5,226 36 1,230 31 2,954 32 2,421 32 5,434 36 1,785 37 33,478 33
Sometimes 4,395 43 5,142 43 2,376 44 4,908 43 6,139 41 1,833 43 4,201 43 3,645 45 6,674 41 1,946 39 45,287 42
Often 1,963 20 2,232 18 1,063 19 1,932 16 2,460 16 761 18 1,638 17 1,385 17 2,552 16 781 16 18,269 17
Very often 886 9 979 8 456 8 799 7 998 7 319 8 773 8 450 6 1,106 7 380 8 7,706 7
Total 9,864 100 11,738 100 5,329 100 11,282 100 14,823 100 4,143 100 9,566 100 7,901 100 15,766 100 4,892 100 104,740 100
d. Never 2,111 22 2,638 24 1,353 27 2,793 26 3,788 26 926 23 2,069 22 2,211 29 3,700 25 1,261 26 25,377 25
Sometimes 4,745 47 5,623 47 2,586 48 5,335 47 6,827 46 1,975 47 4,483 47 3,854 48 7,520 47 2,136 43 49,533 47
Often 2,103 21 2,351 20 960 17 2,209 19 2,950 20 853 21 2,015 21 1,361 17 3,185 20 997 20 20,735 19
Very often 889 10 1,108 9 425 8 920 8 1,230 8 387 9 976 10 470 6 1,351 9 494 10 8,947 9
Total 9,848 100 11,720 100 5,324 100 11,257 100 14,795 100 4,141 100 9,543 100 7,896 100 15,756 100 4,888 100 104,592 100
4. During the current school year, how much has your coursework emphasized the following?a. Very little 639 6 288 3 289 5 488 4 671 4 188 4 466 5 371 5 388 3 187 4 4,437 4
Some 3,039 30 2,200 19 1,608 29 2,927 26 3,929 26 1,080 26 2,615 27 2,451 30 2,624 18 1,210 24 26,370 25
Quite a bit 4,038 41 5,180 44 2,326 43 4,944 44 6,647 45 1,828 44 4,201 44 3,511 44 6,471 41 2,264 46 45,542 43
Very much 2,183 23 4,106 35 1,143 23 2,970 27 3,637 25 1,067 26 2,301 25 1,605 21 6,370 39 1,248 26 28,812 27
Total 9,899 100 11,774 100 5,366 100 11,329 100 14,884 100 4,163 100 9,583 100 7,938 100 15,853 100 4,909 100 105,161 100
b. Very little 441 5 225 2 108 3 336 3 467 3 179 5 325 4 154 2 428 3 160 3 3,241 3
Some 2,593 26 2,025 18 873 17 2,465 23 3,457 24 1,006 24 2,276 24 1,155 15 3,309 21 1,150 24 22,847 22
Quite a bit 4,397 44 5,174 44 2,404 45 5,115 45 6,924 47 1,961 47 4,362 45 3,391 43 6,908 44 2,244 45 47,222 45
Very much 2,428 25 4,322 36 1,968 35 3,374 29 3,973 26 995 24 2,579 27 3,213 40 5,142 32 1,331 27 31,442 30
Total 9,859 100 11,746 100 5,353 100 11,290 100 14,821 100 4,141 100 9,542 100 7,913 100 15,787 100 4,885 100 104,752 100
c. Very little 316 3 332 3 176 4 315 3 519 4 139 4 373 4 281 4 514 4 162 3 3,569 4
Some 2,000 21 2,416 21 1,138 22 2,261 21 3,508 24 962 24 2,295 24 1,738 22 3,594 23 1,199 25 23,651 23
Quite a bit 4,142 42 4,891 42 2,255 42 4,791 43 6,613 44 1,829 44 4,113 43 3,261 41 6,687 42 2,141 43 44,799 43
Very much 3,373 34 4,067 34 1,764 32 3,899 34 4,140 28 1,195 29 2,735 29 2,608 33 4,968 31 1,366 28 32,462 31
Total 9,831 100 11,706 100 5,333 100 11,266 100 14,780 100 4,125 100 9,516 100 7,888 100 15,763 100 4,868 100 104,481 100
d. Very little 308 3 468 4 325 7 297 3 478 3 111 3 302 4 632 8 657 4 124 3 4,085 4
Some 2,136 22 2,971 25 1,592 30 2,311 21 3,611 25 862 21 2,260 24 2,698 34 3,969 25 1,118 23 26,068 25
Quite a bit 4,267 43 4,937 42 2,189 40 4,959 44 6,721 45 1,898 46 4,351 45 3,006 38 6,797 43 2,235 45 45,568 43
Very much 3,141 31 3,346 28 1,244 24 3,721 32 3,984 27 1,275 30 2,623 28 1,559 20 4,344 28 1,401 29 28,896 27
Total 9,852 100 11,722 100 5,350 100 11,288 100 14,794 100 4,146 100 9,536 100 7,895 100 15,767 100 4,878 100 104,617 100
Evaluating a point of view, decision, or information source
HOevaluate
Memorizing course material
memorize
Applying facts, theories, or methods to practical problems or new situations
HOapply
Analyzing an idea, experience, or line of reasoning in depth by examining its parts
HOanalyze
Discussed course topics, ideas, or concepts with a faculty member outside of class
SFdiscuss
Discussed your academic performance with a faculty member
SFperform
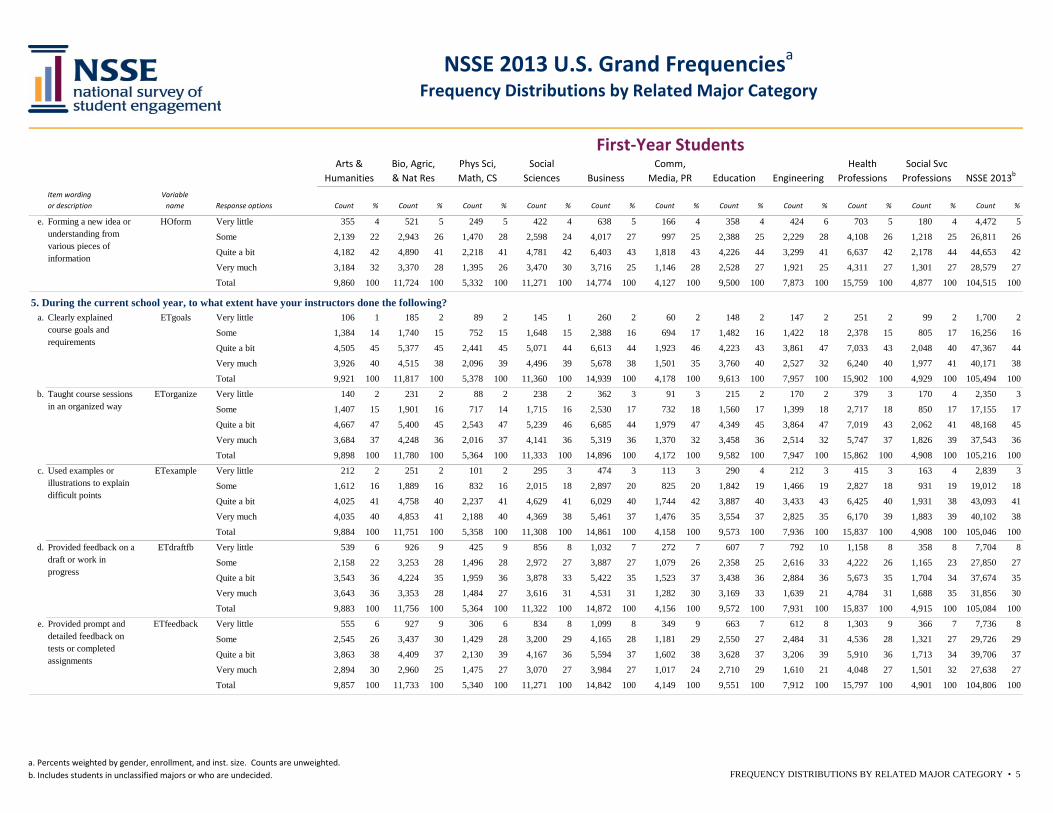
a. Percents weighted by gender, enrollment, and inst. size. Counts are unweighted.b. Includes students in unclassified majors or who are undecided. FREQUENCY DISTRIBUTIONS BY RELATED MAJOR CATEGORY • 5
Item wording or description
Variable name Response options Count % Count % Count % Count % Count % Count % Count % Count % Count % Count % Count %
Health Professions
Social Svc ProfessionsEngineering NSSE 2013b
First-Year StudentsArts &
HumanitiesBio, Agric, & Nat Res
Phys Sci, Math, CS
Social Sciences Business
Comm, Media, PR Education
NSSE 2013 U.S. Grand Frequenciesa
Frequency Distributions by Related Major Category
e. Very little 355 4 521 5 249 5 422 4 638 5 166 4 358 4 424 6 703 5 180 4 4,472 5
Some 2,139 22 2,943 26 1,470 28 2,598 24 4,017 27 997 25 2,388 25 2,229 28 4,108 26 1,218 25 26,811 26
Quite a bit 4,182 42 4,890 41 2,218 41 4,781 42 6,403 43 1,818 43 4,226 44 3,299 41 6,637 42 2,178 44 44,653 42
Very much 3,184 32 3,370 28 1,395 26 3,470 30 3,716 25 1,146 28 2,528 27 1,921 25 4,311 27 1,301 27 28,579 27
Total 9,860 100 11,724 100 5,332 100 11,271 100 14,774 100 4,127 100 9,500 100 7,873 100 15,759 100 4,877 100 104,515 100
5. During the current school year, to what extent have your instructors done the following?a. Very little 106 1 185 2 89 2 145 1 260 2 60 2 148 2 147 2 251 2 99 2 1,700 2
Some 1,384 14 1,740 15 752 15 1,648 15 2,388 16 694 17 1,482 16 1,422 18 2,378 15 805 17 16,256 16
Quite a bit 4,505 45 5,377 45 2,441 45 5,071 44 6,613 44 1,923 46 4,223 43 3,861 47 7,033 43 2,048 40 47,367 44
Very much 3,926 40 4,515 38 2,096 39 4,496 39 5,678 38 1,501 35 3,760 40 2,527 32 6,240 40 1,977 41 40,171 38
Total 9,921 100 11,817 100 5,378 100 11,360 100 14,939 100 4,178 100 9,613 100 7,957 100 15,902 100 4,929 100 105,494 100
b. Very little 140 2 231 2 88 2 238 2 362 3 91 3 215 2 170 2 379 3 170 4 2,350 3
Some 1,407 15 1,901 16 717 14 1,715 16 2,530 17 732 18 1,560 17 1,399 18 2,717 18 850 17 17,155 17
Quite a bit 4,667 47 5,400 45 2,543 47 5,239 46 6,685 44 1,979 47 4,349 45 3,864 47 7,019 43 2,062 41 48,168 45
Very much 3,684 37 4,248 36 2,016 37 4,141 36 5,319 36 1,370 32 3,458 36 2,514 32 5,747 37 1,826 39 37,543 36
Total 9,898 100 11,780 100 5,364 100 11,333 100 14,896 100 4,172 100 9,582 100 7,947 100 15,862 100 4,908 100 105,216 100
c. Very little 212 2 251 2 101 2 295 3 474 3 113 3 290 4 212 3 415 3 163 4 2,839 3
Some 1,612 16 1,889 16 832 16 2,015 18 2,897 20 825 20 1,842 19 1,466 19 2,827 18 931 19 19,012 18
Quite a bit 4,025 41 4,758 40 2,237 41 4,629 41 6,029 40 1,744 42 3,887 40 3,433 43 6,425 40 1,931 38 43,093 41
Very much 4,035 40 4,853 41 2,188 40 4,369 38 5,461 37 1,476 35 3,554 37 2,825 35 6,170 39 1,883 39 40,102 38
Total 9,884 100 11,751 100 5,358 100 11,308 100 14,861 100 4,158 100 9,573 100 7,936 100 15,837 100 4,908 100 105,046 100
d. Very little 539 6 926 9 425 9 856 8 1,032 7 272 7 607 7 792 10 1,158 8 358 8 7,704 8
Some 2,158 22 3,253 28 1,496 28 2,972 27 3,887 27 1,079 26 2,358 25 2,616 33 4,222 26 1,165 23 27,850 27
Quite a bit 3,543 36 4,224 35 1,959 36 3,878 33 5,422 35 1,523 37 3,438 36 2,884 36 5,673 35 1,704 34 37,674 35
Very much 3,643 36 3,353 28 1,484 27 3,616 31 4,531 31 1,282 30 3,169 33 1,639 21 4,784 31 1,688 35 31,856 30
Total 9,883 100 11,756 100 5,364 100 11,322 100 14,872 100 4,156 100 9,572 100 7,931 100 15,837 100 4,915 100 105,084 100
e. Very little 555 6 927 9 306 6 834 8 1,099 8 349 9 663 7 612 8 1,303 9 366 7 7,736 8
Some 2,545 26 3,437 30 1,429 28 3,200 29 4,165 28 1,181 29 2,550 27 2,484 31 4,536 28 1,321 27 29,726 29
Quite a bit 3,863 38 4,409 37 2,130 39 4,167 36 5,594 37 1,602 38 3,628 37 3,206 39 5,910 36 1,713 34 39,706 37
Very much 2,894 30 2,960 25 1,475 27 3,070 27 3,984 27 1,017 24 2,710 29 1,610 21 4,048 27 1,501 32 27,638 27
Total 9,857 100 11,733 100 5,340 100 11,271 100 14,842 100 4,149 100 9,551 100 7,912 100 15,797 100 4,901 100 104,806 100
Provided prompt and detailed feedback on tests or completed assignments
ETfeedback
Taught course sessions in an organized way
ETorganize
Used examples or illustrations to explain difficult points
ETexample
Provided feedback on a draft or work in progress
ETdraftfb
Forming a new idea or understanding from various pieces of information
HOform
Clearly explained course goals and requirements
ETgoals
a. Percents weighted by gender, enrollment, and inst. size. Counts are unweighted.b. Includes students in unclassified majors or who are undecided. FREQUENCY DISTRIBUTIONS BY RELATED MAJOR CATEGORY • 6
Item wording or description
Variable name Response options Count % Count % Count % Count % Count % Count % Count % Count % Count % Count % Count %
Health Professions
Social Svc ProfessionsEngineering NSSE 2013b
First-Year StudentsArts &
HumanitiesBio, Agric, & Nat Res
Phys Sci, Math, CS
Social Sciences Business
Comm, Media, PR Education
NSSE 2013 U.S. Grand Frequenciesa
Frequency Distributions by Related Major Category
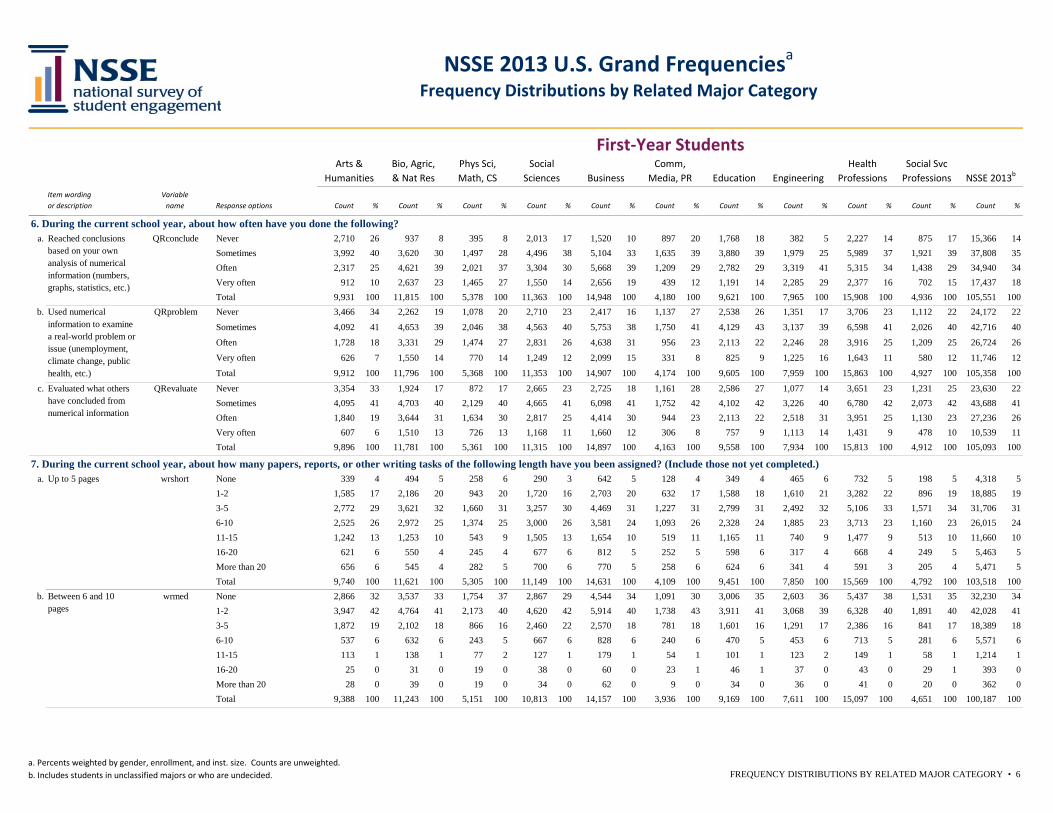
6. During the current school year, about how often have you done the following?a. Never 2,710 26 937 8 395 8 2,013 17 1,520 10 897 20 1,768 18 382 5 2,227 14 875 17 15,366 14
Sometimes 3,992 40 3,620 30 1,497 28 4,496 38 5,104 33 1,635 39 3,880 39 1,979 25 5,989 37 1,921 39 37,808 35Often 2,317 25 4,621 39 2,021 37 3,304 30 5,668 39 1,209 29 2,782 29 3,319 41 5,315 34 1,438 29 34,940 34Very often 912 10 2,637 23 1,465 27 1,550 14 2,656 19 439 12 1,191 14 2,285 29 2,377 16 702 15 17,437 18Total 9,931 100 11,815 100 5,378 100 11,363 100 14,948 100 4,180 100 9,621 100 7,965 100 15,908 100 4,936 100 105,551 100
b. Never 3,466 34 2,262 19 1,078 20 2,710 23 2,417 16 1,137 27 2,538 26 1,351 17 3,706 23 1,112 22 24,172 22
Sometimes 4,092 41 4,653 39 2,046 38 4,563 40 5,753 38 1,750 41 4,129 43 3,137 39 6,598 41 2,026 40 42,716 40
Often 1,728 18 3,331 29 1,474 27 2,831 26 4,638 31 956 23 2,113 22 2,246 28 3,916 25 1,209 25 26,724 26
Very often 626 7 1,550 14 770 14 1,249 12 2,099 15 331 8 825 9 1,225 16 1,643 11 580 12 11,746 12
Total 9,912 100 11,796 100 5,368 100 11,353 100 14,907 100 4,174 100 9,605 100 7,959 100 15,863 100 4,927 100 105,358 100
c. Never 3,354 33 1,924 17 872 17 2,665 23 2,725 18 1,161 28 2,586 27 1,077 14 3,651 23 1,231 25 23,630 22Sometimes 4,095 41 4,703 40 2,129 40 4,665 41 6,098 41 1,752 42 4,102 42 3,226 40 6,780 42 2,073 42 43,688 41Often 1,840 19 3,644 31 1,634 30 2,817 25 4,414 30 944 23 2,113 22 2,518 31 3,951 25 1,130 23 27,236 26Very often 607 6 1,510 13 726 13 1,168 11 1,660 12 306 8 757 9 1,113 14 1,431 9 478 10 10,539 11Total 9,896 100 11,781 100 5,361 100 11,315 100 14,897 100 4,163 100 9,558 100 7,934 100 15,813 100 4,912 100 105,093 100
7. During the current school year, about how many papers, reports, or other writing tasks of the following length have you been assigned? (Include those not yet completed.)a. None 339 4 494 5 258 6 290 3 642 5 128 4 349 4 465 6 732 5 198 5 4,318 5
1-2 1,585 17 2,186 20 943 20 1,720 16 2,703 20 632 17 1,588 18 1,610 21 3,282 22 896 19 18,885 193-5 2,772 29 3,621 32 1,660 31 3,257 30 4,469 31 1,227 31 2,799 31 2,492 32 5,106 33 1,571 34 31,706 316-10 2,525 26 2,972 25 1,374 25 3,000 26 3,581 24 1,093 26 2,328 24 1,885 23 3,713 23 1,160 23 26,015 2411-15 1,242 13 1,253 10 543 9 1,505 13 1,654 10 519 11 1,165 11 740 9 1,477 9 513 10 11,660 1016-20 621 6 550 4 245 4 677 6 812 5 252 5 598 6 317 4 668 4 249 5 5,463 5More than 20 656 6 545 4 282 5 700 6 770 5 258 6 624 6 341 4 591 3 205 4 5,471 5Total 9,740 100 11,621 100 5,305 100 11,149 100 14,631 100 4,109 100 9,451 100 7,850 100 15,569 100 4,792 100 103,518 100
b. None 2,866 32 3,537 33 1,754 37 2,867 29 4,544 34 1,091 30 3,006 35 2,603 36 5,437 38 1,531 35 32,230 341-2 3,947 42 4,764 41 2,173 40 4,620 42 5,914 40 1,738 43 3,911 41 3,068 39 6,328 40 1,891 40 42,028 413-5 1,872 19 2,102 18 866 16 2,460 22 2,570 18 781 18 1,601 16 1,291 17 2,386 16 841 17 18,389 186-10 537 6 632 6 243 5 667 6 828 6 240 6 470 5 453 6 713 5 281 6 5,571 611-15 113 1 138 1 77 2 127 1 179 1 54 1 101 1 123 2 149 1 58 1 1,214 116-20 25 0 31 0 19 0 38 0 60 0 23 1 46 1 37 0 43 0 29 1 393 0More than 20 28 0 39 0 19 0 34 0 62 0 9 0 34 0 36 0 41 0 20 0 362 0Total 9,388 100 11,243 100 5,151 100 10,813 100 14,157 100 3,936 100 9,169 100 7,611 100 15,097 100 4,651 100 100,187 100
Evaluated what others have concluded from numerical information
QRevaluate
Up to 5 pages wrshort
Between 6 and 10 pages
wrmed
Reached conclusions based on your own analysis of numerical information (numbers, graphs, statistics, etc.)
QRconclude
Used numerical information to examine a real-world problem or issue (unemployment, climate change, public health, etc.)
QRproblem
a. Percents weighted by gender, enrollment, and inst. size. Counts are unweighted.b. Includes students in unclassified majors or who are undecided. FREQUENCY DISTRIBUTIONS BY RELATED MAJOR CATEGORY • 7
Item wording or description
Variable name Response options Count % Count % Count % Count % Count % Count % Count % Count % Count % Count % Count %
Health Professions
Social Svc ProfessionsEngineering NSSE 2013b
First-Year StudentsArts &
HumanitiesBio, Agric, & Nat Res
Phys Sci, Math, CS
Social Sciences Business
Comm, Media, PR Education
NSSE 2013 U.S. Grand Frequenciesa
Frequency Distributions by Related Major Category
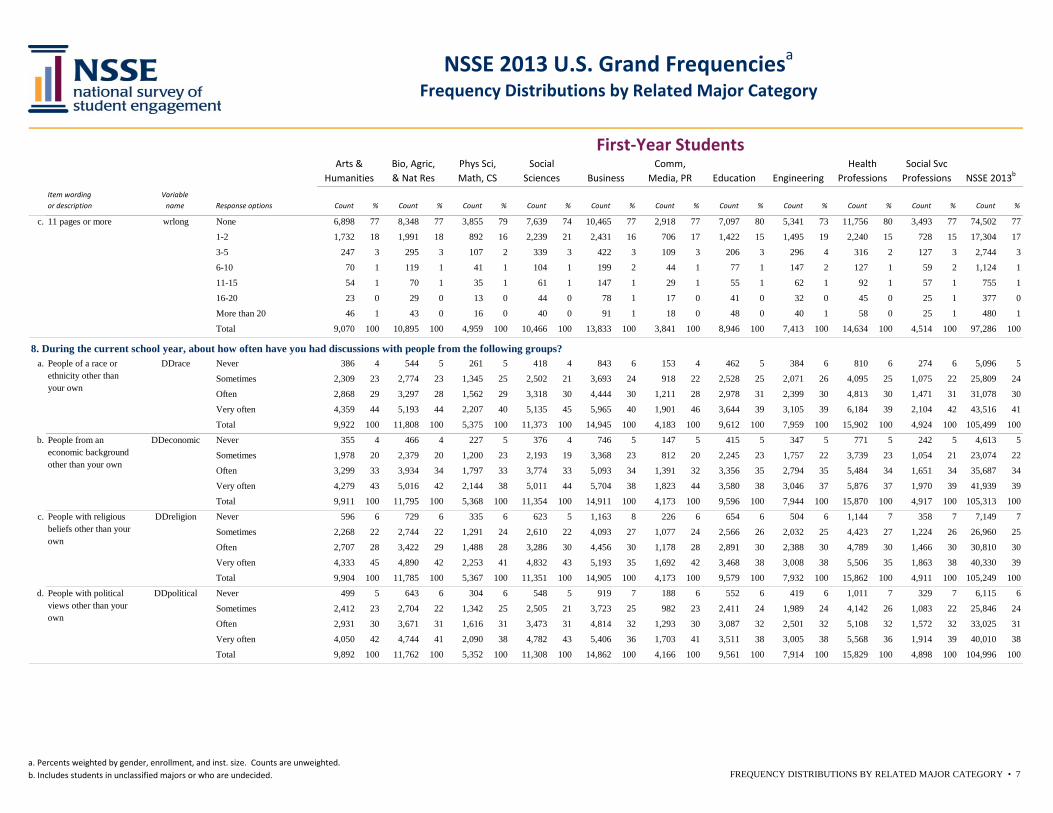
c. None 6,898 77 8,348 77 3,855 79 7,639 74 10,465 77 2,918 77 7,097 80 5,341 73 11,756 80 3,493 77 74,502 77
1-2 1,732 18 1,991 18 892 16 2,239 21 2,431 16 706 17 1,422 15 1,495 19 2,240 15 728 15 17,304 17
3-5 247 3 295 3 107 2 339 3 422 3 109 3 206 3 296 4 316 2 127 3 2,744 3
6-10 70 1 119 1 41 1 104 1 199 2 44 1 77 1 147 2 127 1 59 2 1,124 1
11-15 54 1 70 1 35 1 61 1 147 1 29 1 55 1 62 1 92 1 57 1 755 1
16-20 23 0 29 0 13 0 44 0 78 1 17 0 41 0 32 0 45 0 25 1 377 0
More than 20 46 1 43 0 16 0 40 0 91 1 18 0 48 0 40 1 58 0 25 1 480 1
Total 9,070 100 10,895 100 4,959 100 10,466 100 13,833 100 3,841 100 8,946 100 7,413 100 14,634 100 4,514 100 97,286 100
8. During the current school year, about how often have you had discussions with people from the following groups?a. Never 386 4 544 5 261 5 418 4 843 6 153 4 462 5 384 6 810 6 274 6 5,096 5
Sometimes 2,309 23 2,774 23 1,345 25 2,502 21 3,693 24 918 22 2,528 25 2,071 26 4,095 25 1,075 22 25,809 24
Often 2,868 29 3,297 28 1,562 29 3,318 30 4,444 30 1,211 28 2,978 31 2,399 30 4,813 30 1,471 31 31,078 30
Very often 4,359 44 5,193 44 2,207 40 5,135 45 5,965 40 1,901 46 3,644 39 3,105 39 6,184 39 2,104 42 43,516 41
Total 9,922 100 11,808 100 5,375 100 11,373 100 14,945 100 4,183 100 9,612 100 7,959 100 15,902 100 4,924 100 105,499 100
b. Never 355 4 466 4 227 5 376 4 746 5 147 5 415 5 347 5 771 5 242 5 4,613 5
Sometimes 1,978 20 2,379 20 1,200 23 2,193 19 3,368 23 812 20 2,245 23 1,757 22 3,739 23 1,054 21 23,074 22
Often 3,299 33 3,934 34 1,797 33 3,774 33 5,093 34 1,391 32 3,356 35 2,794 35 5,484 34 1,651 34 35,687 34
Very often 4,279 43 5,016 42 2,144 38 5,011 44 5,704 38 1,823 44 3,580 38 3,046 37 5,876 37 1,970 39 41,939 39
Total 9,911 100 11,795 100 5,368 100 11,354 100 14,911 100 4,173 100 9,596 100 7,944 100 15,870 100 4,917 100 105,313 100
c. Never 596 6 729 6 335 6 623 5 1,163 8 226 6 654 6 504 6 1,144 7 358 7 7,149 7
Sometimes 2,268 22 2,744 22 1,291 24 2,610 22 4,093 27 1,077 24 2,566 26 2,032 25 4,423 27 1,224 26 26,960 25
Often 2,707 28 3,422 29 1,488 28 3,286 30 4,456 30 1,178 28 2,891 30 2,388 30 4,789 30 1,466 30 30,810 30
Very often 4,333 45 4,890 42 2,253 41 4,832 43 5,193 35 1,692 42 3,468 38 3,008 38 5,506 35 1,863 38 40,330 39
Total 9,904 100 11,785 100 5,367 100 11,351 100 14,905 100 4,173 100 9,579 100 7,932 100 15,862 100 4,911 100 105,249 100
d. Never 499 5 643 6 304 6 548 5 919 7 188 6 552 6 419 6 1,011 7 329 7 6,115 6
Sometimes 2,412 23 2,704 22 1,342 25 2,505 21 3,723 25 982 23 2,411 24 1,989 24 4,142 26 1,083 22 25,846 24
Often 2,931 30 3,671 31 1,616 31 3,473 31 4,814 32 1,293 30 3,087 32 2,501 32 5,108 32 1,572 32 33,025 31
Very often 4,050 42 4,744 41 2,090 38 4,782 43 5,406 36 1,703 41 3,511 38 3,005 38 5,568 36 1,914 39 40,010 38
Total 9,892 100 11,762 100 5,352 100 11,308 100 14,862 100 4,166 100 9,561 100 7,914 100 15,829 100 4,898 100 104,996 100
People with religious beliefs other than your own
DDreligion
People with political views other than your own
DDpolitical
11 pages or more wrlong
People of a race or ethnicity other than your own
DDrace
People from an economic background other than your own
DDeconomic
a. Percents weighted by gender, enrollment, and inst. size. Counts are unweighted.b. Includes students in unclassified majors or who are undecided. FREQUENCY DISTRIBUTIONS BY RELATED MAJOR CATEGORY • 8
Item wording or description
Variable name Response options Count % Count % Count % Count % Count % Count % Count % Count % Count % Count % Count %
Health Professions
Social Svc ProfessionsEngineering NSSE 2013b
First-Year StudentsArts &
HumanitiesBio, Agric, & Nat Res
Phys Sci, Math, CS
Social Sciences Business
Comm, Media, PR Education
NSSE 2013 U.S. Grand Frequenciesa
Frequency Distributions by Related Major Category
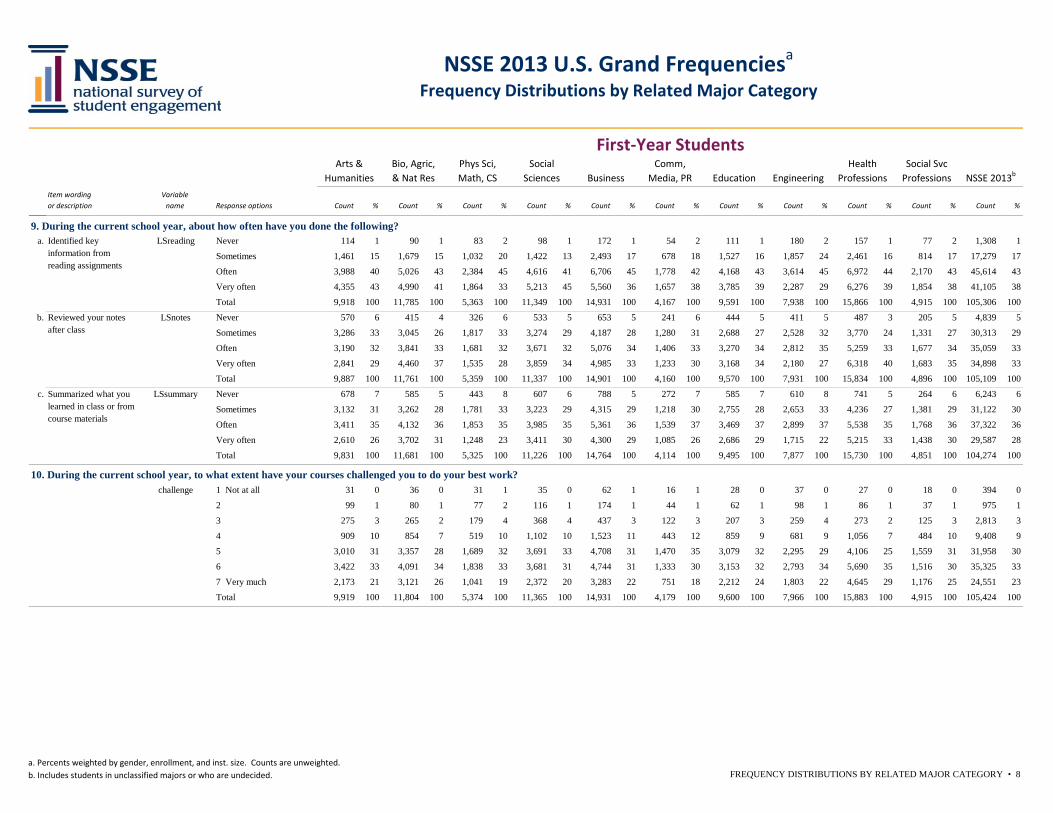
9. During the current school year, about how often have you done the following?a. Never 114 1 90 1 83 2 98 1 172 1 54 2 111 1 180 2 157 1 77 2 1,308 1
Sometimes 1,461 15 1,679 15 1,032 20 1,422 13 2,493 17 678 18 1,527 16 1,857 24 2,461 16 814 17 17,279 17
Often 3,988 40 5,026 43 2,384 45 4,616 41 6,706 45 1,778 42 4,168 43 3,614 45 6,972 44 2,170 43 45,614 43
Very often 4,355 43 4,990 41 1,864 33 5,213 45 5,560 36 1,657 38 3,785 39 2,287 29 6,276 39 1,854 38 41,105 38
Total 9,918 100 11,785 100 5,363 100 11,349 100 14,931 100 4,167 100 9,591 100 7,938 100 15,866 100 4,915 100 105,306 100
b. Never 570 6 415 4 326 6 533 5 653 5 241 6 444 5 411 5 487 3 205 5 4,839 5
Sometimes 3,286 33 3,045 26 1,817 33 3,274 29 4,187 28 1,280 31 2,688 27 2,528 32 3,770 24 1,331 27 30,313 29
Often 3,190 32 3,841 33 1,681 32 3,671 32 5,076 34 1,406 33 3,270 34 2,812 35 5,259 33 1,677 34 35,059 33
Very often 2,841 29 4,460 37 1,535 28 3,859 34 4,985 33 1,233 30 3,168 34 2,180 27 6,318 40 1,683 35 34,898 33
Total 9,887 100 11,761 100 5,359 100 11,337 100 14,901 100 4,160 100 9,570 100 7,931 100 15,834 100 4,896 100 105,109 100
c. Never 678 7 585 5 443 8 607 6 788 5 272 7 585 7 610 8 741 5 264 6 6,243 6
Sometimes 3,132 31 3,262 28 1,781 33 3,223 29 4,315 29 1,218 30 2,755 28 2,653 33 4,236 27 1,381 29 31,122 30
Often 3,411 35 4,132 36 1,853 35 3,985 35 5,361 36 1,539 37 3,469 37 2,899 37 5,538 35 1,768 36 37,322 36
Very often 2,610 26 3,702 31 1,248 23 3,411 30 4,300 29 1,085 26 2,686 29 1,715 22 5,215 33 1,438 30 29,587 28
Total 9,831 100 11,681 100 5,325 100 11,226 100 14,764 100 4,114 100 9,495 100 7,877 100 15,730 100 4,851 100 104,274 100
1 Not at all 31 0 36 0 31 1 35 0 62 1 16 1 28 0 37 0 27 0 18 0 394 0
2 99 1 80 1 77 2 116 1 174 1 44 1 62 1 98 1 86 1 37 1 975 1
3 275 3 265 2 179 4 368 4 437 3 122 3 207 3 259 4 273 2 125 3 2,813 3
4 909 10 854 7 519 10 1,102 10 1,523 11 443 12 859 9 681 9 1,056 7 484 10 9,408 9
5 3,010 31 3,357 28 1,689 32 3,691 33 4,708 31 1,470 35 3,079 32 2,295 29 4,106 25 1,559 31 31,958 30
6 3,422 33 4,091 34 1,838 33 3,681 31 4,744 31 1,333 30 3,153 32 2,793 34 5,690 35 1,516 30 35,325 33
7 Very much 2,173 21 3,121 26 1,041 19 2,372 20 3,283 22 751 18 2,212 24 1,803 22 4,645 29 1,176 25 24,551 23
Total 9,919 100 11,804 100 5,374 100 11,365 100 14,931 100 4,179 100 9,600 100 7,966 100 15,883 100 4,915 100 105,424 100
Reviewed your notes after class
LSnotes
Summarized what you learned in class or from course materials
LSsummary
10. During the current school year, to what extent have your courses challenged you to do your best work?challenge
Identified key information from reading assignments
LSreading
a. Percents weighted by gender, enrollment, and inst. size. Counts are unweighted.b. Includes students in unclassified majors or who are undecided. FREQUENCY DISTRIBUTIONS BY RELATED MAJOR CATEGORY • 9
Item wording or description
Variable name Response options Count % Count % Count % Count % Count % Count % Count % Count % Count % Count % Count %
Health Professions
Social Svc ProfessionsEngineering NSSE 2013b
First-Year StudentsArts &
HumanitiesBio, Agric, & Nat Res
Phys Sci, Math, CS
Social Sciences Business
Comm, Media, PR Education
NSSE 2013 U.S. Grand Frequenciesa
Frequency Distributions by Related Major Category
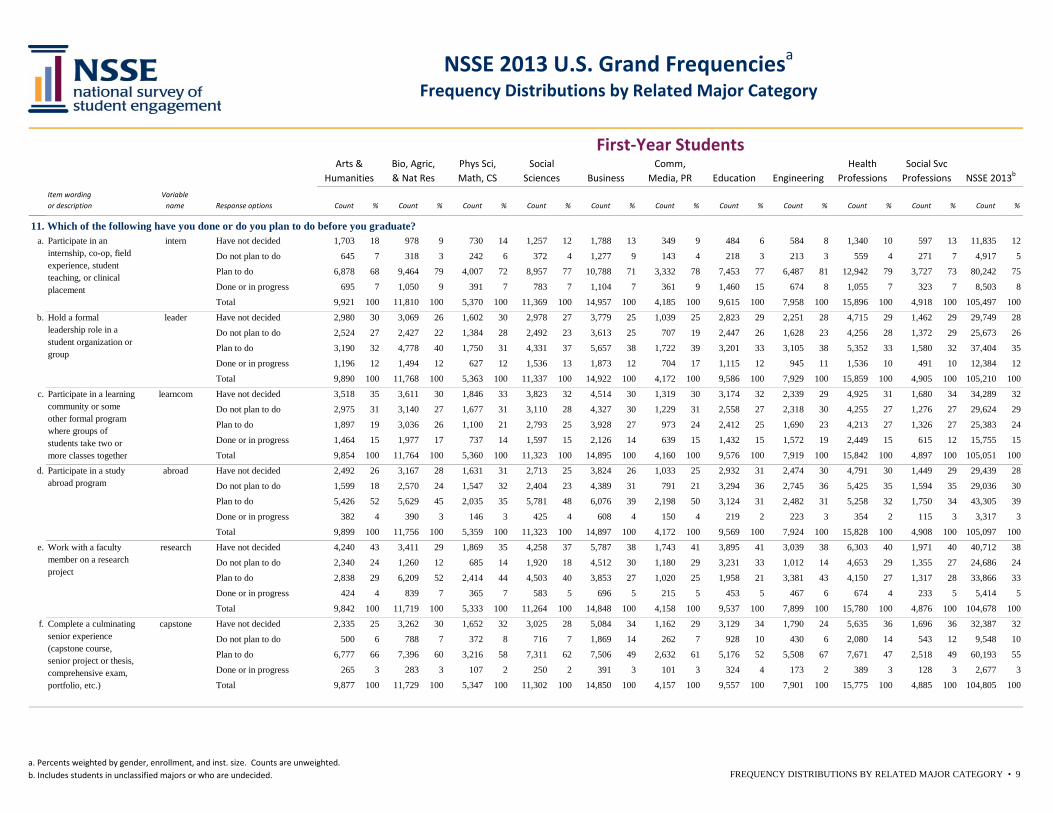
11. Which of the following have you done or do you plan to do before you graduate?a. Have not decided 1,703 18 978 9 730 14 1,257 12 1,788 13 349 9 484 6 584 8 1,340 10 597 13 11,835 12
Do not plan to do 645 7 318 3 242 6 372 4 1,277 9 143 4 218 3 213 3 559 4 271 7 4,917 5
Plan to do 6,878 68 9,464 79 4,007 72 8,957 77 10,788 71 3,332 78 7,453 77 6,487 81 12,942 79 3,727 73 80,242 75
Done or in progress 695 7 1,050 9 391 7 783 7 1,104 7 361 9 1,460 15 674 8 1,055 7 323 7 8,503 8
Total 9,921 100 11,810 100 5,370 100 11,369 100 14,957 100 4,185 100 9,615 100 7,958 100 15,896 100 4,918 100 105,497 100
b. Have not decided 2,980 30 3,069 26 1,602 30 2,978 27 3,779 25 1,039 25 2,823 29 2,251 28 4,715 29 1,462 29 29,749 28
Do not plan to do 2,524 27 2,427 22 1,384 28 2,492 23 3,613 25 707 19 2,447 26 1,628 23 4,256 28 1,372 29 25,673 26
Plan to do 3,190 32 4,778 40 1,750 31 4,331 37 5,657 38 1,722 39 3,201 33 3,105 38 5,352 33 1,580 32 37,404 35
Done or in progress 1,196 12 1,494 12 627 12 1,536 13 1,873 12 704 17 1,115 12 945 11 1,536 10 491 10 12,384 12
Total 9,890 100 11,768 100 5,363 100 11,337 100 14,922 100 4,172 100 9,586 100 7,929 100 15,859 100 4,905 100 105,210 100
c. Have not decided 3,518 35 3,611 30 1,846 33 3,823 32 4,514 30 1,319 30 3,174 32 2,339 29 4,925 31 1,680 34 34,289 32
Do not plan to do 2,975 31 3,140 27 1,677 31 3,110 28 4,327 30 1,229 31 2,558 27 2,318 30 4,255 27 1,276 27 29,624 29
Plan to do 1,897 19 3,036 26 1,100 21 2,793 25 3,928 27 973 24 2,412 25 1,690 23 4,213 27 1,326 27 25,383 24
Done or in progress 1,464 15 1,977 17 737 14 1,597 15 2,126 14 639 15 1,432 15 1,572 19 2,449 15 615 12 15,755 15
Total 9,854 100 11,764 100 5,360 100 11,323 100 14,895 100 4,160 100 9,576 100 7,919 100 15,842 100 4,897 100 105,051 100
d. Have not decided 2,492 26 3,167 28 1,631 31 2,713 25 3,824 26 1,033 25 2,932 31 2,474 30 4,791 30 1,449 29 29,439 28
Do not plan to do 1,599 18 2,570 24 1,547 32 2,404 23 4,389 31 791 21 3,294 36 2,745 36 5,425 35 1,594 35 29,036 30
Plan to do 5,426 52 5,629 45 2,035 35 5,781 48 6,076 39 2,198 50 3,124 31 2,482 31 5,258 32 1,750 34 43,305 39
Done or in progress 382 4 390 3 146 3 425 4 608 4 150 4 219 2 223 3 354 2 115 3 3,317 3
Total 9,899 100 11,756 100 5,359 100 11,323 100 14,897 100 4,172 100 9,569 100 7,924 100 15,828 100 4,908 100 105,097 100
e. Have not decided 4,240 43 3,411 29 1,869 35 4,258 37 5,787 38 1,743 41 3,895 41 3,039 38 6,303 40 1,971 40 40,712 38
Do not plan to do 2,340 24 1,260 12 685 14 1,920 18 4,512 30 1,180 29 3,231 33 1,012 14 4,653 29 1,355 27 24,686 24
Plan to do 2,838 29 6,209 52 2,414 44 4,503 40 3,853 27 1,020 25 1,958 21 3,381 43 4,150 27 1,317 28 33,866 33
Done or in progress 424 4 839 7 365 7 583 5 696 5 215 5 453 5 467 6 674 4 233 5 5,414 5
Total 9,842 100 11,719 100 5,333 100 11,264 100 14,848 100 4,158 100 9,537 100 7,899 100 15,780 100 4,876 100 104,678 100
f. Have not decided 2,335 25 3,262 30 1,652 32 3,025 28 5,084 34 1,162 29 3,129 34 1,790 24 5,635 36 1,696 36 32,387 32
Do not plan to do 500 6 788 7 372 8 716 7 1,869 14 262 7 928 10 430 6 2,080 14 543 12 9,548 10
Plan to do 6,777 66 7,396 60 3,216 58 7,311 62 7,506 49 2,632 61 5,176 52 5,508 67 7,671 47 2,518 49 60,193 55
Done or in progress 265 3 283 3 107 2 250 2 391 3 101 3 324 4 173 2 389 3 128 3 2,677 3
Total 9,877 100 11,729 100 5,347 100 11,302 100 14,850 100 4,157 100 9,557 100 7,901 100 15,775 100 4,885 100 104,805 100
Participate in a study abroad program
abroad
Work with a faculty member on a research project
research
Complete a culminating senior experience (capstone course, senior project or thesis, comprehensive exam, portfolio, etc.)
capstone
Participate in an internship, co-op, field experience, student teaching, or clinical placement
intern
Hold a formal leadership role in a student organization or group
leader
Participate in a learning community or some other formal program where groups of students take two or more classes together
learncom
a. Percents weighted by gender, enrollment, and inst. size. Counts are unweighted.b. Includes students in unclassified majors or who are undecided. FREQUENCY DISTRIBUTIONS BY RELATED MAJOR CATEGORY • 10
Item wording or description
Variable name Response options Count % Count % Count % Count % Count % Count % Count % Count % Count % Count % Count %
Health Professions
Social Svc ProfessionsEngineering NSSE 2013b
First-Year StudentsArts &
HumanitiesBio, Agric, & Nat Res
Phys Sci, Math, CS
Social Sciences Business
Comm, Media, PR Education
NSSE 2013 U.S. Grand Frequenciesa
Frequency Distributions by Related Major Category
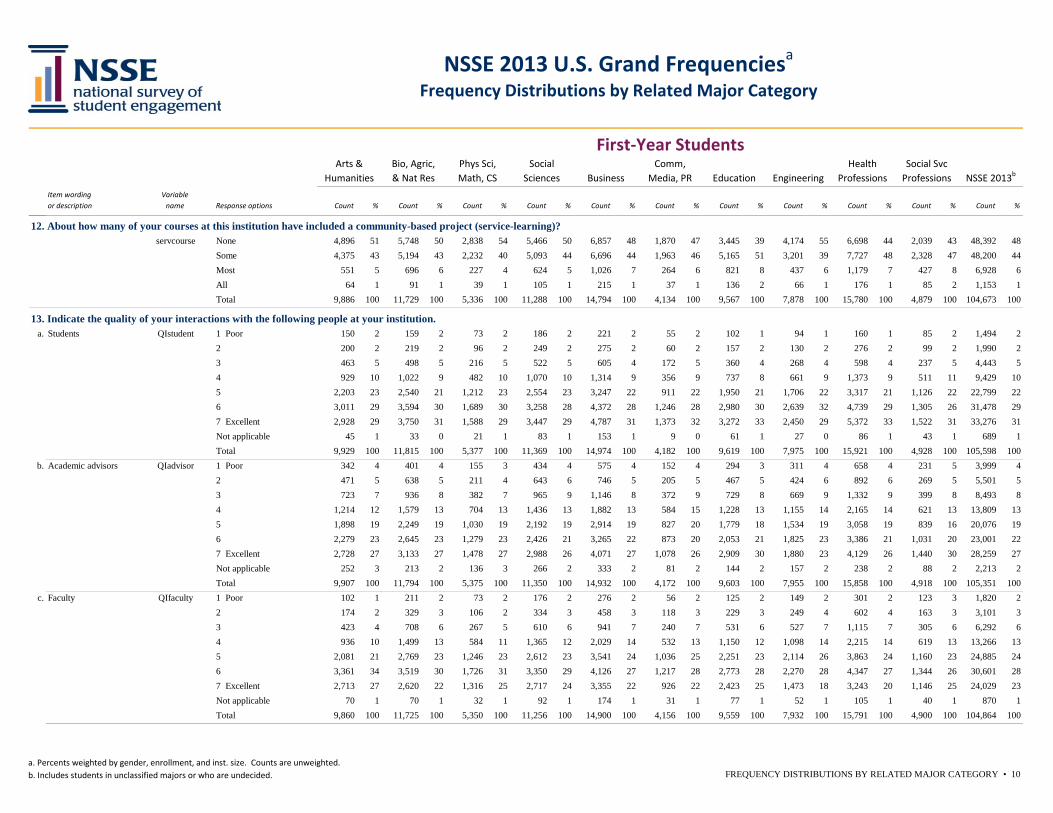
12. About how many of your courses at this institution have included a community-based project (service-learning)?None 4,896 51 5,748 50 2,838 54 5,466 50 6,857 48 1,870 47 3,445 39 4,174 55 6,698 44 2,039 43 48,392 48Some 4,375 43 5,194 43 2,232 40 5,093 44 6,696 44 1,963 46 5,165 51 3,201 39 7,727 48 2,328 47 48,200 44Most 551 5 696 6 227 4 624 5 1,026 7 264 6 821 8 437 6 1,179 7 427 8 6,928 6All 64 1 91 1 39 1 105 1 215 1 37 1 136 2 66 1 176 1 85 2 1,153 1Total 9,886 100 11,729 100 5,336 100 11,288 100 14,794 100 4,134 100 9,567 100 7,878 100 15,780 100 4,879 100 104,673 100
13. Indicate the quality of your interactions with the following people at your institution.a. 1 Poor 150 2 159 2 73 2 186 2 221 2 55 2 102 1 94 1 160 1 85 2 1,494 2
2 200 2 219 2 96 2 249 2 275 2 60 2 157 2 130 2 276 2 99 2 1,990 23 463 5 498 5 216 5 522 5 605 4 172 5 360 4 268 4 598 4 237 5 4,443 54 929 10 1,022 9 482 10 1,070 10 1,314 9 356 9 737 8 661 9 1,373 9 511 11 9,429 105 2,203 23 2,540 21 1,212 23 2,554 23 3,247 22 911 22 1,950 21 1,706 22 3,317 21 1,126 22 22,799 226 3,011 29 3,594 30 1,689 30 3,258 28 4,372 28 1,246 28 2,980 30 2,639 32 4,739 29 1,305 26 31,478 297 Excellent 2,928 29 3,750 31 1,588 29 3,447 29 4,787 31 1,373 32 3,272 33 2,450 29 5,372 33 1,522 31 33,276 31Not applicable 45 1 33 0 21 1 83 1 153 1 9 0 61 1 27 0 86 1 43 1 689 1Total 9,929 100 11,815 100 5,377 100 11,369 100 14,974 100 4,182 100 9,619 100 7,975 100 15,921 100 4,928 100 105,598 100
b. 1 Poor 342 4 401 4 155 3 434 4 575 4 152 4 294 3 311 4 658 4 231 5 3,999 42 471 5 638 5 211 4 643 6 746 5 205 5 467 5 424 6 892 6 269 5 5,501 53 723 7 936 8 382 7 965 9 1,146 8 372 9 729 8 669 9 1,332 9 399 8 8,493 84 1,214 12 1,579 13 704 13 1,436 13 1,882 13 584 15 1,228 13 1,155 14 2,165 14 621 13 13,809 135 1,898 19 2,249 19 1,030 19 2,192 19 2,914 19 827 20 1,779 18 1,534 19 3,058 19 839 16 20,076 196 2,279 23 2,645 23 1,279 23 2,426 21 3,265 22 873 20 2,053 21 1,825 23 3,386 21 1,031 20 23,001 227 Excellent 2,728 27 3,133 27 1,478 27 2,988 26 4,071 27 1,078 26 2,909 30 1,880 23 4,129 26 1,440 30 28,259 27Not applicable 252 3 213 2 136 3 266 2 333 2 81 2 144 2 157 2 238 2 88 2 2,213 2Total 9,907 100 11,794 100 5,375 100 11,350 100 14,932 100 4,172 100 9,603 100 7,955 100 15,858 100 4,918 100 105,351 100
c. 1 Poor 102 1 211 2 73 2 176 2 276 2 56 2 125 2 149 2 301 2 123 3 1,820 22 174 2 329 3 106 2 334 3 458 3 118 3 229 3 249 4 602 4 163 3 3,101 33 423 4 708 6 267 5 610 6 941 7 240 7 531 6 527 7 1,115 7 305 6 6,292 64 936 10 1,499 13 584 11 1,365 12 2,029 14 532 13 1,150 12 1,098 14 2,215 14 619 13 13,266 135 2,081 21 2,769 23 1,246 23 2,612 23 3,541 24 1,036 25 2,251 23 2,114 26 3,863 24 1,160 23 24,885 246 3,361 34 3,519 30 1,726 31 3,350 29 4,126 27 1,217 28 2,773 28 2,270 28 4,347 27 1,344 26 30,601 287 Excellent 2,713 27 2,620 22 1,316 25 2,717 24 3,355 22 926 22 2,423 25 1,473 18 3,243 20 1,146 25 24,029 23Not applicable 70 1 70 1 32 1 92 1 174 1 31 1 77 1 52 1 105 1 40 1 870 1Total 9,860 100 11,725 100 5,350 100 11,256 100 14,900 100 4,156 100 9,559 100 7,932 100 15,791 100 4,900 100 104,864 100
Faculty QIfaculty
servcourse
Students QIstudent
Academic advisors QIadvisor
a. Percents weighted by gender, enrollment, and inst. size. Counts are unweighted.b. Includes students in unclassified majors or who are undecided. FREQUENCY DISTRIBUTIONS BY RELATED MAJOR CATEGORY • 11
Item wording or description
Variable name Response options Count % Count % Count % Count % Count % Count % Count % Count % Count % Count % Count %
Health Professions
Social Svc ProfessionsEngineering NSSE 2013b
First-Year StudentsArts &
HumanitiesBio, Agric, & Nat Res
Phys Sci, Math, CS
Social Sciences Business
Comm, Media, PR Education
NSSE 2013 U.S. Grand Frequenciesa
Frequency Distributions by Related Major Category
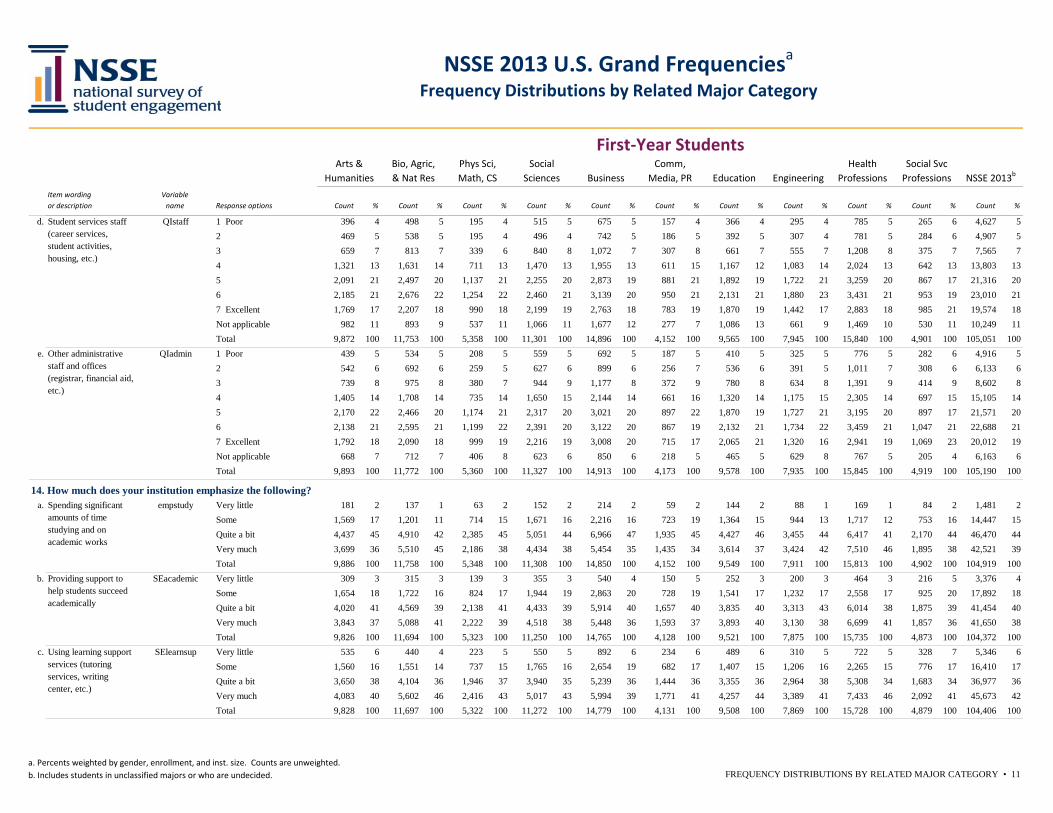
d. 1 Poor 396 4 498 5 195 4 515 5 675 5 157 4 366 4 295 4 785 5 265 6 4,627 52 469 5 538 5 195 4 496 4 742 5 186 5 392 5 307 4 781 5 284 6 4,907 53 659 7 813 7 339 6 840 8 1,072 7 307 8 661 7 555 7 1,208 8 375 7 7,565 74 1,321 13 1,631 14 711 13 1,470 13 1,955 13 611 15 1,167 12 1,083 14 2,024 13 642 13 13,803 135 2,091 21 2,497 20 1,137 21 2,255 20 2,873 19 881 21 1,892 19 1,722 21 3,259 20 867 17 21,316 206 2,185 21 2,676 22 1,254 22 2,460 21 3,139 20 950 21 2,131 21 1,880 23 3,431 21 953 19 23,010 217 Excellent 1,769 17 2,207 18 990 18 2,199 19 2,763 18 783 19 1,870 19 1,442 17 2,883 18 985 21 19,574 18Not applicable 982 11 893 9 537 11 1,066 11 1,677 12 277 7 1,086 13 661 9 1,469 10 530 11 10,249 11Total 9,872 100 11,753 100 5,358 100 11,301 100 14,896 100 4,152 100 9,565 100 7,945 100 15,840 100 4,901 100 105,051 100
e. 1 Poor 439 5 534 5 208 5 559 5 692 5 187 5 410 5 325 5 776 5 282 6 4,916 52 542 6 692 6 259 5 627 6 899 6 256 7 536 6 391 5 1,011 7 308 6 6,133 63 739 8 975 8 380 7 944 9 1,177 8 372 9 780 8 634 8 1,391 9 414 9 8,602 84 1,405 14 1,708 14 735 14 1,650 15 2,144 14 661 16 1,320 14 1,175 15 2,305 14 697 15 15,105 145 2,170 22 2,466 20 1,174 21 2,317 20 3,021 20 897 22 1,870 19 1,727 21 3,195 20 897 17 21,571 206 2,138 21 2,595 21 1,199 22 2,391 20 3,122 20 867 19 2,132 21 1,734 22 3,459 21 1,047 21 22,688 217 Excellent 1,792 18 2,090 18 999 19 2,216 19 3,008 20 715 17 2,065 21 1,320 16 2,941 19 1,069 23 20,012 19Not applicable 668 7 712 7 406 8 623 6 850 6 218 5 465 5 629 8 767 5 205 4 6,163 6Total 9,893 100 11,772 100 5,360 100 11,327 100 14,913 100 4,173 100 9,578 100 7,935 100 15,845 100 4,919 100 105,190 100
14. How much does your institution emphasize the following? a. Very little 181 2 137 1 63 2 152 2 214 2 59 2 144 2 88 1 169 1 84 2 1,481 2
Some 1,569 17 1,201 11 714 15 1,671 16 2,216 16 723 19 1,364 15 944 13 1,717 12 753 16 14,447 15Quite a bit 4,437 45 4,910 42 2,385 45 5,051 44 6,966 47 1,935 45 4,427 46 3,455 44 6,417 41 2,170 44 46,470 44Very much 3,699 36 5,510 45 2,186 38 4,434 38 5,454 35 1,435 34 3,614 37 3,424 42 7,510 46 1,895 38 42,521 39Total 9,886 100 11,758 100 5,348 100 11,308 100 14,850 100 4,152 100 9,549 100 7,911 100 15,813 100 4,902 100 104,919 100
b. Very little 309 3 315 3 139 3 355 3 540 4 150 5 252 3 200 3 464 3 216 5 3,376 4Some 1,654 18 1,722 16 824 17 1,944 19 2,863 20 728 19 1,541 17 1,232 17 2,558 17 925 20 17,892 18Quite a bit 4,020 41 4,569 39 2,138 41 4,433 39 5,914 40 1,657 40 3,835 40 3,313 43 6,014 38 1,875 39 41,454 40Very much 3,843 37 5,088 41 2,222 39 4,518 38 5,448 36 1,593 37 3,893 40 3,130 38 6,699 41 1,857 36 41,650 38Total 9,826 100 11,694 100 5,323 100 11,250 100 14,765 100 4,128 100 9,521 100 7,875 100 15,735 100 4,873 100 104,372 100
c. Very little 535 6 440 4 223 5 550 5 892 6 234 6 489 6 310 5 722 5 328 7 5,346 6Some 1,560 16 1,551 14 737 15 1,765 16 2,654 19 682 17 1,407 15 1,206 16 2,265 15 776 17 16,410 17Quite a bit 3,650 38 4,104 36 1,946 37 3,940 35 5,239 36 1,444 36 3,355 36 2,964 38 5,308 34 1,683 34 36,977 36Very much 4,083 40 5,602 46 2,416 43 5,017 43 5,994 39 1,771 41 4,257 44 3,389 41 7,433 46 2,092 41 45,673 42Total 9,828 100 11,697 100 5,322 100 11,272 100 14,779 100 4,131 100 9,508 100 7,869 100 15,728 100 4,879 100 104,406 100
Spending significant amounts of time studying and on academic works
empstudy
Providing support to help students succeed academically
SEacademic
Using learning support services (tutoring services, writing center, etc.)
SElearnsup
Student services staff (career services, student activities, housing, etc.)
QIstaff
Other administrative staff and offices (registrar, financial aid, etc.)
QIadmin
a. Percents weighted by gender, enrollment, and inst. size. Counts are unweighted.b. Includes students in unclassified majors or who are undecided. FREQUENCY DISTRIBUTIONS BY RELATED MAJOR CATEGORY • 12
Item wording or description
Variable name Response options Count % Count % Count % Count % Count % Count % Count % Count % Count % Count % Count %
Health Professions
Social Svc ProfessionsEngineering NSSE 2013b
First-Year StudentsArts &
HumanitiesBio, Agric, & Nat Res
Phys Sci, Math, CS
Social Sciences Business
Comm, Media, PR Education
NSSE 2013 U.S. Grand Frequenciesa
Frequency Distributions by Related Major Category
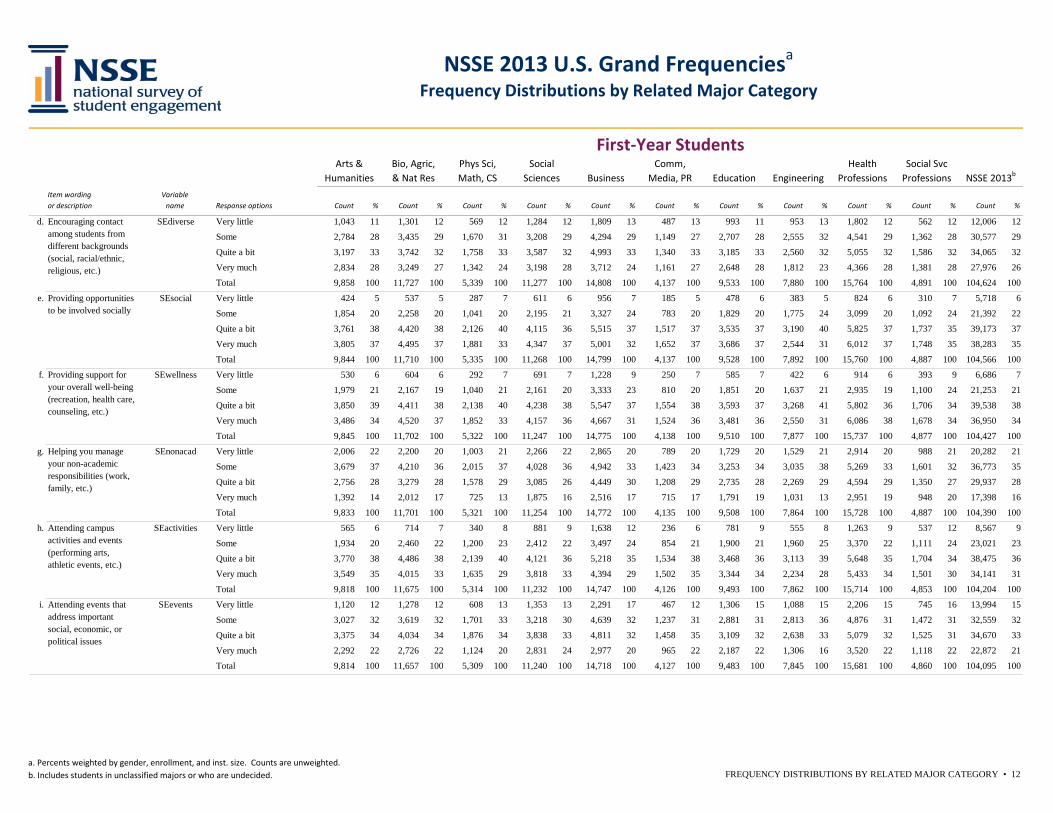
d. Very little 1,043 11 1,301 12 569 12 1,284 12 1,809 13 487 13 993 11 953 13 1,802 12 562 12 12,006 12
Some 2,784 28 3,435 29 1,670 31 3,208 29 4,294 29 1,149 27 2,707 28 2,555 32 4,541 29 1,362 28 30,577 29
Quite a bit 3,197 33 3,742 32 1,758 33 3,587 32 4,993 33 1,340 33 3,185 33 2,560 32 5,055 32 1,586 32 34,065 32
Very much 2,834 28 3,249 27 1,342 24 3,198 28 3,712 24 1,161 27 2,648 28 1,812 23 4,366 28 1,381 28 27,976 26
Total 9,858 100 11,727 100 5,339 100 11,277 100 14,808 100 4,137 100 9,533 100 7,880 100 15,764 100 4,891 100 104,624 100
e. Very little 424 5 537 5 287 7 611 6 956 7 185 5 478 6 383 5 824 6 310 7 5,718 6
Some 1,854 20 2,258 20 1,041 20 2,195 21 3,327 24 783 20 1,829 20 1,775 24 3,099 20 1,092 24 21,392 22
Quite a bit 3,761 38 4,420 38 2,126 40 4,115 36 5,515 37 1,517 37 3,535 37 3,190 40 5,825 37 1,737 35 39,173 37
Very much 3,805 37 4,495 37 1,881 33 4,347 37 5,001 32 1,652 37 3,686 37 2,544 31 6,012 37 1,748 35 38,283 35
Total 9,844 100 11,710 100 5,335 100 11,268 100 14,799 100 4,137 100 9,528 100 7,892 100 15,760 100 4,887 100 104,566 100
f. Very little 530 6 604 6 292 7 691 7 1,228 9 250 7 585 7 422 6 914 6 393 9 6,686 7
Some 1,979 21 2,167 19 1,040 21 2,161 20 3,333 23 810 20 1,851 20 1,637 21 2,935 19 1,100 24 21,253 21
Quite a bit 3,850 39 4,411 38 2,138 40 4,238 38 5,547 37 1,554 38 3,593 37 3,268 41 5,802 36 1,706 34 39,538 38
Very much 3,486 34 4,520 37 1,852 33 4,157 36 4,667 31 1,524 36 3,481 36 2,550 31 6,086 38 1,678 34 36,950 34
Total 9,845 100 11,702 100 5,322 100 11,247 100 14,775 100 4,138 100 9,510 100 7,877 100 15,737 100 4,877 100 104,427 100
g. Very little 2,006 22 2,200 20 1,003 21 2,266 22 2,865 20 789 20 1,729 20 1,529 21 2,914 20 988 21 20,282 21
Some 3,679 37 4,210 36 2,015 37 4,028 36 4,942 33 1,423 34 3,253 34 3,035 38 5,269 33 1,601 32 36,773 35
Quite a bit 2,756 28 3,279 28 1,578 29 3,085 26 4,449 30 1,208 29 2,735 28 2,269 29 4,594 29 1,350 27 29,937 28
Very much 1,392 14 2,012 17 725 13 1,875 16 2,516 17 715 17 1,791 19 1,031 13 2,951 19 948 20 17,398 16
Total 9,833 100 11,701 100 5,321 100 11,254 100 14,772 100 4,135 100 9,508 100 7,864 100 15,728 100 4,887 100 104,390 100
h. Very little 565 6 714 7 340 8 881 9 1,638 12 236 6 781 9 555 8 1,263 9 537 12 8,567 9
Some 1,934 20 2,460 22 1,200 23 2,412 22 3,497 24 854 21 1,900 21 1,960 25 3,370 22 1,111 24 23,021 23
Quite a bit 3,770 38 4,486 38 2,139 40 4,121 36 5,218 35 1,534 38 3,468 36 3,113 39 5,648 35 1,704 34 38,475 36
Very much 3,549 35 4,015 33 1,635 29 3,818 33 4,394 29 1,502 35 3,344 34 2,234 28 5,433 34 1,501 30 34,141 31
Total 9,818 100 11,675 100 5,314 100 11,232 100 14,747 100 4,126 100 9,493 100 7,862 100 15,714 100 4,853 100 104,204 100
i. Very little 1,120 12 1,278 12 608 13 1,353 13 2,291 17 467 12 1,306 15 1,088 15 2,206 15 745 16 13,994 15
Some 3,027 32 3,619 32 1,701 33 3,218 30 4,639 32 1,237 31 2,881 31 2,813 36 4,876 31 1,472 31 32,559 32
Quite a bit 3,375 34 4,034 34 1,876 34 3,838 33 4,811 32 1,458 35 3,109 32 2,638 33 5,079 32 1,525 31 34,670 33
Very much 2,292 22 2,726 22 1,124 20 2,831 24 2,977 20 965 22 2,187 22 1,306 16 3,520 22 1,118 22 22,872 21
Total 9,814 100 11,657 100 5,309 100 11,240 100 14,718 100 4,127 100 9,483 100 7,845 100 15,681 100 4,860 100 104,095 100
Helping you manage your non-academic responsibilities (work, family, etc.)
SEnonacad
Attending campus activities and events (performing arts, athletic events, etc.)
SEactivities
Attending events that address important social, economic, or political issues
SEevents
Encouraging contact among students from different backgrounds (social, racial/ethnic, religious, etc.)
SEdiverse
Providing opportunities to be involved socially
SEsocial
Providing support for your overall well-being (recreation, health care, counseling, etc.)
SEwellness
a. Percents weighted by gender, enrollment, and inst. size. Counts are unweighted.b. Includes students in unclassified majors or who are undecided. FREQUENCY DISTRIBUTIONS BY RELATED MAJOR CATEGORY • 13
Item wording or description
Variable name Response options Count % Count % Count % Count % Count % Count % Count % Count % Count % Count % Count %
Health Professions
Social Svc ProfessionsEngineering NSSE 2013b
First-Year StudentsArts &
HumanitiesBio, Agric, & Nat Res
Phys Sci, Math, CS
Social Sciences Business
Comm, Media, PR Education
NSSE 2013 U.S. Grand Frequenciesa
Frequency Distributions by Related Major Category
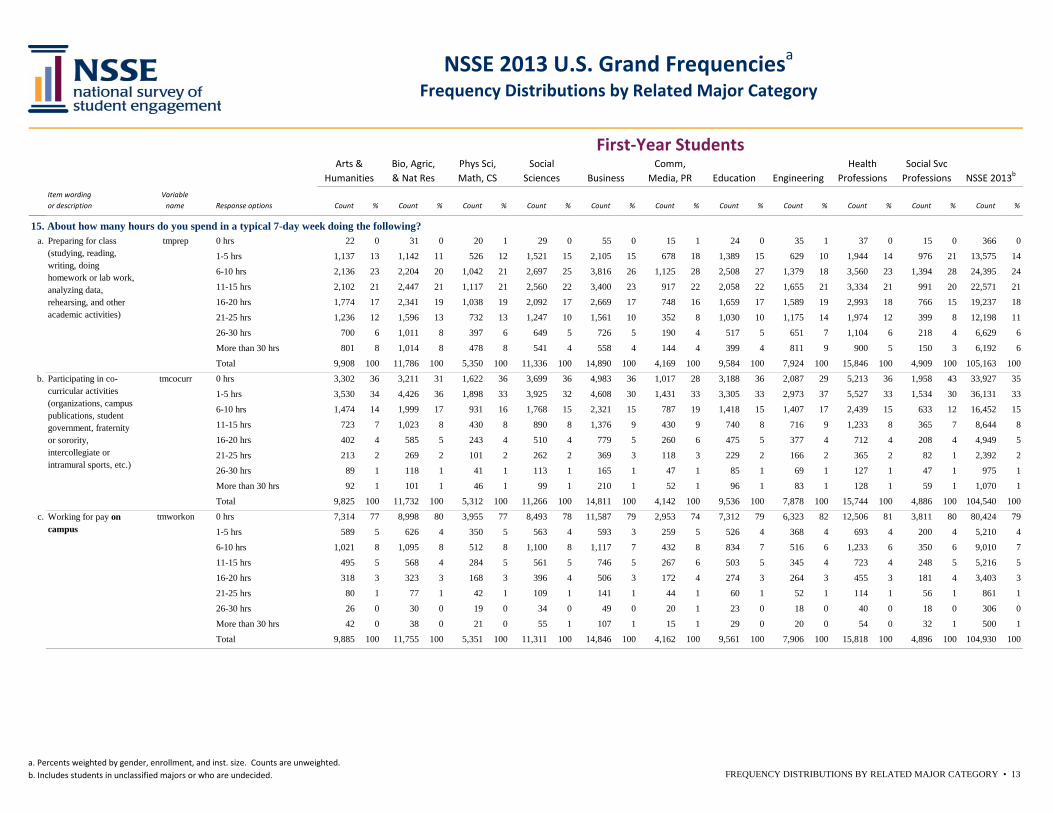
15. About how many hours do you spend in a typical 7-day week doing the following?a. 0 hrs 22 0 31 0 20 1 29 0 55 0 15 1 24 0 35 1 37 0 15 0 366 0
1-5 hrs 1,137 13 1,142 11 526 12 1,521 15 2,105 15 678 18 1,389 15 629 10 1,944 14 976 21 13,575 14
6-10 hrs 2,136 23 2,204 20 1,042 21 2,697 25 3,816 26 1,125 28 2,508 27 1,379 18 3,560 23 1,394 28 24,395 24
11-15 hrs 2,102 21 2,447 21 1,117 21 2,560 22 3,400 23 917 22 2,058 22 1,655 21 3,334 21 991 20 22,571 21
16-20 hrs 1,774 17 2,341 19 1,038 19 2,092 17 2,669 17 748 16 1,659 17 1,589 19 2,993 18 766 15 19,237 18
21-25 hrs 1,236 12 1,596 13 732 13 1,247 10 1,561 10 352 8 1,030 10 1,175 14 1,974 12 399 8 12,198 11
26-30 hrs 700 6 1,011 8 397 6 649 5 726 5 190 4 517 5 651 7 1,104 6 218 4 6,629 6
More than 30 hrs 801 8 1,014 8 478 8 541 4 558 4 144 4 399 4 811 9 900 5 150 3 6,192 6
Total 9,908 100 11,786 100 5,350 100 11,336 100 14,890 100 4,169 100 9,584 100 7,924 100 15,846 100 4,909 100 105,163 100
b. 0 hrs 3,302 36 3,211 31 1,622 36 3,699 36 4,983 36 1,017 28 3,188 36 2,087 29 5,213 36 1,958 43 33,927 35
1-5 hrs 3,530 34 4,426 36 1,898 33 3,925 32 4,608 30 1,431 33 3,305 33 2,973 37 5,527 33 1,534 30 36,131 33
6-10 hrs 1,474 14 1,999 17 931 16 1,768 15 2,321 15 787 19 1,418 15 1,407 17 2,439 15 633 12 16,452 15
11-15 hrs 723 7 1,023 8 430 8 890 8 1,376 9 430 9 740 8 716 9 1,233 8 365 7 8,644 8
16-20 hrs 402 4 585 5 243 4 510 4 779 5 260 6 475 5 377 4 712 4 208 4 4,949 5
21-25 hrs 213 2 269 2 101 2 262 2 369 3 118 3 229 2 166 2 365 2 82 1 2,392 2
26-30 hrs 89 1 118 1 41 1 113 1 165 1 47 1 85 1 69 1 127 1 47 1 975 1
More than 30 hrs 92 1 101 1 46 1 99 1 210 1 52 1 96 1 83 1 128 1 59 1 1,070 1
Total 9,825 100 11,732 100 5,312 100 11,266 100 14,811 100 4,142 100 9,536 100 7,878 100 15,744 100 4,886 100 104,540 100
c. 0 hrs 7,314 77 8,998 80 3,955 77 8,493 78 11,587 79 2,953 74 7,312 79 6,323 82 12,506 81 3,811 80 80,424 79
1-5 hrs 589 5 626 4 350 5 563 4 593 3 259 5 526 4 368 4 693 4 200 4 5,210 4
6-10 hrs 1,021 8 1,095 8 512 8 1,100 8 1,117 7 432 8 834 7 516 6 1,233 6 350 6 9,010 7
11-15 hrs 495 5 568 4 284 5 561 5 746 5 267 6 503 5 345 4 723 4 248 5 5,216 5
16-20 hrs 318 3 323 3 168 3 396 4 506 3 172 4 274 3 264 3 455 3 181 4 3,403 3
21-25 hrs 80 1 77 1 42 1 109 1 141 1 44 1 60 1 52 1 114 1 56 1 861 1
26-30 hrs 26 0 30 0 19 0 34 0 49 0 20 1 23 0 18 0 40 0 18 0 306 0
More than 30 hrs 42 0 38 0 21 0 55 1 107 1 15 1 29 0 20 0 54 0 32 1 500 1
Total 9,885 100 11,755 100 5,351 100 11,311 100 14,846 100 4,162 100 9,561 100 7,906 100 15,818 100 4,896 100 104,930 100
Preparing for class (studying, reading, writing, doing homework or lab work, analyzing data, rehearsing, and other academic activities)
tmprep
Participating in co-curricular activities (organizations, campus publications, student government, fraternity or sorority, intercollegiate or intramural sports, etc.)
tmcocurr
Working for pay on campus
tmworkon
a. Percents weighted by gender, enrollment, and inst. size. Counts are unweighted.b. Includes students in unclassified majors or who are undecided. FREQUENCY DISTRIBUTIONS BY RELATED MAJOR CATEGORY • 14
Item wording or description
Variable name Response options Count % Count % Count % Count % Count % Count % Count % Count % Count % Count % Count %
Health Professions
Social Svc ProfessionsEngineering NSSE 2013b
First-Year StudentsArts &
HumanitiesBio, Agric, & Nat Res
Phys Sci, Math, CS
Social Sciences Business
Comm, Media, PR Education
NSSE 2013 U.S. Grand Frequenciesa
Frequency Distributions by Related Major Category
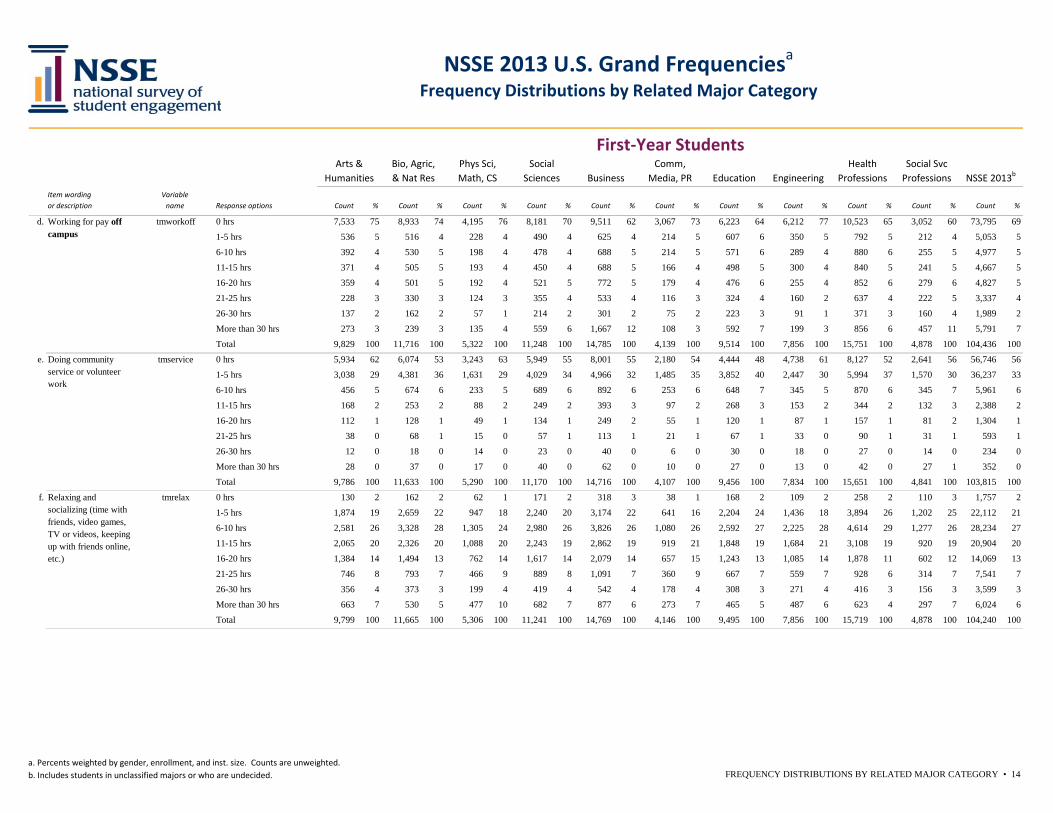
d. 0 hrs 7,533 75 8,933 74 4,195 76 8,181 70 9,511 62 3,067 73 6,223 64 6,212 77 10,523 65 3,052 60 73,795 69
1-5 hrs 536 5 516 4 228 4 490 4 625 4 214 5 607 6 350 5 792 5 212 4 5,053 5
6-10 hrs 392 4 530 5 198 4 478 4 688 5 214 5 571 6 289 4 880 6 255 5 4,977 5
11-15 hrs 371 4 505 5 193 4 450 4 688 5 166 4 498 5 300 4 840 5 241 5 4,667 5
16-20 hrs 359 4 501 5 192 4 521 5 772 5 179 4 476 6 255 4 852 6 279 6 4,827 5
21-25 hrs 228 3 330 3 124 3 355 4 533 4 116 3 324 4 160 2 637 4 222 5 3,337 4
26-30 hrs 137 2 162 2 57 1 214 2 301 2 75 2 223 3 91 1 371 3 160 4 1,989 2
More than 30 hrs 273 3 239 3 135 4 559 6 1,667 12 108 3 592 7 199 3 856 6 457 11 5,791 7
Total 9,829 100 11,716 100 5,322 100 11,248 100 14,785 100 4,139 100 9,514 100 7,856 100 15,751 100 4,878 100 104,436 100
e. 0 hrs 5,934 62 6,074 53 3,243 63 5,949 55 8,001 55 2,180 54 4,444 48 4,738 61 8,127 52 2,641 56 56,746 56
1-5 hrs 3,038 29 4,381 36 1,631 29 4,029 34 4,966 32 1,485 35 3,852 40 2,447 30 5,994 37 1,570 30 36,237 33
6-10 hrs 456 5 674 6 233 5 689 6 892 6 253 6 648 7 345 5 870 6 345 7 5,961 6
11-15 hrs 168 2 253 2 88 2 249 2 393 3 97 2 268 3 153 2 344 2 132 3 2,388 2
16-20 hrs 112 1 128 1 49 1 134 1 249 2 55 1 120 1 87 1 157 1 81 2 1,304 1
21-25 hrs 38 0 68 1 15 0 57 1 113 1 21 1 67 1 33 0 90 1 31 1 593 1
26-30 hrs 12 0 18 0 14 0 23 0 40 0 6 0 30 0 18 0 27 0 14 0 234 0
More than 30 hrs 28 0 37 0 17 0 40 0 62 0 10 0 27 0 13 0 42 0 27 1 352 0
Total 9,786 100 11,633 100 5,290 100 11,170 100 14,716 100 4,107 100 9,456 100 7,834 100 15,651 100 4,841 100 103,815 100
f. 0 hrs 130 2 162 2 62 1 171 2 318 3 38 1 168 2 109 2 258 2 110 3 1,757 2
1-5 hrs 1,874 19 2,659 22 947 18 2,240 20 3,174 22 641 16 2,204 24 1,436 18 3,894 26 1,202 25 22,112 21
6-10 hrs 2,581 26 3,328 28 1,305 24 2,980 26 3,826 26 1,080 26 2,592 27 2,225 28 4,614 29 1,277 26 28,234 27
11-15 hrs 2,065 20 2,326 20 1,088 20 2,243 19 2,862 19 919 21 1,848 19 1,684 21 3,108 19 920 19 20,904 20
16-20 hrs 1,384 14 1,494 13 762 14 1,617 14 2,079 14 657 15 1,243 13 1,085 14 1,878 11 602 12 14,069 13
21-25 hrs 746 8 793 7 466 9 889 8 1,091 7 360 9 667 7 559 7 928 6 314 7 7,541 7
26-30 hrs 356 4 373 3 199 4 419 4 542 4 178 4 308 3 271 4 416 3 156 3 3,599 3
More than 30 hrs 663 7 530 5 477 10 682 7 877 6 273 7 465 5 487 6 623 4 297 7 6,024 6
Total 9,799 100 11,665 100 5,306 100 11,241 100 14,769 100 4,146 100 9,495 100 7,856 100 15,719 100 4,878 100 104,240 100
Working for pay off campus
tmworkoff
Doing community service or volunteer work
tmservice
Relaxing and socializing (time with friends, video games, TV or videos, keeping up with friends online, etc.)
tmrelax
a. Percents weighted by gender, enrollment, and inst. size. Counts are unweighted.b. Includes students in unclassified majors or who are undecided. FREQUENCY DISTRIBUTIONS BY RELATED MAJOR CATEGORY • 15
Item wording or description
Variable name Response options Count % Count % Count % Count % Count % Count % Count % Count % Count % Count % Count %
Health Professions
Social Svc ProfessionsEngineering NSSE 2013b
First-Year StudentsArts &
HumanitiesBio, Agric, & Nat Res
Phys Sci, Math, CS
Social Sciences Business
Comm, Media, PR Education
NSSE 2013 U.S. Grand Frequenciesa
Frequency Distributions by Related Major Category
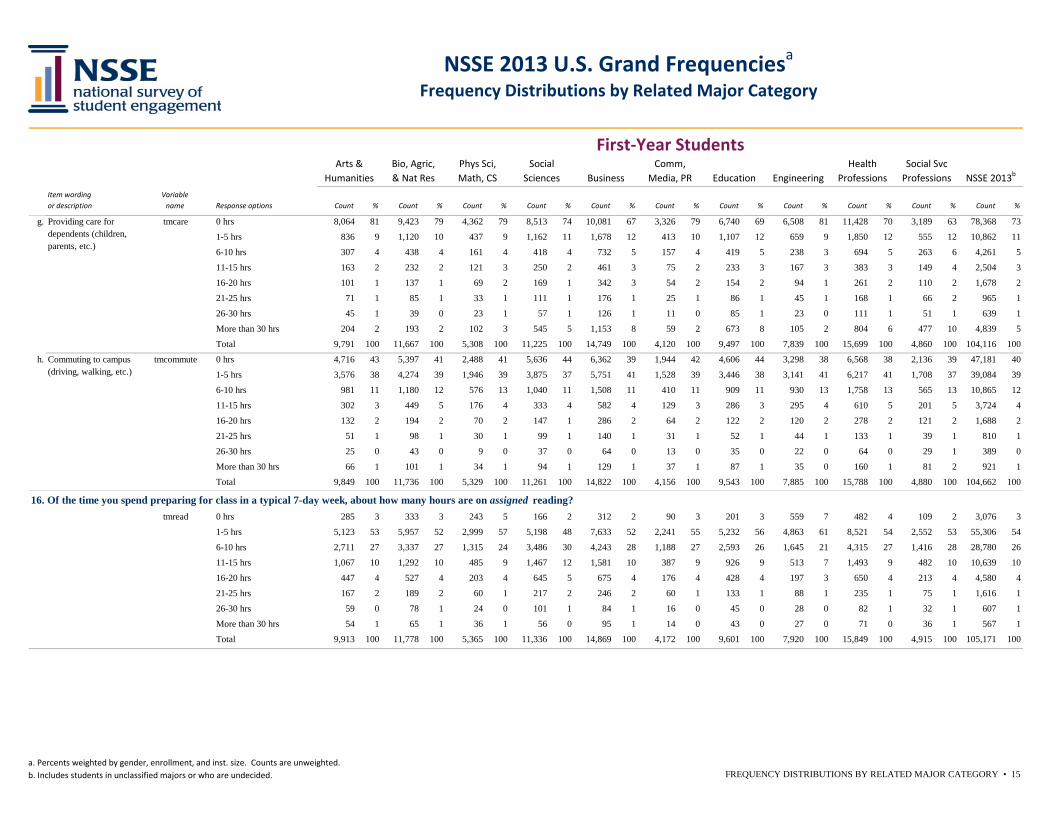
g. 0 hrs 8,064 81 9,423 79 4,362 79 8,513 74 10,081 67 3,326 79 6,740 69 6,508 81 11,428 70 3,189 63 78,368 73
1-5 hrs 836 9 1,120 10 437 9 1,162 11 1,678 12 413 10 1,107 12 659 9 1,850 12 555 12 10,862 11
6-10 hrs 307 4 438 4 161 4 418 4 732 5 157 4 419 5 238 3 694 5 263 6 4,261 5
11-15 hrs 163 2 232 2 121 3 250 2 461 3 75 2 233 3 167 3 383 3 149 4 2,504 3
16-20 hrs 101 1 137 1 69 2 169 1 342 3 54 2 154 2 94 1 261 2 110 2 1,678 2
21-25 hrs 71 1 85 1 33 1 111 1 176 1 25 1 86 1 45 1 168 1 66 2 965 1
26-30 hrs 45 1 39 0 23 1 57 1 126 1 11 0 85 1 23 0 111 1 51 1 639 1
More than 30 hrs 204 2 193 2 102 3 545 5 1,153 8 59 2 673 8 105 2 804 6 477 10 4,839 5
Total 9,791 100 11,667 100 5,308 100 11,225 100 14,749 100 4,120 100 9,497 100 7,839 100 15,699 100 4,860 100 104,116 100
h. 0 hrs 4,716 43 5,397 41 2,488 41 5,636 44 6,362 39 1,944 42 4,606 44 3,298 38 6,568 38 2,136 39 47,181 40
1-5 hrs 3,576 38 4,274 39 1,946 39 3,875 37 5,751 41 1,528 39 3,446 38 3,141 41 6,217 41 1,708 37 39,084 39
6-10 hrs 981 11 1,180 12 576 13 1,040 11 1,508 11 410 11 909 11 930 13 1,758 13 565 13 10,865 12
11-15 hrs 302 3 449 5 176 4 333 4 582 4 129 3 286 3 295 4 610 5 201 5 3,724 4
16-20 hrs 132 2 194 2 70 2 147 1 286 2 64 2 122 2 120 2 278 2 121 2 1,688 2
21-25 hrs 51 1 98 1 30 1 99 1 140 1 31 1 52 1 44 1 133 1 39 1 810 1
26-30 hrs 25 0 43 0 9 0 37 0 64 0 13 0 35 0 22 0 64 0 29 1 389 0
More than 30 hrs 66 1 101 1 34 1 94 1 129 1 37 1 87 1 35 0 160 1 81 2 921 1
Total 9,849 100 11,736 100 5,329 100 11,261 100 14,822 100 4,156 100 9,543 100 7,885 100 15,788 100 4,880 100 104,662 100
16. Of the time you spend preparing for class in a typical 7-day week, about how many hours are on assigned reading? 0 hrs 285 3 333 3 243 5 166 2 312 2 90 3 201 3 559 7 482 4 109 2 3,076 3
1-5 hrs 5,123 53 5,957 52 2,999 57 5,198 48 7,633 52 2,241 55 5,232 56 4,863 61 8,521 54 2,552 53 55,306 54
6-10 hrs 2,711 27 3,337 27 1,315 24 3,486 30 4,243 28 1,188 27 2,593 26 1,645 21 4,315 27 1,416 28 28,780 26
11-15 hrs 1,067 10 1,292 10 485 9 1,467 12 1,581 10 387 9 926 9 513 7 1,493 9 482 10 10,639 10
16-20 hrs 447 4 527 4 203 4 645 5 675 4 176 4 428 4 197 3 650 4 213 4 4,580 4
21-25 hrs 167 2 189 2 60 1 217 2 246 2 60 1 133 1 88 1 235 1 75 1 1,616 1
26-30 hrs 59 0 78 1 24 0 101 1 84 1 16 0 45 0 28 0 82 1 32 1 607 1
More than 30 hrs 54 1 65 1 36 1 56 0 95 1 14 0 43 0 27 0 71 0 36 1 567 1
Total 9,913 100 11,778 100 5,365 100 11,336 100 14,869 100 4,172 100 9,601 100 7,920 100 15,849 100 4,915 100 105,171 100
Providing care for dependents (children, parents, etc.)
tmcare
Commuting to campus (driving, walking, etc.)
tmcommute
tmread
a. Percents weighted by gender, enrollment, and inst. size. Counts are unweighted.b. Includes students in unclassified majors or who are undecided. FREQUENCY DISTRIBUTIONS BY RELATED MAJOR CATEGORY • 16
Item wording or description
Variable name Response options Count % Count % Count % Count % Count % Count % Count % Count % Count % Count % Count %
Health Professions
Social Svc ProfessionsEngineering NSSE 2013b
First-Year StudentsArts &
HumanitiesBio, Agric, & Nat Res
Phys Sci, Math, CS
Social Sciences Business
Comm, Media, PR Education
NSSE 2013 U.S. Grand Frequenciesa
Frequency Distributions by Related Major Category
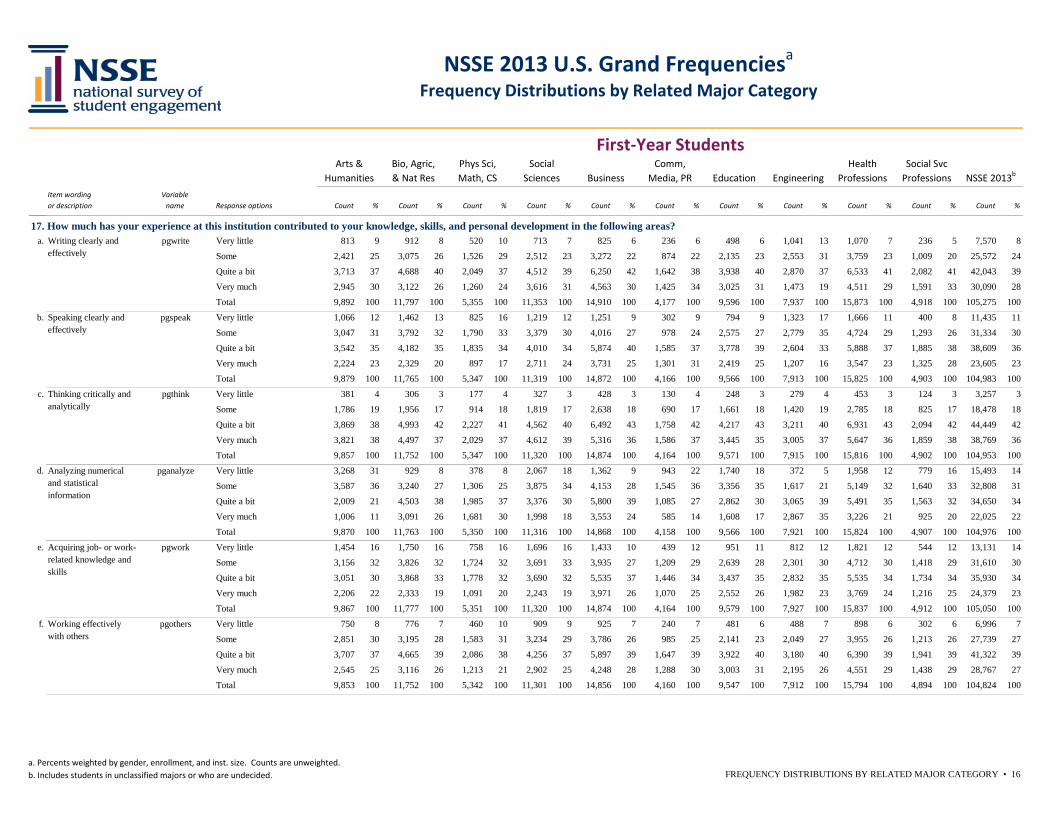
17. How much has your experience at this institution contributed to your knowledge, skills, and personal development in the following areas?a. Very little 813 9 912 8 520 10 713 7 825 6 236 6 498 6 1,041 13 1,070 7 236 5 7,570 8
Some 2,421 25 3,075 26 1,526 29 2,512 23 3,272 22 874 22 2,135 23 2,553 31 3,759 23 1,009 20 25,572 24
Quite a bit 3,713 37 4,688 40 2,049 37 4,512 39 6,250 42 1,642 38 3,938 40 2,870 37 6,533 41 2,082 41 42,043 39
Very much 2,945 30 3,122 26 1,260 24 3,616 31 4,563 30 1,425 34 3,025 31 1,473 19 4,511 29 1,591 33 30,090 28
Total 9,892 100 11,797 100 5,355 100 11,353 100 14,910 100 4,177 100 9,596 100 7,937 100 15,873 100 4,918 100 105,275 100
b. Very little 1,066 12 1,462 13 825 16 1,219 12 1,251 9 302 9 794 9 1,323 17 1,666 11 400 8 11,435 11
Some 3,047 31 3,792 32 1,790 33 3,379 30 4,016 27 978 24 2,575 27 2,779 35 4,724 29 1,293 26 31,334 30
Quite a bit 3,542 35 4,182 35 1,835 34 4,010 34 5,874 40 1,585 37 3,778 39 2,604 33 5,888 37 1,885 38 38,609 36
Very much 2,224 23 2,329 20 897 17 2,711 24 3,731 25 1,301 31 2,419 25 1,207 16 3,547 23 1,325 28 23,605 23
Total 9,879 100 11,765 100 5,347 100 11,319 100 14,872 100 4,166 100 9,566 100 7,913 100 15,825 100 4,903 100 104,983 100
c. Very little 381 4 306 3 177 4 327 3 428 3 130 4 248 3 279 4 453 3 124 3 3,257 3
Some 1,786 19 1,956 17 914 18 1,819 17 2,638 18 690 17 1,661 18 1,420 19 2,785 18 825 17 18,478 18
Quite a bit 3,869 38 4,993 42 2,227 41 4,562 40 6,492 43 1,758 42 4,217 43 3,211 40 6,931 43 2,094 42 44,449 42
Very much 3,821 38 4,497 37 2,029 37 4,612 39 5,316 36 1,586 37 3,445 35 3,005 37 5,647 36 1,859 38 38,769 36
Total 9,857 100 11,752 100 5,347 100 11,320 100 14,874 100 4,164 100 9,571 100 7,915 100 15,816 100 4,902 100 104,953 100
d. Very little 3,268 31 929 8 378 8 2,067 18 1,362 9 943 22 1,740 18 372 5 1,958 12 779 16 15,493 14
Some 3,587 36 3,240 27 1,306 25 3,875 34 4,153 28 1,545 36 3,356 35 1,617 21 5,149 32 1,640 33 32,808 31
Quite a bit 2,009 21 4,503 38 1,985 37 3,376 30 5,800 39 1,085 27 2,862 30 3,065 39 5,491 35 1,563 32 34,650 34
Very much 1,006 11 3,091 26 1,681 30 1,998 18 3,553 24 585 14 1,608 17 2,867 35 3,226 21 925 20 22,025 22
Total 9,870 100 11,763 100 5,350 100 11,316 100 14,868 100 4,158 100 9,566 100 7,921 100 15,824 100 4,907 100 104,976 100
e. Very little 1,454 16 1,750 16 758 16 1,696 16 1,433 10 439 12 951 11 812 12 1,821 12 544 12 13,131 14
Some 3,156 32 3,826 32 1,724 32 3,691 33 3,935 27 1,209 29 2,639 28 2,301 30 4,712 30 1,418 29 31,610 30
Quite a bit 3,051 30 3,868 33 1,778 32 3,690 32 5,535 37 1,446 34 3,437 35 2,832 35 5,535 34 1,734 34 35,930 34
Very much 2,206 22 2,333 19 1,091 20 2,243 19 3,971 26 1,070 25 2,552 26 1,982 23 3,769 24 1,216 25 24,379 23
Total 9,867 100 11,777 100 5,351 100 11,320 100 14,874 100 4,164 100 9,579 100 7,927 100 15,837 100 4,912 100 105,050 100
f. Very little 750 8 776 7 460 10 909 9 925 7 240 7 481 6 488 7 898 6 302 6 6,996 7
Some 2,851 30 3,195 28 1,583 31 3,234 29 3,786 26 985 25 2,141 23 2,049 27 3,955 26 1,213 26 27,739 27
Quite a bit 3,707 37 4,665 39 2,086 38 4,256 37 5,897 39 1,647 39 3,922 40 3,180 40 6,390 39 1,941 39 41,322 39
Very much 2,545 25 3,116 26 1,213 21 2,902 25 4,248 28 1,288 30 3,003 31 2,195 26 4,551 29 1,438 29 28,767 27
Total 9,853 100 11,752 100 5,342 100 11,301 100 14,856 100 4,160 100 9,547 100 7,912 100 15,794 100 4,894 100 104,824 100
Analyzing numerical and statistical information
pganalyze
Acquiring job- or work-related knowledge and skills
pgwork
Working effectively with others
pgothers
Writing clearly and effectively
pgwrite
Speaking clearly and effectively
pgspeak
Thinking critically and analytically
pgthink
a. Percents weighted by gender, enrollment, and inst. size. Counts are unweighted.b. Includes students in unclassified majors or who are undecided. FREQUENCY DISTRIBUTIONS BY RELATED MAJOR CATEGORY • 17
Item wording or description
Variable name Response options Count % Count % Count % Count % Count % Count % Count % Count % Count % Count % Count %
Health Professions
Social Svc ProfessionsEngineering NSSE 2013b
First-Year StudentsArts &
HumanitiesBio, Agric, & Nat Res
Phys Sci, Math, CS
Social Sciences Business
Comm, Media, PR Education
NSSE 2013 U.S. Grand Frequenciesa
Frequency Distributions by Related Major Category
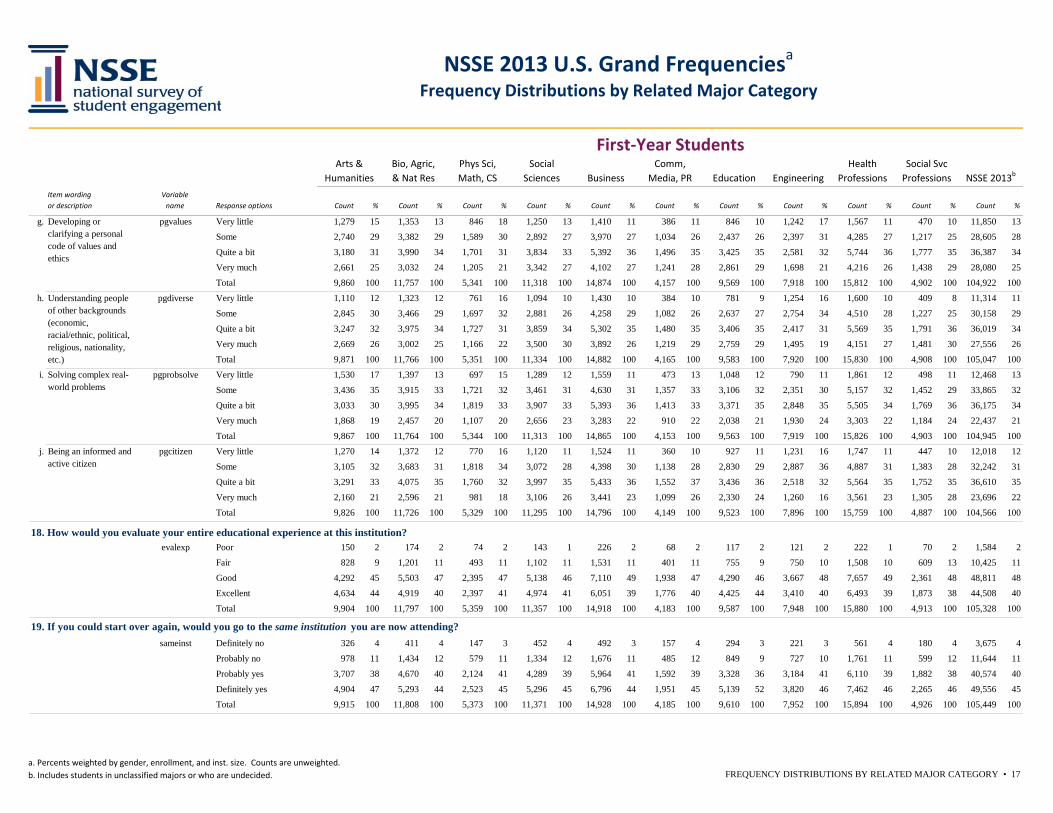
g. Very little 1,279 15 1,353 13 846 18 1,250 13 1,410 11 386 11 846 10 1,242 17 1,567 11 470 10 11,850 13
Some 2,740 29 3,382 29 1,589 30 2,892 27 3,970 27 1,034 26 2,437 26 2,397 31 4,285 27 1,217 25 28,605 28
Quite a bit 3,180 31 3,990 34 1,701 31 3,834 33 5,392 36 1,496 35 3,425 35 2,581 32 5,744 36 1,777 35 36,387 34
Very much 2,661 25 3,032 24 1,205 21 3,342 27 4,102 27 1,241 28 2,861 29 1,698 21 4,216 26 1,438 29 28,080 25
Total 9,860 100 11,757 100 5,341 100 11,318 100 14,874 100 4,157 100 9,569 100 7,918 100 15,812 100 4,902 100 104,922 100
h. Very little 1,110 12 1,323 12 761 16 1,094 10 1,430 10 384 10 781 9 1,254 16 1,600 10 409 8 11,314 11
Some 2,845 30 3,466 29 1,697 32 2,881 26 4,258 29 1,082 26 2,637 27 2,754 34 4,510 28 1,227 25 30,158 29
Quite a bit 3,247 32 3,975 34 1,727 31 3,859 34 5,302 35 1,480 35 3,406 35 2,417 31 5,569 35 1,791 36 36,019 34
Very much 2,669 26 3,002 25 1,166 22 3,500 30 3,892 26 1,219 29 2,759 29 1,495 19 4,151 27 1,481 30 27,556 26
Total 9,871 100 11,766 100 5,351 100 11,334 100 14,882 100 4,165 100 9,583 100 7,920 100 15,830 100 4,908 100 105,047 100
i. Very little 1,530 17 1,397 13 697 15 1,289 12 1,559 11 473 13 1,048 12 790 11 1,861 12 498 11 12,468 13
Some 3,436 35 3,915 33 1,721 32 3,461 31 4,630 31 1,357 33 3,106 32 2,351 30 5,157 32 1,452 29 33,865 32
Quite a bit 3,033 30 3,995 34 1,819 33 3,907 33 5,393 36 1,413 33 3,371 35 2,848 35 5,505 34 1,769 36 36,175 34
Very much 1,868 19 2,457 20 1,107 20 2,656 23 3,283 22 910 22 2,038 21 1,930 24 3,303 22 1,184 24 22,437 21
Total 9,867 100 11,764 100 5,344 100 11,313 100 14,865 100 4,153 100 9,563 100 7,919 100 15,826 100 4,903 100 104,945 100
j. Very little 1,270 14 1,372 12 770 16 1,120 11 1,524 11 360 10 927 11 1,231 16 1,747 11 447 10 12,018 12
Some 3,105 32 3,683 31 1,818 34 3,072 28 4,398 30 1,138 28 2,830 29 2,887 36 4,887 31 1,383 28 32,242 31
Quite a bit 3,291 33 4,075 35 1,760 32 3,997 35 5,433 36 1,552 37 3,436 36 2,518 32 5,564 35 1,752 35 36,610 35
Very much 2,160 21 2,596 21 981 18 3,106 26 3,441 23 1,099 26 2,330 24 1,260 16 3,561 23 1,305 28 23,696 22
Total 9,826 100 11,726 100 5,329 100 11,295 100 14,796 100 4,149 100 9,523 100 7,896 100 15,759 100 4,887 100 104,566 100
18. How would you evaluate your entire educational experience at this institution?Poor 150 2 174 2 74 2 143 1 226 2 68 2 117 2 121 2 222 1 70 2 1,584 2
Fair 828 9 1,201 11 493 11 1,102 11 1,531 11 401 11 755 9 750 10 1,508 10 609 13 10,425 11
Good 4,292 45 5,503 47 2,395 47 5,138 46 7,110 49 1,938 47 4,290 46 3,667 48 7,657 49 2,361 48 48,811 48
Excellent 4,634 44 4,919 40 2,397 41 4,974 41 6,051 39 1,776 40 4,425 44 3,410 40 6,493 39 1,873 38 44,508 40
Total 9,904 100 11,797 100 5,359 100 11,357 100 14,918 100 4,183 100 9,587 100 7,948 100 15,880 100 4,913 100 105,328 100
19. If you could start over again, would you go to the same institution you are now attending?Definitely no 326 4 411 4 147 3 452 4 492 3 157 4 294 3 221 3 561 4 180 4 3,675 4
Probably no 978 11 1,434 12 579 11 1,334 12 1,676 11 485 12 849 9 727 10 1,761 11 599 12 11,644 11
Probably yes 3,707 38 4,670 40 2,124 41 4,289 39 5,964 41 1,592 39 3,328 36 3,184 41 6,110 39 1,882 38 40,574 40
Definitely yes 4,904 47 5,293 44 2,523 45 5,296 45 6,796 44 1,951 45 5,139 52 3,820 46 7,462 46 2,265 46 49,556 45
Total 9,915 100 11,808 100 5,373 100 11,371 100 14,928 100 4,185 100 9,610 100 7,952 100 15,894 100 4,926 100 105,449 100
Being an informed and active citizen
pgcitizen
evalexp
sameinst
Developing or clarifying a personal code of values and ethics
pgvalues
Understanding people of other backgrounds (economic, racial/ethnic, political, religious, nationality, etc.)
pgdiverse
Solving complex real-world problems
pgprobsolve
a. Percents weighted by gender, enrollment, and inst. size. Counts are unweighted.b. Includes students in unclassified majors or who are undecided. FREQUENCY DISTRIBUTIONS BY RELATED MAJOR CATEGORY • 18
Item wording or description
Variable name Response options Count % Count % Count % Count % Count % Count % Count % Count % Count % Count % Count %
Health Professions
Social Svc ProfessionsEngineering NSSE 2013b
First-Year StudentsArts &
HumanitiesBio, Agric, & Nat Res
Phys Sci, Math, CS
Social Sciences Business
Comm, Media, PR Education
NSSE 2013 U.S. Grand Frequenciesa
Frequency Distributions by Related Major Category
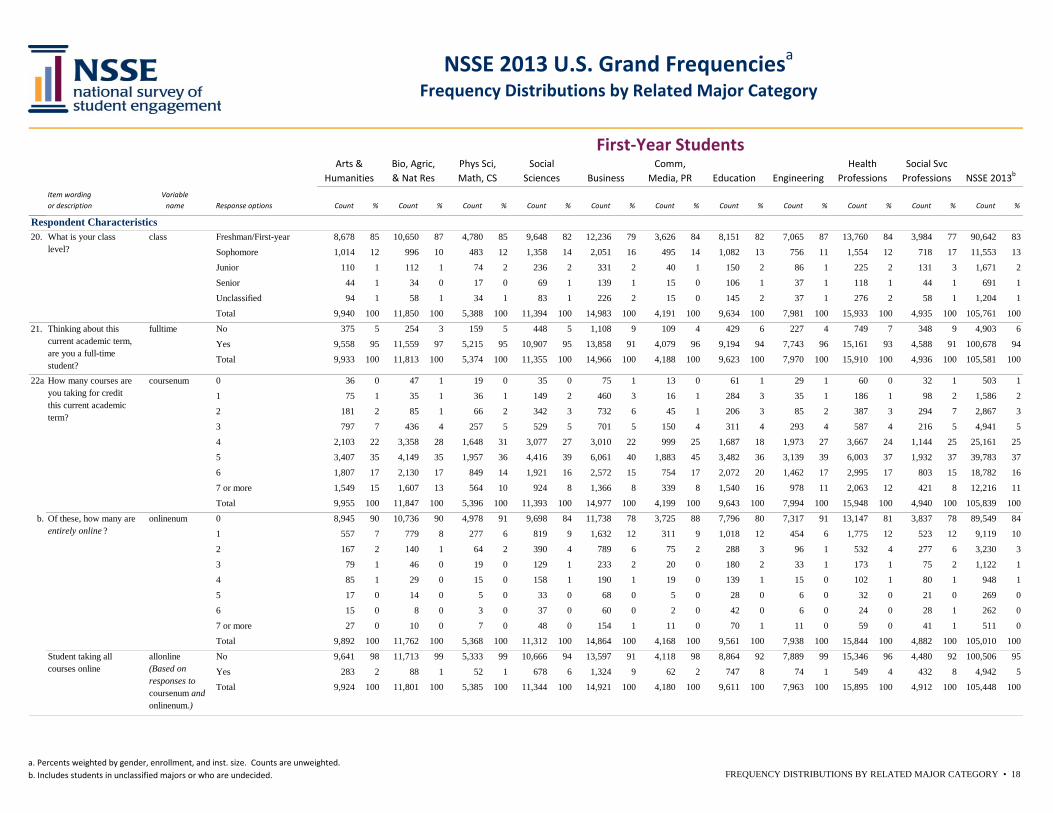
Respondent Characteristics20. Freshman/First-year 8,678 85 10,650 87 4,780 85 9,648 82 12,236 79 3,626 84 8,151 82 7,065 87 13,760 84 3,984 77 90,642 83
Sophomore 1,014 12 996 10 483 12 1,358 14 2,051 16 495 14 1,082 13 756 11 1,554 12 718 17 11,553 13
Junior 110 1 112 1 74 2 236 2 331 2 40 1 150 2 86 1 225 2 131 3 1,671 2
Senior 44 1 34 0 17 0 69 1 139 1 15 0 106 1 37 1 118 1 44 1 691 1
Unclassified 94 1 58 1 34 1 83 1 226 2 15 0 145 2 37 1 276 2 58 1 1,204 1
Total 9,940 100 11,850 100 5,388 100 11,394 100 14,983 100 4,191 100 9,634 100 7,981 100 15,933 100 4,935 100 105,761 100
21. No 375 5 254 3 159 5 448 5 1,108 9 109 4 429 6 227 4 749 7 348 9 4,903 6
Yes 9,558 95 11,559 97 5,215 95 10,907 95 13,858 91 4,079 96 9,194 94 7,743 96 15,161 93 4,588 91 100,678 94
Total 9,933 100 11,813 100 5,374 100 11,355 100 14,966 100 4,188 100 9,623 100 7,970 100 15,910 100 4,936 100 105,581 100
22a. 0 36 0 47 1 19 0 35 0 75 1 13 0 61 1 29 1 60 0 32 1 503 1
1 75 1 35 1 36 1 149 2 460 3 16 1 284 3 35 1 186 1 98 2 1,586 2
2 181 2 85 1 66 2 342 3 732 6 45 1 206 3 85 2 387 3 294 7 2,867 3
3 797 7 436 4 257 5 529 5 701 5 150 4 311 4 293 4 587 4 216 5 4,941 5
4 2,103 22 3,358 28 1,648 31 3,077 27 3,010 22 999 25 1,687 18 1,973 27 3,667 24 1,144 25 25,161 25
5 3,407 35 4,149 35 1,957 36 4,416 39 6,061 40 1,883 45 3,482 36 3,139 39 6,003 37 1,932 37 39,783 37
6 1,807 17 2,130 17 849 14 1,921 16 2,572 15 754 17 2,072 20 1,462 17 2,995 17 803 15 18,782 16
7 or more 1,549 15 1,607 13 564 10 924 8 1,366 8 339 8 1,540 16 978 11 2,063 12 421 8 12,216 11
Total 9,955 100 11,847 100 5,396 100 11,393 100 14,977 100 4,199 100 9,643 100 7,994 100 15,948 100 4,940 100 105,839 100
b. 0 8,945 90 10,736 90 4,978 91 9,698 84 11,738 78 3,725 88 7,796 80 7,317 91 13,147 81 3,837 78 89,549 84
1 557 7 779 8 277 6 819 9 1,632 12 311 9 1,018 12 454 6 1,775 12 523 12 9,119 10
2 167 2 140 1 64 2 390 4 789 6 75 2 288 3 96 1 532 4 277 6 3,230 3
3 79 1 46 0 19 0 129 1 233 2 20 0 180 2 33 1 173 1 75 2 1,122 1
4 85 1 29 0 15 0 158 1 190 1 19 0 139 1 15 0 102 1 80 1 948 1
5 17 0 14 0 5 0 33 0 68 0 5 0 28 0 6 0 32 0 21 0 269 0
6 15 0 8 0 3 0 37 0 60 0 2 0 42 0 6 0 24 0 28 1 262 0
7 or more 27 0 10 0 7 0 48 0 154 1 11 0 70 1 11 0 59 0 41 1 511 0
Total 9,892 100 11,762 100 5,368 100 11,312 100 14,864 100 4,168 100 9,561 100 7,938 100 15,844 100 4,882 100 105,010 100
No 9,641 98 11,713 99 5,333 99 10,666 94 13,597 91 4,118 98 8,864 92 7,889 99 15,346 96 4,480 92 100,506 95
Yes 283 2 88 1 52 1 678 6 1,324 9 62 2 747 8 74 1 549 4 432 8 4,942 5
Total 9,924 100 11,801 100 5,385 100 11,344 100 14,921 100 4,180 100 9,611 100 7,963 100 15,895 100 4,912 100 105,448 100
Of these, how many are entirely online ?
onlinenum
Student taking all courses online
allonline(Based on responses to coursenum and onlinenum.)
What is your class level?
class
Thinking about this current academic term, are you a full-time student?
fulltime
How many courses are you taking for credit this current academic term?
coursenum
a. Percents weighted by gender, enrollment, and inst. size. Counts are unweighted.b. Includes students in unclassified majors or who are undecided. FREQUENCY DISTRIBUTIONS BY RELATED MAJOR CATEGORY • 19
Item wording or description
Variable name Response options Count % Count % Count % Count % Count % Count % Count % Count % Count % Count % Count %
Health Professions
Social Svc ProfessionsEngineering NSSE 2013b
First-Year StudentsArts &
HumanitiesBio, Agric, & Nat Res
Phys Sci, Math, CS
Social Sciences Business
Comm, Media, PR Education
NSSE 2013 U.S. Grand Frequenciesa
Frequency Distributions by Related Major Category
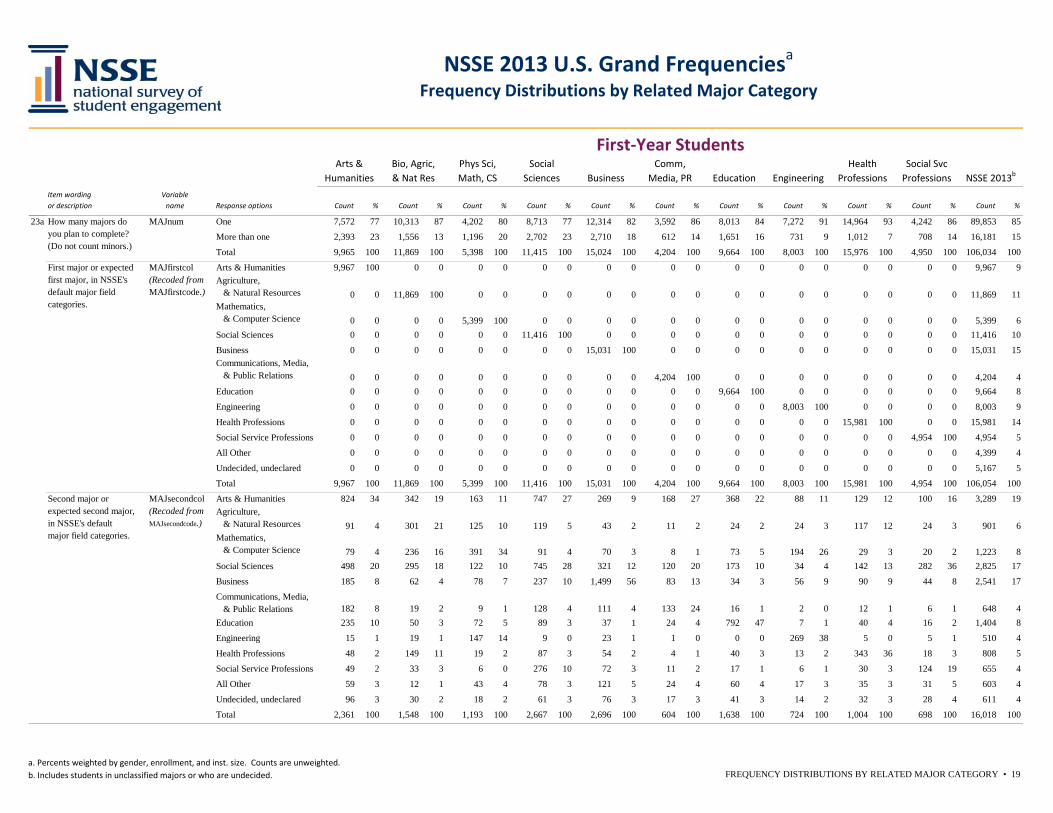
23a. One 7,572 77 10,313 87 4,202 80 8,713 77 12,314 82 3,592 86 8,013 84 7,272 91 14,964 93 4,242 86 89,853 85
More than one 2,393 23 1,556 13 1,196 20 2,702 23 2,710 18 612 14 1,651 16 731 9 1,012 7 708 14 16,181 15
Total 9,965 100 11,869 100 5,398 100 11,415 100 15,024 100 4,204 100 9,664 100 8,003 100 15,976 100 4,950 100 106,034 100
Arts & Humanities 9,967 100 0 0 0 0 0 0 0 0 0 0 0 0 0 0 0 0 0 0 9,967 9 Agriculture, & Natural Resources 0 0 11,869 100 0 0 0 0 0 0 0 0 0 0 0 0 0 0 0 0 11,869 11 Mathematics, & Computer Science 0 0 0 0 5,399 100 0 0 0 0 0 0 0 0 0 0 0 0 0 0 5,399 6Social Sciences 0 0 0 0 0 0 11,416 100 0 0 0 0 0 0 0 0 0 0 0 0 11,416 10
Business 0 0 0 0 0 0 0 0 15,031 100 0 0 0 0 0 0 0 0 0 0 15,031 15Communications, Media, & Public Relations 0 0 0 0 0 0 0 0 0 0 4,204 100 0 0 0 0 0 0 0 0 4,204 4Education 0 0 0 0 0 0 0 0 0 0 0 0 9,664 100 0 0 0 0 0 0 9,664 8
Engineering 0 0 0 0 0 0 0 0 0 0 0 0 0 0 8,003 100 0 0 0 0 8,003 9
Health Professions 0 0 0 0 0 0 0 0 0 0 0 0 0 0 0 0 15,981 100 0 0 15,981 14
Social Service Professions 0 0 0 0 0 0 0 0 0 0 0 0 0 0 0 0 0 0 4,954 100 4,954 5
All Other 0 0 0 0 0 0 0 0 0 0 0 0 0 0 0 0 0 0 0 0 4,399 4
Undecided, undeclared 0 0 0 0 0 0 0 0 0 0 0 0 0 0 0 0 0 0 0 0 5,167 5
Total 9,967 100 11,869 100 5,399 100 11,416 100 15,031 100 4,204 100 9,664 100 8,003 100 15,981 100 4,954 100 106,054 100
Arts & Humanities 824 34 342 19 163 11 747 27 269 9 168 27 368 22 88 11 129 12 100 16 3,289 19 Agriculture, & Natural Resources 91 4 301 21 125 10 119 5 43 2 11 2 24 2 24 3 117 12 24 3 901 6 Mathematics, & Computer Science 79 4 236 16 391 34 91 4 70 3 8 1 73 5 194 26 29 3 20 2 1,223 8Social Sciences 498 20 295 18 122 10 745 28 321 12 120 20 173 10 34 4 142 13 282 36 2,825 17
Business 185 8 62 4 78 7 237 10 1,499 56 83 13 34 3 56 9 90 9 44 8 2,541 17
Communications, Media, & Public Relations 182 8 19 2 9 1 128 4 111 4 133 24 16 1 2 0 12 1 6 1 648 4Education 235 10 50 3 72 5 89 3 37 1 24 4 792 47 7 1 40 4 16 2 1,404 8
Engineering 15 1 19 1 147 14 9 0 23 1 1 0 0 0 269 38 5 0 5 1 510 4
Health Professions 48 2 149 11 19 2 87 3 54 2 4 1 40 3 13 2 343 36 18 3 808 5
Social Service Professions 49 2 33 3 6 0 276 10 72 3 11 2 17 1 6 1 30 3 124 19 655 4
All Other 59 3 12 1 43 4 78 3 121 5 24 4 60 4 17 3 35 3 31 5 603 4
Undecided, undeclared 96 3 30 2 18 2 61 3 76 3 17 3 41 3 14 2 32 3 28 4 611 4
Total 2,361 100 1,548 100 1,193 100 2,667 100 2,696 100 604 100 1,638 100 724 100 1,004 100 698 100 16,018 100
First major or expected first major, in NSSE's default major field categories.
MAJfirstcol(Recoded from MAJfirstcode.)
Second major or expected second major, in NSSE's default major field categories.
MAJsecondcol(Recoded from MAJsecondcode.)
How many majors do you plan to complete? (Do not count minors.)
MAJnum
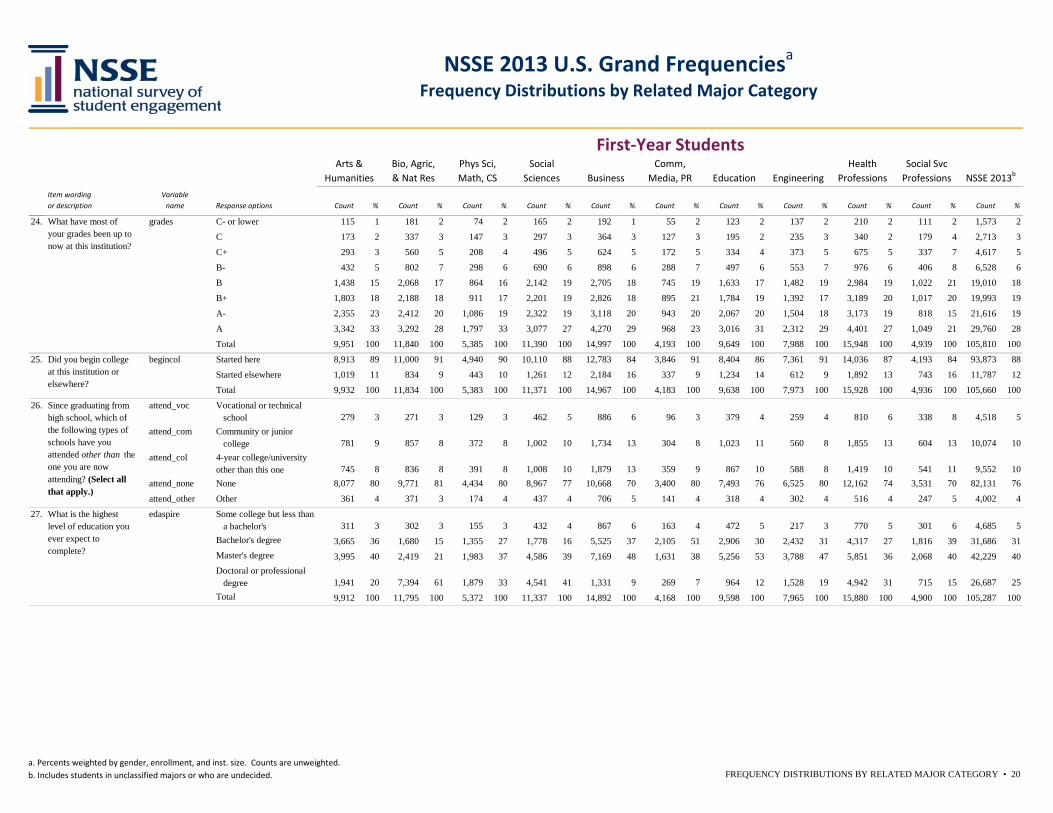
a. Percents weighted by gender, enrollment, and inst. size. Counts are unweighted.b. Includes students in unclassified majors or who are undecided. FREQUENCY DISTRIBUTIONS BY RELATED MAJOR CATEGORY • 20
Item wording or description
Variable name Response options Count % Count % Count % Count % Count % Count % Count % Count % Count % Count % Count %
Health Professions
Social Svc ProfessionsEngineering NSSE 2013b
First-Year StudentsArts &
HumanitiesBio, Agric, & Nat Res
Phys Sci, Math, CS
Social Sciences Business
Comm, Media, PR Education
NSSE 2013 U.S. Grand Frequenciesa
Frequency Distributions by Related Major Category
24. C- or lower 115 1 181 2 74 2 165 2 192 1 55 2 123 2 137 2 210 2 111 2 1,573 2
C 173 2 337 3 147 3 297 3 364 3 127 3 195 2 235 3 340 2 179 4 2,713 3
C+ 293 3 560 5 208 4 496 5 624 5 172 5 334 4 373 5 675 5 337 7 4,617 5
B- 432 5 802 7 298 6 690 6 898 6 288 7 497 6 553 7 976 6 406 8 6,528 6
B 1,438 15 2,068 17 864 16 2,142 19 2,705 18 745 19 1,633 17 1,482 19 2,984 19 1,022 21 19,010 18
B+ 1,803 18 2,188 18 911 17 2,201 19 2,826 18 895 21 1,784 19 1,392 17 3,189 20 1,017 20 19,993 19
A- 2,355 23 2,412 20 1,086 19 2,322 19 3,118 20 943 20 2,067 20 1,504 18 3,173 19 818 15 21,616 19
A 3,342 33 3,292 28 1,797 33 3,077 27 4,270 29 968 23 3,016 31 2,312 29 4,401 27 1,049 21 29,760 28
Total 9,951 100 11,840 100 5,385 100 11,390 100 14,997 100 4,193 100 9,649 100 7,988 100 15,948 100 4,939 100 105,810 100
25. Started here 8,913 89 11,000 91 4,940 90 10,110 88 12,783 84 3,846 91 8,404 86 7,361 91 14,036 87 4,193 84 93,873 88
Started elsewhere 1,019 11 834 9 443 10 1,261 12 2,184 16 337 9 1,234 14 612 9 1,892 13 743 16 11,787 12
Total 9,932 100 11,834 100 5,383 100 11,371 100 14,967 100 4,183 100 9,638 100 7,973 100 15,928 100 4,936 100 105,660 100
26. attend_voc Vocational or technical school 279 3 271 3 129 3 462 5 886 6 96 3 379 4 259 4 810 6 338 8 4,518 5
attend_com Community or junior college 781 9 857 8 372 8 1,002 10 1,734 13 304 8 1,023 11 560 8 1,855 13 604 13 10,074 10
attend_col 4-year college/university other than this one 745 8 836 8 391 8 1,008 10 1,879 13 359 9 867 10 588 8 1,419 10 541 11 9,552 10
attend_none None 8,077 80 9,771 81 4,434 80 8,967 77 10,668 70 3,400 80 7,493 76 6,525 80 12,162 74 3,531 70 82,131 76
attend_other Other 361 4 371 3 174 4 437 4 706 5 141 4 318 4 302 4 516 4 247 5 4,002 4
27. Some college but less than a bachelor's 311 3 302 3 155 3 432 4 867 6 163 4 472 5 217 3 770 5 301 6 4,685 5Bachelor's degree 3,665 36 1,680 15 1,355 27 1,778 16 5,525 37 2,105 51 2,906 30 2,432 31 4,317 27 1,816 39 31,686 31Master's degree 3,995 40 2,419 21 1,983 37 4,586 39 7,169 48 1,631 38 5,256 53 3,788 47 5,851 36 2,068 40 42,229 40Doctoral or professional degree 1,941 20 7,394 61 1,879 33 4,541 41 1,331 9 269 7 964 12 1,528 19 4,942 31 715 15 26,687 25Total 9,912 100 11,795 100 5,372 100 11,337 100 14,892 100 4,168 100 9,598 100 7,965 100 15,880 100 4,900 100 105,287 100
Did you begin college at this institution or elsewhere?
begincol
Since graduating from high school, which of the following types of schools have you attended other than the one you are now attending? (Select all that apply.)
What is the highest level of education you ever expect to complete?
edaspire
What have most of your grades been up to now at this institution?
grades
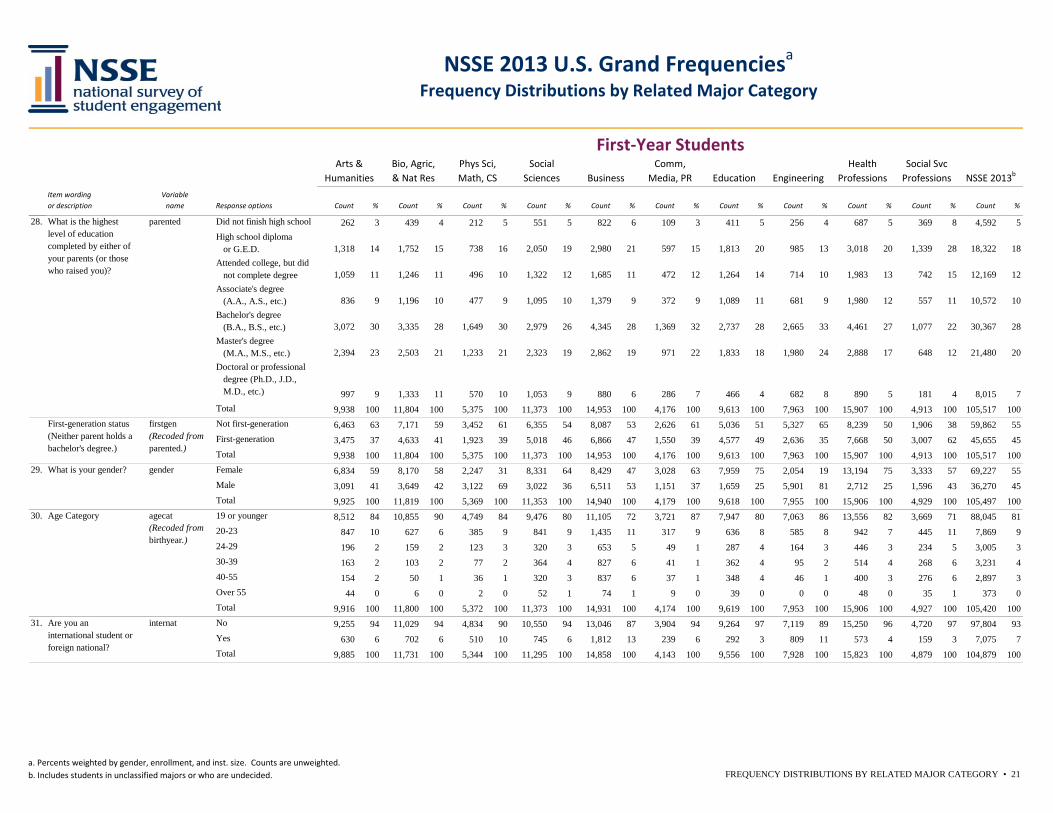
a. Percents weighted by gender, enrollment, and inst. size. Counts are unweighted.b. Includes students in unclassified majors or who are undecided. FREQUENCY DISTRIBUTIONS BY RELATED MAJOR CATEGORY • 21
Item wording or description
Variable name Response options Count % Count % Count % Count % Count % Count % Count % Count % Count % Count % Count %
Health Professions
Social Svc ProfessionsEngineering NSSE 2013b
First-Year StudentsArts &
HumanitiesBio, Agric, & Nat Res
Phys Sci, Math, CS
Social Sciences Business
Comm, Media, PR Education
NSSE 2013 U.S. Grand Frequenciesa
Frequency Distributions by Related Major Category
28. Did not finish high school 262 3 439 4 212 5 551 5 822 6 109 3 411 5 256 4 687 5 369 8 4,592 5High school diploma or G.E.D. 1,318 14 1,752 15 738 16 2,050 19 2,980 21 597 15 1,813 20 985 13 3,018 20 1,339 28 18,322 18Attended college, but did not complete degree 1,059 11 1,246 11 496 10 1,322 12 1,685 11 472 12 1,264 14 714 10 1,983 13 742 15 12,169 12Associate's degree (A.A., A.S., etc.) 836 9 1,196 10 477 9 1,095 10 1,379 9 372 9 1,089 11 681 9 1,980 12 557 11 10,572 10Bachelor's degree (B.A., B.S., etc.) 3,072 30 3,335 28 1,649 30 2,979 26 4,345 28 1,369 32 2,737 28 2,665 33 4,461 27 1,077 22 30,367 28Master's degree (M.A., M.S., etc.) 2,394 23 2,503 21 1,233 21 2,323 19 2,862 19 971 22 1,833 18 1,980 24 2,888 17 648 12 21,480 20Doctoral or professional degree (Ph.D., J.D., M.D., etc.) 997 9 1,333 11 570 10 1,053 9 880 6 286 7 466 4 682 8 890 5 181 4 8,015 7Total 9,938 100 11,804 100 5,375 100 11,373 100 14,953 100 4,176 100 9,613 100 7,963 100 15,907 100 4,913 100 105,517 100Not first-generation 6,463 63 7,171 59 3,452 61 6,355 54 8,087 53 2,626 61 5,036 51 5,327 65 8,239 50 1,906 38 59,862 55First-generation 3,475 37 4,633 41 1,923 39 5,018 46 6,866 47 1,550 39 4,577 49 2,636 35 7,668 50 3,007 62 45,655 45Total 9,938 100 11,804 100 5,375 100 11,373 100 14,953 100 4,176 100 9,613 100 7,963 100 15,907 100 4,913 100 105,517 100
29. Female 6,834 59 8,170 58 2,247 31 8,331 64 8,429 47 3,028 63 7,959 75 2,054 19 13,194 75 3,333 57 69,227 55Male 3,091 41 3,649 42 3,122 69 3,022 36 6,511 53 1,151 37 1,659 25 5,901 81 2,712 25 1,596 43 36,270 45Total 9,925 100 11,819 100 5,369 100 11,353 100 14,940 100 4,179 100 9,618 100 7,955 100 15,906 100 4,929 100 105,497 100
30. 19 or younger 8,512 84 10,855 90 4,749 84 9,476 80 11,105 72 3,721 87 7,947 80 7,063 86 13,556 82 3,669 71 88,045 8120-23 847 10 627 6 385 9 841 9 1,435 11 317 9 636 8 585 8 942 7 445 11 7,869 924-29 196 2 159 2 123 3 320 3 653 5 49 1 287 4 164 3 446 3 234 5 3,005 330-39 163 2 103 2 77 2 364 4 827 6 41 1 362 4 95 2 514 4 268 6 3,231 440-55 154 2 50 1 36 1 320 3 837 6 37 1 348 4 46 1 400 3 276 6 2,897 3Over 55 44 0 6 0 2 0 52 1 74 1 9 0 39 0 0 0 48 0 35 1 373 0Total 9,916 100 11,800 100 5,372 100 11,373 100 14,931 100 4,174 100 9,619 100 7,953 100 15,906 100 4,927 100 105,420 100
31. No 9,255 94 11,029 94 4,834 90 10,550 94 13,046 87 3,904 94 9,264 97 7,119 89 15,250 96 4,720 97 97,804 93Yes 630 6 702 6 510 10 745 6 1,812 13 239 6 292 3 809 11 573 4 159 3 7,075 7Total 9,885 100 11,731 100 5,344 100 11,295 100 14,858 100 4,143 100 9,556 100 7,928 100 15,823 100 4,879 100 104,879 100
Are you an international student or foreign national?
internat
First-generation status (Neither parent holds a bachelor's degree.)
firstgen(Recoded from parented.)
What is your gender? gender
Age Category agecat(Recoded from birthyear.)
What is the highest level of education completed by either of your parents (or those who raised you)?
parented
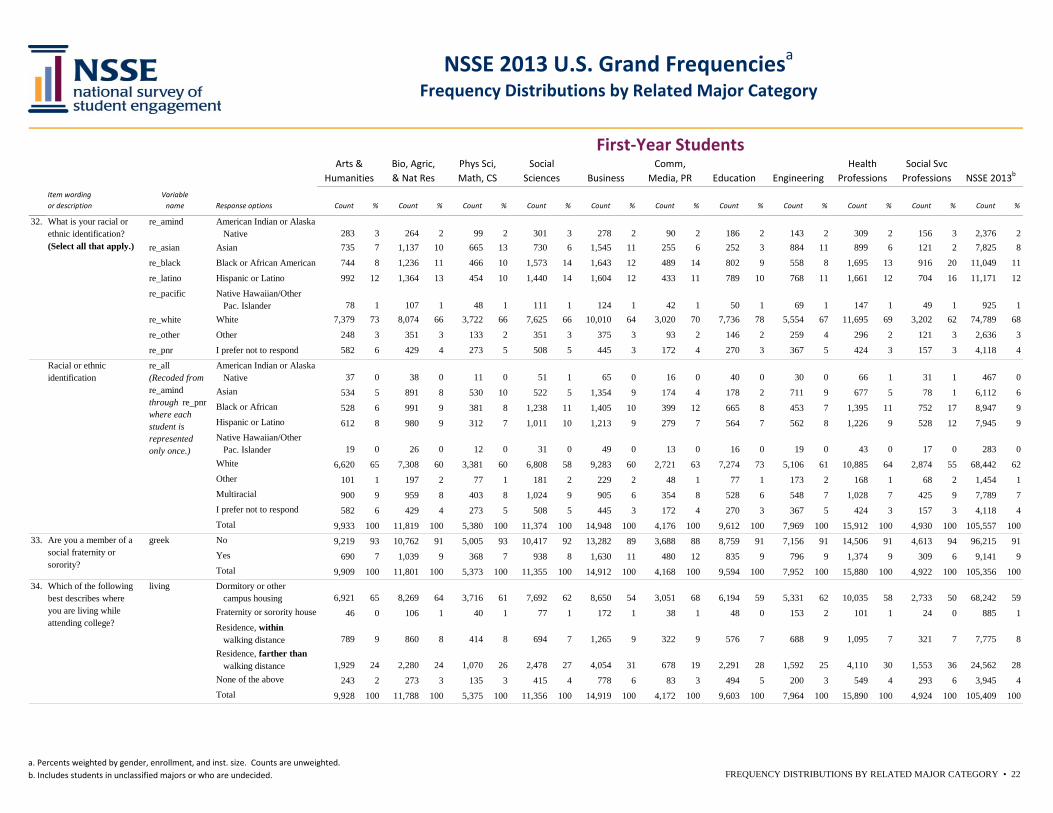
a. Percents weighted by gender, enrollment, and inst. size. Counts are unweighted.b. Includes students in unclassified majors or who are undecided. FREQUENCY DISTRIBUTIONS BY RELATED MAJOR CATEGORY • 22
Item wording or description
Variable name Response options Count % Count % Count % Count % Count % Count % Count % Count % Count % Count % Count %
Health Professions
Social Svc ProfessionsEngineering NSSE 2013b
First-Year StudentsArts &
HumanitiesBio, Agric, & Nat Res
Phys Sci, Math, CS
Social Sciences Business
Comm, Media, PR Education
NSSE 2013 U.S. Grand Frequenciesa
Frequency Distributions by Related Major Category
32. re_amind American Indian or Alaska Native 283 3 264 2 99 2 301 3 278 2 90 2 186 2 143 2 309 2 156 3 2,376 2
re_asian Asian 735 7 1,137 10 665 13 730 6 1,545 11 255 6 252 3 884 11 899 6 121 2 7,825 8
re_black Black or African American 744 8 1,236 11 466 10 1,573 14 1,643 12 489 14 802 9 558 8 1,695 13 916 20 11,049 11
re_latino Hispanic or Latino 992 12 1,364 13 454 10 1,440 14 1,604 12 433 11 789 10 768 11 1,661 12 704 16 11,171 12
re_pacific Native Hawaiian/Other Pac. Islander 78 1 107 1 48 1 111 1 124 1 42 1 50 1 69 1 147 1 49 1 925 1
re_white White 7,379 73 8,074 66 3,722 66 7,625 66 10,010 64 3,020 70 7,736 78 5,554 67 11,695 69 3,202 62 74,789 68
re_other Other 248 3 351 3 133 2 351 3 375 3 93 2 146 2 259 4 296 2 121 3 2,636 3
re_pnr I prefer not to respond 582 6 429 4 273 5 508 5 445 3 172 4 270 3 367 5 424 3 157 3 4,118 4
American Indian or Alaska Native 37 0 38 0 11 0 51 1 65 0 16 0 40 0 30 0 66 1 31 1 467 0Asian 534 5 891 8 530 10 522 5 1,354 9 174 4 178 2 711 9 677 5 78 1 6,112 6Black or African 528 6 991 9 381 8 1,238 11 1,405 10 399 12 665 8 453 7 1,395 11 752 17 8,947 9Hispanic or Latino 612 8 980 9 312 7 1,011 10 1,213 9 279 7 564 7 562 8 1,226 9 528 12 7,945 9Native Hawaiian/Other Pac. Islander 19 0 26 0 12 0 31 0 49 0 13 0 16 0 19 0 43 0 17 0 283 0White 6,620 65 7,308 60 3,381 60 6,808 58 9,283 60 2,721 63 7,274 73 5,106 61 10,885 64 2,874 55 68,442 62Other 101 1 197 2 77 1 181 2 229 2 48 1 77 1 173 2 168 1 68 2 1,454 1Multiracial 900 9 959 8 403 8 1,024 9 905 6 354 8 528 6 548 7 1,028 7 425 9 7,789 7I prefer not to respond 582 6 429 4 273 5 508 5 445 3 172 4 270 3 367 5 424 3 157 3 4,118 4Total 9,933 100 11,819 100 5,380 100 11,374 100 14,948 100 4,176 100 9,612 100 7,969 100 15,912 100 4,930 100 105,557 100
33. No 9,219 93 10,762 91 5,005 93 10,417 92 13,282 89 3,688 88 8,759 91 7,156 91 14,506 91 4,613 94 96,215 91Yes 690 7 1,039 9 368 7 938 8 1,630 11 480 12 835 9 796 9 1,374 9 309 6 9,141 9Total 9,909 100 11,801 100 5,373 100 11,355 100 14,912 100 4,168 100 9,594 100 7,952 100 15,880 100 4,922 100 105,356 100
34. Dormitory or other campus housing 6,921 65 8,269 64 3,716 61 7,692 62 8,650 54 3,051 68 6,194 59 5,331 62 10,035 58 2,733 50 68,242 59Fraternity or sorority house 46 0 106 1 40 1 77 1 172 1 38 1 48 0 153 2 101 1 24 0 885 1Residence, within walking distance 789 9 860 8 414 8 694 7 1,265 9 322 9 576 7 688 9 1,095 7 321 7 7,775 8Residence, farther than walking distance 1,929 24 2,280 24 1,070 26 2,478 27 4,054 31 678 19 2,291 28 1,592 25 4,110 30 1,553 36 24,562 28None of the above 243 2 273 3 135 3 415 4 778 6 83 3 494 5 200 3 549 4 293 6 3,945 4Total 9,928 100 11,788 100 5,375 100 11,356 100 14,919 100 4,172 100 9,603 100 7,964 100 15,890 100 4,924 100 105,409 100
Which of the following best describes where you are living while attending college?
living
What is your racial or ethnic identification? (Select all that apply.)
Racial or ethnic identification
re_all(Recoded from re_amind through re_pnr where each student is represented only once.)
Are you a member of a social fraternity or sorority?
greek
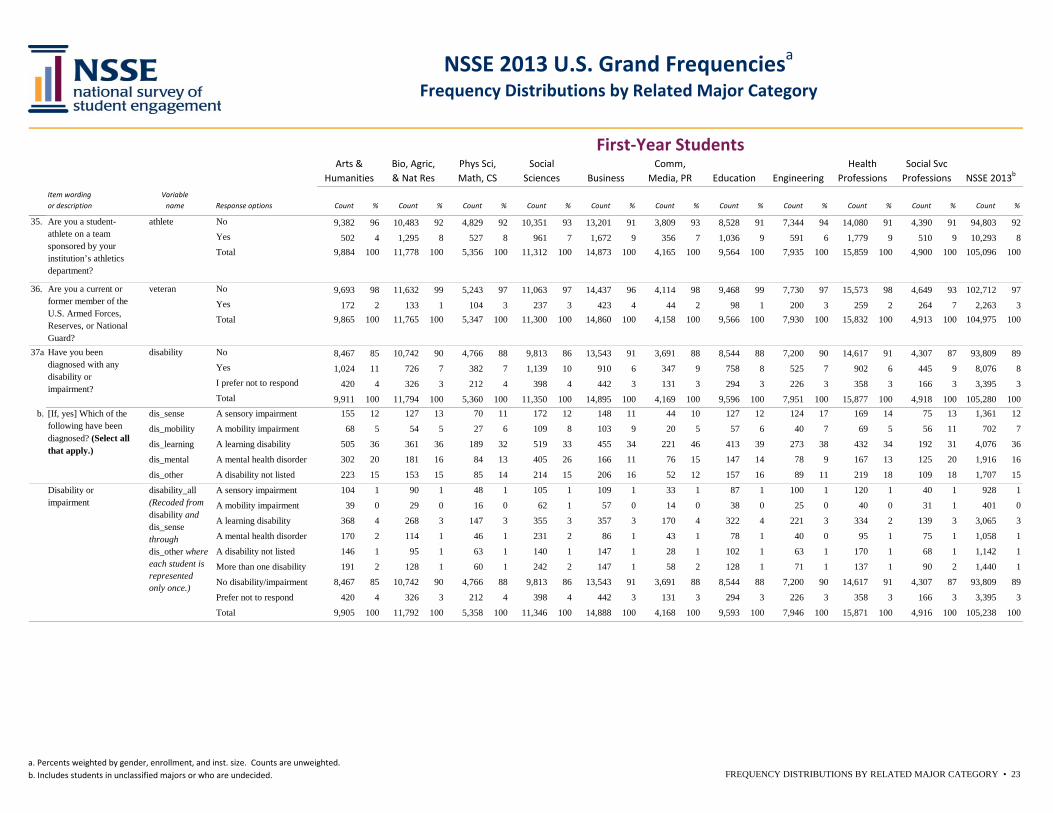
a. Percents weighted by gender, enrollment, and inst. size. Counts are unweighted.b. Includes students in unclassified majors or who are undecided. FREQUENCY DISTRIBUTIONS BY RELATED MAJOR CATEGORY • 23
Item wording or description
Variable name Response options Count % Count % Count % Count % Count % Count % Count % Count % Count % Count % Count %
Health Professions
Social Svc ProfessionsEngineering NSSE 2013b
First-Year StudentsArts &
HumanitiesBio, Agric, & Nat Res
Phys Sci, Math, CS
Social Sciences Business
Comm, Media, PR Education
NSSE 2013 U.S. Grand Frequenciesa
Frequency Distributions by Related Major Category
35. No 9,382 96 10,483 92 4,829 92 10,351 93 13,201 91 3,809 93 8,528 91 7,344 94 14,080 91 4,390 91 94,803 92Yes 502 4 1,295 8 527 8 961 7 1,672 9 356 7 1,036 9 591 6 1,779 9 510 9 10,293 8Total 9,884 100 11,778 100 5,356 100 11,312 100 14,873 100 4,165 100 9,564 100 7,935 100 15,859 100 4,900 100 105,096 100
36. No 9,693 98 11,632 99 5,243 97 11,063 97 14,437 96 4,114 98 9,468 99 7,730 97 15,573 98 4,649 93 102,712 97Yes 172 2 133 1 104 3 237 3 423 4 44 2 98 1 200 3 259 2 264 7 2,263 3Total 9,865 100 11,765 100 5,347 100 11,300 100 14,860 100 4,158 100 9,566 100 7,930 100 15,832 100 4,913 100 104,975 100
37a. No 8,467 85 10,742 90 4,766 88 9,813 86 13,543 91 3,691 88 8,544 88 7,200 90 14,617 91 4,307 87 93,809 89Yes 1,024 11 726 7 382 7 1,139 10 910 6 347 9 758 8 525 7 902 6 445 9 8,076 8I prefer not to respond 420 4 326 3 212 4 398 4 442 3 131 3 294 3 226 3 358 3 166 3 3,395 3Total 9,911 100 11,794 100 5,360 100 11,350 100 14,895 100 4,169 100 9,596 100 7,951 100 15,877 100 4,918 100 105,280 100
b. dis_sense A sensory impairment 155 12 127 13 70 11 172 12 148 11 44 10 127 12 124 17 169 14 75 13 1,361 12
dis_mobility A mobility impairment 68 5 54 5 27 6 109 8 103 9 20 5 57 6 40 7 69 5 56 11 702 7
dis_learning A learning disability 505 36 361 36 189 32 519 33 455 34 221 46 413 39 273 38 432 34 192 31 4,076 36
dis_mental A mental health disorder 302 20 181 16 84 13 405 26 166 11 76 15 147 14 78 9 167 13 125 20 1,916 16
dis_other A disability not listed 223 15 153 15 85 14 214 15 206 16 52 12 157 16 89 11 219 18 109 18 1,707 15
A sensory impairment 104 1 90 1 48 1 105 1 109 1 33 1 87 1 100 1 120 1 40 1 928 1
A mobility impairment 39 0 29 0 16 0 62 1 57 0 14 0 38 0 25 0 40 0 31 1 401 0
A learning disability 368 4 268 3 147 3 355 3 357 3 170 4 322 4 221 3 334 2 139 3 3,065 3
A mental health disorder 170 2 114 1 46 1 231 2 86 1 43 1 78 1 40 0 95 1 75 1 1,058 1
A disability not listed 146 1 95 1 63 1 140 1 147 1 28 1 102 1 63 1 170 1 68 1 1,142 1
More than one disability 191 2 128 1 60 1 242 2 147 1 58 2 128 1 71 1 137 1 90 2 1,440 1
No disability/impairment 8,467 85 10,742 90 4,766 88 9,813 86 13,543 91 3,691 88 8,544 88 7,200 90 14,617 91 4,307 87 93,809 89
Prefer not to respond 420 4 326 3 212 4 398 4 442 3 131 3 294 3 226 3 358 3 166 3 3,395 3
Total 9,905 100 11,792 100 5,358 100 11,346 100 14,888 100 4,168 100 9,593 100 7,946 100 15,871 100 4,916 100 105,238 100
Have you been diagnosed with any disability or impairment?
disability
[If, yes] Which of the following have been diagnosed? (Select all that apply.)
Disability or impairment
disability_all(Recoded from disability and dis_sense through dis_other where each student is represented only once.)
Are you a student-athlete on a team sponsored by your institution’s athletics department?
athlete
Are you a current or former member of the U.S. Armed Forces, Reserves, or National Guard?
veteran
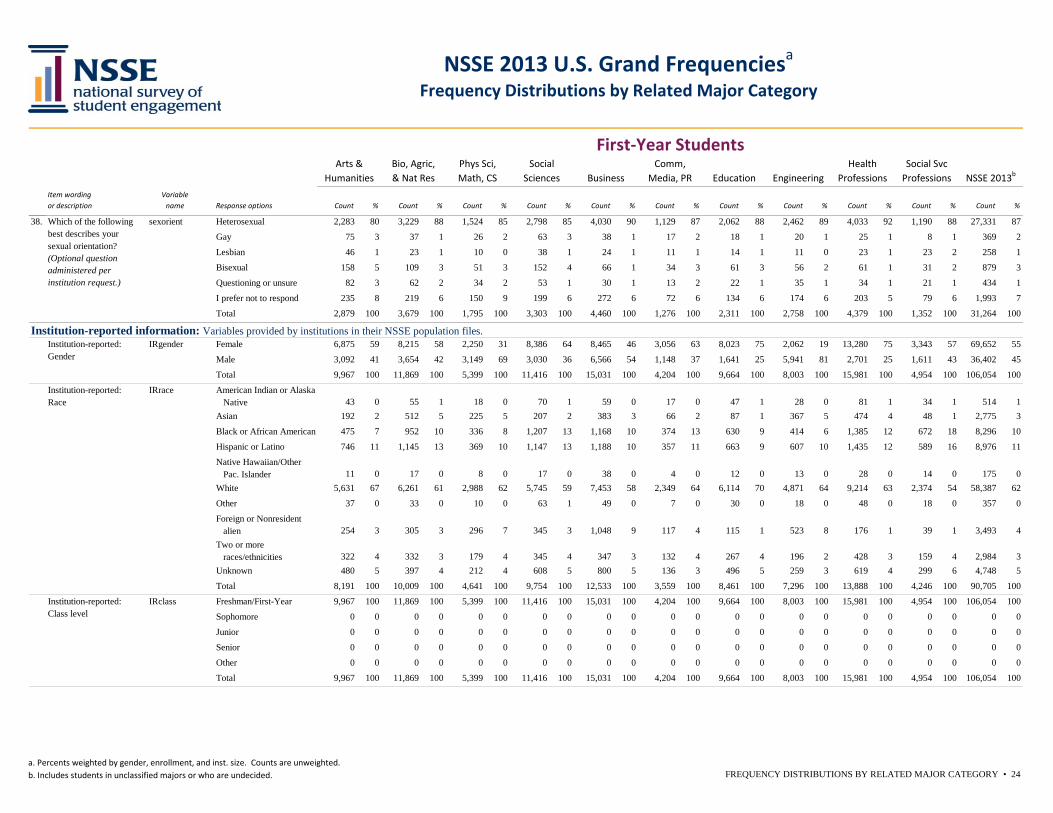
a. Percents weighted by gender, enrollment, and inst. size. Counts are unweighted.b. Includes students in unclassified majors or who are undecided. FREQUENCY DISTRIBUTIONS BY RELATED MAJOR CATEGORY • 24
Item wording or description
Variable name Response options Count % Count % Count % Count % Count % Count % Count % Count % Count % Count % Count %
Health Professions
Social Svc ProfessionsEngineering NSSE 2013b
First-Year StudentsArts &
HumanitiesBio, Agric, & Nat Res
Phys Sci, Math, CS
Social Sciences Business
Comm, Media, PR Education
NSSE 2013 U.S. Grand Frequenciesa
Frequency Distributions by Related Major Category
38. Heterosexual 2,283 80 3,229 88 1,524 85 2,798 85 4,030 90 1,129 87 2,062 88 2,462 89 4,033 92 1,190 88 27,331 87
Gay 75 3 37 1 26 2 63 3 38 1 17 2 18 1 20 1 25 1 8 1 369 2
Lesbian 46 1 23 1 10 0 38 1 24 1 11 1 14 1 11 0 23 1 23 2 258 1
Bisexual 158 5 109 3 51 3 152 4 66 1 34 3 61 3 56 2 61 1 31 2 879 3
Questioning or unsure 82 3 62 2 34 2 53 1 30 1 13 2 22 1 35 1 34 1 21 1 434 1
I prefer not to respond 235 8 219 6 150 9 199 6 272 6 72 6 134 6 174 6 203 5 79 6 1,993 7
Total 2,879 100 3,679 100 1,795 100 3,303 100 4,460 100 1,276 100 2,311 100 2,758 100 4,379 100 1,352 100 31,264 100
Institution-reported information: Variables provided by institutions in their NSSE population files.Female 6,875 59 8,215 58 2,250 31 8,386 64 8,465 46 3,056 63 8,023 75 2,062 19 13,280 75 3,343 57 69,652 55
Male 3,092 41 3,654 42 3,149 69 3,030 36 6,566 54 1,148 37 1,641 25 5,941 81 2,701 25 1,611 43 36,402 45
Total 9,967 100 11,869 100 5,399 100 11,416 100 15,031 100 4,204 100 9,664 100 8,003 100 15,981 100 4,954 100 106,054 100
American Indian or Alaska Native 43 0 55 1 18 0 70 1 59 0 17 0 47 1 28 0 81 1 34 1 514 1Asian 192 2 512 5 225 5 207 2 383 3 66 2 87 1 367 5 474 4 48 1 2,775 3
Black or African American 475 7 952 10 336 8 1,207 13 1,168 10 374 13 630 9 414 6 1,385 12 672 18 8,296 10
Hispanic or Latino 746 11 1,145 13 369 10 1,147 13 1,188 10 357 11 663 9 607 10 1,435 12 589 16 8,976 11
Native Hawaiian/Other Pac. Islander 11 0 17 0 8 0 17 0 38 0 4 0 12 0 13 0 28 0 14 0 175 0White 5,631 67 6,261 61 2,988 62 5,745 59 7,453 58 2,349 64 6,114 70 4,871 64 9,214 63 2,374 54 58,387 62
Other 37 0 33 0 10 0 63 1 49 0 7 0 30 0 18 0 48 0 18 0 357 0
Foreign or Nonresident alien 254 3 305 3 296 7 345 3 1,048 9 117 4 115 1 523 8 176 1 39 1 3,493 4Two or more races/ethnicities 322 4 332 3 179 4 345 4 347 3 132 4 267 4 196 2 428 3 159 4 2,984 3Unknown 480 5 397 4 212 4 608 5 800 5 136 3 496 5 259 3 619 4 299 6 4,748 5
Total 8,191 100 10,009 100 4,641 100 9,754 100 12,533 100 3,559 100 8,461 100 7,296 100 13,888 100 4,246 100 90,705 100
Freshman/First-Year 9,967 100 11,869 100 5,399 100 11,416 100 15,031 100 4,204 100 9,664 100 8,003 100 15,981 100 4,954 100 106,054 100
Sophomore 0 0 0 0 0 0 0 0 0 0 0 0 0 0 0 0 0 0 0 0 0 0
Junior 0 0 0 0 0 0 0 0 0 0 0 0 0 0 0 0 0 0 0 0 0 0
Senior 0 0 0 0 0 0 0 0 0 0 0 0 0 0 0 0 0 0 0 0 0 0
Other 0 0 0 0 0 0 0 0 0 0 0 0 0 0 0 0 0 0 0 0 0 0
Total 9,967 100 11,869 100 5,399 100 11,416 100 15,031 100 4,204 100 9,664 100 8,003 100 15,981 100 4,954 100 106,054 100
Institution-reported: Gender
IRgender
Institution-reported: Race
IRrace
Institution-reported: Class level
IRclass
Which of the following best describes your sexual orientation? (Optional question administered per institution request.)
sexorient
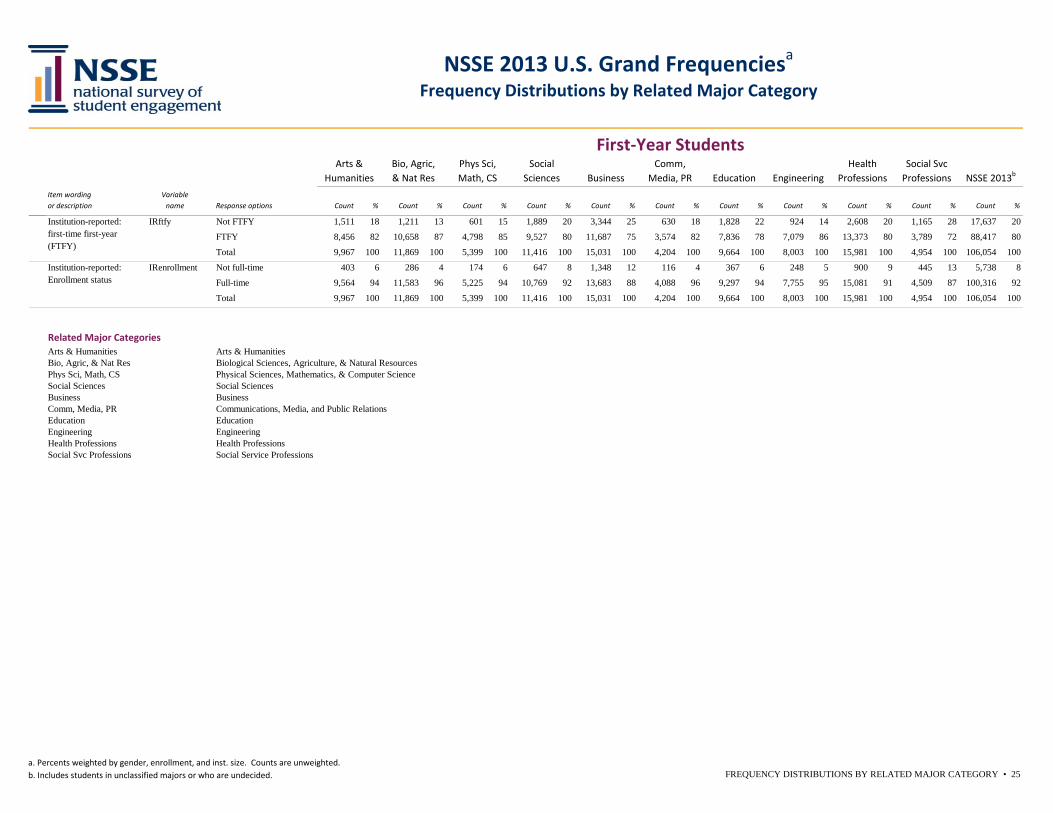
a. Percents weighted by gender, enrollment, and inst. size. Counts are unweighted.b. Includes students in unclassified majors or who are undecided. FREQUENCY DISTRIBUTIONS BY RELATED MAJOR CATEGORY • 25
Item wording or description
Variable name Response options Count % Count % Count % Count % Count % Count % Count % Count % Count % Count % Count %
Health Professions
Social Svc ProfessionsEngineering NSSE 2013b
First-Year StudentsArts &
HumanitiesBio, Agric, & Nat Res
Phys Sci, Math, CS
Social Sciences Business
Comm, Media, PR Education
NSSE 2013 U.S. Grand Frequenciesa
Frequency Distributions by Related Major Category
Not FTFY 1,511 18 1,211 13 601 15 1,889 20 3,344 25 630 18 1,828 22 924 14 2,608 20 1,165 28 17,637 20
FTFY 8,456 82 10,658 87 4,798 85 9,527 80 11,687 75 3,574 82 7,836 78 7,079 86 13,373 80 3,789 72 88,417 80
Total 9,967 100 11,869 100 5,399 100 11,416 100 15,031 100 4,204 100 9,664 100 8,003 100 15,981 100 4,954 100 106,054 100
Not full-time 403 6 286 4 174 6 647 8 1,348 12 116 4 367 6 248 5 900 9 445 13 5,738 8
Full-time 9,564 94 11,583 96 5,225 94 10,769 92 13,683 88 4,088 96 9,297 94 7,755 95 15,081 91 4,509 87 100,316 92
Total 9,967 100 11,869 100 5,399 100 11,416 100 15,031 100 4,204 100 9,664 100 8,003 100 15,981 100 4,954 100 106,054 100
Related Major CategoriesArts & Humanities Arts & HumanitiesBio, Agric, & Nat Res Biological Sciences, Agriculture, & Natural ResourcesPhys Sci, Math, CS Physical Sciences, Mathematics, & Computer ScienceSocial Sciences Social SciencesBusiness BusinessComm, Media, PR Communications, Media, and Public RelationsEducation EducationEngineering EngineeringHealth Professions Health ProfessionsSocial Svc Professions Social Service Professions
Institution-reported: first-time first-year (FTFY)
IRftfy
Institution-reported: Enrollment status
IRenrollment