nsw trauma minimum data set · locked mail bag 5003 gladesville nsw 2111 tel. (02) 9816 0452 fax....
TRANSCRIPT

NSW Trauma Minimum Data Set
2002 Annual Report

NSW DEPARTMENT OF HEALTH
73 Miller Street
NORTH SYDNEY NSW 2060
Tel. (02) 9391 9000
Fax. (02) 9391 9101
TTY. (02) 9391 9900
www.health.nsw.gov.au
This work is copyright. It may be reproduced in whole or in part
for study training purposes subject to the inclusion of an acknowledgement
of the source. It may not be reproduced for commercial usage or sale.
Reproduction for purposes other than those indicated above,
requires written permission from the NSW Department of Health.
© NSW Department of Health 2004
SHPN (SSD) 040208
ISBN 0 7347 3738 6
For further copies of this document please contact:
Better Health Centre – Publications Warehouse
Locked Mail Bag 5003
Gladesville NSW 2111
Tel. (02) 9816 0452
Fax. (02) 9816 0492
Further copies of this document can be downloaded from the
NSW Health website: www.health.nsw.gov.au
November 2004
Acknowledgments
The NSW Institute of Trauma and Injury Management
would like to thank the following people for their
expertise, data collection, support, enthusiasm and
energy in the establishment of the NSW Trauma
Minimum Data Set.
Trauma Network Committee■ Ms Libby Braybrooks
■ Ms Michel Burrowes
■ Ms Erica Caldwell
■ Ms Louise Carter
■ Ms Lisa Chytra
■ Ms Kate Curtis
■ Ms Julie Evans
■ Ms Fiona Fahey
■ Mr Peter Grove
■ Ms Linda Gutierrez
■ Ms Elizabeth Halcomb
■ Ms Celine Hill
■ Ms Alicia Jackson
■ Ms Patricia Manglick
■ Ms Nadia Nocera
■ Ms Kerry Quinn
■ Ms Sue Roncal
■ Ms Joanne Sheedy
■ Ms Rachel West
■ Ms Rachel Zordan
NSW Institute of Trauma and Injury Management■ Prof Danny Cass
■ Ms Trish McDougall
■ Mr David Martens
■ Ms Christine Allsopp
■ Ms Margaret Perrett
■ Mrs Karyn Dakin
■ Ms Andrea Delprado
■ Mr Rod Isaacs
NSW Health NSW Trauma Minimum Data Set – 2002 Annual Report i


Contents
NSW Health NSW Trauma Minimum Data Set – 2002 Annual Report iii
Acknowledgments ..................................................i
Executive summary...............................................1
Data summary.........................................................3
Trauma service statistics ....................................7
General profile ........................................................7
Motor vehicle accidents (MVA) ....................................10
Motor bike accidents (MBA) ........................................11
Pedestrians ..................................................................12
Low/medium falls (<5m) ..............................................13
High falls (>5m) ...........................................................14
Pedal cyclists ................................................................14
Blunt assault ................................................................15
Shooting......................................................................15
Stabbing ......................................................................15
Arrival modes ..............................................................16
Operating suite profile .................................................17
Intensive care profile ....................................................18
Injury region profile......................................................19
Injury severity profile....................................................20
Length of stay..............................................................21
Paediatric trauma summary..........................................22
Individual trauma service summaries ..........25
John Hunter Hospital /
John Hunter Children’s Hospital ...................................25
Liverpool Hospital ........................................................27
Nepean District Hospital, Penrith..................................29
Prince of Wales Hospital ..............................................31
Royal North Shore Hospital ..........................................33
Royal Prince Alfred Hospital .........................................35
St George Hospital.......................................................37
St Vincent’s Hospital ....................................................39
Sydney Children’s Hospital ...........................................41
The Children’s Hospital at Westmead...........................43
Westmead Hospital......................................................45
Appendix 1 .............................................................47
Index of figures.....................................................49
Index of tables ......................................................51


Executive summary
NSW Health NSW Trauma Minimum Data Set – 2002 Annual Report 1
This is the inaugural report of the NSW Institute of
Trauma and Injury Management (ITIM) Trauma Minimum
Data Set (TMDS).
BackgroundThe Trauma Minimum Data Set was commenced in 2002 after the establishment of the NSW Institute ofTrauma and Injury Management. This is the first timethat data of this type has been available in NSW.
This document is a high quality and timely report ofmajor trauma treated at trauma centres in the SydneyGreater Metropolitan region for the calendar year 2002,and includes data from the following hospitals:
■ John Hunter Hospital/John Hunter Children’s Hospital
■ Liverpool Hospital
■ Nepean Hospital
■ Prince of Wales Hospital
■ Royal North Shore Hospital
■ Royal Prince Alfred Hospital
■ St George Hospital
■ St Vincent’s Hospital
■ Sydney Children’s Hospital
■ The Children’s Hospital at Westmead
The criteria for inclusion in the TMDS are; all patientsadmitted to hospital due to physical injury who have an Injury Severity Score (ISS1) greater than 15 and/orwho die and/or are admitted to an Intensive Care Unit.Only those patients who had an Injury SeverityScore (ISS) greater than 15 were selected for thisreport as this was the only cohort that could beuniformly grouped across the trauma services.
In determining the data fields to be included in theTrauma Minimum Data Set the ITIM endeavoured toselect only those data fields that were readily availablewithin a hospital’s Trauma Registry. A conscious effortwas made not to create additional workload through‘extra’ data collection. The data needed to becollectable, relevant, reliable and reproducible.
The data collection tool is included in Appendix I.
Utilisation of information■ Provide comprehensive feedback to trauma clinicians,
Area Health Services, NSW Department of Health,Injury Prevention Groups, and other stakeholders.
■ Assess the performance of the Trauma System Program.
■ Identify opportunities for Education for clinicians,administrators and consumers.
■ Development of improved Clinical Practice Guidelines.
Key points■ Trauma is the major cause of death and disability in
young people. The 15-44 year age group representover 50% of the serious injuries documented in thisreport. This group is most at risk of serious injury,disability and death.
■ Serious injury is becoming an increasing problem inour aging population.
■ Males are still over represented by a ratio of 3:1.
■ Over a quarter of patients, or an average of eightpatients per week, are receiving initial assessmentand management of their injuries outside of a higher level trauma centre.
■ Of patients requiring surgery within the first 24 hoursof admission to hospital 34% need a craniotomyperformed. This indicates that traumatic brain injury is still a major cause of death and disability.
■ Serious injury occurs more frequently in theafternoon and early evening.
■ Serious injury occurs more frequently on Fridays,Saturdays and Sundays.
■ Road trauma is still the major cause of serious injury.This factor is very evident in Western, South WesternSydney and Hunter regions.
■ Falls at home in the elderly is a major problem,especially in the Northern and Eastern regions of Sydney.
■ Motor cyclists are over represented with more serious injuries occurring than would be expectedfrom the percentage of traffic that motorbikesrepresent on the road.
■ While all trauma services see a whole range of injuriesthere is a tendency for each trauma service to see apredominance of one or two mechanisms of injury.


Data summary
All data is for calendar year 2002 (ie 01/01/2002 to
31/12/2002) where patients had an Injury Severity Score
(ISS) >15. The ISS1 is a reflection of overall severity and
probability of survival based on an anatomical injury
severity classification, the AIS or Abbreviated Injury
Scale.2 An ISS of greater than 15 reflects serious injury.
NSW Health NSW Trauma Minimum Data Set – 2002 Annual Report 3
Table 1. Trauma service (TS) admissions and deaths
Total admissions 1,809 admission(1,772 patients*)
Survived 1,511 patients (85% of total patients)
Died 261 patients (15% of total patients)
Monthly average 150 admissions
Minimum monthly average 134 admissions (August)
Maximum monthly average 164 admissions (November)
Table 2. Admissions by gender
Female 463 admissions (26% of total)(454 patients)
Male 1,346 admissions (74% of total)(1,318 patients)
Indeterminate 463 admissions (26% of total)(454 patients)
Table 3. Outcome by gender
Gender Outcome – Survived Outcome – Died
Female 374 patients (82%) 80 patients (18%)
Male 1,137 patients (86%) 181 patients (14%)
1. Baker SP, O’Neill B, Haddon W, The Injury Severity Score, A method for describing patients with multiple injuries and evaluating emergency care, J Trauma
14:187-196, 1974.
2. Abbreviated Injury Scale: Association for the Advancement of Automotive Medicine.

Table 4. Age – Top three age ranges
Age range Count % of total
15-24 367 patients 21%
25-34 308 patients 17%
35-44 248 patients 14%
Table 5. Mechanism of injury – Top three
Mechanism Count % of total Deaths (% of total deaths)
Road trauma* 850 patients 48 105 patients (40%)
Falls** 460 patients 26 93 patients (36%)
Assault 119 patients 7 10 patients (4%)
* Road Trauma includes motor bike riders and pillions, motor vehicle drivers and passengers, pedal cyclists, and pedestrians.
** 0 to 5 metres.
Table 6. Admission type
Admission type Count % of total
Transfer in 495 admissions (27%)
Direct from scene 1,314 admissions (73%)
Table 7. Outcome by admission type
Admission type Outcome – Survived Outcome – Died
Transfer in 407 patients (89%) 51 patients (11%)
Direct from scene 1104 patients (84%) 210 patients (16%)
Table 8. ICU admissions
Admission to ICU Count % of total
Yes 996 55%
No 808 45%
Table 9. ICU average length of stay (LOS)
Outcome – All Outcome – Survived Outcome – Died
7.6 days 8.0 days 4.8 days
NSW Trauma Minimum Data Set – 2002 Annual Report NSW Health4
Data summary

NSW Health NSW Trauma Minimum Data Set – 2002 Annual Report 5
Table 10. Hospital average length of stay (LOS)
LOS Outcome – All Outcome – Survived Outcome – Died
Overall LOS 16.7 days 18.7 days 5 days
Direct admission LOS 16.3 days 18.5 days 4.8 days
Transfer in admission LOS 17.8 days 19.2 days 5.7 days
Table 11. Arrival mode – Top three arrival modes
Arrival Mode Admissions % of total
Ambulance 1288 71%
Helicopter 348 19%
Private vehicle 66 4%
Table 12. Operating suite in first 24 hours
633 admissions (35% of total) were sent to the operating suite within 24 hours of admission for a total of 702 procedures.
Table 13: Operating suite in first 24 hours – Top three procedures
Operating suite procedure Count % of total procedures
Craniotomy 236 34%
Laparotomy 165 24%
Open ext# 82 12%
Table 14. Injury time – Top three hours of the day injury occurred (excludes patients where time of injury is unknown)
Hour of day Count (patients injured) % of total
14:00 103 5.8%
15:00 100 5.6%
16:00 98 5.5%
Data summary

NSW Trauma Minimum Data Set – 2002 Annual Report NSW Health6
Table 15. Injury day of week
Day of week Count (patients injured) % of total
Saturday 298 17%
Friday 296 17%
Sunday 273 15%
Tuesday 249 14%
Wednesday 228 13%
Thursday 223 13%
Monday 203 11%
Table 16. Injury severity score (ISS)
ISS range Count (patients) % of total
16-24 1012 57%
25-40 621 35%
41-75 139 8%
Data summary

Trauma service statistics
General profile
Figure 1. Total trauma admissions to each trauma service for 2002 with ISS > 15
NSW Health NSW Trauma Minimum Data Set – 2002 Annual Report 7
Figure 2. Trauma admissions to all trauma services by age
Figure 3. Trauma admissions to all trauma services for 2002 by age and gender
Figure 4. Trauma admissions to each trauma serviceby admission type (ie direct from sceneor transfer into the trauma service fromanother hospital)

NSW Trauma Minimum Data Set – 2002 Annual Report NSW Health8
Figure 5. Percentage of admission types for alltrauma admissions to each trauma servicedirect from scene or transferred fromanother hospital to a trauma service
Trauma service statistics
Figure 7. Trauma admissions to all trauma services by mechanism of injury
Figure 6. Percentage of inter-AHS (from one hospitalto another in a different AHS) and intra-AHS(from one hospital to another within thesame AHS) transfers for all traumaadmissions to each trauma service

NSW Health NSW Trauma Minimum Data Set – 2002 Annual Report 9
Figure 9. Trauma admissions to all trauma services showing outcome percentages by mechanism of injury
Trauma service statistics
Figure 8. Trauma admissions to all trauma services by mechanism of injury and outcome (survived or died)
109
10
Figure 10. Trauma admissions to all trauma services showing injury region percentages by mechanism of injury
Head, Face, Chest, Abdomen, Extremity, External

Figure 13. Motor vehicle accident related traumapatient admissions to all trauma services byday of week that injury occurred for 2002
NSW Trauma Minimum Data Set – 2002 Annual Report NSW Health10
Trauma service statistics
Figure 12. Motor vehicle accident related trauma patient admissions to all trauma services by hour of day that injury occurred
Motor vehicle accidents (MVA
Figure 11. Motor vehicle accident related traumapatient admissions to all trauma servicesby gender and age group

NSW Health NSW Trauma Minimum Data Set – 2002 Annual Report 11
Trauma service statistics
Motor bike accidents (MBA)
Figure 14. Motor bike accident related trauma patientadmissions to all trauma services by ageand gender
Figure 16. Motor bike accident related trauma patientadmissions to all trauma services by day ofweek for 2002
Figure 15. Motor bike accident related trauma patient admissions to all trauma services by hour of day that injury occurred

Figure 18. Pedestrian trauma patient admissions to all trauma services by hour of day that injury occurred
NSW Trauma Minimum Data Set – 2002 Annual Report NSW Health12
Pedestrians
Figure 17. Pedestrian trauma patient admissions toall trauma services by age and gender
Trauma service statistics
Figure 19. Pedestrian trauma patient admissions toall trauma services by day of week thatinjury occurred
NSW Health NSW Trauma Minimum Data Set – 2002 Annual Report 13
Trauma service statistics
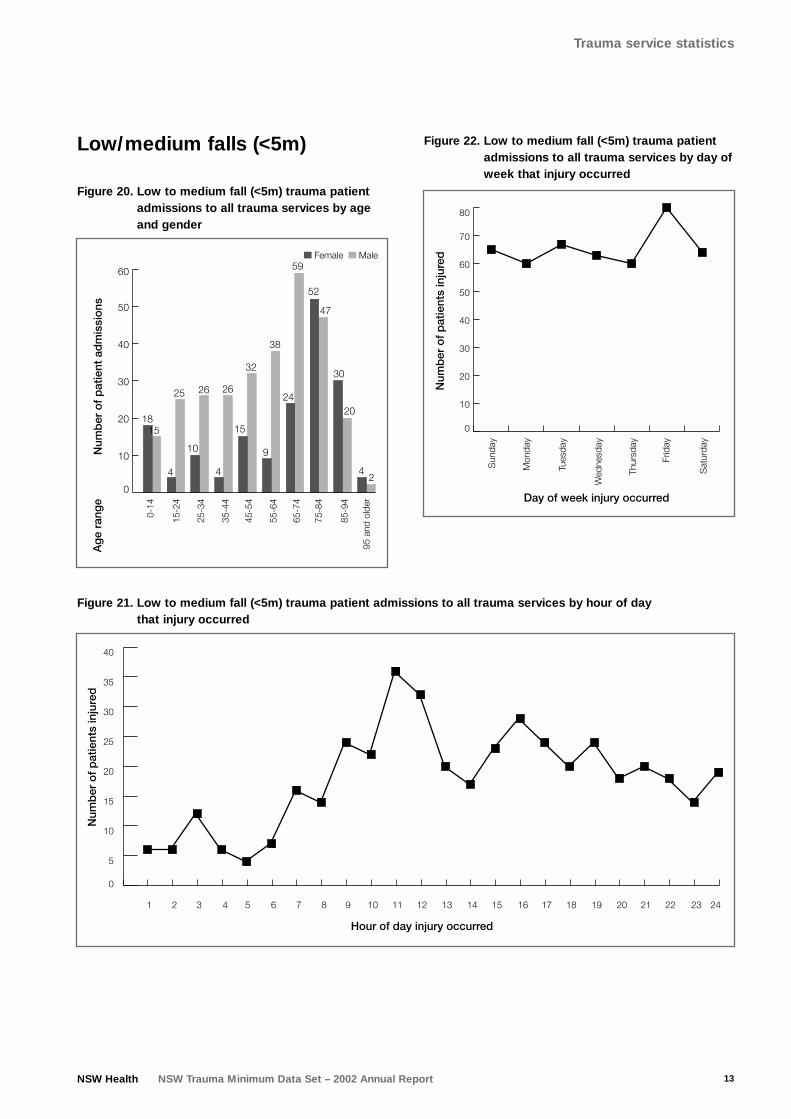
Low/medium falls (<5m)
Figure 20. Low to medium fall (<5m) trauma patientadmissions to all trauma services by ageand gender
Figure 21. Low to medium fall (<5m) trauma patient admissions to all trauma services by hour of day that injury occurred
Figure 22. Low to medium fall (<5m) trauma patientadmissions to all trauma services by day ofweek that injury occurred

Pedal cyclists
Figure 24. Pedal cycle trauma patient admissions to all trauma services by age and gender
NSW Trauma Minimum Data Set – 2002 Annual Report NSW Health14
High falls (>5m)
Figure 23, High fall (5m or greater) trauma patientadmissions to all trauma services by ageand gender
Trauma service statistics
Figure 25. Pedal cycle trauma patient admissions to all trauma services by hour of day that injury occurred

NSW Health NSW Trauma Minimum Data Set – 2002 Annual Report 15
Trauma service statistics
Figure 26. Pedal cycle trauma patient admissionsto all trauma services by day of week thatinjury occurred
Blunt assault
Figure 27. Blunt assault trauma patient admissions to all trauma services by age and gender
Shooting
Figure 28. Shooting trauma patient admissions to all trauma services by age and gender
Stabbing
Figure 29.Stabbing trauma patient admissions to all trauma services by age and gender
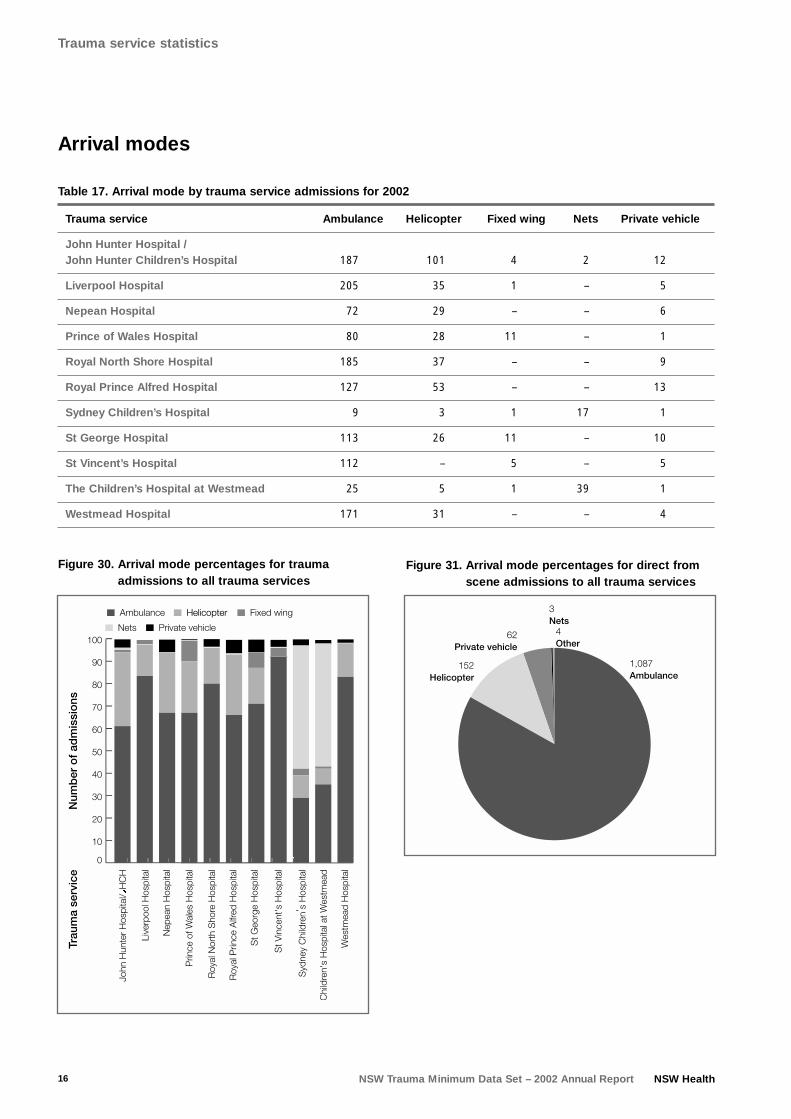
Figure 30. Arrival mode percentages for traumaadmissions to all trauma services
Figure 31. Arrival mode percentages for direct fromscene admissions to all trauma services
0
10
20
30
40
50
60
70
80
90
100
NSW Trauma Minimum Data Set – 2002 Annual Report NSW Health16
Trauma service statistics
Arrival modes
Table 17. Arrival mode by trauma service admissions for 2002
Trauma service Ambulance Helicopter Fixed wing Nets Private vehicle
John Hunter Hospital /John Hunter Children’s Hospital 187 101 4 2 12
Liverpool Hospital 205 35 1 – 5
Nepean Hospital 72 29 – – 6
Prince of Wales Hospital 80 28 11 – 1
Royal North Shore Hospital 185 37 – – 9
Royal Prince Alfred Hospital 127 53 – – 13
Sydney Children’s Hospital 9 3 1 17 1
St George Hospital 113 26 11 – 10
St Vincent’s Hospital 112 – 5 – 5
The Children’s Hospital at Westmead 25 5 1 39 1
Westmead Hospital 171 31 – – 4

NSW Health NSW Trauma Minimum Data Set – 2002 Annual Report 17
Trauma service statistics
Figure 32. Arrival mode percentages for transfer intrauma admissions to all trauma services
(*NETS = Neonatal Emergency Transfer Service)
Figure 34. Outcomes for operating suite procedures for trauma admissions to all trauma services
Operating suite profile
Figure 33. Trauma admissions admitted to operatingsuite within 24 hours of admission for alltrauma services

Intensive care profile
Figure 35. ICU admissions by month for trauma admissions to all trauma services
Figure 36. ICU admissions by age for traumaadmissions to all trauma services
Figure 37. ICU admission percentages by arrivalmode for trauma admissions to all trauma services
NSW Trauma Minimum Data Set – 2002 Annual Report NSW Health18
Trauma service statistics

NSW Health NSW Trauma Minimum Data Set – 2002 Annual Report 19
Trauma service statistics
Injury region profile
Figure 38. Injury region percentages by admissiontype for trauma patient admissions to alltrauma services
Figure 40. Injury regions by age for trauma patient admissions to all trauma services
Figure 39. Injury region percentages by age for trauma patient admissions to all trauma services

NSW Trauma Minimum Data Set – 2002 Annual Report NSW Health20
Trauma service statistics
Figure 42. ISS range percentages by gender for trauma patient admissions to all trauma services
Figure 43. ISS range by arrival mode for traumapatient admissions to all trauma services
Injury severity profile
Figure 41. Injury severity score (ISS) range by age for trauma patient admissions to all trauma services

NSW Health NSW Trauma Minimum Data Set – 2002 Annual Report 21
Trauma service statistics
Length of stay
Figure 44. Hospital average length of stay (LOS) by age and gender for surviving traumaadmissions to all trauma services
Figure 45. Hospital average length of stay (LOS) by age and gender for deceased traumaadmissions to all trauma services
0
2
4
6
8
10
12
14
16
18
20
22
24
26

Figure 47. Paediatric admissions to each traumaservice by gender
NSW Trauma Minimum Data Set – 2002 Annual Report NSW Health22
Paediatric trauma summaryThis section includes all trauma admissions in the age
range 0-15 years to trauma services (TS) during 2002,
as this is the generally accepted paediatric age range
solely for use in the paediatric MDS.
Trauma service statistics
Table 18. Paediatric admissions and deaths
Total admissions 156 admissions(139 patients)
Survived 124 patients (89% of paediatric patients)
Died 15 patients (11% of paediatric patients)
Monthly average 13 admissions
Table 19. Gender
Female 45 patients (32% of paediatric patients)
Male 94 patients (68% of paediatric patients)
Figure 46. Paediatric admissions to each trauma service

NSW Health NSW Trauma Minimum Data Set – 2002 Annual Report 23
Trauma service statistics
Figure 48. Admissions to each designated paediatricmajor trauma service by admission type
Figure 49. Admissions to each designated paediatric major trauma service by admission type percentage
Figure 50. Paediatric patient admissions to all trauma service by mechanism of injury

NSW Trauma Minimum Data Set – 2002 Annual Report NSW Health24
Trauma service statistics
Table 20. Arrival mode for paediatric admissions to trauma services for 2002
Trauma service Ambulance Fixed wing Helicopter Nets Private vehicle
John Hunter Children’s Hospital 11 8 1 2
Liverpool Hospital 14
Nepean Hospital 1
Royal North Shore Hospital 9 1
Royal Prince Alfred Hospital 2 1
St George Hospital 2 3
Sydney Children’s Hospital 8 1 3 17 1
The Children’s Hospital at Westmead 24 1 5 37 1
Westmead Hospital 1

Individual trauma service summaries
NSW Health NSW Trauma Minimum Data Set – 2002 Annual Report 25
John Hunter Hospital / JohnHunter Children’s Hospital
Table 21. Admissions and deaths – John HunterHospital / John Hunter Children’s Hospital
Total admissions 306
Survived 270 (88% of total)
Died 36 (12% of total)
Direct admission 224 (73% of total)
Transfer in admission 82 (27% of total)
Monthly average 26
Table 22. Admissions by age range – John HunterHospital / John Hunter Children’s Hospital
Age range Count % of total
0-14 22 7
15-24 50 16
25-34 59 19
35-44 43 14
45-54 34 11
55-64 35 11
65-74 23 8
75-84 22 7
85-94 17 6
95 and older 1 < 1
Table 23. Admissions by gender – John HunterHospital / John Hunter Children’s Hospital
Gender Count % of total
Female 72 24%
Male 234 76%
Figure 51. Trauma admissions to John HunterHospital /John Hunter Children’s Hospitalby age and gender

NSW Trauma Minimum Data Set – 2002 Annual Report NSW Health26
Individual trauma service summaries
Table 27. ICU average length of stay (LOS) at John Hunter Hospital / John HunterChildren’s Hospital
Outcome – All Outcome – Survived Outcome – Died
6.7 days 7.4 days 3.5 days
Table 28. Hospital average length of stay (LOS) at John Hunter Hospital / John HunterChildren’s Hospital
Outcome – All Outcome – Survived Outcome – Died
12.8 days 14.1 days 3.4 days
Table 29. Transfer in admissions to John HunterHospital /John Hunter Children’s Hospital
Transferring hospital Number of transfers
Belmont Hospital 4
Canberra Hospital 1
Cessnock Hospital 10
Coffs Harbour Hospital 1
Dungog Hospital 1
Gloucester Hospital 2
Gosford Hospital 1
Goulburn Hospital 1
Kempsey Hospital 6
Kurri Kurri Hospital 1
Lismore Hospital 1
Maitland Hospital 10
Manning Base Hospital 1
Mater Hospital 3
Merriwa Hospital 1
Muswellbrook Hospital 2
Nelson Bay Poly Clinic 6
Port Macquarie Hospital 6
Royal Adelaide Hospital 1
Scone Hospital 2
Singleton Hospital 10
Tamworth Hospital 7
Taree Hospital 3
Wyong Hospital 1
Table 24. Trauma admissions to John Hunter Hospital/ John Hunter Children’s Hospital bymechanism of injury
Mechanism Count % of total
MV driver 78 25
Low fall < 1m 51 17
MB rider 36 12
MV passenger 24 8
Pedestrian 21 7
Medium fall 1-5m 20 7
High fall > 5m 15 5
Assault 14 5
Other 9 3
Stabbing 8 3
Industrial 7 2
Pedal cyclist 6 2
Horse 5 2
Shooting 4 1
Burns 3 1
MB pillion 2 1
Train 2 1
Recreation 1 <1
Table 25. Trauma admissions to John Hunter Hospital/John Hunter Children’s Hospital by arrival mode
Arrival mode Count % of total
Ambulance 187 61
Helicopter 101 33
Private vehicle 12 4
Fixed wing 4 1
Nets 2 1
Table 26. Trauma admissions to John Hunter Hospital/John Hunter Children’s Hospital by ICU admission
Admission Numberby ICU of admissions % of total
Yes 109 36
No 196 64

NSW Health NSW Trauma Minimum Data Set – 2002 Annual Report 27
Individual trauma service summaries
Liverpool Hospital
Table 30. Admissions and deaths – Liverpool Hospital
Total admissions 251
Survived 224 (89% of total)
Died 27 (11% of total)
Direct admission 204 (81% of total)
Transfer in admission 47 (19% of total)
Monthly average 21
Table 31. Admissions by age range – Liverpool Hospital
Age range Count % of total
0-14 16 6
15-24 69 27
25-34 51 20
35-44 35 14
45-54 27 11
55-64 19 8
65-74 13 5
75-84 17 7
85-94 3 1
95 and over 1 <1
Table 32. Admissions by gender, Liverpool Hospital
Gender Count % of total
Female 60 24%
Male 191 76%
Figure 52. Trauma admissions to Liverpool Hospitalby age and gender

NSW Trauma Minimum Data Set – 2002 Annual Report NSW Health28
Table 33. Trauma admissions to Liverpool Hospital by mechanism of injury
Mechanism Count % of total
MV driver 52 21
Medium fall 1-5m 34 14
MV passenger 30 12
Assault 20 8
Pedestrian 19 8
MB rider 16 6
High fall > 5m 13 5
Stabbing 12 5
Industrial 10 4
Recreation 9 4
Burns 8 3
Pedal cyclist 8 3
Shooting 8 3
Other 5 2
Horse 3 1
MB pillion 2 1
Low fall < 1m 1 <1
Train 1 <1
Table 34. Trauma admissions to Liverpool Hospital by arrival mode
Arrival mode count % of total
Ambulance 205 83
Helicopter 35 14
Private vehicle 5 2
Fixed wing 1 <1
Other 1 <1
Table 35. Trauma admissions to Liverpool Hospital by ICU admission
Admission Numberby ICU of admissions % of total
Yes 132 53
No 119 47
Individual trauma service summaries
Table 36. ICU average length of stay (LOS) at Liverpool Hospital
Outcome – All Outcome – Survived Outcome – Died
7 days 7.4 days 3.5 days
Table 37. Hospital average length of stay (LOS)at Liverpool Hospital
Outcome – All Outcome – Survived Outcome – Died
17.1 days 18.8 days 2.8 days
Table 38. Transfer in admissions to Liverpool Hospital
Transferring hospital Number of transfers
Bankstown Hospital 9
Bathurst Hospital 2
Bowral Hospital 4
Blue Mountains Hospital 1
Camden Hospital 1
Campbelltown Hospital 6
Canterbury Hospital 1
Fairfield Hospital 2
Goulburn Hospital 5
Lithgow Hospital 1
Mudgee Hospital 1
Nepean Hospital 2
Nowra Hospital 1
Orange Hospital 1
Ryde Hospital 1
Shoalhaven Hospital 1
Tamworth Hospital 1
The San Hospital 1
Ulladulla Hospital 1
Wollongong Hospital 4
Young Hospital 1

NSW Health NSW Trauma Minimum Data Set – 2002 Annual Report 29
Individual trauma service summaries
Nepean District Hospital,Penrith
Table 39. Admissions and deaths – Nepean District Hospital, Penrith
Total admissions 107
Survived 96 (90% of total)
Died 11 (10% of total)
Direct admission 90 (84% of total)
Transfer in admission 17 (16% of total)
Monthly average 9
Table 40. Admissions by age range –Nepean District Hospital, Penrith
Age range Count % of total
0-14 1 1
15-24 27 25
25-34 30 28
35-44 21 20
45-54 8 7
55-64 9 8
65-74 6 6
75-84 4 4
85-94 1 1
Table 41. Admissions by gender –Nepean District Hospital, Penrith
Gender Count % of total
Female 23 21%
Male 84 79%
Figure 53. Trauma admissions to Nepean DistrictHospital, Penrith by age and gender

NSW Trauma Minimum Data Set – 2002 Annual Report NSW Health30
Table 42. Trauma admissions to Nepean DistrictHospital, Penrith by mechanism of injury
Mechanism Count % of total
MV driver 26 24
MB rider 21 20
Assault 10 9
Medium fall 1-5m 10 9
MV passenger 6 6
Pedal cyclist 6 6
Recreation 6 6
Industrial 4 4
Stabbing 4 4
Other 3 3
Pedestrian 3 3
Sport 2 2
Train 2 2
High fall > 5m 1 1
Horse 1 1
Low fall < 1m 1 1
Shooting 1 1
Table 43. Trauma admissions to Nepean DistrictHospital, Penrith, by arrival mode
Arrival mode Count % of total
Ambulance 72 67
Helicopter 29 27
Private vehicle 6 6
Table 44. Trauma admissions to Nepean DistrictHospital, Penrith by ICU admission
Admission Numberby ICU of admissions % of total
Yes 82 77
No 24 23
Individual trauma service summaries
Table 45. ICU average length of stay (LOS) at Nepean District Hospital, Penrith
Outcome – All Outcome – Survived Outcome – Died
7.9 days 8.1 days 6.1 days
Table 46. Hospital average length of stay (LOS) at Nepean District Hospital, Penrith
Outcome – All Outcome – Survived Outcome – Died
17.1 days 18.3 days 6.9 days
Table 47. Transfer in admissions to Nepean District Hospital, Penrith
Transferring hospital Number of transfers
Blue Mountains Hospital 5
Forbes Hospital 1
Hawkesbury Hospital 4
Lithgow Hospital 2
Mudgee Hospital 1
Narromine Hospital 1
Orange Hospital 3

NSW Health NSW Trauma Minimum Data Set – 2002 Annual Report 31
Individual trauma service summaries
Prince of Wales Hospital
Table 48. Admissions and deaths –Prince of Wales Hospital
Total admissions 122
Survived 101 (83% of total)
Died 21 (17% of total)
Direct admission 87 (71% of total)
Transfer in admission 35 (29% of total)
Monthly average 10
Table 49. Admissions by age range – Prince of Wales Hospital
Age range Count % of total
0-14 0 0
15-24 30 25
25-34 26 21
35-44 20 16
45-54 13 11
55-64 7 6
65-74 11 9
75-84 12 10
85-94 3 2
Table 50. Admissions by gender –Prince of Wales Hospital
Gender Count % of total
Female 26 21%
Male 96 79%
Figure 54. Trauma admissions to Prince of WalesHospital by age and gender

NSW Trauma Minimum Data Set – 2002 Annual Report NSW Health32
Table 51. Trauma admissions to Prince of WalesHospital by mechanism of injury
Mechanism Count % of total
Medium fall 1-5m 19 16
MB rider 14 11
High fall > 5m 12 10
MV driver 12 10
Pedestrian 10 8
Low fall < 1m 9 7
MV passenger 8 7
Assault 7 6
Other 6 5
Stabbing 6 5
Recreation 5 4
Industrial 4 3
Pedal cyclist 3 2
Shooting 3 2
Sport 3 2
Burns 1 1
Table 52. Trauma admissions to Prince of WalesHospital by arrival mode
Arrival mode Count % of total
Ambulance 80 66
Helicopter 28 23
Private vehicle 1 1
Fixed wing 11 9
Other 2 2
Table 53. Trauma admissions to Prince of WalesHospital by ICU admission
Admission Numberby ICU of admissions % of total
Yes 65 53
No 57 47
Individual trauma service summaries
Table 54. ICU average length of stay (LOS)at Prince of Wales Hospital
Outcome – All Outcome – Survived Outcome – Died
7.4 days 7.9 days 5.2 days
Table 55. Hospital length of stay (LOS) at Prince of Wales Hospital
Outcome – All Outcome – Survived Outcome – Died
18.5 days 20.9 days 6.8 days
Table 56. Transfer in admissions to Prince of Wales Hospital
Transferring hospital Number of transfers
Bourke Hospital 1
Cobar Hospital 1
Coffs Harbour Hospital 3
Crockwell Hospital 1
Dubbo Hospital 1
Gosford Hospital 1
Griffith Base Hospital 1
John Hunter HospitalJohn Hunter Children’s Hospital 1
Kempsey Hospital 2
Lightning Ridge Hospital 2
Liverpool Hospital 2
Manning Base Hospital 1
Milton-Ulladulla Hospital 2
Nepean Hospital 1
Orange Hospital 1
Port Macquarie Hospital 2
Shoalhaven Hospital 4
St George Hospital 2
Sutherland Hospital 1
Wollongong Hospital 5

NSW Health NSW Trauma Minimum Data Set – 2002 Annual Report 33
Individual trauma service summaries
Royal North Shore Hospital
Table 57. Admissions and deaths –Royal North Shore Hospital
Total admissions 230
Survived 179 (78% of total)
Died 51 (22% of total)
Direct admission 152 (66% of total)
Transfer in admission 78 (34% of total)
Monthly average 19
Table 58. Admissions by age range –Royal North Shore Hospital
Age range Count % of total
0-14 10 5
15-24 42 18
25-34 33 14
35-44 21 9
45-54 21 9
55-64 20 9
65-74 22 10
75-84 43 19
85-94 16 7
Table 59. Admissions by gender –Royal North Shore Hospital
Gender Count % of total
Female 63 27%
Male 166 73%
Figure 55. Trauma admissions to Royal NorthShore Hospital by age and gender

NSW Trauma Minimum Data Set – 2002 Annual Report NSW Health34
Table 60. Trauma admissions to Royal NorthShore Hospital by mechanism of injury
Mechanism Count % of total
Medium fall 1-5m 67 29
Low fall < 1m 34 15
Pedestrian 29 13
MV driver 27 12
Burns 14 6
MB rider 13 6
MV passenger 12 5
Pedal cyclist 11 5
High fall > 5m 7 3
Assault 6 3
Industrial 3 1
Recreation 3 1
Other 2 1
Stabbing 2 1
Table 61. Trauma admissions to Royal North Shore Hospital by arrival mode
Arrival mode Count % of total
Ambulance 185 80
Helicopter 37 16
Private vehicle 8 4
Table 62. Trauma admissions to Royal North Shore Hospital by ICU admission
Admission Numberby ICU of admissions % of total
Yes 152 66
No 78 34
Table 63. ICU average length of stay (LOS)at Royal North Shore Hospital
Outcome – All Outcome – Survived Outcome – Died
9.28 days 10.3 days 5 days
Individual trauma service summaries
Table 64. Hospital average length of stay (LOS)at Royal North Shore Hospital
Outcome – All Outcome – Survived Outcome – Died
19.8 days 23.8 days 5.8 days
Table 65. Transfer in admissions to Royal North Shore Hospital
Transferring hospital Number of transfers
Dubbo Hospital 2
John Hunter HospitalJohn Hunter Children’s Hospital 2
Liverpool Hospital 2
Port Macquarie Hospital 2
Bowral Hospital 1
Coffs Harbour Hospital 1
Gosford Hospital 18
Goodooga Rural Hospital 1
Griffith Base Hospital 1
Gunnedah Base Hospital 1
Hornsby Hospital 3
Manly Hospital 8
Manning Base Hospital 1
Milton-Ulladulla Hospital 1
Mona Vale Hospital 8
Muswellbrook Hospital 1
Narrabri Hospital 1
Nepean Hospital 1
Orange Hospital 1
Ryde Hospital 4
St George Hospital 1
Tamworth Hospital 2
Taree Hospital 1
The San Hospital 3
Wagga Wagga Base Hospital 2
Westmead Hospital 2
Yass District Hospital 1
Wollongong Hospital 3
Wyong Hospital 3

NSW Health NSW Trauma Minimum Data Set – 2002 Annual Report 35
Individual trauma service summaries
Royal Prince Alfred Hospital
Table 66. Admissions and deaths –Royal Prince Alfred Hospital
Total admissions 194
Survived 164 (85% of total)
Died 30 (15% of total)
Direct admission 129 (66% of total)
Transfer in admission 65 (34% of total)
Monthly average 16
Table 67. Admissions by age range –Royal Prince Alfred Hospital
Age range Count % of total
0-14 3 2
15-24 38 20
25-34 35 18
35-44 36 19
45-54 17 9
55-64 20 10
65-74 21 11
75-84 16 8
85-94 6 3
Table 68. Admissions by gender –Royal Prince Alfred Hospital
Gender Count % of total
Female 55 29%
Male 137 71%
Figure 56. Trauma admissions to Royal Prince Alfred Hospital by age and gender
Table 69. Trauma admissions to Royal Prince Alfred Hospital by mechanism of injury
Mechanism Count % of Total
Low fall < 1m 50 26
Pedestrian 27 14
MV driver 26 13
Assault 20 10
Medium fall 1-5m 16 8
Other 13 7
MB rider 12 6
MV passenger 7 4
High fall > 5m 5 3
Stabbing 5 3
Shooting 3 2
Sport 3 2
Horse 2 1
Pedal cyclist 2 1
Train 2 1
Recreation 1 1
Low fall < 1m 50 26
Pedestrian 27 14
MV driver 26 13

NSW Trauma Minimum Data Set – 2002 Annual Report NSW Health36
Table 70. Trauma admissions to Royal Prince Alfred Hospital by arrival mode
Arrival mode Count % of total
Ambulance 127 66
Helicopter 53 27
Private vehicle 13 7
Table 71. Trauma admissions to Royal Prince Alfred Hospital by ICU admission
Admission Numberby ICU of admissions % of total
Yes 151 78
No 43 22
Table 72. ICU average length of stay (LOS) at Royal Prince Alfred Hospital
Outcome – All Outcome – Survived Outcome – Died
5.5 days 5.5 days 5.4 days
Table 73. Hospital average length of stay (LOS) at Royal Prince Alfred Hospital
Outcome – All Outcome – Survived Outcome – Died
13.5 days 15.1 days 5.2 days
Individual trauma service summaries
Table 74. Transfer In admissions to Royal Prince Alfred Hospital
Transferring hospital Number of transfers
Auburn Hospital 1
Balmain Hospital 3
Bathurst Hospital 3
Bega Hospital 1
Brewarrina Hospital 3
Canterbury Hospital 3
Coffs Harbour Hospital 4
Concord Hospital 1
Coonamble Hospital 1
Dubbo Hospital 9
Gloucester Soldiers Hospital 1
Goulburn Hospital 1
Griffith Base Hospital 1
Hornsby Hospital 1
Kempsey Hospital 1
Manning Base Hospital 2
Moree Hospital 1
Nepean Hospital 2
Noumea Hospital 1
Nowra Hospital 1
Orange Hospital 2
Parkes Hospital 1
Port Macquarie Hospital 2
Prince of Wales Hospital 1
Royal North Shore Hospital 1
Shoalhaven Hospital 1
St Vincents Hospital 3
Sutherland Hospital 1
Sydney Children’s Hospital Hospital 1
Wagga Wagga Base Hospital 3
Walgett Hospital 3
Tamworth Hospital 2
Wollongong Hospital 2
Wyong Hospital 1

NSW Health NSW Trauma Minimum Data Set – 2002 Annual Report 37
Individual trauma service summaries
St George Hospital
Table 75. Admissions and deaths – St George Hospital
Total admissions 162
Survived 136 (84% of total)
Died 26 (16% of total)
Direct admission 127 (78% of total)
Transfer in admission 35 (22% of total)
Monthly average 14
Table 76. Admissions by age range –St George Hospital
Age range Count % of total
0-14 5 3
15-24 34 21
25-34 21 13
35-44 22 14
45-54 11 7
55-64 20 12
65-74 21 13
75-84 20 12
85-94 7 4
95 and older 1 1
Table 77. Admissions by gender – St George Hospital
Gender Count % of total
Female 47 29%
Male 115 71%
Figure 57. Trauma admissions to St George Hospitalby age and gender

NSW Trauma Minimum Data Set – 2002 Annual Report NSW Health38
Table 78. Trauma admissions to St George Hospitalby mechanism of injury
Mechanism Count % of total
Medium fall 1-5m 43 27
MV driver 33 20
MV passenger 16 10
Pedestrian 16 10
Assault 13 8
MB rider 9 6
Pedal cyclist 8 5
Stabbing 7 4
Burns 4 2
Other 3 2
Horse 2 1
Shooting 2 1
High fall > 5m 1 1
Low fall < 1m 1 1
MB pillion 1 1
Recreation 1 1
Sport 1 1
Train 1 1
Table 79. Trauma admissions to St George Hospitalby arrival mode
Arrival mode Count % of total
Ambulance 113 70
Helicopter 26 16
Private vehicle 10 6
Fixed wing 11 7
Other 1 <1%
Table 80. Trauma admissions to St George Hospitalby ICU admission
Admission Numberby ICU of admissions % of total
Yes 82 52
No 77 48
Individual trauma service summaries
Table 81. ICU average length of stay (LOS) at St George Hospital
Outcome – All Outcome – Survived Outcome – Died
7.53 days 7.9 days 5.8 days
Table 82. Hospital average length of stay (LOS) at St George Hospital
Outcome – All Outcome – Survived Outcome – Died
18.6 days 21.4 days 4.7 days
Table 83. Transfer In admissions to St George Hospital
Transferring hospital Number of transfers
Bathurst Hospital 3
Canberra Hospital 1
Coffs Harbour Hospital 3
Dubbo Hospital 2
Goulburn Hospital 1
Griffith Base Hospital 1
Inverell Hospital 1
John Hunter HospitalJohn Hunter Children’s Hospital 1
Kareena Hospital 1
Kempsey Hospital 1
Leeton Hospital 1
Narrabri Hospital 2
Norfolk Island Hospital 1
Nowra Hospital 1
Shoalhaven Hospital 2
Sutherland Hospital 5
Taree Hospital 1
Ulladulla Hospital 1
Wollongong Hospital 6

NSW Health NSW Trauma Minimum Data Set – 2002 Annual Report 39
Individual trauma service summaries
St Vincent’s Hospital
Table 84. Admissions and deaths –St Vincent’s Hospital
Total admissions 123
Survived 99 (80% of total)
Died 24 (20% of total)
Direct admission 109 (89% of total)
Transfer in admission 14 (11% of total)
Monthly average 10
Table 85. Admissions by age range – St Vincent’s Hospital
Age range Count % of total
0-14 35 28
15-24 14 11
25-34 19 15
35-44 14 11
45-54 10 8
55-64 7 6
65-74 10 8
75-84 12 10
85-94 2 2
95 and over 35 28
Table 86. Admissions by gender – St Vincent’s Hospital
Gender Count % of total
Female 34 28%
Male 89 72%
Figure 58. Trauma admissions to St Vincent’s Hospitalby age and gender

NSW Trauma Minimum Data Set – 2002 Annual Report NSW Health40
Table 87.Trauma admissions to St Vincent’s Hospitalby mechanism of injury
Mechanism Count % of total
Medium fall 1-5m 46 37
Pedestrian 25 20
MV driver 12 10
Assault 10 8
Stabbing 7 6
Other 5 4
Pedal cyclist 4 3
Burns 3 2
MV passenger 3 2
Shooting 3 2
High fall > 5m 2 2
MB rider 1 1
Recreation 1 1
Sport 1 1
Table 88. Trauma admissions to St Vincent’s Hospitalby arrival mode
Arrival mode Count % of total
Ambulance 112 91
Fixed wing 5 4
Private vehicle 5 4
Other 1 1
Table 89. Trauma admissions to St Vincent’s Hospitalby ICU admission
Admission Numberby ICU of admissions % of total
Yes 66 54
No 57 46
Individual trauma service summaries
Table 90. ICU average length of stay (LOS) at St Vincent’s Hospital
Outcome – All Outcome – Survived Outcome – Died
9.5 days 10.1 days 6.9 days
Table 91. Hospital average length of stay (LOS)at St Vincent’s Hospital
Outcome – All Outcome – Survived Outcome – Died
17.7 days 20.6 days 5.8 days
Table 92. Transfer In admissions to St Vincent’s Hospital
Transferring hospital Number of transfers
Flinders Hospital – SA 1
Griffith Base Hospital 1
Parkes Hospital 1
Princess Alexandra Hospital 1
Royal North Shore Hospital 1
Shoalhaven Hospital 1
Sydney Hospital 3
Wagga Wagga Base Hospital 3
Wollongong Hospital 2

NSW Health NSW Trauma Minimum Data Set – 2002 Annual Report 41
Individual trauma service summaries
Sydney Children’s Hospital
Table 93. Admissions and deaths –Sydney Children’s Hospital
Total admissions 31
Survived 29 (94% of total)
Died 2 (6% of total)
Direct admission 8 (26% of total)
Transfer in admission 23 (74% of total)
Monthly average 3
Table 94. Admissions by age range (general agegroups), Sydney Children’s Hospital
Age range Count % of total
0-14 30 97
15-24 1 3
Table 95. Admissions by gender – Sydney Children’s Hospital
Gender Count % of total
Female 10 32%
Male 21 68%
Figure 59. Trauma admissions to Sydney Children’sHospital by age and gender
NSW Trauma Minimum Data Set – 2002 Annual Report NSW Health42
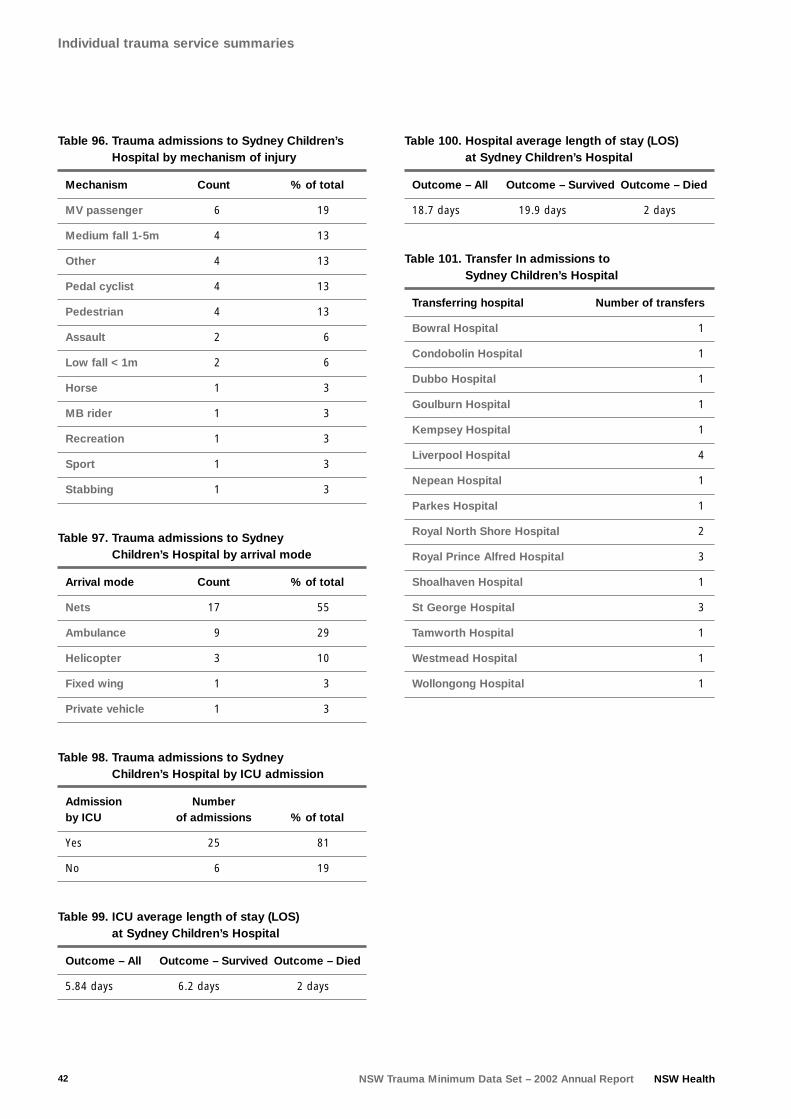
Table 96. Trauma admissions to Sydney Children’sHospital by mechanism of injury
Mechanism Count % of total
MV passenger 6 19
Medium fall 1-5m 4 13
Other 4 13
Pedal cyclist 4 13
Pedestrian 4 13
Assault 2 6
Low fall < 1m 2 6
Horse 1 3
MB rider 1 3
Recreation 1 3
Sport 1 3
Stabbing 1 3
Table 97. Trauma admissions to Sydney Children’s Hospital by arrival mode
Arrival mode Count % of total
Nets 17 55
Ambulance 9 29
Helicopter 3 10
Fixed wing 1 3
Private vehicle 1 3
Table 98. Trauma admissions to Sydney Children’s Hospital by ICU admission
Admission Numberby ICU of admissions % of total
Yes 25 81
No 6 19
Table 99. ICU average length of stay (LOS) at Sydney Children’s Hospital
Outcome – All Outcome – Survived Outcome – Died
5.84 days 6.2 days 2 days
Individual trauma service summaries
Table 100. Hospital average length of stay (LOS)at Sydney Children’s Hospital
Outcome – All Outcome – Survived Outcome – Died
18.7 days 19.9 days 2 days
Table 101. Transfer In admissions to Sydney Children’s Hospital
Transferring hospital Number of transfers
Bowral Hospital 1
Condobolin Hospital 1
Dubbo Hospital 1
Goulburn Hospital 1
Kempsey Hospital 1
Liverpool Hospital 4
Nepean Hospital 1
Parkes Hospital 1
Royal North Shore Hospital 2
Royal Prince Alfred Hospital 3
Shoalhaven Hospital 1
St George Hospital 3
Tamworth Hospital 1
Westmead Hospital 1
Wollongong Hospital 1

NSW Health NSW Trauma Minimum Data Set – 2002 Annual Report 43
Individual trauma service summaries
The Children’s Hospital at Westmead
Table 102. Admissions and deaths –The Children’s Hospital at Westmead
Total admissions 71
Survived 63 (86% of total)
Died 8 (14% of total)
Direct admission 13 (18% of total)
Transfer in admission 58 (82% of total)
Monthly average 6
Table 103. Admissions by age range (general age groups) –The Children’s Hospital at Westmead
Age range Count % of total
0-14 68 96
15-24 3 4
Table 104. Admissions by gender –The Children’s Hospital at Westmead
Gender Count % of total
Female 26 37%
Male 45 63%
Figure 60. Trauma admissions to The Children’sHospital at Westmead by age and gender
Table 105. Trauma admissions to The Children’s Hospital at Westmead by mechanism of injury
Mechanism Count % of total
Pedestrian 13 18
MV passenger 11 15
Burns 10 14
Low fall < 1m 9 13
Medium fall 1-5m 8 11
Pedal cyclist 8 11
MB Rider 4 6
Assault 2 3
High fall > 5m 2 3
MV driver 2 3
Other 1 1
Shooting 1 1

NSW Trauma Minimum Data Set – 2002 Annual Report NSW Health44
Table 106. Trauma admissions to The Children’sHospital at Westmead by arrival mode
Arrival mode Count % of total
Nets 39 56
Ambulance 25 35
Helicopter 5 7
Fixed Wing 1 1
Private Vehicle 1 1
Table 107. Trauma admissions to The Children’sHospital at Westmead by ICU admission
Admission Numberby ICU of admissions % of total
Yes 48 68
No 23 32
Table 108. ICU average length of stay (LOS) at The Children’s Hospital at Westmead
Outcome – All Outcome – Survived Outcome – Died
7 days 7.7 days 2 days
Table 109. Hospital average length of stay (LOS) atThe Children’s Hospital at Westmead
Outcome – All Outcome – Survived Outcome – Died
15.3 days 16.8 days 3.6 days
Individual trauma service summaries
Table 110. Transfer In admissions to The Children’s Hospital at Westmead
Transferring hospital Number of transfers
Auburn Hospital 1
Bankstown Hospital 2
Bathurst Hospital 2
Bourke Hospital 1
Campbelltown Hospital 2
Canberra Hospital 1
Coffs Harbour Hospital 2
Cowra Hospital 2
Dubbo Hospital 2
Fiji Hospital 1
Forbes Hospital 1
Gosford Hospital 5
Hay Hospital 1
John Hunter HospitalJohn Hunter Children’s Hospital 2
Kempsey Hospital 1
Liverpool Hospital 5
Mona Vale Hospital 3
Moree Hospital 1
Mt Druitt Hospital 2
Mudgee Hospital 2
Nepean Hospital 3
Noumea Hospital 2
Orange Hospital 2
Port Macquarie Hospital 1
Royal North Shore Hospital 2
Royal Prince Alfred Hospital 2
Shoalhaven Hospital 1
St George Hospital 1
Tamworth Hospital 1
Terrigal Hospital 1
Wagga Wagga Base Hospital 1
Westmead Hospital 1
Wyndham Hospital 1

NSW Health NSW Trauma Minimum Data Set – 2002 Annual Report 45
Individual trauma service summaries
Westmead Hospital
Table 111. Admissions and deaths –Westmead Hospital
Total admissions 212
Survived 187 (88% of total)
Died 25 (12% of total)
Direct admission 173 (81% of total)
Transfer in admission 39 (19% of total)
Monthly average 18
Table 112. Admissions by age range –Westmead Hospital
Age range Count % of total
0-14 1 <1
15-24 45 21
25-34 46 22
35-44 34 16
45-54 29 14
55-64 11 5
65-74 28 13
75-84 10 4
85-94 5 2
95 and over 2 1
Table 113. Admissions by gender – Westmead Hospital
Gender Count % of total
Female 47 22%
Male 165 78%
Figure 61. Trauma admissions to Westmead Hospitalby age and gender

NSW Trauma Minimum Data Set – 2002 Annual Report NSW Health46
Table 114. Trauma admissions to Westmead Hospitalby mechanism of injury
Mechanism Count % of total
MV driver 56 27
Medium fall 1-5m 36 17
MV passenger 19 9
Pedestrian 19 9
MB rider 17 8
Assault 15 7
Industrial 10 5
Pedal cyclist 9 4
Stabbing 8 4
Other 6 3
Low fall < 1m 4 2
Burns 3 1
Sport 3 1
High fall > 5m 2 1
Horse 1 < 1%
MB pillion 1 < 1%
Train 1 < 1%
MV driver 56 27
Medium fall 1-5m 36 17
MV passenger 19 9
Pedestrian 19 9
Table 115. Trauma admissions to Westmead Hospitalby arrival mode
Arrival mode Count % of total
Ambulance 173 82
Helicopter 31 15
Private vehicle 4 2
Table 116. Trauma admissions to Westmead Hospitalby ICU admission
Admission Numberby ICU of admissions % of total
Yes 84 40
No 128 60
Individual trauma service summaries
Table 117. ICU average length of stay (LOS) at Westmead Hospital
Outcome – All Outcome – Survived Outcome – Died
9.4 days 10.2 days 4.4 days
Table 118. Hospital average length of stay (LOS) at Westmead Hospital
Outcome – All Outcome – Survived Outcome – Died
18.4 days 20.1 days 5.9 days
Table 119. Transfer in admissions to Westmead Hospital
Transferring hospital Number of transfers
Blacktown Hospital 12
Mt Druitt Hospital 7
Gosford Hospital 3
Wollongong Hospital 3
Auburn Hospital 1
Bathurst Hospital 1
Blank Hospital 1
Blacktown Hospital 12
Blue Mountains Hospital 1
Cowra Hospital 1
Dubbo Hospital 1
Forbes Hospital 1
Katoomba Hospital 1
Nepean Hospital 1
Parkes Hospital 1
Sutherland Hospital 1
The Children’s Hospital at Westmead 1
The San Hospital 1
Wagga Wagga Base Hospital 1

Appendix 1
NSW Trauma System – Minimum Data Set
All trauma admissions with ISS >15 or ICU Admission or death(Exclude # NOF Death)
Data collection form
Hospital name
Gender male / female
Age
Residential postcode
Injury postcode
Date of injury \ \
Time of injury :
Mechanism
Place of injury home / not at home
Date of arrival \ \ (at your hospital)
Time of arrival : (at your hospital)
Mode of arrival (at your hospital)
Transfer in? yes / no
Transfer from
Op suite at first hospital? yes / no
If yes, type of OS at first hospital
Transfer out? yes / no
Transferred to
Transfer out reason (burns, paediatric, spinal, other)
Op suite first 24 hrs? yes / no
If yes, type of OS
ICU admit? yes / no
ICU LOS (patient days)
Outcome? survived / died
AIS body regions
ISS
Length of stay (LOS) (total Hospital LOS in patient days)
NSW Health NSW Trauma Minimum Data Set – 2002 Annual Report 47

NSW Trauma Minimum Data Set – 2002 Annual Report NSW Health48
Data dictionary
Mechanism ■ MVC driver
■ MVC pass
■ MBC rider
■ MBC pillion
■ Pedestrian
■ Pedal cyclist
■ Fall <1m
■ Fall 1-5m
■ Fall >5m
■ Shooting
■ Stabbing
■ Blunt assault
■ Organised sport
■ Recreational sport
■ Burns
■ Industrial – includes all work related
■ Horse
■ Other – specify
Mode of arrival■ Ambulance
■ Helicopter
■ Private vehicle
■ Fixed wing
■ NETS
■ Other
AIS body regionsList three most injured, ie the ones used to calculate
the ISS.
Type of OS ■ Craniotomy
■ Thoracotomy
■ Laparotomy
■ Open ext#
■ Other – specify
Length of stay (LOS)If LOS is >6 weeks then put >42 days.
Appendix 1

Index of figures
Figure 1. Total trauma admissions to each trauma service for 2002 with ISS > 15.........................................................7
Figure 2. Trauma admissions to all trauma services by age ............................................................................................7
Figure 3. Trauma admissions to all trauma services for 2002 by age and gender...........................................................7
Figure 4. Trauma admissions to each trauma service by admission type (ie direct from scene or transfer
into the trauma service from another hospital) ...............................................................................................7
Figure 5. Percentage of admission types for all trauma admissions to each trauma service direct from scene or
transferred from another hospital to a trauma service ....................................................................................8
Figure 6. Percentage of inter-AHS (from one hospital to another in a different AHS) and intra-AHS (from
one hospital to another within the same AHS) transfers for all trauma admissions to each trauma service .....8
Figure 7. Trauma admissions to all trauma services by mechanism of injury...................................................................8
Figure 8. Trauma admissions to all trauma services by mechanism of injury and outcome (survived or died)..................9
Figure 9. Trauma admissions to all trauma services showing outcome percentages by mechanism of injury ..................9
Figure 10. Trauma admissions to all trauma services showing injury region percentages by mechanism of injury.............9
Figure 11. Motor vehicle accident related trauma patient admissions to all trauma services by gender and age group..10
Figure 12. Motor vehicle accident related trauma patient admissions to all trauma services by hour of day
that injury occurred ......................................................................................................................................10
Figure 13. Motor vehicle accident related trauma patient admissions to all trauma services by day of week that
injury occurred for 2002...............................................................................................................................10
Figure 14. Motor Bike accident related trauma patient admissions to all trauma services by age and gender ................11
Figure 15. Motor Bike accident related trauma patient admissions to all trauma services by hour of day that
injury occurred .............................................................................................................................................11
Figure 16. Motor bike accident related trauma patient admissions to all trauma services by day of week for 2002.......11
Figure 17. Pedestrian trauma patient admissions to all trauma services by age and gender...........................................12
Figure 18. Pedestrian trauma patient admissions to all trauma services by hour of day that injury occurred ..................12
Figure 19. Pedestrian trauma patient admissions to all trauma services by day of week that injury occurred .................12
Figure 20. Low to medium fall (<5m) trauma patient admissions to all trauma services by age and gender ..................13
Figure 21. Low to medium fall (<5m) trauma patient admissions to all trauma services by hour of day that
injury occurred .............................................................................................................................................13
Figure 22. Low to medium fall (<5m) trauma patient admissions to all trauma services by day of week that
injury occurred .............................................................................................................................................13
Figure 23. High fall (5m or greater) trauma patient admissions to all trauma services by age and gender .....................14
Figure 24. Pedal cycle trauma patient admissions to all trauma services by age and gender ..........................................14
Figure 25. Pedal cycle trauma patient admissions to all trauma services by hour of day that injury occurred .................14
Figure 26. Pedal cycle trauma patient admissions to all trauma services by day of week that injury occurred ................15
Figure 27. Blunt assault trauma patient admissions to all trauma services by age and gender .......................................15
Figure 28. Shooting trauma patient admissions to all trauma services by age and gender.............................................15
NSW Health NSW Trauma Minimum Data Set – 2002 Annual Report 49

NSW Trauma Minimum Data Set – 2002 Annual Report NSW Health50
FFigure 29.Stabbing trauma patient admissions to all trauma services by age and gender .............................................15
Figure 30. Arrival mode percentages for trauma admissions to all trauma services. .......................................................16
Figure 31. Arrival mode percentages for direct from scene admissions to all trauma services ........................................16
Figure 32. Arrival mode percentages for transfer in trauma admissions to all trauma services .......................................17
Figure 33. Trauma admissions admitted to operating suite within 24 hours of admission for all trauma services. ..........17
Figure 34. Outcomes for operating suite procedures for trauma admissions to all trauma services ................................17
Figure 35. ICU admissions by month for trauma admissions to all trauma services ........................................................18
Figure 36. ICU admissions by age for trauma admissions to all trauma services.............................................................18
Figure 37. ICU admission percentages by arrival mode for trauma admissions to all trauma services.............................18
Figure 38. Injury region percentages by admission type for trauma patient admissions to all trauma services................19
Figure 39. Injury Region percentages by age for trauma patient admissions to all trauma services ................................19
Figure 40. Injury regions by age for trauma patient admissions to all trauma services. ..................................................19
Figure 41. Injury severity score (ISS) range by age for trauma patient admissions to all trauma services.........................20
Figure 42. ISS range percentages by gender for trauma patient admissions to all trauma services.................................20
Figure 43. ISS range by arrival mode for trauma patient admissions to all trauma services. ...........................................20
Figure 44. Hospital average length of stay (LOS) by age and gender for surviving trauma admissions to
all trauma services. .......................................................................................................................................21
Figure 45. Hospital average length of stay (LOS) by age and gender for deceased trauma admissions to
all trauma services. .......................................................................................................................................21
Figure 46. Paediatric admissions to each trauma service................................................................................................22
Figure 47. Paediatric admissions to each trauma service by gender ...............................................................................22
Figure 48. Admissions to each designated Paediatric Major trauma service by admission type. .....................................23
Figure 49. Admissions to each designated Paediatric Major trauma service by admission type percentage. ...................23
Figure 50. Paediatric patient admissions to all trauma service by mechanism of injury. ..................................................23
Figure 51. Trauma admissions to John Hunter Hospital / John Hunter Children’s Hospital by age and gender................25
Figure 52. Trauma admissions to Liverpool Hospital by age and gender ........................................................................27
Figure 53. Trauma admissions to Nepean District Hospital, Penrith by age and gender..................................................29
Figure 54. Trauma admissions to Prince of Wales Hospital by age and gender ..............................................................31
Figure 55. Trauma admissions to Royal North Shore Hospital by age and gender ..........................................................33
Figure 56. Trauma admissions to Royal Prince Alfred Hospital by age and gender .........................................................35
Figure 57. Trauma admissions to St George Hospital by age and gender.......................................................................37
Figure 58. Trauma admissions to St Vincent’s Hospital by age and gender ....................................................................39
Figure 59. Trauma admissions to Sydney Children’s Hospital by age and gender ...........................................................41
Figure 60. Trauma admissions to The Children’s Hospital at Westmead by age and gender ...........................................43
Figure 61. Trauma admissions to Westmead Hospital by age and gender......................................................................45
Index of figures
Index of tables
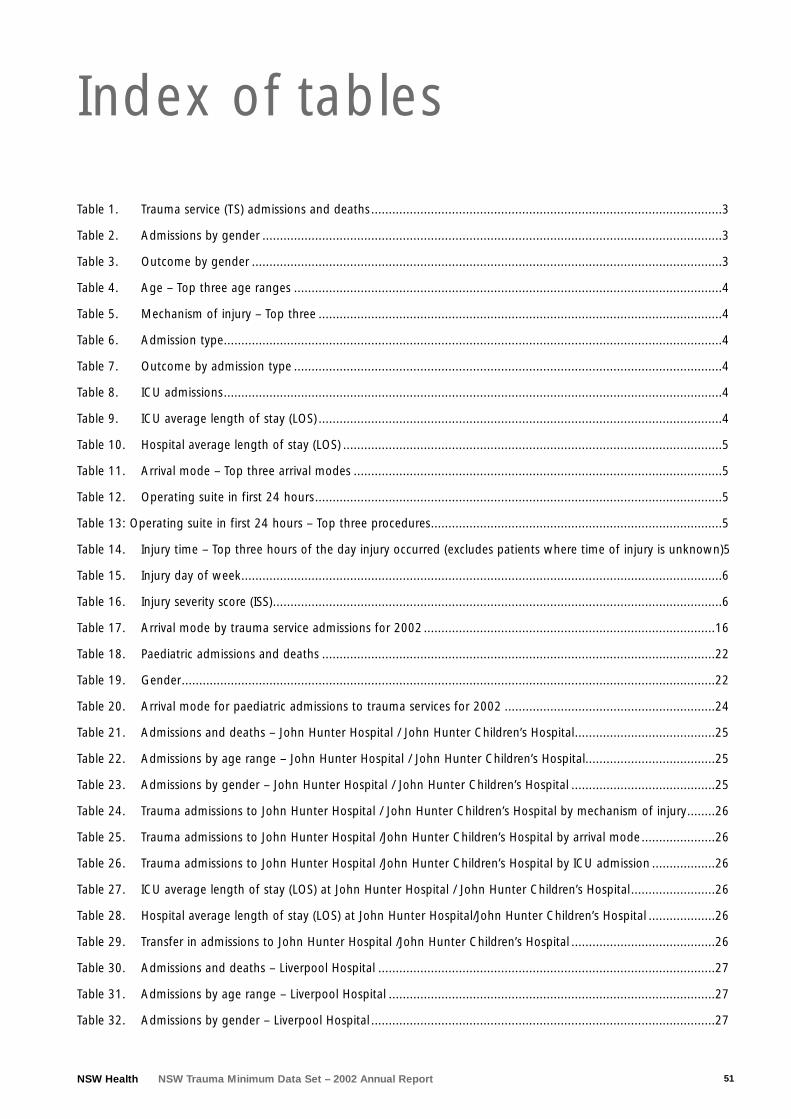
NSW Health NSW Trauma Minimum Data Set – 2002 Annual Report 51
Table 1. Trauma service (TS) admissions and deaths ....................................................................................................3
Table 2. Admissions by gender ...................................................................................................................................3
Table 3. Outcome by gender ......................................................................................................................................3
Table 4. Age – Top three age ranges ..........................................................................................................................4
Table 5. Mechanism of injury – Top three ...................................................................................................................4
Table 6. Admission type..............................................................................................................................................4
Table 7. Outcome by admission type ..........................................................................................................................4
Table 8. ICU admissions..............................................................................................................................................4
Table 9. ICU average length of stay (LOS) ...................................................................................................................4
Table 10. Hospital average length of stay (LOS) ............................................................................................................5
Table 11. Arrival mode – Top three arrival modes .........................................................................................................5
Table 12. Operating suite in first 24 hours....................................................................................................................5
Table 13: Operating suite in first 24 hours – Top three procedures...................................................................................5
Table 14. Injury time – Top three hours of the day injury occurred (excludes patients where time of injury is unknown)5
Table 15. Injury day of week.........................................................................................................................................6
Table 16. Injury severity score (ISS)................................................................................................................................6
Table 17. Arrival mode by trauma service admissions for 2002 ...................................................................................16
Table 18. Paediatric admissions and deaths ................................................................................................................22
Table 19. Gender........................................................................................................................................................22
Table 20. Arrival mode for paediatric admissions to trauma services for 2002 ............................................................24
Table 21. Admissions and deaths – John Hunter Hospital / John Hunter Children’s Hospital........................................25
Table 22. Admissions by age range – John Hunter Hospital / John Hunter Children’s Hospital.....................................25
Table 23. Admissions by gender – John Hunter Hospital / John Hunter Children’s Hospital .........................................25
Table 24. Trauma admissions to John Hunter Hospital / John Hunter Children’s Hospital by mechanism of injury........26
Table 25. Trauma admissions to John Hunter Hospital /John Hunter Children’s Hospital by arrival mode.....................26
Table 26. Trauma admissions to John Hunter Hospital /John Hunter Children’s Hospital by ICU admission ..................26
Table 27. ICU average length of stay (LOS) at John Hunter Hospital / John Hunter Children’s Hospital........................26
Table 28. Hospital average length of stay (LOS) at John Hunter Hospital/John Hunter Children’s Hospital ...................26
Table 29. Transfer in admissions to John Hunter Hospital /John Hunter Children’s Hospital .........................................26
Table 30. Admissions and deaths – Liverpool Hospital ................................................................................................27
Table 31. Admissions by age range – Liverpool Hospital .............................................................................................27
Table 32. Admissions by gender – Liverpool Hospital ..................................................................................................27

NSW Trauma Minimum Data Set – 2002 Annual Report NSW Health52
Table 33. Trauma admissions to Liverpool Hospital by mechanism of injury ................................................................28
Table 34. Trauma admissions to Liverpool Hospital by arrival mode.............................................................................28
Table 35. Trauma admissions to Liverpool Hospital by ICU admission..........................................................................28
Table 36. ICU average length of stay (LOS) at Liverpool Hospital ................................................................................28
Table 37. Hospital average length of stay (LOS) at Liverpool Hospital..........................................................................28
Table 38. Transfer In admissions to Liverpool Hospital.................................................................................................28
Table 39. Admissions and deaths – Nepean District Hospital, Penrith..........................................................................29
Table 40. Admissions by age range – Nepean District Hospital, Penrith.......................................................................29
Table 41. Admissions by gender – Nepean District Hospital, Penrith ...........................................................................29
Table 42. Trauma admissions to Nepean District Hospital, Penrith by mechanism of injury..........................................30
Table 43. Trauma admissions to Nepean District Hospital, Penrith by arrival mode......................................................30
Table 44. Trauma admissions to Nepean District Hospital, Penrith by ICU admission ...................................................30
Table 45. ICU average length of stay (LOS) at Nepean District Hospital, Penrith ..........................................................30
Table 46. Hospital average length of stay (LOS) at Nepean District Hospital, Penrith ...................................................30
Table 47. Transfer In admissions to Nepean District Hospital, Penrith ..........................................................................30
Table 48. Admissions and deaths – Prince of Wales Hospital.......................................................................................31
Table 49. Admissions by age range – Prince of Wales Hospital ...................................................................................31
Table 50. Admissions by gender – Prince of Wales Hospital ........................................................................................31
Table 51. Trauma admissions to Prince of Wales Hospital by mechanism of injury .....................................................32
Table 52. Trauma admissions to Prince of Wales Hospital by arrival mode...................................................................32
Table 53. Trauma admissions to Prince of Wales Hospital by ICU admission................................................................32
Table 54. ICU average length of stay (LOS) at Prince of Wales Hospital.......................................................................32
Table 55. Hospital length of stay (LOS) at Prince of Wales Hospital .............................................................................32
Table 56. Transfer In admissions to Prince of Wales Hospital .......................................................................................32
Table 57. Admissions and deaths – Royal North Shore Hospital ..................................................................................33
Table 58. Admissions by age range – Royal North Shore Hospital ...............................................................................33
Table 59. Admissions by gender – Royal North Shore Hospital ....................................................................................33
Table 60. Trauma admissions to Royal North Shore Hospital by mechanism of injury ..................................................34
Table 61. Trauma admissions to Royal North Shore Hospital by arrival mode ..............................................................34
Table 62. Trauma admissions to Royal North Shore Hospital by ICU admission............................................................34
Table 63. ICU average length of stay (LOS) at Royal North Shore Hospital ..................................................................34
Table 64. Hospital average length of stay (LOS) at Royal North Shore Hospital............................................................34
Table 65. Transfer in admissions to Royal North Shore Hospital...................................................................................34
Table 66. Admissions and deaths – Royal Prince Alfred Hospital .................................................................................35
Table 67. Admissions by age range – Royal Prince Alfred Hospital ..............................................................................35
Index of tables

NSW Health NSW Trauma Minimum Data Set – 2002 Annual Report 53
Table 68. Admissions by gender – Royal Prince Alfred Hospital ...................................................................................35
Table 69. Trauma admissions to Royal Prince Alfred Hospital by mechanism of injury .................................................35
Table 70. Trauma admissions to Royal Prince Alfred Hospital by arrival mode .............................................................36
Table 71. Trauma admissions to Royal Prince Alfred Hospital by ICU admission...........................................................36
Table 72. ICU average length of stay (LOS) at Royal Prince Alfred Hospital .................................................................36
Table 73. Hospital average length of stay (LOS) at Royal Prince Alfred Hospital...........................................................36
Table 74. Transfer In admissions to Royal Prince Alfred Hospital..................................................................................36
Table 75. Admissions and deaths – St George Hospital...............................................................................................37
Table 76. Admissions by age range – St George Hospital............................................................................................37
Table 77. Admissions by gender – St George Hospital ................................................................................................37
Table 78. Trauma admissions to St George Hospital by mechanism of injury...............................................................38
Table 79. Trauma admissions to St George Hospital by arrival mode...........................................................................38
Table 80. Trauma admissions to St George Hospital by ICU admission ........................................................................38
Table 81. ICU average length of stay (LOS) at St George Hospital...............................................................................38
Table 82. Hospital average length of stay (LOS) at St George Hospital ........................................................................38
Table 83. Transfer In admissions to St George Hospital ...............................................................................................38
Table 84. Admissions and deaths – St Vincent’s Hospital ............................................................................................39
Table 85. Admissions by age range – St Vincent’s Hospital .........................................................................................39
Table 86. Admissions by gender – St Vincent’s Hospital ..............................................................................................39
Table 87. Trauma admissions to St Vincent’s Hospital by mechanism of injury ............................................................40
Table 88. Trauma admissions to St Vincent’s Hospital by arrival mode.........................................................................40
Table 89. Trauma admissions to St Vincent’s Hospital by ICU admission......................................................................40
Table 90. ICU average length of stay (LOS) at St Vincent’s Hospital.............................................................................40
Table 91. Hospital average length of stay (LOS) at St Vincent’s Hospital......................................................................40
Table 92. Transfer In admissions to St Vincent’s Hospital.............................................................................................40
Table 93. Admissions and deaths – Sydney Children’s Hospital ...................................................................................41
Table 94. Admissions by age range (general age groups), Sydney Children’s Hospital .................................................41
Table 95. Admissions by gender – Sydney Children’s Hospital .....................................................................................41
Table 96. Trauma admissions to Sydney Children’s Hospital by mechanism of injury ...................................................42
Table 97. Trauma admissions to Sydney Children’s Hospital by arrival mode ...............................................................42
Table 98. Trauma admissions to Sydney Children’s Hospital by ICU admission.............................................................42
Table 99. ICU average length of stay (LOS) at Sydney Children’s Hospital ...................................................................42
Table 100. Hospital average length of stay (LOS) at Sydney Children’s Hospital.............................................................42
Table 101. Transfer In admissions to Sydney Children’s Hospital....................................................................................42
Table 102. Admissions and deaths – The Children’s Hospital at Westmead ...................................................................43
Index of tables

NSW Trauma Minimum Data Set – 2002 Annual Report NSW Health54
Table 103. Admissions by age range (general age groups) – The Children’s Hospital at Westmead ...............................43
Table 104. Admissions by gender – The Children’s Hospital at Westmead.....................................................................43
Table 105. Trauma admissions to The Children’s Hospital at Westmead by mechanism of injury ...................................43
Table 106. Trauma admissions to The Children’s Hospital at Westmead by arrival mode ...............................................44
Table 107. Trauma admissions to The Children’s Hospital at Westmead by ICU admission ............................................44
Table 108. ICU average length of stay (LOS) at The Children’s Hospital at Westmead ...................................................44
Table 109. Hospital average length of stay (LOS) at The Children’s Hospital at Westmead ............................................44
Table 110. Transfer In admissions to The Children’s Hospital at Westmead ...................................................................44
Table 111. Admissions and deaths – Westmead Hospital ..............................................................................................45
Table 112. Admissions by age range – Westmead Hospital...........................................................................................45
Table 113. Admissions by gender – Westmead Hospital ...............................................................................................45
Table 114. Trauma admissions to Westmead Hospital by mechanism of injury ..............................................................46
Table 115. Trauma admissions to Westmead Hospital by arrival mode ..........................................................................46
Table 116. Trauma admissions to Westmead Hospital by ICU admission .......................................................................46
Table 117. ICU average length of stay (LOS) at Westmead Hospital ..............................................................................46
Table 118. Hospital average length of stay (LOS) at Westmead Hospital .......................................................................46
Table 119. Transfer in admissions to Westmead Hospital ..............................................................................................46
Index of tables

Notes
NSW Health NSW Trauma Minimum Data Set – 2002 Annual Report 55

SHPN (SSD) 040208