nt 24 - texte - afd · daily cocoa income of usd 1.17, which is under the usd 2 a day threshold. as...
TRANSCRIPT

NOTES TECHNIQUES TECHNICAL REPORTS
Country Côte d’Ivoire
Key words Cocoa, farmers livelihoods, agricultural practices
AFD, 5 rue Roland Barthes, 75598 Paris cedex 12, France ̶ +33 1 53 44 31 31 ̶ +33 1 53 44 39 57 [email protected] ̶ http://librairie.afd.fr
December 2016
No. 24
Cocoa farmers’ agricultural practices and livelihoods in Côte d’Ivoire Insights from cocoa farmers and community baseline surveys conducted by Barry Callebaut between 2013 and 2015
Authors Gaëlle Balineau (AFD) Safia Bernath (Barry Callebaut), Vaihei Pahuatini
Coordination Gaëlle Balineau (AFD)

AUTHORS
1 | NOTES TECHNIQUES – N°24 – DÉCEMBRE 2016
AUTHORS
Barry Callebaut sponsored this cocoa farmer study, provided human resources to conduct the analysis, and gave access to farmer data in order to contribute to the professional study and ensure the robustness of the findings. Barry Callebaut in no way influenced the results, but utilized the outcome in order to address the most pressing challenges in the cocoa industry through their sustainability programs. Agence Française de Développement (AFD) contributed to the design of questionnaires and participated in analyzing data collected.
Authors:
Gaëlle Balineau, Research Officer at Agence Française de Développement.
Safia Bernath, Global Monitoring and Evaluation (M&E) Coordinator in the Sustainability Department of Barry Callebaut.
Vaihei Pahuatini, Data Analyst intern in the Sustainability Department of Barry Callebaut.
ORIGINAL LANGUAGE
English
ISSN
2492-2838
COPYRIGHT
4th quarter 2016
DISCLAIMER
The opinions expressed in this paper do not necessarily reflect the position of AFD and Barry Callebaut. Interviews were conducted and data recorded with the oral consent of farmers. Data sources are intentionally left blank when figures, graphs and tables are made by the authors using Barry Callebaut information or data.
Les Notes techniques sont téléchargeables sur le site des publications de l’AFD : http://librairie.afd.fr

Abstract
2 | NOTES TECHNIQUES – N°24 – DÉCEMBRE 2016
Abstract
Cocoa production in Côte d’Ivoire has more than doubled over the last four decades, from 565 thousand tons in 1984 to approximatively 1.5 million tons in recent years. This increase has been mainly due to the expansion of cocoa areas promoted by the government since the 1970s. Today, it is estimated that more than 5 million people depend upon 700,000 cocoa growers for their livelihoods. Besides, between 2002 and 2008, cocoa was one of the few sectors whose growth proved to be ‘pro-poor’. However, cocoa farmers and their households remain very poor. This report provides rough estimate of a per capita daily cocoa income of USD 1.17, which is under the USD 2 a day threshold. As households largely continue to rely on cocoa income as the primary source of cash income, increasing the economic sustainability of cocoa farms via an improvement of yields is thus fundamental for cocoa farmers and households. The major challenge is to improve yields without endangering the environment. However, data and statistics on farmers’ well-being, yields, access to finance, diseases and agricultural practices are scarce, which is a serious constraint to the efficient design and implementation of programs and actions for better cocoa sustainability. To fill this gap, Barry Callebaut carried out a survey in 2013-2014 on more than 700 producers and their plots. This report presents the main descriptive statistics. It confirms that yields are low (435 kg/ha), farms are small (4.87 ha) and old (24 years old), and affected by at least one disease (mainly by stem borer and swollen shoots virus (CSSV) and mirid bugs). The barriers to yield improvements are the insufficient use of fertilizers (including organic fertilizers) due to insufficient financial means, the lack of access to finance and, for replanting, the lack of knowledge of best management practices. However, farmers still find cocoa profitable and do not envisage giving up this crop. When they receive training and means to improve their practices and yields, they are highly satisfactory, suggesting that there is room for improvement of the environmental and economic sustainability of cocoa.

Background and purpose: better data for better cocoa sustainability
3 | NOTES TECHNIQUES – N°24 – DÉCEMBRE 2016
Background and purpose: better data for better cocoa sustainability
I. Sustainability initiatives in the cocoa sector
Governments of the world’s leading cocoa producing countries (see Figure 1), as well as major cocoa and chocolate companies, have recognized that securing a future cocoa supply and improving cocoa farmers’ livelihoods go hand in hand. Stakeholders in the cocoa value chain demonstrated their commitment to work towards a sustainable cocoa economy with the signing of the Abidjan Cocoa Declaration in 2012. More specifically, stakeholders, including governments, companies and civil society organizations “committed to playing [their] part in addressing the key challenges faced by the whole cocoa sector, in particular by providing opportunities for smallholder farmers to move out of poverty and to improve their livelihoods, a necessary condition to achieving sustainability of the sector.”1
Figure 1 - The world's cocoa bean producers, 2014-15 (thousands of tons, and %)
1 The history of cocoa sectors is dotted with public reforms – often supported by donors and multilateral organizations – which have always tried to improve both the efficiency and (export) competitiveness of the cocoa supply chain as well as producers’ prices, without jeopardizing the public finance balance. For more details, see for example Araujo-Bonjean et al., 2001; Gilbert, 2009; Gilbert & Varangis, 2004.

Background and purpose: better data for better cocoa sustainability
4 | NOTES TECHNIQUES – N°24 – DÉCEMBRE 2016
In Côte d’Ivoire, where cocoa accounts for 20% of the gross domestic product, it is estimated that more than 5 million people2 depend upon 700,000 cocoa growers for their livelihoods (Ehrhart, 2015). Moreover, between 2002 and 2008, cocoa was one of the few sectors whose growth proved to be “pro-poor” (UNDP and INS, 2011).
In 2012, the Ivorian government implemented measures to reform the national cocoa sector in order to (i) encourage producers to reinvest in their ageing plantations to increase the sustainability of cocoa production, (ii) guarantee minimum farm-gate prices on a sustainable basis to secure producers’ income, (iii) improve the governance of the value chain and management of the wealth it generates and, (iv) upgrade the value chain through more domestic processing of beans into powder and butter.3
Many non-governmental actors are also involved in the challenges related to sustainability in the cocoa industry and improvements of farmers’ livelihoods. Campaigns against child labor, development programs, such as those supported by donors, non-governmental organizations and private standards, are examples of initiatives being undertaken. UTZ-certified, Rainforest Alliance, and Fairtrade are the most common labels in Côte d’Ivoire and, together with Organic standards, accounted for 22% of the world’s cocoa production in 2012, of which about one-third sold was compliant, representing 10% of global exports (Potts et al., 2014). These initiatives focus on cocoa production and farmers’ livelihoods, and may include health and education benefits, access to financial services, support to strengthen producer’s organizations, and productivity packages.
The world’s leading cocoa and chocolate companies have also committed to improve the sustainability of cocoa through CocoaAction. CocoaAction is a strategy of the World Cocoa Foundation that “brings the world’s leading cocoa and chocolate companies together to sustain the cocoa industry and improve the livelihoods of cocoa farmers. CocoaAction will develop meaningful partnerships between governments, cocoa farmers, and the cocoa industry to boost productivity and strengthen community development in Côte d’Ivoire and Ghana – the largest cocoa producing countries in the world”.4 The main activities will include planting material and fertilizer provision, farmers’ training, and actions at the community level, such as the promotion of primary education, child labor monitoring and remediation, and women's empowerment. The success of those activities will be monitored through common key performance indicators.
2 I.e. almost ¼ of the total population, which stands at 22 million according to the last general census (www.ins.ci). 3 “The reforms are based on three pillars: i) the establishment in January 2012 of a central body, le Conseil du Café-Cacao (CCC), with representatives of all stakeholders, responsible for the management, regulation, development and price stabilization of cocoa; ii) the establishment of a new marketing mechanism involving the forward sale of 70 to 80% of the next year’s crop through twice-daily auctions, and iii) the setting up of a reserve fund at the Central Bank of West African States (BCEAO) to cover risks beyond the normal operations of the price guarantee scheme, in order to support the new marketing arrangements in a fiscally neutral manner”. Source and for further information: CTA/Agritrade, Special report: Côte d’Ivoire’s cocoa sector reforms 2011–2012, 16 December 2012: http://agritrade.cta.int/en/layout/set/print/Agriculture/Commodities/Cocoa/Special-report-Cote-d-Ivoire-s-cocoa-sector-reforms-2011-2012 4 Source: CocoaAction website, http://worldcocoafoundation.org/about-wcf/cocoaaction/

Background and purpose: better data for better cocoa sustainability
5 | NOTES TECHNIQUES – N°24 – DÉCEMBRE 2016
Barry Callebaut, the world’s leading manufacturer of chocolate and cocoa products, has started to integrate sustainability in its long-term strategy by implementing, financing and sourcing cocoa from internal projects (such as QPP, the Cocoa Horizons initiative – see Section I below), or external certification standards (e.g. Rainforest Alliance, UTZ certified, Organic or Fairtrade).
An important step for sustainability integration at Barry Callebaut is the launch of the Cocoa Horizons Foundation in September 2015 with the mission to “improve the livelihoods of cocoa farmers and their communities through the promotion of sustainable, entrepreneurial farming, improved productivity, and community development.”5
The Foundation’s solutions-based approach aligns with the industry’s CocoaAction strategy and focuses on two key pillars to improve cocoa farmers’ livelihoods:
- Productivity: Increase the productivity of farms through farmers’ training, support, and financing;
- Community: Enhance farmers’ community well-being through action regarding education, child protection, women’s empowerment and health.
5 http://www.cocoahorizons.org/our-activities

Background and purpose: better data for better cocoa sustainability
6 | NOTES TECHNIQUES – N°24 – DÉCEMBRE 2016
II. Objectives of this report
The major challenge for improving both cocoa production and the economic viability of cocoa farming is to improve yields without endangering the environment. Low yields, particularly compared to other Asian countries, are sometimes attributed to farmers’ limited knowledge of best agricultural practices, the high prevalence of pests and diseases, the lack of access to finance and inputs, insufficient extension services, and competition with other crops such as rubber. To design innovative and efficient solutions to address complex issues such as financing agriculture or fostering the adoption of innovative and sustainable agricultural practices, both quantitative and qualitative information is needed to gain an in-depth understanding of the problems faced by farmers. Extension agents in the field have this informal knowledge or know-how, and some sustainability projects were evaluated in the past with specific surveys and methods (e.g. COSA, 2013, Lemeilleur et al., 2015).
However, quantitative information on cocoa farmers remains scarce. To fill this gap, Barry Callebaut carried out a baseline survey of more than 700 cocoa farmers and their plots in 2013-2014 with the following objectives:
- Gain a better understanding of cocoa farmers’ socio-economic conditions in light of the lack of reliable existing published data on this segment of the rural population in Côte d’Ivoire. National surveys and censuses have been carried out irregularly due to recurrent conflicts (see Table 1). Qualitative and quantitative information on cocoa farmers may exist, but it is often project-specific.
- Have baseline statistics to:
o Have guidance on target-setting in the context of the implementation of sustainability projects;
o Evaluate the impact and progress achieved by future projects (and completed projects).6
This report first describes surveys carried out between 2013 and 2015, and then provides the main descriptive statistics related to objectives targeted in Barry Callebaut programs, the Cocoa Horizons Foundation, and more generally shared by the cocoa industry through the CocoaAction initiative: Improving livelihoods through an increase in productivity, and an improved well-being within communities.
6 The approach is similar to Ingram et al., 2014; and Hainmueller et al., 2011.

Background and purpose: better data for better cocoa sustainability
7 | NOTES TECHNIQUES – N°24 – DÉCEMBRE 2016
Table 1 - Recent national surveys in Côte d’Ivoire Survey / census Most
recent edition
Previous editions
Link to the last report
RGPH (national census) 2014 1998 http://www.ins.ci/n/templates/docss/RGPH2014D.pdf
EDS-MISC (demographic & health DHS)
2011 2005-2006, 2000 http://www.ins.ci/EDS%20&%20MICS/EDS-MICS2011-2012_Rapport_Final.pdf
ENV (living standards) 2015 2008, 2002, 1998, 1993-1995
http://www.ins.ci/ENV/ENV2015ppp.pdf
Source: Institut national de la statistique, http://www.ins.ci/n/

Data description
8 | NOTES TECHNIQUES – N°24 – DÉCEMBRE 2016
Data description
Between 2013 and 2015, Barry Callebaut conducted two different types of survey: the “cocoa farmers’ survey” and the “communities’ survey”. As the structure of the latter is rather simple, it is described in section I along with main results. This section focuses on the cocoa farmers’ survey, which concerns farms, farmers, households and cooperatives.
I. Selection and sampling issues
The initial objective of the cocoa farmers’ survey was to prepare for the evaluation of projects which are firstly intended to concern cooperatives whose members are known to be willing to test innovations, especially regarding agricultural practices. Back in 2013, these cooperatives were identified by Barry Callebaut as the ones participating in one of the following projects:
- Quality Partner Program group (QPP): an internal Barry Callebaut project which has evolved into the Cocoa Horizons program;7
- Fermicoa group: cooperatives selected to test a product intended to improve the quality of beans through an improved fermentation;
- Certified group: cooperatives which are certified (mainly Rainforest Alliance certification);
- YES group: cooperatives selected in 2013 to test advanced yield enhancing practices. YES stands for “Yield Enhancement Services”. These cooperatives were usually also part of one of the three previous programs.
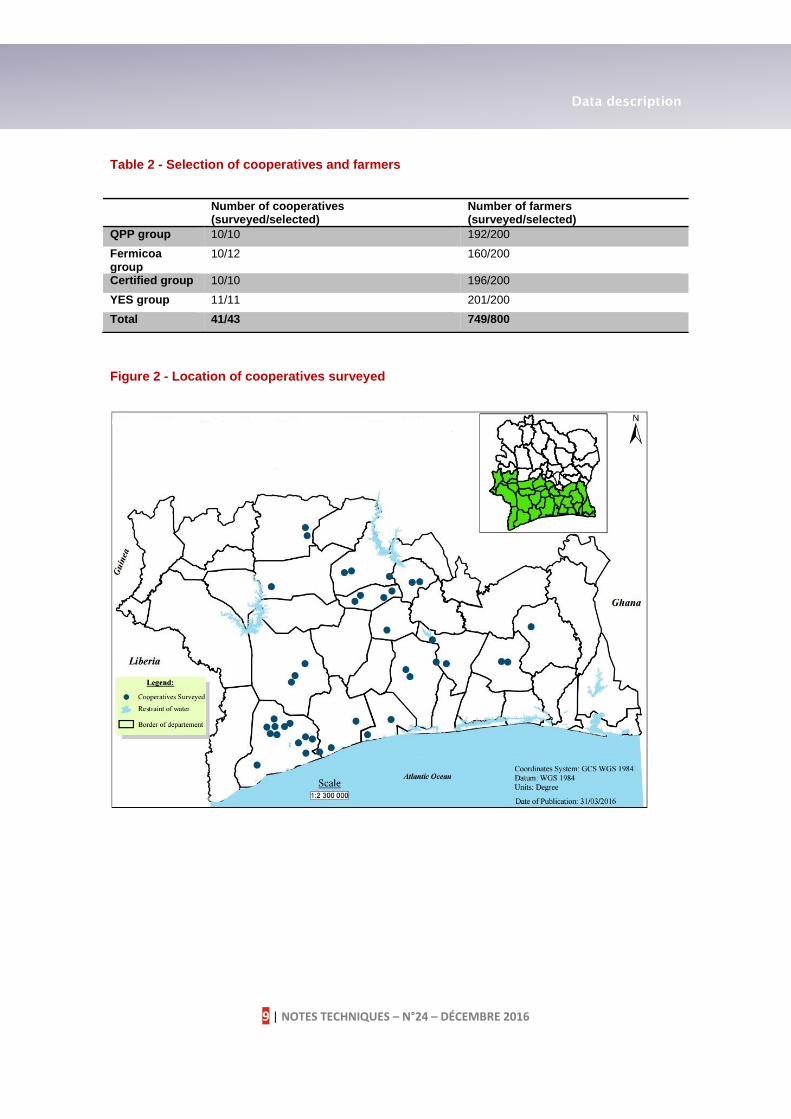
The selection of the cooperatives surveyed is thus biased towards cooperatives where Barry Callebaut expects farmers to be more willing to adopt new practices and innovate. A dozen cooperatives per group were selected to be surveyed. This was conducted in accordance with Barry Callebaut’s project implementation in 2012 (which may have changed since). Approximately 200 producers per group were randomly selected. Farmers are thus distributed according to the weight of the cooperative in terms of members (not production or areas planted). Table 2 below shows the number of cooperatives surveyed per group, and Figure 2 shows the location of the cooperatives. The answer rate is slightly above 93%, with 749 farmers interviewed for an objective of 800.
7 http://www.cocoahorizons.org/our-activities
Data description
9 | NOTES TECHNIQUES – N°24 – DÉCEMBRE 2016
Table 2 - Selection of cooperatives and farmers
Number of cooperatives
(surveyed/selected) Number of farmers (surveyed/selected)
QPP group 10/10 192/200
Fermicoa group
10/12 160/200
Certified group 10/10 196/200
YES group 11/11 201/200
Total 41/43 749/800
Figure 2 - Location of cooperatives surveyed
Data description
10 | NOTES TECHNIQUES – N°24 – DÉCEMBRE 2016
II. Cocoa farmers’ survey: three units of observation and many variables
The Barry Callebaut cocoa farmers’ survey has several units of observation: farms, farmers, households and cooperatives. The information on the different levels was collected through a set of digital surveys.
- Census surveys:
o The census is a set of two surveys that allow the profiles of farmers and farms to be established, as well as cooperative profiles. It includes the geo-location of the unit interviewed;
o The survey is collected on a broader set of farmers and cooperatives than the one sampled for this survey round (i.e. the cooperatives and farmers in Table 2);
o It is called a census as it includes the questions that Barry Callebaut identified as key to collecting information on farmers, farms and cooperatives in order to understand the general profile.
- Household survey (hereinafter referred to as the HHS):
o The household survey is a set of questions created for the purpose of this survey;
o The survey was only conducted on the sampled farmers;
o It includes questions related to farmers and their households, access to finance, the main sources of income and main activities.
Table 3 describes the main themes and variables of each survey by level of observation. Thanks to the wide number of variables and the different sources of information (census and household); a large part of the information gathered can thus be “cross-checked”. Indeed, one major concern when relying on data based on statements relates to the reliability of the information. When information collected by directly interviewing farmers, there is a risk of misunderstanding or of biased statements. As a large part of the survey relies on statements from farmers, results should thus be interpreted with due consideration for the data collection method, especially for sensitive subjects such as child labor and the use of pesticides.

Data description
11 | NOTES TECHNIQUES – N°24 – DÉCEMBRE 2016
Table 3 - Barry Callebaut cocoa farmers’ survey: main themes by unit of observation
Unit of observation (Number of obs.)
Main themes Source
Cooperatives (41) Basic information: n° of sections, geolocation, n° of members, advisers, year, project (certification, etc.)…
Access to facilities: water, schools, health
Census
Cooperatives (39) Services delivered by cooperatives to members (training, finance), farmers’ loyalty and reimbursement rate
Business choices of cooperatives
HHS
Households (704) Composition and size: for each member: gender, age, education and literacy + migrants
Assets: housing and livestock
Main activities, generating income or not, and remittances
Crops cultivated
HHS
Farmers (729) Socio-demographics: age, gender, education, nationality, ethnic group…
Census
Farmer (704) Crops grown: number, type, agricultural practices (input use, training and advice…), competition between crops, expectations
Cocoa growing support or ways of improvement (projects and impacts of these projects, needs, problems)
Access to finance (credit, savings, bank and mobile banking)
HHS
Farms* (824)
* i.e. plots
Farm description: surface area, age, ownership, project, yield
Tree growing: variety, mode of planting, agricultural practices, diseases, harvesting, intercropping
Farmers’ expectations of farms: future crops, investment
Census
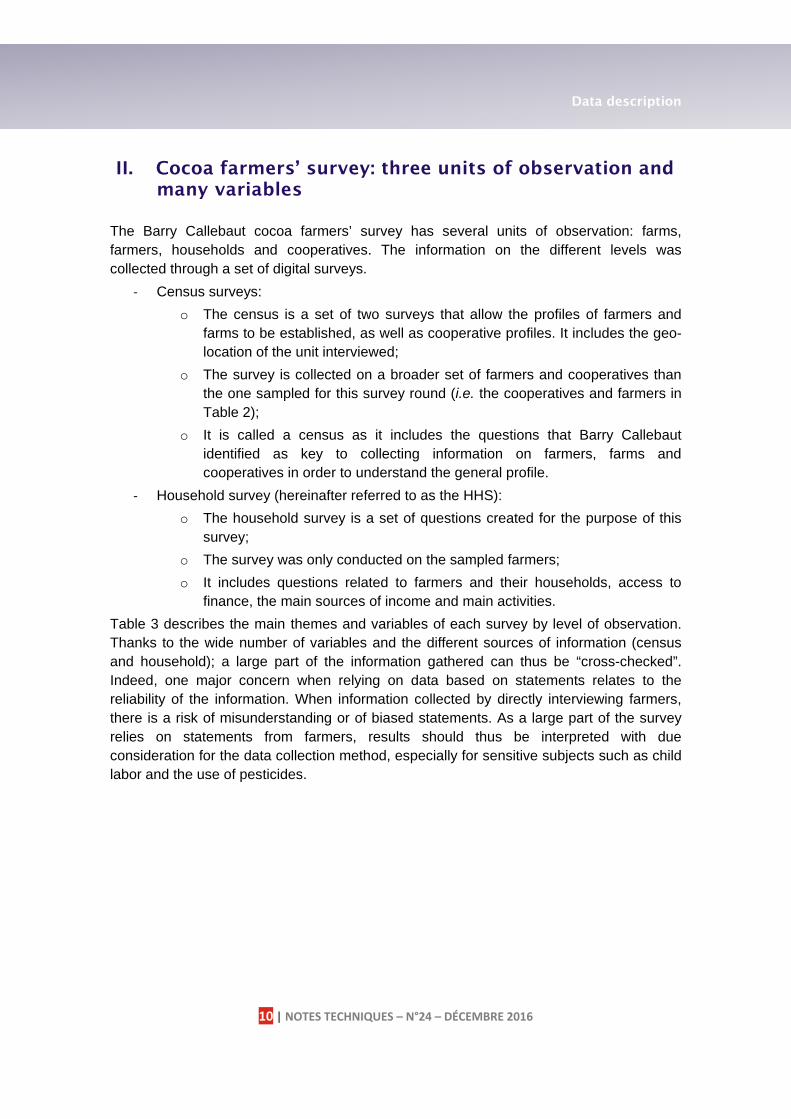
It should be noted that the two surveys did not each cover the sample fully; therefore some sampled farmers participated in the census and not in the household questionnaire, and vice versa (see Figure 3 below). In this report, statistics may thus concern different samples: farmers who answered questionnaires, farmers who participated in the census,
Data description
12 | NOTES TECHNIQUES – N°24 – DÉCEMBRE 2016
or both. As a consequence, the total number of observations and missing values differ depending on the variables.8
Figure 3 – Participation of farmers in census and household surveys
In 95% of cases, the respondents are in charge of the plot for which they are interviewed. This reflects the fact that Barry Callebaut targeted the farmers growing and managing cocoa as the main respondents of this survey. Most of the time (83%), the respondent is also a member registered at the cooperative. Indeed, farmers for this survey were selected from cooperative member lists (i.e. those registered at the cooperative). In other cases, respondents were usually from the family of the cooperative member (child, brother, sister) and answered because the member was on leave, or because he/she is the person in charge of the plot. Cooperative members almost always state that they are the owner of their farms and, when it is not the case, the owner is a relative. Only 2% of interviewed farmers say that they are sharecroppers. Lastly, 83% of the respondents are also the head of their households.
8 In general, descriptive statistics in this report are computed for the whole set of farmers (i.e. those who were eligible to receive the two surveys, even if not answering both) who answered (i.e. excluding missing values).
Census only45
Household Questionnaire
only20Both
684

Main findings: descriptive statistics on farmers and cocoa
13 | NOTES TECHNIQUES – N°24 – DÉCEMBRE 2016
Main findings: descriptive statistics on farmers and cocoa
I. Environment: Where do farmers live?
A survey on 326 farmers’ communities carried out in 2014-2015 provides an overview of the environment of farmers. The survey focused on access to education and health facilities, drinking water, and electricity.
The average population in a community stands at 3,663. We compared the declared population with the last population census9 and the results stated in the survey seem reasonable.10
The national power grid is accessible to less than 27% of the communities surveyed. This number is comparable to the average rural access to electricity in Côte d’Ivoire.11 Among these communities, half say that they have access to solar energy and/or a generator. Overall, communities have access to alternative energy sources like wood and batteries. If we consider that access to electricity is a good indicator of the remoteness of farmers’ communities, cocoa communities are similar to rural communities in general.
22% of villages have no schools at all located in the village, and nearly the same amount (25%) have no primary schools located in the village. However, primary schools are accessible (i.e. located within 5 km around the village) in 87.4% of the villages interviewed, which is comparable to the last living standards survey (hereinafter referred to as ‘ENV 2015’, see Table 1).12 At the same time, secondary schools for village households are accessible (i.e. located at less than 5 km) in only 14% of villages interviewed, which is very low compared to ENV 2015.13
9 The last « Recensement Général de la Population et de l’Habitat » or RGPH (national census) was carried out in 2014. See www.ins.ci. 10 We only dropped two very unrealistic observations. 11 According to the « Enquête sur le Niveau de Vie des Ménages en Côte d’Ivoire » (Living standards measurement survey) (ENV 2015, see Table 1), 28.7% of households mentioned electricity as a main source of power in rural areas. 12 When we compare it with ENV 2015 results, we find similar results with household access to primary school within a 5 km distance of 87.2%. 13 Even for poor households, access to secondary school is around 63.5% on average.
Main findings: descriptive statistics on farmers and cocoa
14 | NOTES TECHNIQUES – N°24 – DÉCEMBRE 2016
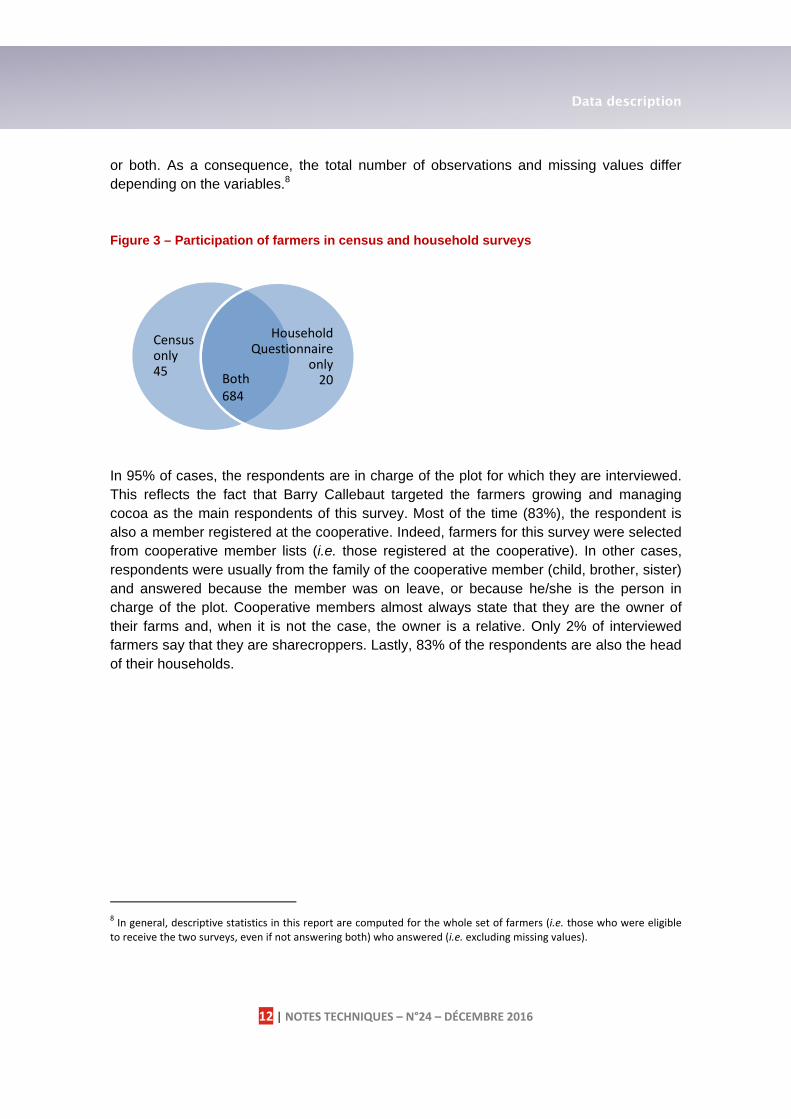
Figure 4 – Number of schools located in the communities
Focusing on primary school access, despite the good access rate, 25% of villages have no primary school in the village, for an average population of 1,445 people. 45% of villages have only a single primary school in the village, for an average population of 2,650. We found the average school size to be about 6 classes, with sometimes a lower number of teachers. The amount of primary schools in villages is low considering the 25% share of primary school-aged children in the population estimated from the last demographic and health survey for Côte d’Ivoire (hereinafter referred to as EDS-MICS, see Table 1).
Farmers’ communities lack access to healthcare, either health facilities or health workers. 43% of the observed communities say that they have a health facility in the village. When including other accessible health facilities (within a 5 km distance), we find that 47% of communities have reasonable access to health facilities. For the remaining 53% of communities, the closest health facility is located further than 5 km, at an average distance of 12 km. Compared to the national statistics; access to health facilities in the cocoa communities observed is very low. The ENV 2015 survey estimates that more than 70% of households have access to a health center within 5 km, even when they are poor households.

Main findings: descriptive statistics on farmers and cocoa
15 | NOTES TECHNIQUES – N°24 – DÉCEMBRE 2016
Figure 5 – Distance to nearest health facility
Having access to a health facility does not mean that communities benefit from the same level of healthcare. Among communities with accessible health infrastructure, 55% say that at least one facility is a community clinic, 41% have a maternity ward, 45% an infirmary, 26% a private clinic, and only 15% a hospital.
Community health workers are the first step of the health delivery pyramid, whose function can be described as to deliver very basic, first aid, support sensitization and refer patients to health facilities. Among the communities lacking health facilities within 5 km, many say that there is a community health worker and therefore access to a certain level of basic healthcare. Communities with no infrastructure but a community health worker account for nearly 10% of the overall communities observed. All in all, it leaves nearly half of the communities with no access to any type of health services (neither infrastructure, nor community health worker).
Finally, not all communities have access to an improved drinking water supply. 32% of communities obtain at least part of their drinking water from the national water supply company (SODECI). 63% of the communities declare having access to pumped water (using water towers or direct service at pumps) or water wells 5% of the communities that they have no access to either pumped water or water wells, implying that their drinking water originates by majority from surface water. These numbers are high compared to the national average estimates from ENV 2015.14 However, the study does not take into consideration the proper functioning of the sources, or access for the households of the communities.
14 According to the ENV 2015, 20 to 25% of households use national water supply as a source of drinking water.

Main findings: descriptive statistics on farmers and cocoa
16 | NOTES TECHNIQUES – N°24 – DÉCEMBRE 2016
II. Farmer profile and households’ well-being
1. Cocoa farmers’ demographic profile
The database reveals that 96% of cocoa farmers are men and the average age of farmers is around 44 years-old.15 Half of the cocoa farmer population is aged between 35 and 52 years-old.16 In addition, the median age of farmers is about 43 years-old, while the median age for the rural population between 20 and 65 is around 35 years-old.17 These figures are similar to Assiri et al. (2009), and show that cocoa farmers are among the oldest.
Figure 6 – Age structure of cocoa farmers
The literacy rate among cocoa farmers is very low. A quick test on the population of farmers to check their reading skills enabled us to estimate the share of literate farmers at only 30% (45% in Assiri et al. 2009). Nearly 60% of the farmers did not attend school, and among the remaining 40% of farmers, most only attended primary school (partly or entirely), while only 10% of all cocoa farmers surveyed went to a level beyond primary schooling.
15 Life expectancy at birth in Côte d’Ivoire is 53 years (EDS-MISC 2011). 16 In the EDS-MICS, the rural population between 35 and 50 accounts for 30% of the population between 20 and 65. 17 In the EDS-MICS, 40% of the population is between 20 and 65 years old, 20% is between 20 and 35.
0
5
10
15
Sh
are
of
farm
ers
, %
20 40 60 80

Main findings: descriptive statistics on farmers and cocoa
17 | NOTES TECHNIQUES – N°24 – DÉCEMBRE 2016
2. Household profile: size, composition and main activities
To have information on the well-being of cocoa farmers’ households, surveyors asked questions about the household heads, whether or not they were the respondents. Figure 7 helps to understand the different samples for which information is available. 83% of cocoa farmers interviewed are also head of their households (585 farmers, group 3 in purple in Figure 7). In the other cases, cocoa farmers interviewed are mainly children of the household head (5%), his brother or sister (4%), nephew or niece (3%), a relation (2%), or his wife (1%). The average household size is of eight members,18 including the household head (most of the time men) and his wife (or wives), with on average two children under 6 years-old and 2 children older than 6 (on average 15 years-old), one brother or sister (28 years-old), and one nephew or niece. 12% of households live with a farm laborer (28 years-old). The database contains information about 4,894 people (questionnaires to household members excluded children under 6), including 1,676 children (i.e. under 19).
Figure 7 – Samples of cocoa farmers
In terms of occupation, 42% of household heads have only one occupation, 49% have two activities, and less than 7% more than two activities (see Figure 8). The split between one, two or more activities are slightly different for household heads who are also the cocoa
18 According to the EDS-MICS, the average household size is 5.1 in rural areas.

Main findings: descriptive statistics on farmers and cocoa
18 | NOTES TECHNIQUES – N°24 – DÉCEMBRE 2016
farmers responding to the survey (group 3, resp. 39% and 53%) and for cocoa farmers who are not the heads of their household (group 1, resp. 48%, 37%, and 10%).
Overall, 98% of the heads of households grow cash crops as their main occupation. Among those who have a secondary activity (48.5%), almost two-thirds (57.2%) grow food crops, 18.5% have another agricultural activity, and only 13% have a secondary activity which is not agricultural (see Figure 10).
At the household level, the vast majority of women, most of the time the wife (or wives) of household heads, have several occupations (see Table 4). One-third of women say that they have an income-generating activity other than cash crop growing.
All in all, 25% of households have another source of cash income than cocoa, mainly from sales of food crop surpluses.19
Furthermore, cocoa households do not receive cash from children leaving outside of the households. 34.5% of households do not have any child living outside the household. 53% of households have between one and five children living outside the household, but only 7% receive money from at least one child, whereas 75% of farmers said that they sent them money to help for emergency purposes (i.e. not on a regular basis, except for 13%).
In a nutshell, cocoa farmers and their relatives heavily rely on cocoa as the primary source of cash income.
19 N.B.: It may be surprising to find that not all households (2/3) grow food crops. This is because the questionnaire did not ask whether households grow food crops or not, but asked each member what were their primary and secondary activities.

Main findings: descriptive statistics on farmers and cocoa
19 | NOTES TECHNIQUES – N°24 – DÉCEMBRE 2016
Figure 8 – Number of household heads' activities (703 obs.)
Figure 9 – Number of activities, women (813 obs.)
Figure 10 – Household heads' secondary activities (703obs.)
Table 4 – Women’s activities
% of women who say that they: Do household chores/look after children
93.6
Grow food crops 61.5Grow cash crops 24.9Sell food crop surpluses 21.4Have another income-generating activity (retailing, restaurant, etc.)
11.2
Have another nonagricultural activity 3.4
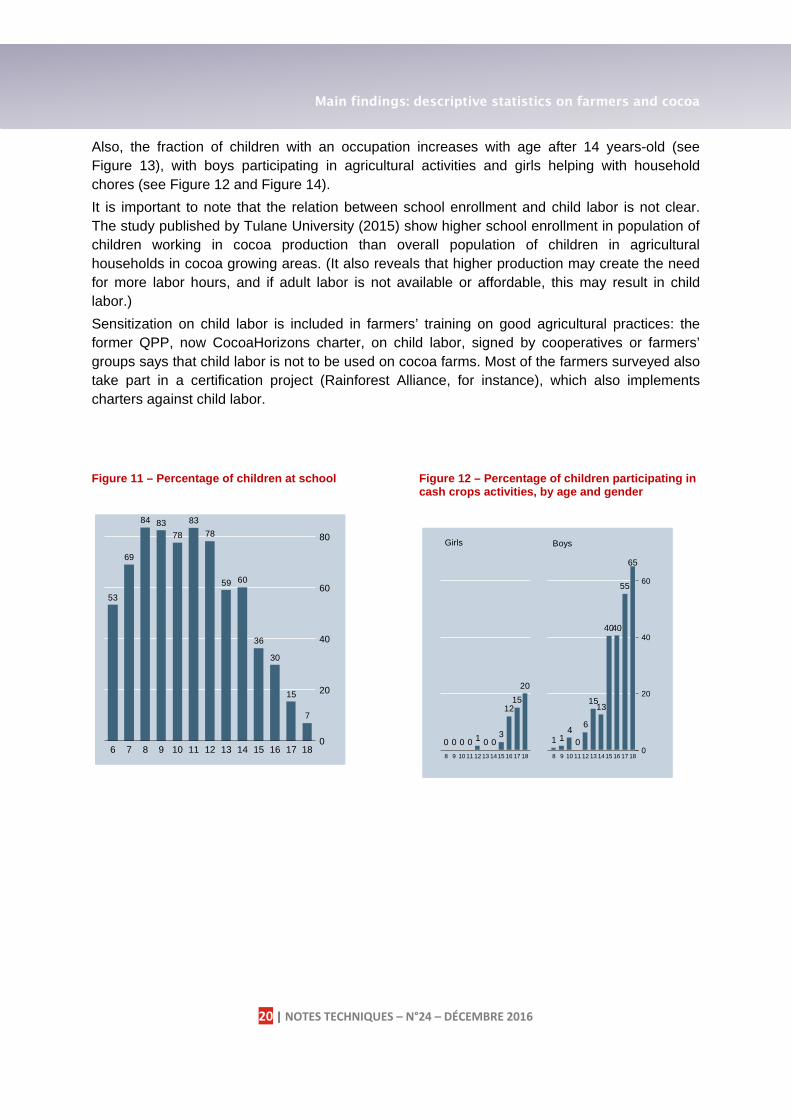
Regarding the activities carried out by children, which is a very sensitive issue in cocoa regions, the database reveals that the average school enrollment rate reaches 75% for children aged between 6 and 12. This rate decreases after 13 years-old (see Figure 11). These numbers are similar to those in the Tulane report (2015) revealing 67.2% of children attendance for children between 5 and 11 years old, 80.8% for children between 12 and 14 years old which drops to 46.6% for children between 15 and 17 years old.
2.4%
42.4%
48.5%
5.5%
0.9%0.3%
0 1 2 3 4 5
1.0%
22.1%
39.0%
29.5%
8.1%
0.2%
0 1 2 3 4 5
57.2%
11.1%
8.5%
18.5%
4.7%
Food crop growing Nonagricultural activityOther Other agricultural activityRetailing
Main findings: descriptive statistics on farmers and cocoa
20 | NOTES TECHNIQUES – N°24 – DÉCEMBRE 2016
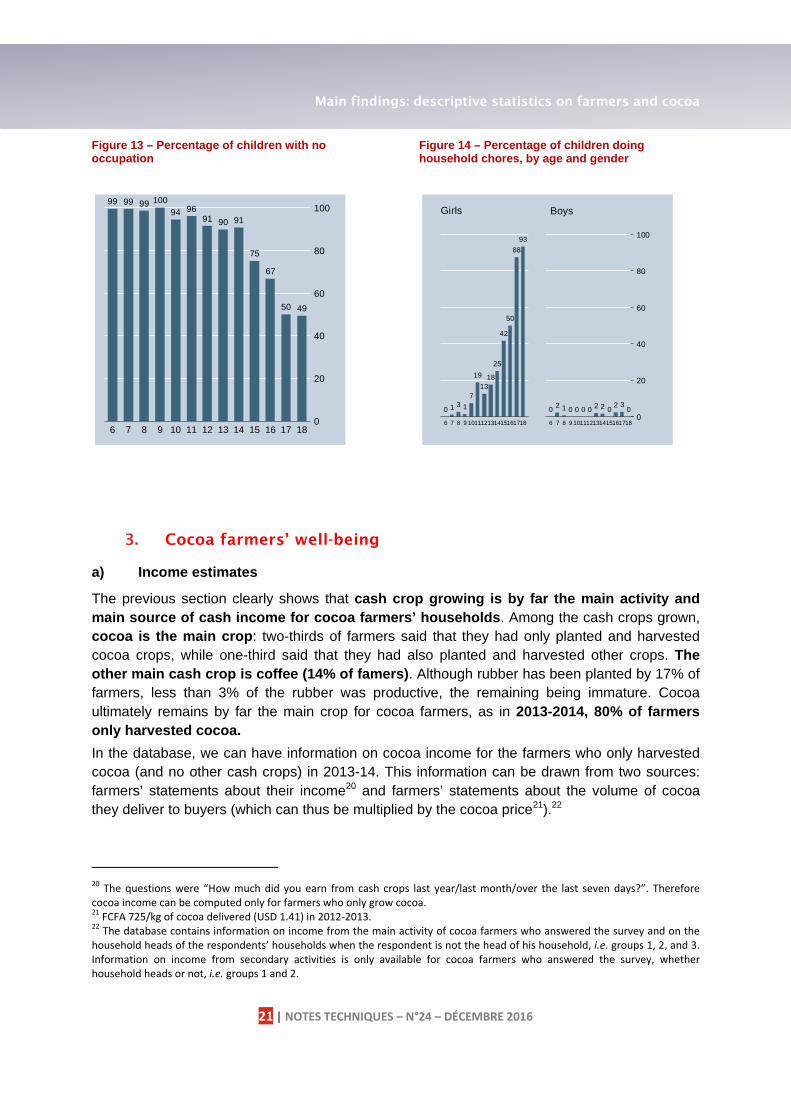
Also, the fraction of children with an occupation increases with age after 14 years-old (see Figure 13), with boys participating in agricultural activities and girls helping with household chores (see Figure 12 and Figure 14).
It is important to note that the relation between school enrollment and child labor is not clear. The study published by Tulane University (2015) show higher school enrollment in population of children working in cocoa production than overall population of children in agricultural households in cocoa growing areas. (It also reveals that higher production may create the need for more labor hours, and if adult labor is not available or affordable, this may result in child labor.)
Sensitization on child labor is included in farmers’ training on good agricultural practices: the former QPP, now CocoaHorizons charter, on child labor, signed by cooperatives or farmers’ groups says that child labor is not to be used on cocoa farms. Most of the farmers surveyed also take part in a certification project (Rainforest Alliance, for instance), which also implements charters against child labor.
Figure 11 – Percentage of children at school
Figure 12 – Percentage of children participating in cash crops activities, by age and gender
53
69
84 8378
83
78
59 60
36
30
15
7
0
20
40
60
80
6 7 8 9 10 11 12 13 14 15 16 17 180 0 0 0 1 0 0
3
1215
20
1 14
0
6
1513
4040
55
65
0
20
40
60
8 9 10 11 12 13 1415 16 17 18 8 9 10 11 12 13 1415 16 17 18
Girls Boys
Main findings: descriptive statistics on farmers and cocoa
21 | NOTES TECHNIQUES – N°24 – DÉCEMBRE 2016
Figure 13 – Percentage of children with no occupation
Figure 14 – Percentage of children doing household chores, by age and gender
3. Cocoa farmers’ well-being
a) Income estimates
The previous section clearly shows that cash crop growing is by far the main activity and main source of cash income for cocoa farmers’ households. Among the cash crops grown, cocoa is the main crop: two-thirds of farmers said that they had only planted and harvested cocoa crops, while one-third said that they had also planted and harvested other crops. The other main cash crop is coffee (14% of famers). Although rubber has been planted by 17% of farmers, less than 3% of the rubber was productive, the remaining being immature. Cocoa ultimately remains by far the main crop for cocoa farmers, as in 2013-2014, 80% of farmers only harvested cocoa.
In the database, we can have information on cocoa income for the farmers who only harvested cocoa (and no other cash crops) in 2013-14. This information can be drawn from two sources: farmers’ statements about their income20 and farmers’ statements about the volume of cocoa they deliver to buyers (which can thus be multiplied by the cocoa price21).22
20 The questions were “How much did you earn from cash crops last year/last month/over the last seven days?”. Therefore cocoa income can be computed only for farmers who only grow cocoa. 21 FCFA 725/kg of cocoa delivered (USD 1.41) in 2012-2013. 22 The database contains information on income from the main activity of cocoa farmers who answered the survey and on the household heads of the respondents’ households when the respondent is not the head of his household, i.e. groups 1, 2, and 3. Information on income from secondary activities is only available for cocoa farmers who answered the survey, whether household heads or not, i.e. groups 1 and 2.
99 99 99 10094 96
91 90 91
75
67
50 49
0
20
40
60
80
100
6 7 8 9 10 11 12 13 14 15 16 17 18
0 1 3 1
7
19
1318
25
42
50
88
93
02 1 0 0 0 0 2 2 0
2 30
0
20
40
60
80
100
6 7 8 9 101112131415161718 6 7 8 9 101112131415161718
Girls Boys

Main findings: descriptive statistics on farmers and cocoa
22 | NOTES TECHNIQUES – N°24 – DÉCEMBRE 2016
As regards the core sample of 585 cocoa farmers who are also heads of their households, they declared a total annual income of FCFA 1,760,657, with more than 97% being drawn from cash crops, i.e. from cocoa for 80% of the core sample. When cash crops include other crops than cocoa – which is only the case for 20% of cocoa farmers – cocoa still accounts for 88% of income from cash crops.
According to farmers’ statements, cocoa yields about 1.5 million FCFA per grower (see

Main findings: descriptive statistics on farmers and cocoa
23 | NOTES TECHNIQUES – N°24 – DÉCEMBRE 2016
Table 5, column B, row 4). Their statements regarding cocoa produced provide cocoa income estimates which are slightly higher (3.48%) than their income declarations. This may be due to an overestimation of production or because farmers reported “net” income. Indeed, in some villages, a small proportion of the cocoa production of each producer is withdrawn to finance collective investments at the village level, or for expenditures related to the functioning of cooperatives etc.
Main findings: descriptive statistics on farmers and cocoa
24 | NOTES TECHNIQUES – N°24 – DÉCEMBRE 2016
Table 5 highlights other interesting facts. For example, differences in income are not explained by the number of activities, but mainly by the number of cash crops: farmers who harvest another cash crop (mainly coffee) earn more than those who only grow cocoa.
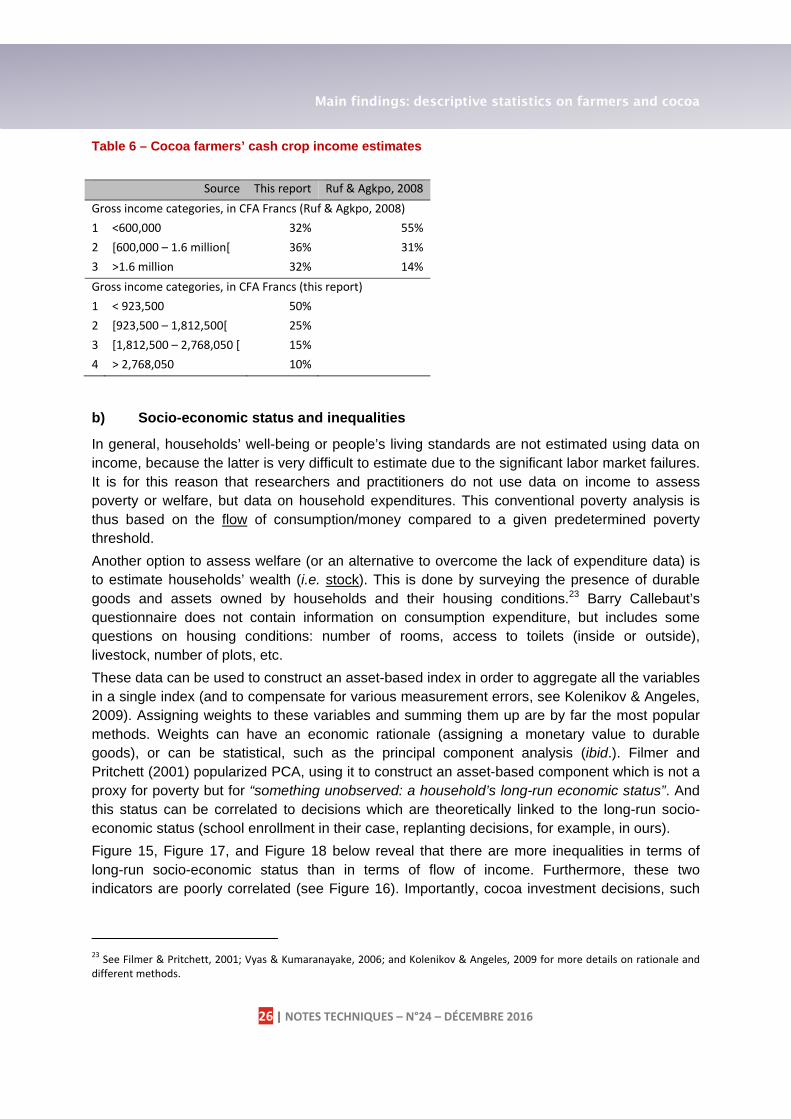
Compared to recent estimates of (gross) income from cash crops in cocoa regions, cocoa farmers surveyed by Barry Callebaut appear to have a higher income (see Table 6). As yield estimates do not differ a lot between the two reports, the price of cocoa farmers appears to be the main explanation for the income gap: indeed, the official cocoa price was higher in 2012-2013 than in 2007-2008 and, on the other hand, most of our farmers interviewed participated in a project (Rainforest Alliance, Fermicoa, etc.), which provides cocoa farmers with price premiums. Income estimates are in line with those found by the World Cocoa Foundation for major producing countries in Sub-Saharan Africa with a per capita daily income in 2011 in the range of USD 1.09-USD 1.76 (Wessel & Quist-Wessel, 2015, p.330). Indeed, dividing gross income by the household size, we find a rough estimate of a per capita daily cocoa income of USD 1.17, which is under the USD 2 a day threshold; despite the fact that 2012 was a good year for cocoa prices and that the majority of sampled farmers gain a price premium for their cocoa.

Main findings: descriptive statistics on farmers and cocoa
25 | NOTES TECHNIQUES – N°24 – DÉCEMBRE 2016
Table 5 – Cocoa farmers’ income
Status of farmers (n° of obs., see also Figure 7)
Cocoa farmers, not
hhd (118)
Cocoa farmers, hhd
(585)
Cocoa farmers,
whether or not hhd
(total, 703)
Difference between 1
and 3
Hhd, not respondents
(118)
Group 1 Group 3 Group 1+3 Group 2 (A) (B) (C) (D) (E)
Total income (n° of obs.) (1) 648,581
(109) 1,760,657(571)
1,582,397(680) 1,112,076*** n.a.
Cash crop income
average (2) 652,013(103)
1,658,750(562)
1,502,820(665) 1,502,820*** 1,460,680
(55) share in total income (3) 98,20% 97,50% 97,63% n.a. n.a.
Cocoa income average (declared, only by
farmers who just grow cocoa)
(4) 658,476 (93)
1,500,032 (455)
1,357,214 (548) 841,556*** n.a.
second estimate (quantity*price) (5) 1,489,027
(94) 1,569,130 (454)
1,555,390(548) 0 n.a.
difference between 1st and 2nd estimates (6) 829,897***
(91) 52,189*(449)(a)
183,247(540)*** n.a. n.a.
share of cocoa in cash crops (only for farmers who
grow another cash crop) (7) 86% (5) 88% (93) 88% (98) n.a. n.a.
Differences in cash crop income between
farmers who only grow cocoa and the others
(8) 0 (b) 833,640***(c) 827,590 (d) n.a. n.a.
total income between farmers who only grow
cocoa and the others (9) 0 750,196***(e) 759,706 n.a. n.a.
total income between farmers who have one activity and the others
(10) 0 0 0 n.a. n.a.
Notes: (a) Statistical indication, but 3.48% of average declared. (b) Only 10 grow another cash crop, 93 only grow cocoa. (c) 107 grow another cash crop, 455 only grow cocoa (av. cash cop income for the former: 2,333,672). (d) 117 grow another cash crop, 548 only grow cocoa (av. cash cop income for the former: 2,184,803). (e) 107 grow another cash crop, 455 only grow cocoa.
Main findings: descriptive statistics on farmers and cocoa
26 | NOTES TECHNIQUES – N°24 – DÉCEMBRE 2016
Table 6 – Cocoa farmers’ cash crop income estimates
Source This report Ruf & Agkpo, 2008Gross income categories, in CFA Francs (Ruf & Agkpo, 2008)1 <600,000 32% 55%2 [600,000 – 1.6 million[ 36% 31%3 >1.6 million 32% 14%Gross income categories, in CFA Francs (this report)1 < 923,500 50% 2 [923,500 – 1,812,500[ 25% 3 [1,812,500 – 2,768,050 [ 15% 4 > 2,768,050 10%
b) Socio-economic status and inequalities
In general, households’ well-being or people’s living standards are not estimated using data on income, because the latter is very difficult to estimate due to the significant labor market failures. It is for this reason that researchers and practitioners do not use data on income to assess poverty or welfare, but data on household expenditures. This conventional poverty analysis is thus based on the flow of consumption/money compared to a given predetermined poverty threshold.
Another option to assess welfare (or an alternative to overcome the lack of expenditure data) is to estimate households’ wealth (i.e. stock). This is done by surveying the presence of durable goods and assets owned by households and their housing conditions.23 Barry Callebaut’s questionnaire does not contain information on consumption expenditure, but includes some questions on housing conditions: number of rooms, access to toilets (inside or outside), livestock, number of plots, etc.
These data can be used to construct an asset-based index in order to aggregate all the variables in a single index (and to compensate for various measurement errors, see Kolenikov & Angeles, 2009). Assigning weights to these variables and summing them up are by far the most popular methods. Weights can have an economic rationale (assigning a monetary value to durable goods), or can be statistical, such as the principal component analysis (ibid.). Filmer and Pritchett (2001) popularized PCA, using it to construct an asset-based component which is not a proxy for poverty but for “something unobserved: a household’s long-run economic status”. And this status can be correlated to decisions which are theoretically linked to the long-run socio-economic status (school enrollment in their case, replanting decisions, for example, in ours).
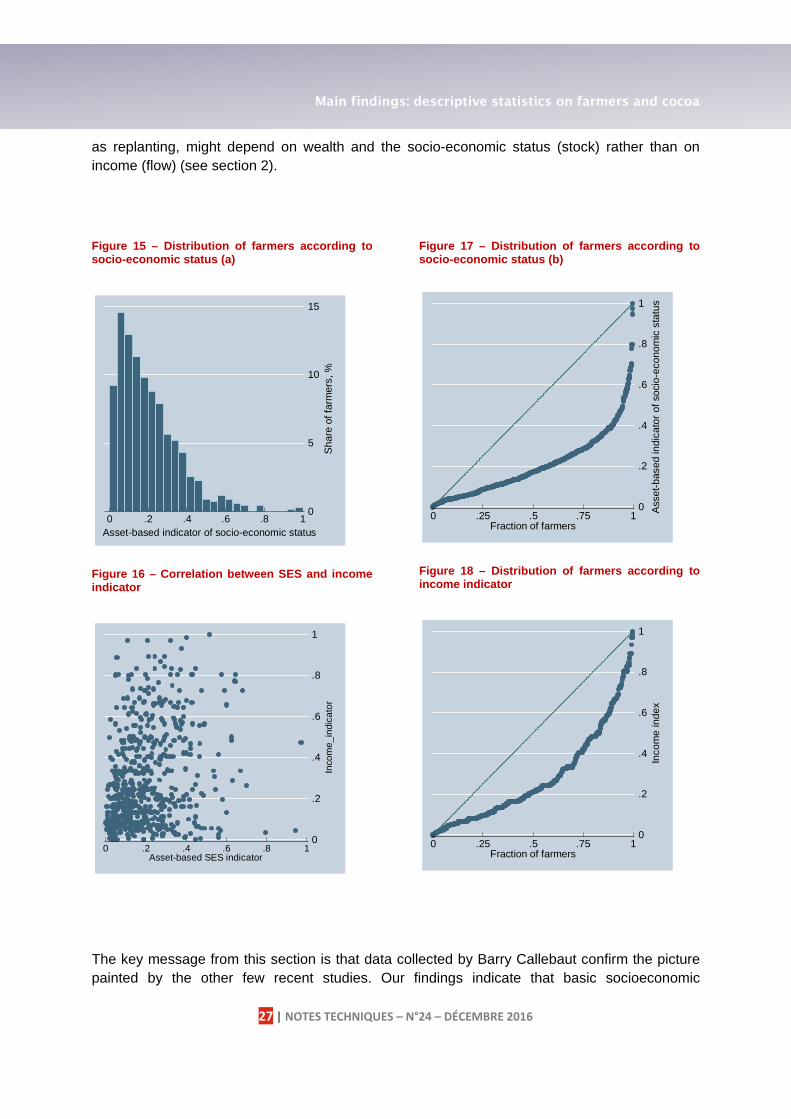
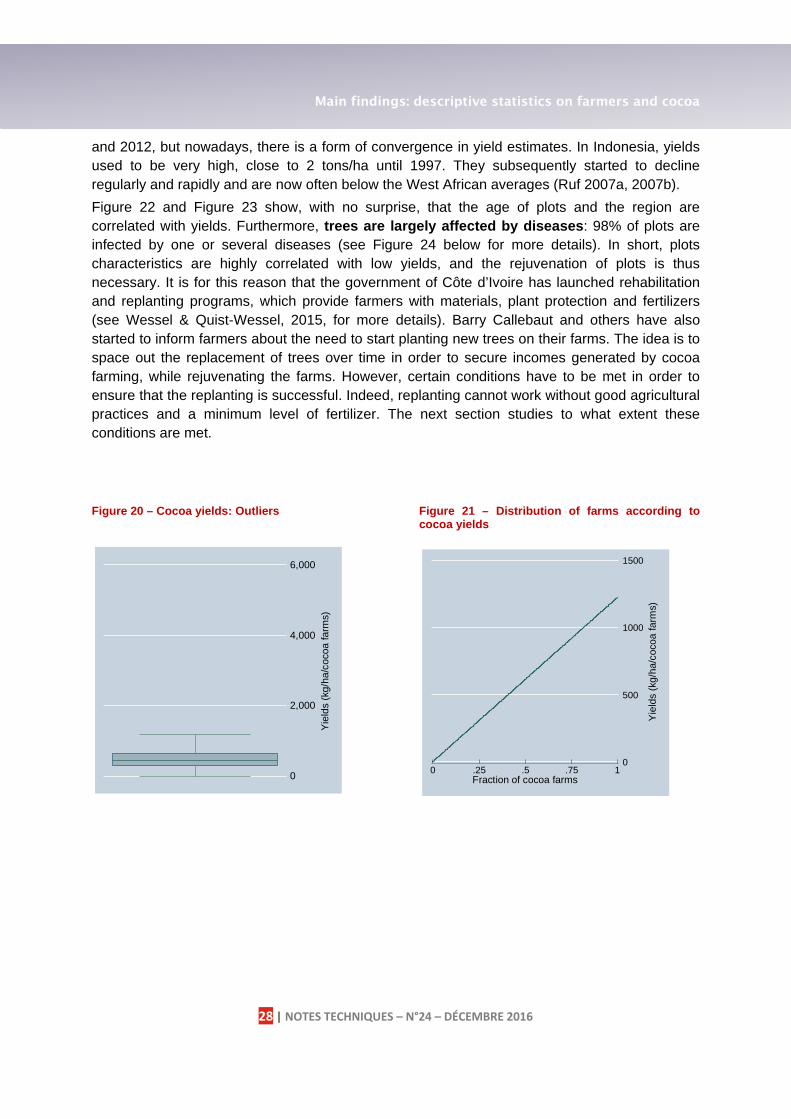
Figure 15, Figure 17, and Figure 18 below reveal that there are more inequalities in terms of long-run socio-economic status than in terms of flow of income. Furthermore, these two indicators are poorly correlated (see Figure 16). Importantly, cocoa investment decisions, such
23 See Filmer & Pritchett, 2001; Vyas & Kumaranayake, 2006; and Kolenikov & Angeles, 2009 for more details on rationale and different methods.
Main findings: descriptive statistics on farmers and cocoa
27 | NOTES TECHNIQUES – N°24 – DÉCEMBRE 2016
as replanting, might depend on wealth and the socio-economic status (stock) rather than on income (flow) (see section 2).
Figure 15 – Distribution of farmers according to socio-economic status (a)
Figure 16 – Correlation between SES and income indicator
Figure 17 – Distribution of farmers according to socio-economic status (b)
Figure 18 – Distribution of farmers according to income indicator
The key message from this section is that data collected by Barry Callebaut confirm the picture painted by the other few recent studies. Our findings indicate that basic socioeconomic
0
5
10
15
Sha
re o
f far
mer
s, %
0 .2 .4 .6 .8 1Asset-based indicator of socio-economic status
0
.2
.4
.6
.8
1
Inco
me
_in
dica
tor
0 .2 .4 .6 .8 1Asset-based SES indicator
0
.2
.4
.6
.8
1
Ass
et-b
ased
indi
cato
r of
soc
io-e
cono
mic
sta
tus
0 .25 .5 .75 1Fraction of farmers
0
.2
.4
.6
.8
1
Inco
me
inde
x
0 .25 .5 .75 1Fraction of farmers
Main findings: descriptive statistics on farmers and cocoa
26 | NOTES TECHNIQUES – N°24 – DÉCEMBRE 2016
infrastructure that give access to primary schools, primary health care and drinking water is not available for all farmers. In accordance with accepted development frameworks, e.g. Cocoa Action, further development of this socioeconomic environment together with increasing individual household income, is required. Furthermore, despite the fact that surveyed farmers belong to sustainability projects, cocoa farmers and their households remain very poor and live on less then USD 2 per day. As households largely continue to rely on cocoa income as the primary source of cash income, increasing the economic sustainability of cocoa farms via an improvement of yields is thus fundamental for cocoa farmers and households. Constraints to this improvement are now investigated.
III. Plot characteristics and agricultural practices: What are the major constraints to yield improvements?
Low yields have been attributed to various causes in the literature: age of cocoa trees, high prevalence of pests and diseases, lack of access to finance to use inputs, lack of access to inputs, lack of soil nutrients, and limited farmers’ knowledge of best agricultural practices (see Wessel & Quist-Wessel, 2015). However, as limited information is available regarding cocoa farming in Côte d’Ivoire, it is difficult to assess the importance of each of these factors, and thus to prioritize actions in programs for sustainable cocoa. This section is intended to give a picture of yields and constraints to improving yields. It first describes plots and their characteristics, then focuses on agricultural practices, and, finally, on farmers’ expectations of cocoa farming.
1. Low yields, old plots, many diseases
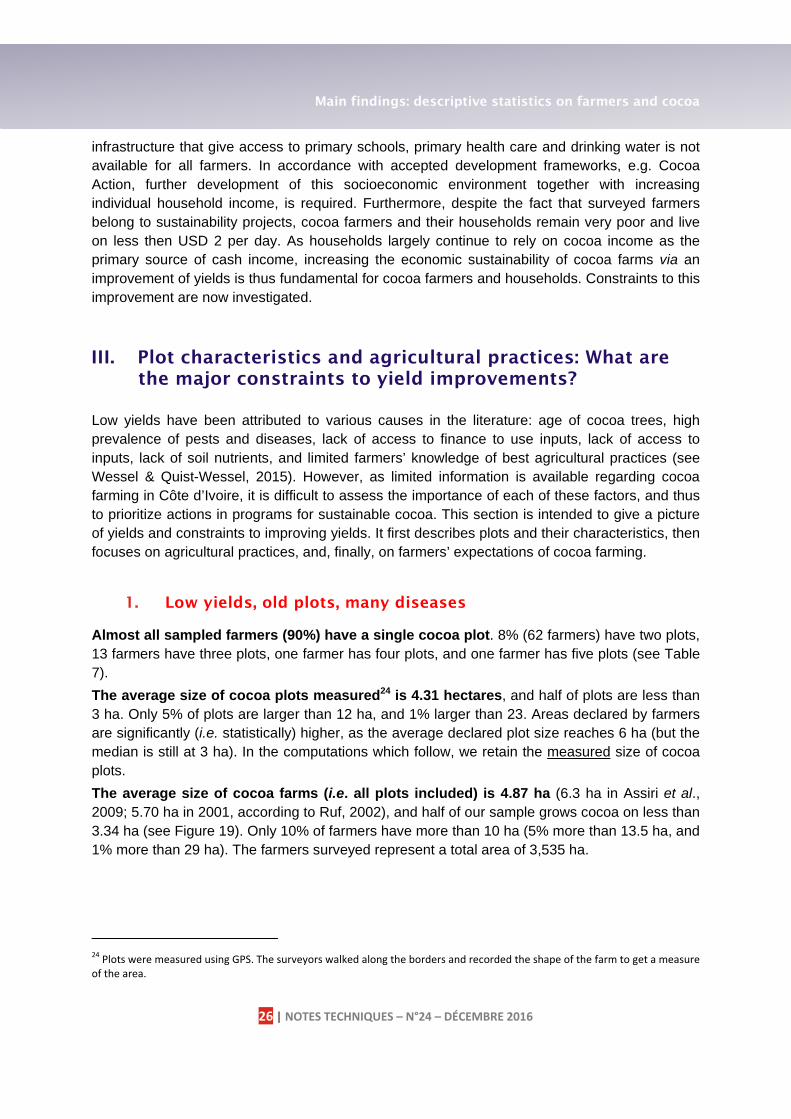
Almost all sampled farmers (90%) have a single cocoa plot. 8% (62 farmers) have two plots, 13 farmers have three plots, one farmer has four plots, and one farmer has five plots (see Table 7).
The average size of cocoa plots measured24 is 4.31 hectares, and half of plots are less than 3 ha. Only 5% of plots are larger than 12 ha, and 1% larger than 23. Areas declared by farmers are significantly (i.e. statistically) higher, as the average declared plot size reaches 6 ha (but the median is still at 3 ha). In the computations which follow, we retain the measured size of cocoa plots.
The average size of cocoa farms (i.e. all plots included) is 4.87 ha (6.3 ha in Assiri et al., 2009; 5.70 ha in 2001, according to Ruf, 2002), and half of our sample grows cocoa on less than 3.34 ha (see Figure 19). Only 10% of farmers have more than 10 ha (5% more than 13.5 ha, and 1% more than 29 ha). The farmers surveyed represent a total area of 3,535 ha.
24 Plots were measured using GPS. The surveyors walked along the borders and recorded the shape of the farm to get a measure of the area.
Main findings: descriptive statistics on farmers and cocoa
27 | NOTES TECHNIQUES – N°24 – DÉCEMBRE 2016
Table 7 – Number of plots per farmer
Number of plots
Number of farmers
% Total % c
1 649 89.39% 89.39%2 62 8.54% 97.93%3 13 1.79% 99.72%4 1 0.14% 99.86%5 1 0.14% 100%
Total 726 100%
Figure 19 – Size of farms
Plots are 24 years-old on average, and this mean equals the median, meaning that 50% of plots are more than 24 years-old (and 75% more than 31 years-old). The sampled cocoa orchard (area-weighted average age of plots) is 26.5 years old. Plots are thus quite old, as it is considered that above 25 years, and after a peak between 16 and 20 years, yields begin to decline (Assiri et al., 2009, see also Figure 22).
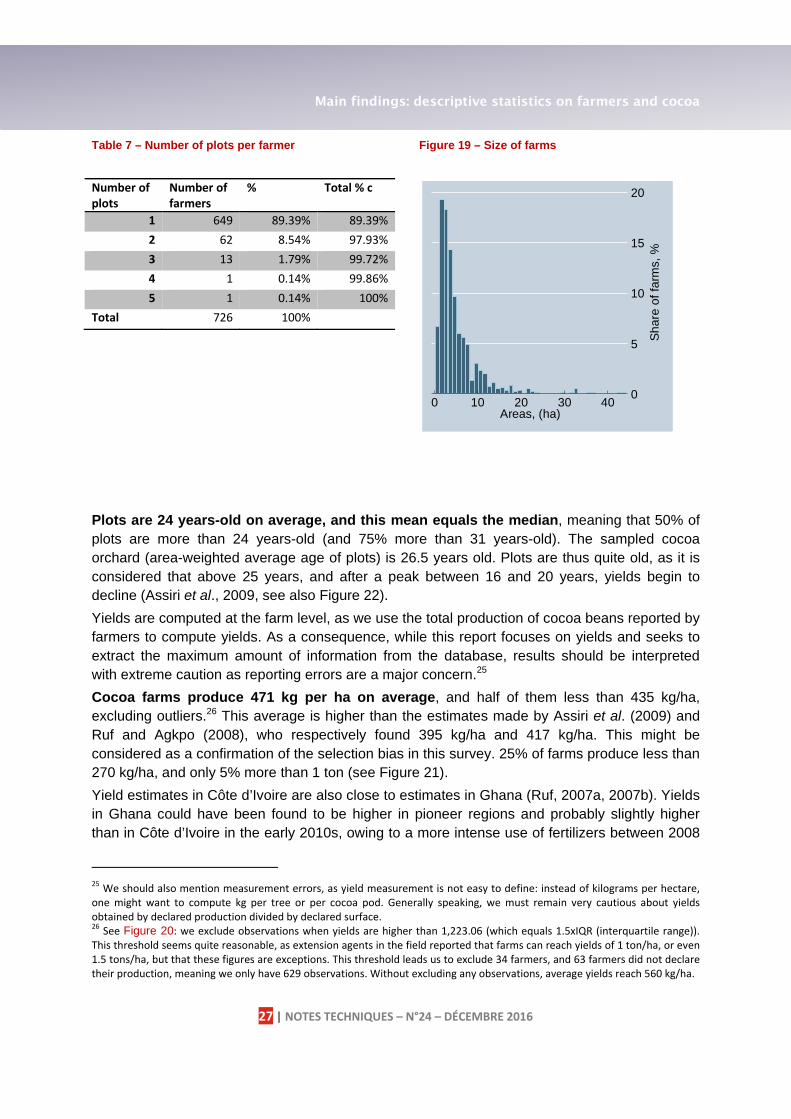
Yields are computed at the farm level, as we use the total production of cocoa beans reported by farmers to compute yields. As a consequence, while this report focuses on yields and seeks to extract the maximum amount of information from the database, results should be interpreted with extreme caution as reporting errors are a major concern.25
Cocoa farms produce 471 kg per ha on average, and half of them less than 435 kg/ha, excluding outliers.26 This average is higher than the estimates made by Assiri et al. (2009) and Ruf and Agkpo (2008), who respectively found 395 kg/ha and 417 kg/ha. This might be considered as a confirmation of the selection bias in this survey. 25% of farms produce less than 270 kg/ha, and only 5% more than 1 ton (see Figure 21).
Yield estimates in Côte d’Ivoire are also close to estimates in Ghana (Ruf, 2007a, 2007b). Yields in Ghana could have been found to be higher in pioneer regions and probably slightly higher than in Côte d’Ivoire in the early 2010s, owing to a more intense use of fertilizers between 2008
25 We should also mention measurement errors, as yield measurement is not easy to define: instead of kilograms per hectare, one might want to compute kg per tree or per cocoa pod. Generally speaking, we must remain very cautious about yields obtained by declared production divided by declared surface. 26 See Figure 20: we exclude observations when yields are higher than 1,223.06 (which equals 1.5xIQR (interquartile range)). This threshold seems quite reasonable, as extension agents in the field reported that farms can reach yields of 1 ton/ha, or even 1.5 tons/ha, but that these figures are exceptions. This threshold leads us to exclude 34 farmers, and 63 farmers did not declare their production, meaning we only have 629 observations. Without excluding any observations, average yields reach 560 kg/ha.
0
5
10
15
20
Sh
are
of
farm
s, %
0 10 20 30 40Areas, (ha)
Main findings: descriptive statistics on farmers and cocoa
28 | NOTES TECHNIQUES – N°24 – DÉCEMBRE 2016
and 2012, but nowadays, there is a form of convergence in yield estimates. In Indonesia, yields used to be very high, close to 2 tons/ha until 1997. They subsequently started to decline regularly and rapidly and are now often below the West African averages (Ruf 2007a, 2007b).
Figure 22 and Figure 23 show, with no surprise, that the age of plots and the region are correlated with yields. Furthermore, trees are largely affected by diseases: 98% of plots are infected by one or several diseases (see Figure 24 below for more details). In short, plots characteristics are highly correlated with low yields, and the rejuvenation of plots is thus necessary. It is for this reason that the government of Côte d’Ivoire has launched rehabilitation and replanting programs, which provide farmers with materials, plant protection and fertilizers (see Wessel & Quist-Wessel, 2015, for more details). Barry Callebaut and others have also started to inform farmers about the need to start planting new trees on their farms. The idea is to space out the replacement of trees over time in order to secure incomes generated by cocoa farming, while rejuvenating the farms. However, certain conditions have to be met in order to ensure that the replanting is successful. Indeed, replanting cannot work without good agricultural practices and a minimum level of fertilizer. The next section studies to what extent these conditions are met.
Figure 20 – Cocoa yields: Outliers
Figure 21 – Distribution of farms according to cocoa yields
0
2,000
4,000
6,000
Yie
lds
(kg/
ha/c
ocoa
farm
s)
0
500
1000
1500
Yie
lds
(kg/
ha/c
ocoa
farm
s)
0 .25 .5 .75 1Fraction of cocoa farms

Main findings: descriptive statistics on farmers and cocoa
29 | NOTES TECHNIQUES – N°24 – DÉCEMBRE 2016
Figure 22 – Cocoa yields by age
Figure 23 – Cocoa yields by region
Figure 24 – Main pests and diseases (% of plots concerned)
2. Agricultural practices: low use of fertilizer, and lack of access to finance
The maintenance of cocoa plots requires working in between the cocoa crop seasons. Indeed, since cocoa is a seasonal crop, farmers are often working on other activities in order to generate income during the off-season. Hence, farmers are not implementing many good agricultural practices during this period, which could boost their productivity: pruning, weeding, sanitary harvest…
Numerous practices must be implemented in order to increase the productivity of plots. These practices have been popularized by Barry Callebaut’s extension agents and others (including the government) and they are taught to the farmers registered at the cooperatives. These practices should be implemented after the crop season (main and mid) in the following order:
339
427
471486 490
543
478
372 373 379395
0
200
400
600
Ave
rage
yie
lds
(kg/
ha)
0-5
5-10
10-1
5
15-2
0
20-2
5
25-3
0
30-3
5
35-4
0
40-4
5
45-5
0
50-5
5
433
495
430
520
425
0
100
200
300
400
500
Ave
rage
yie
lds
(kg/
ha)
Centre
East
South
South
west
Wes
t
2.2%
6.8%13%
13.3%
16.7%18.8%
29%
Stem borer
Swollen shoot
Shield bugs
Mirids
Black pod rot
Other
No disease
Main findings: descriptive statistics on farmers and cocoa
30 | NOTES TECHNIQUES – N°24 – DÉCEMBRE 2016
- Basic good agricultural practices (pruning, weeding, sanitary harvest, crop protection products);
- Soil fertility management (use of organic or inorganic fertilizers);
- Rejuvenation of plots (with replanting).
There are 824 plots in the sample, but we have information based on on-site observations for 821. Table 8 below synthetizes the information we have on farmers’ agricultural practices. This information relies essentially on farmers’ statement. The observation of good practices in the field require more time and method, while quick on-site check were performed by the enumerators we do not consider the below numbers as good indicators of adoption but rather good proxy for good agricultural practices awareness.

Main findings: descriptive statistics on farmers and cocoa
31 | NOTES TECHNIQUES – N°24 – DÉCEMBRE 2016
Table 8 – Agricultural practices
Agricultural practices % of plots (italicized if % of producers)a Basic information on plots
Origin ¾ new creation, ¼ inherited Projects 50% Rainforest, 20% Fermicoa, 15% other, 15% no project Variety 54% Ghana, 43% mixed
Planting mode 95% bulk, only 16 plots planted in line and 21 both in line and bulk Average n° of shadow trees per
ha 8.22
Basic good agricultural practices: % of plots for which farmers state that they use these practices Pruning 86%
Weeding 99% (almost exclusively manual: 19% also use chemical weed killers) 21% of farmers use chemical weed killers, paid for in cash
Sanitary harvest 93% Phytosanitary products 90%
85% of farmers, and ½ pay cash or get them for free, only 11% on credit Vegetation barriers 41% yes, of which 1/3 only partial
Frequency of harvest 44% every 2 weeks, 37% every 3 weeks, 17% every 4 weeks Fertilizer and soil management protection (see also Table 9 below)
Chemical fertilizers 19.5% 19.5 yes (¾ pay cash, only ¼ on credit)
Organic fertilizers 18.15% (only 3% use both chemical and organic fertilizers) 18% yes (12% homemade, 4.5% pay cash, very few on credit or free (less than 5 farmers)
Regeneration of plots % of farmers who have already…
Heard about re-planting ¾ yes, mainly from cooperatives or extension agents Heard about grafting 50%, mainly from cooperatives or extension agents
Viewed re-planting 58%, mainly with plot farmers
Re-planted themselves
1/3 sample, 43% among those who have heard. Among them: 50% said that they renewed because the trees are too old, ¼ because of diseases. 93% are satisfied with this method. Among those who do not replant: 45% because they lack knowledge, 27% because it is not appropriate (young plots), 10% because they lack time, 8% lack financial means. 37% of plots farmers said that they have started replanting
Main diseases See Figure 24 Food crops ¾ of plots also contains food crops
Future of cocoa 95% of farmers said that they wanted to continue cocoa (including 27% who want to grow more trees, and 16% to renew plots)
(a) As we have information on plots and/or farmers’ statements on their general practices, we present information extracted from both sources of information.

Main findings: descriptive statistics on farmers and cocoa
32 | NOTES TECHNIQUES – N°24 – DÉCEMBRE 2016
The vast majority of plots (three quarters) benefit from a sustainable project based on a certification or verification process (mainly Rainforest Alliance, but also UTZ and Fairtrade), or from other projects designed and implemented by Barry Callebaut providing a price premium. As previously explained, this led to a selection bias towards high-performing farmers in our sample, and may also explain why we found higher farmer incomes than in other studies, whereas yields are quite similar (see Section 3). Bulk planting and varieties used by farmers may imply training and/or coaching and have a minimal impact. Indeed, only 1% of farmers use the “Mercedes” variety, which is more productive and more resistant to pest attacks and diseases than older ones. It could also reveal a lack of access to improved material.
Almost all farmers say that they are familiar with basic good agricultural practices. However, percentages in Table 8 should be interpreted with caution, as statements concerned farmers’ behavior in general (i.e. we do not know if weeding is done one, twice, or more a year). Interesting lessons concern the use of chemical products: less than 20% of farmers use agro-chemical products, which most of the time are paid for in cash. Reasons for not using chemical herbicides include mistrust (43% said that herbicide was bad for the ground27 and 15% that it was not useful) and the lack of means (34%). The lack of financial means is the main reason for not using fertilizer (80%). Most farmers think fertilizer is indeed useful, but they cannot afford it. Among the non-users of organic fertilizer, 26% did not have the time to do it, 26% did not know about it or know how to use it, and 26% lack the financial means. In a nutshell, the lack of financial means and/or labor force remain the main barriers to the use of inputs (see Table 9).
Table 9 – Main reasons for not using agro-inputs and seedlings
Main reasons for not using inputs (% cited)Inputs (nb of answers) Lack of
financial means
“not useful” or “bad for the field” (mistrust)
Lack of knowledge
Lack of time or workforce
Chemical fertilizer (523) 82 9 5 2 Organic fertilizer (530)
(produced on-farm) 27 14 29 29
Organic fertilizer (637) (other) 82 8 8 1
Phyto-sanitary products (61) 80 11 5 3
Herbicide (512) 36 62 2 2 Seedlings (238) 50 29 0.5 21
This result must be related to the fact that only 18% of respondents have a bank account. This figure seems reasonable compared to the average 20.7% access to formal accounts for adults in Sub-Saharan African rural areas.28 75% of them acquired one in the last 10 years 27 71% of farmers who do not use chemical weed killers because they think it is bad for the ground implement the Rainforest Alliance: not using chemical weed killers is a standard they have to comply with for the program. 28 Source: World Bank, 2012. However, in 2007-2008, Ruf and Agkpo (2008) found that less than 1% of farmers had a bank account. This discrepancy may be explained in different ways: i) a big change occurred in very recent years, possibly in relation

Main findings: descriptive statistics on farmers and cocoa
33 | NOTES TECHNIQUES – N°24 – DÉCEMBRE 2016
before the survey. The main reason given for not having a bank account is that they do not have enough money to put on the account. Farmers with no bank account would almost all like to have one account to save money and, to a lesser extent, to access credit.
Indeed, 40% of farmers report that they are used to requesting credit. This credit usually comes from farmers’ organizations (half of the cases) or relatives (30%).29 It is used to cover school and health expenditures. These two items are found to have similar importance in demographic studies as reasons for credit.30
70% of farmers report that they save money, but for at least half of them, these savings are kept at home for emergencies than proper savings. 20% use relatives to keep their savings, and a small proportion (15%) use bank services. The main reasons reported for saving are for health expenditures (65%), the education of children (45%), family emergencies (26%) and various household expenditures (24%).
An alternative to traditional banks is mobile banking, a widespread tool in Africa. 65% of farmers know about this tool and almost two-thirds of them have been using it. All of them say that they are satisfied with the service. This is higher than the 29% Sub-Saharan average.31 However, this means is more used as a way to transfer money safely. About 85% of farmers used the service to transfer money to their relatives, which is also in line with external studies.
In short, the financing of cocoa through financial systems, either conventional banks or mobile money, thus remains largely inexistent. Less than 10% of farmers finance cocoa plots with credit (71 farmers) and less than 10% with savings (77 farmers). Interestingly, these ways of financing are mutually exclusive (i.e. only 9 farmers finance cocoa plots with both savings and credit). These ways of financing are not related to the banking system, either conventional or mobile, as 63% of credits are made through the cooperative, and 29% through relatives or friends. Figures are similar for savings, as almost 50% of farmers who use savings to finance cocoa plots save money at home, 20% at relatives’ or friends’ homes and 20% at the bank.
30% of cocoa farmers have started to rejuvenate their plots, and only ¼ of cocoa farmers have never heard about replanting practices. 40% of growers have had the opportunity of seeing a replanted plot, 1/3 on another farmer’s plot. 74% of the farmers who heard about the rejuvenating method and saw it on another farmer’s plot applied the rejuvenating method. Conversely, among those who started replanting, 69% saw it implemented on another farmer’s plot. Hence, farmers seem more responsive to visual displays of replanting practices.32 As regards barriers to the adoption of replanting, farmers mainly cited their lack of knowledge in terms of implementing replanting. Nonetheless, 43% of farmers have already seen this method on demonstration plots. Lastly, the asset-based indicator is statistically higher for farmers who
to certification and cooperative development (which would be a positive impact), or following the pattern of the rapid expansion of access to finance shown by the World bank (2012), ii) in general, this “big change” could be partially explained by the relatively strong percentage of cocoa/rubber smallholders, as rubber used to be a driver to open bank accounts (Ruf 2013), in our case indeed, 19% of farmers said that they grew rubber (see next section), iii) a partial bias in the sampling, as most farmers belong to cooperatives. 29 Family or friends are identified as a source for credit in 39.9% of cases (World Bank, 2012). 30 15.1% of credits are linked to health emergencies and 9% of credits are related to school expenditures (World Bank, 2012). 31 World Bank, 2012. 32 Of course, saying that, “seeing is believing”. This would require more research, see for example Kondylis et al. (2014).

Main findings: descriptive statistics on farmers and cocoa
34 | NOTES TECHNIQUES – N°24 – DÉCEMBRE 2016
started to rejuvenate their farms than for other groups (0.26 versus 0.19), whereas total income does not differ between these two groups. Rejuvenation was linked to socioeconomic status. Least poor farmers were more likely to practice rejuvenation than the poorest one. Investment decisions, such as replanting, might depend on wealth and the socio-economic status (stock) rather than on income (flow).
To conclude this section on yields and agricultural practices, we tested whether yields differ according to variables which vary in our sample. Yields are statistically higher (+110 kg/ha) when farmers use chemical fertilizers. Not surprisingly, we can thus hypothesize – and this would require deeper analyses as our database does not allow time and fixed-effects to be controlled – that the key variables for yields are fertilizer use and the age of plots (and fertilizer use is statistically higher for farmers who have access to a bank account). Unfortunately, the survey does not allow evaluating the relevance of GAP for yield, because all farmers stated that they were applying them. Deeper investigation of the determinants of yields would require more research and perhaps more data, including data on labor (time) spent on plots.
3. Farmers’ expectations from cocoa and other cash crops: persistent interest in cocoa
This section analyze the competitiveness of cocoa farming compared to other cash crop attracting farmers (rubber, coffee or palm oil) and describe farmers’ expectations towards cocoa farming. Among all the crops investigated, only coffee and rubber were widespread among cocoa farmers. Other crops, such as palm oil, are not yet widespread among cocoa farmers. We will therefore focus the following analysis on these two crops.
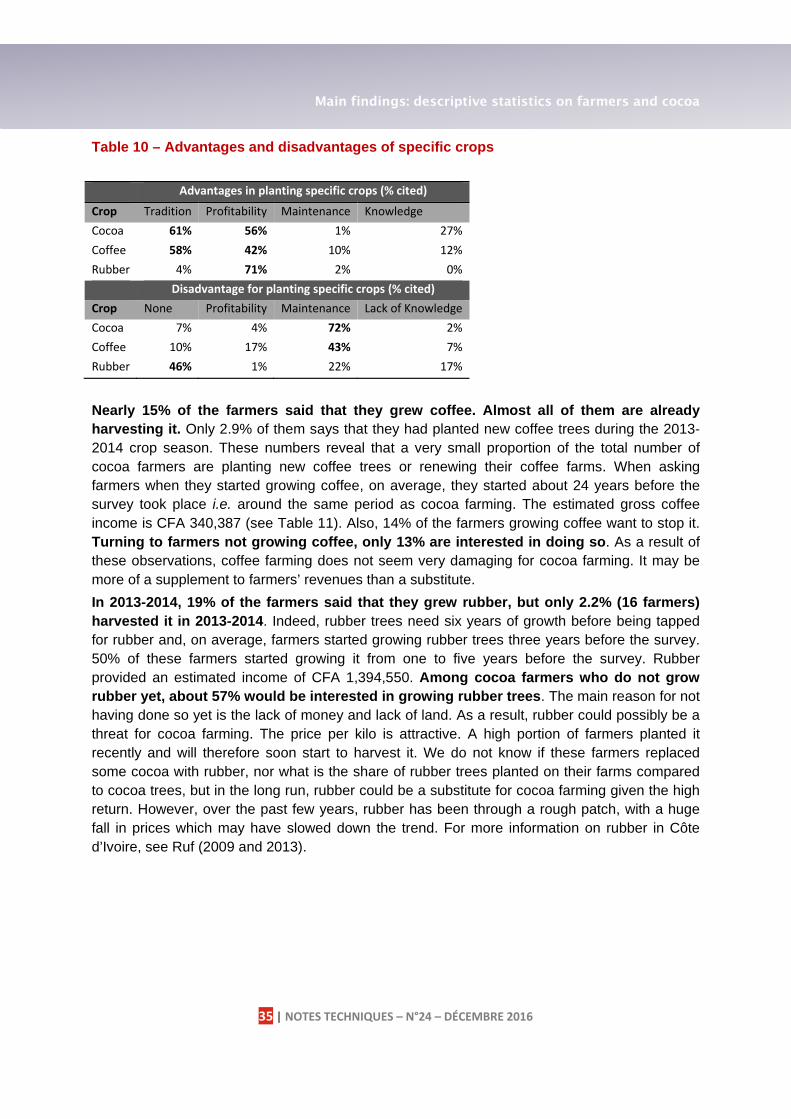
Almost none of the farmers interviewed (1%) told the surveyor that they wanted to stop farming cocoa.33 We analyze below farmers’ perceptions towards cocoa farming and compare them to the perception of coffee and rubber farming, as it might drive future decisions to grow more or less cocoa, or to replace cocoa with another crop. The main advantages given by farmers growing cocoa are the traditional aspect mentioned by 61% of farmers and the profitability aspect mentioned by 56% of them. Compared to coffee and rubber, the economic aspect applies to all the crops as an important driver for growing a specific crop. The traditional aspect is very specific to cocoa and coffee, while the profitability aspect is the strongest for rubber. While the maintenance of the farm is clearly perceived as a disadvantage in cocoa farming for 72% of farmers and for 43% in the case of coffee farming, only 22% of farmers have this perception towards rubber farming. Rubber farming could thus be a threat to cocoa in the long run, when the “tradition” of cocoa might not be relevant for the new generation, particularly when price differentials are high.
33 This should be interpreted with caution, as prices started to increase during the year of the survey, and cocoa prices drive such expectations.
Main findings: descriptive statistics on farmers and cocoa
35 | NOTES TECHNIQUES – N°24 – DÉCEMBRE 2016
Table 10 – Advantages and disadvantages of specific crops
Advantages in planting specific crops (% cited)Crop Tradition Profitability Maintenance KnowledgeCocoa 61% 56% 1% 27%Coffee 58% 42% 10% 12%Rubber 4% 71% 2% 0%
Disadvantage for planting specific crops (% cited)Crop None Profitability Maintenance Lack of KnowledgeCocoa 7% 4% 72% 2%Coffee 10% 17% 43% 7%Rubber 46% 1% 22% 17%
Nearly 15% of the farmers said that they grew coffee. Almost all of them are already harvesting it. Only 2.9% of them says that they had planted new coffee trees during the 2013-2014 crop season. These numbers reveal that a very small proportion of the total number of cocoa farmers are planting new coffee trees or renewing their coffee farms. When asking farmers when they started growing coffee, on average, they started about 24 years before the survey took place i.e. around the same period as cocoa farming. The estimated gross coffee income is CFA 340,387 (see Table 11). Also, 14% of the farmers growing coffee want to stop it. Turning to farmers not growing coffee, only 13% are interested in doing so. As a result of these observations, coffee farming does not seem very damaging for cocoa farming. It may be more of a supplement to farmers’ revenues than a substitute.
In 2013-2014, 19% of the farmers said that they grew rubber, but only 2.2% (16 farmers) harvested it in 2013-2014. Indeed, rubber trees need six years of growth before being tapped for rubber and, on average, farmers started growing rubber trees three years before the survey. 50% of these farmers started growing it from one to five years before the survey. Rubber provided an estimated income of CFA 1,394,550. Among cocoa farmers who do not grow rubber yet, about 57% would be interested in growing rubber trees. The main reason for not having done so yet is the lack of money and lack of land. As a result, rubber could possibly be a threat for cocoa farming. The price per kilo is attractive. A high portion of farmers planted it recently and will therefore soon start to harvest it. We do not know if these farmers replaced some cocoa with rubber, nor what is the share of rubber trees planted on their farms compared to cocoa trees, but in the long run, rubber could be a substitute for cocoa farming given the high return. However, over the past few years, rubber has been through a rough patch, with a huge fall in prices which may have slowed down the trend. For more information on rubber in Côte d’Ivoire, see Ruf (2009 and 2013).

Main findings: descriptive statistics on farmers and cocoa
36 | NOTES TECHNIQUES – N°24 – DÉCEMBRE 2016
Table 11 – Average production per crop, and gross income estimations
Crops Price (CFA)/kg (2012-13)
N° of farmers
producing Kg
Gross income
(price*kg)
Cocoa 725 684 2,247 1,629,005 Coffee 620 94 549 340,387 Rubber 1,200 16 1,162 1,394,550 Note: To get the estimations of gross income for each crop, we multiply the production declared by farmers by prices. Estimates are different from those provided in Table 5, but are, however, quite similar.

Conclusion
37 | NOTES TECHNIQUES – N°24 – DÉCEMBRE 2016
Conclusion
In Côte d’Ivoire, where cocoa accounts for 20% of the gross domestic product, it is estimated that more than 5 million people depend upon 700,000 cocoa growers for their livelihoods. However, this report shows that farmers, even with the benefit from sustainable projects, such as Rainforest Alliance or private sector initiatives, are still living far under the poverty line of USD 2 a day, with a per capita daily cocoa income of USD 1.17. Improving the economic profitability of cocoa farms is thus a necessity, as diversification is still very low within cocoa farmers’ households who rely heavily on cocoa as a primary source of cash income. Our findings also indicate that basic socioeconomic infrastructure that give access to primary schools, primary health care and drinking water is not available for all farmers. In accordance with accepted development frameworks, for example Cocoa Action, further development of this socioeconomic environment together with increasing individual household income, is required. Improving the economic viability of cocoa farms in a sustainable way is the main challenge for cocoa in Côte d’Ivoire. Indeed, many farms are old and yields are low, but little land is available for extensive cocoa growing. Consequently, further production and improving the economic viability of farms has to come from better yields and replanting old cocoa farms.
To design and implement efficient solutions, quantitative and qualitative information on farmers’ socio-economic environment and means, yields and practices, are needed. This reports details the many difficulties farmers have to cope with. They have a poor access to basic socioeconomic infrastructure and to finance. Yields are low (435 kg/ha), farms are small (4.87 ha) and old (24 years old), and affected by at least one disease (mainly by stem borer and swollen shoots virus (CSSV) and mirid bugs). The barriers to yield improvements are the insufficient use of fertilizers (including organic fertilizers) due to insufficient financial means, the lack of access to finance and, for replanting, the lack of knowledge of best management practices. Replanting, which is of particular relevance in Côte d’Ivoire as trees are old and highly affected by diseases, is an important investment decision which might depend on wealth and the socio-economic status (stock) rather than on income (flow). This stresses the importance of accompanying farmers in this process, as sources of income during the first years following replanting are sharply reduced. However, farmers still find cocoa profitable and do not envisage giving up this crop. Moreover, main reason for not adopting good agricultural practices is not the lack of trust, but the lack of means; and when farmers receive training and means to improve their practices and yields, they are highly satisfied. This suggests that there is room for improvement of the environmental and economic sustainability of cocoa.

References
38 | NOTES TECHNIQUES – N°24 – DÉCEMBRE 2016
References
Araujo-Bonjean, C., J.L. Combes, J.F. Brun, G. Chambas & P. Plane (2001), Modes d’organisation des filières et lutte contre la pauvreté: les cas du coton et du cacao, Rapport du Ministère des Affaires Etrangères, 144p.
Assiri, A.A., G.R Yoro, O. Deheuvels, B.I. Kébé, Z.J. Keli, A. Adiko & A. Assa (2009), Les caractéristiques agronomiques des vergers de cacaoyer (Theobroma cacao L.) en Côte d’Ivoire, Journal of Animal & Plant Sciences, 2 (1), 55-66.
COSA (2013), The COSA Measuring Sustainability Report: Coffee and Cocoa in 12 Countries, Philadelphia, PA: The Committee on Sustainability Assessment.
Ehrhart, H. (2015), “Les enjeux de la nouvelle croissance ivoirienne”, collection Macroéconomie et Développement, n° 20, Agence Française de Développement, Paris, October.
Filmer, D. & L.H. Pritchett (2001), Estimating Wealth Effects without Expenditure Data – or Tears: An Application to Educational Enrollments in States of India, Demography, 38(1), 115-132.
Gilbert, C.L. (2009), Cocoa Market Liberalization in Retrospect, Review of Business and Economics, 54(3), 294-312.
Gilbert, C., & P. Varangis (2004), Globalization and International Commodity Trade with Specific Reference to the West African Cocoa Producers, in Challenges to Globalization: Analyzing the Economics (pp. 131-166), University of Chicago Press.
Hainmueller, J., M. Hiscox, & M. Tampe (2011). Sustainable development for cocoa farmers in Ghana. International Growth Centre Working Paper.
Ingram, V., Y. Waarts, L. Ge, S. van Vugt, L. Wegner, L. Puister-Jansen, F. Ruf & R. Tanoh (2014), The IDH Cocoa Productivity and Quality Programme (CPQP) in Côte d’Ivoire, Impact Assessment Framework and Baseline, LEI Wageningen UR (University & Research Centre), LEI Report 2014-016. 196 pp., Wageningen.
Kolenikov, S. & G. Angeles (2009), “Socioeconomic Status Measurement with Discrete Proxy Variables: Is Principal Component Analysis a Reliable Answer?”, Review of Income and Wealth, 55 (1), 128-165.
Kondylis, F., V. Mueller & S.J. Zhu (2014), Seeing is believing? Evidence from an Extension Network Experiment (August 1, 2014), World Bank Policy Research Working Paper, (7000).
Lemeilleur, S., Y. N'Dao & F. Ruf (2015), “The Productivist Rationality Behind a Sustainable Certification Process: Evidence from the Rainforest Alliance in the Ivorian Cocoa Sector”, International Journal of Sustainable Development, 18 (4), 310-328.
Potts J., M. Lynch, A. Wilkings, G. Huppé, M. Cunningham & V. Voora (2014), “Cocoa market”, Chapter 7 (pp.131-154), in The State of Sustainability Initiatives Review 2014, Standards and the Green Economy, IISD and IIED, Winnipeg and London, 332 p.
Ruf, F. (2002), Changes in Labour and Non-labour Inputs in Côte d’Ivoire Cocoa Farms. 1997-2001. What Impact on Cocoa Supply? CIRAD, Report for Dreyfus. Montpellier, 75 p.

References
39 | NOTES TECHNIQUES – N°24 – DÉCEMBRE 2016
Ruf, F. (2007a), The Cocoa Sector. Expansion or a Green or a Double Green Revolution? IFPRI/ODI (Eds.), Production, Markets and the Future of Smallholders. The Role of Cocoa in Ghana, Accra, 19 November, 4 p.
Ruf, F. (2007b), The new Ghana Cocoa Boom in the 2000s. From Forest Clearing to Green Revolution. The European Union and CIRAD, CIRAD, Montpellier, 40p.
Ruf, F. (2009), “Smallholder Rubber Production in Côte d’Ivoire Innovation in the Gagnoa region”, AFD Evaluation and Capitalisation series, Ex Post n° 29.
Ruf, F. (2013), « Agriculture contractuelle et boom des plantations villageoises d’hévéas en Côte d’Ivoire », Cahiers de l’Agriculture, 22 (1): 46-53.
Ruf, F. & J.L. Agkpo (2008), Etude sur le revenu et les investissements des producteurs de café et de cacao en Côte d’Ivoire, Agrisystems Consortium.
Tulane University (2015), 2013/14 Survey Research on Child Labor in West African Cocoa Growing Areas; Tulane University, School of Public Health and Tropical Medicine.
UNDP & INS (2011), « Sources de croissance économique, pauvreté, inégalités et implications de politiques économiques en Côte d’Ivoire », September.
Vyas, S. & L. Kumaranayake (2006), Constructing Socio-economic Status Indices: How to Use Principal Components Analysis, Health Policy and Planning, 21(6), 459-468.
Wessel, M., & P. F. Quist-Wessel (2015), “Cocoa production in West Africa, a review and analysis of recent developments”, NJAS-Wageningen Journal of Life Sciences, 74, 1-7.
World Bank (2012), The Little Data Book on Financial Inclusion 2012.

Prior publications in the collection
40 | NOTES TECHNIQUES – N°24 – DÉCEMBRE 2016
Prior publications in the collection
Notes techniques n°1 Panorama des inégalités hommes – femmes dans le monde (Juin 2015)
Notes techniques n°2 La Commission du Mékong face à un tournant –
Quelle place pour l’aide française (Septembre 2015)
Notes techniques n°3 Quelle efficacité environnementale de la certification pêche et aquaculture « durable » ? (Septembre 2015)
Notes techniques n°4 Vérité des prix ou socialisation de la couverture des coûts ? (Octobre 2015)
Notes techniques n°5 Accompagnement technique et renforcement des capacités : leçons de l'expérience (Octobre 2015)
Technical Reports n°6 Actors and networks of agroecology in the Greater Mekong Subregion (October 2015)
Technical Reports n°7 Creating Alliances to Accelerate Commercially Viable Sanitation (November 2015)
Notes techniques n°8 La recherche française sur l’éducation dans les pays en développement : un état des lieux (Novembre 2015)
Technical Reports n°9
Facilitating green skills and jobs in developing countries
Notes techniques n°10 Étude sur le développement de l’entreprenariat social à Madagascar
Notes techniques n°11 Ecole et Santé de la reproduction Une recherche-action dans les départements du Littoral et de l’Atlantique au Bénin (novembre 2014 – juillet 2015)

Prior publications in the collection
41 | NOTES TECHNIQUES – N°24 – DÉCEMBRE 2016
Notes techniques n°12 Observation spatiale pour l’agriculture en Afrique : potentiels et défis
Notes techniques n°13 Améliorer la prise en compte de la nutrition dans les projets de développement rural et de santé
Notes techniques n°14 Villes et stratégies climatiques : cinq cas d’études
Notes techniques n°15 Jeunesses sahéliennes : dynamiques d’exclusion, moyen d’insertion
Technical Reports n°16 Supporting Access to and Retention in Employment for Women by Enhancing Child Care Services in Turkey
Notes techniques n°17 Méthode de suivi de l’impact climat des investissements (MRV) appliquée aux projets agricoles et forestiers des Banques Nationales de Développement
Notes techniques n°18 Gestion des ressources en eau souterraines comme biens communs
Notes techniques n°19 Eau des villes, assainissement et précarités – des réalités contrastées à Ouagadougou (Burkina Faso) et Niamey (Niger)
Technical Reports n°20 The effectiveness of an environmental credit line in Egypt: Synergies between market incentive and binding regulations
Notes techniques n°21 Développement rural à co-bénéfices - Gouvernance, suivi, certification
Notes techniques n°22 Dynamiques des systèmes agraires et devenirs de l’agriculture familiale en guinée

Prior publications in the collection
42 | NOTES TECHNIQUES – N°24 – DÉCEMBRE 2016
Notes techniques n°23 Evaluation de la politique d’aménagement du territoire en Tunisie de 1995 à 2010

What is AFD?
43 | NOTES TECHNIQUES – N°24 – DÉCEMBRE 2016
What is AFD?
Agence Française de Développement (AFD), a public financial institution that implements the policy defined by the French Government, works to combat poverty and promote sustainable development.
AFD operates on four continents via a network of 75 offices and finances and supports projects that improve living conditions for populations, boost economic growth and protect the planet.
In 2015, AFD earmarked EUR 8.3bn to finance projects in developing countries and for overseas France.
Agence Française de Développement 5 rue Roland Barthes – 75598 Paris cedex 12
Tél : +33 1 53 44 48 86 – www.afd.fr
Design and layout: Elsa MURAT, AFD