nuclear energy versus solar energy (nuke vs. pv): the
TRANSCRIPT

NUCLEAR ENERGY VERSUS SOLAR ENERGY (NUKE VS. PV): THE COMPARISON OF THEIR ECONOMIC FEASIBILITIES AND
ENVIRONMENTAL ASPECTS FOR TURKEY
A THESIS SUBMITTED TO THE GRADUATE SCHOOL OF NATURAL AND APPLIED SCIENCES
OF THE MIDDLE EAST TECHNICAL UNIVERSITY
BY
ABDULLAH BUĞRAHAN KARAVELİ
IN PARTIAL FULFILLMENT OF THE REQUIREMENTS FOR
THE DEGREE OF MASTER OF SCIENCE IN
EARTH SYSTEM SCIENCE
JANUARY 2014


Approval of the thesis:
NUCLEAR ENERGY VERSUS SOLAR ENERGY (NUKE VS. PV): THE COMPARISON OF THEIR ECONOMIC FEASIBILITIES AND ENVIRONMENTAL ASPECTS FOR TURKEY
submitted by ABDULLAH BUĞRAHAN KARAVELİ in partial fulfillment of the requirements for the degree of Master of Science in Earth System Science (ESS), Middle East Technical University by, Prof. Dr. Canan Özgen _____________________ Dean, Graduate School of Natural and Applied Sciences Prof. Dr. Ayşen Yılmaz _____________________ Head of Program, Earth System Science (ESS) Prof. Dr. Bülent Gültekin Akınoğlu _____________________ Supervisor, Physics Dept., METU / ESS - METU Prof. Dr. Uğur Soytaş _____________________ Co-Supervisor, Bus. Adm. Dept., METU / ESS - METU Examining Committee Members: Prof. Dr. Ayşen Yılmaz _____________________ IMS – METU / ESS - METU Prof. Dr. Bülent Gültekin Akınoğlu _____________________ Physics Dept., METU / ESS - METU Prof. Dr. Uğur Soytaş _____________________ Bus. Adm. Dept. / ESS - METU Prof. Dr. Raşit Turan _____________________ Physics Dept., METU Prof. Dr. Osman Yılmaz _____________________ Physics Dept., METU
Date: _______________

iv
I hereby declare that all information in this document has been obtained and
presented in accordance with academic rules and ethical conduct. I also declare
that, as required by these rules and conduct, I have fully cited and referenced
all material and results that are not original to this work.
Name, Last name : Abdullah Buğrahan, KARAVELİ
Signature :

v
ABSTRACT
NUCLEAR ENERGY VERSUS SOLAR ENERGY (NUKE VS. PV): THE
COMPARISON OF THEIR ECONOMIC FEASIBILITIES AND
ENVIRONMENTAL ASPECTS FOR TURKEY
Karaveli, Abdullah Buğrahan
MSc., Earth System Science (ESS)
Supervisor : Prof. Dr. Bülent Gültekin Akınoğlu
Co-Supervisor : Prof. Dr. Uğur Soytaş
January 2014, 139 pages
Having global regime with increasing environmental threats, reaching limits
to growth, ascending needs and aspirations, humanity is seeking for new options not
only to meet the needs but also to reconcile economic feasibility considering
environmental vulnerability. Energy is at the hub of above mentioned concerns as
taking a part in both of creating problems and of producing solutions. This study
examines and compares the economic feasibility and environmental effectiveness of
nuclear energy and solar energy options for Turkey, a country which is at the
threshold of new investments to meet its expanding electricity demand depending on
sui-generis conditions. The comparison is made specifically for two case studies, the
photovoltaic energy (PV) power plant in Karapinar Energy Specialised Industrial
Zone and the nuclear energy (NUKE) power plant in Mersin Akkuyu. Former case
study determines exposed solar irradiation amount, design parameters, total
electricity production, life cycle assessment and inventory, CO2 reduction potential,
levelised cost of energy and payback of an aforementioned photovoltaic power plant.
The latter similarly identifies the material use, environmental affect, CO2 reduction
potential, levelised cost of energy and payback of an above mentioned nuclear
energy power plant. Then, the outputs are compared.
Abiding by allocation of same installed power, namely 4800 MW; both
options have advantages and disadvantages. While PV is cheaper without land cost,

vi
NUKE produces more electricity. Although NUKE has much more cumulative CO2
reduction, PV is more beneficial in terms of CO2 reduction per unit of electricity. PV
needs quite more area, however, it requires very much less days for commissioning
and decommissioning when compared to NUKE. When PV installation needs less
water, less concrete, less steel, NUKE requires less aluminum, less glass.
Key Words: Nuclear, PV, LCA, LCOE, CO2

vii
ÖZ
NÜKLEER ENERJİYE KARŞI GÜNEŞ ENERJİSİ (NUKE VS. PV): TÜRKİYE
İÇİN EKONOMİK UYGULANABİLME VE ÇEVRESEL AÇIDAN
KARŞILAŞTIRMASI
Karaveli, Abdullah Buğrahan
Yüksek Lisans, Yer Sistem Bilimleri EABD
Tez Yöneticisi : Prof. Dr. Bülent Gültekin Akınoğlu
Ortak Tez Yöneticisi : Prof. Dr. Uğur Soytaş
Ocak 2014, 139 sayfa
Çevresel tehditlerin arttığı, büyümenin sınırlarına ulaşıldığı, ihtiyaç ve
isteklerin arttığı küresel düzene sahip insanlık, hem talepleri karşılayacak hem de
ekonomik uygulanabilirliğe sahip ve çevreye uyumlu yeni seçenekler aramaktadır.
Enerji, yukarıda anlatılan endişelerin, hem problemlerinin hem de çözümünün bir
parçası olarak tam merkezinde yer almaktadır. Bu çalışma, artan elektrik ihtiyacını
karşılaması için yeni yatırımların eşiğinde olan Türkiye için, ülke koşullarında
kendine özgü şartlarda, nükleer enerji ve güneş enerjisi seçeneklerinin ekonomik ve
çevresel uygunluklarını incelemekte ve karşılaştırmaktadır. Mezkûr karşılaştırma
Karapınar Enerji İhtisas Endüstri Bölgesine kurulacak olan Fotovoltaik enerji (PV)
güç santrali ile Mersin Akkuyu’ya kurulacak olan nükleer enerji (NUKE) güç
santralini içeren iki örnek çalışmanın karşılaştırılması şeklindedir. Birinci örnek
çalışmada, söz konusu santralin kullanacağı güneş enerjisi miktarı, tasarım
parametreleri, toplam elektrik üretimi, yaşam döngüsü analizi (YDA) ve envanteri,
CO2 azaltım potansiyeli, seviyelendirilmiş maliyet analizi (SMA) ve geri ödemesi
tanımlanmaktadır. İkinci çalışmada ise, benzer olarak, ilgili santralin malzeme
kullanımı, çevresel etki, CO2 azaltım potansiyeli, seviyelendirilmiş maliyet analizi ve
geri ödemesi belirlenmektedir. Ardından, iki örnek çalışmanın çıktıları aynı kurulu
güçlere sahip olmaları koşulu ile karşılaştırılmaktadır.

viii
4800 MW olmak üzere aynı kurulu güç miktarını tahsis ettiğimizde, iki seçeneğinde
diğerine göre avantaj ve dezavantajları ortaya çıkmaktadır. Alan maliyeti hesaba
katılmadığında PV daha ucuz iken, NUKE daha fazla elektrik üretir. NUKE çok daha
fazla toplam CO2 azaltım potansiyeli olmasına rağmen, birim elektrik başına CO2
azaltımında PV daha faydalıdır. PV daha fazla alana ihtiyaç duyarken, çok daha kısa
kurulum ve söküm süresi gerektirmektedir. PV kurulumu daha az su, beton, çelik
gerektirirken, NUKE daha az alüminyum, daha az cam gerektirir.
Anahtar Kelimeler: Nükleer, Fotovoltaik, YDA, SMA, CO2

ix
to all who imagine

x
ACKNOWLEDGEMENTS
The author desires to express his deepest gratitude to his supervisor Prof. Dr.
Bülent Gültekin Akınoğlu and co-supervisor Prof. Dr. Uğur Soytaş for each
respectifull contributions not only for their guidance, advice, criticism,
encouragements but also insight, tolerance and favour throughout the study.
The author dedicates this study to the ones who thinks on wellfare of the
humanity and the environment, flats over the troubles humanity and the environment
faced, endeavours to tackle with global threats and imagines a better life.
The author represents his sincere gratitude to Examining Commitee
Members.
The author also would like to thank to Mrs. Ayşe Banu Kosif and Mr. Deniz
Selkan Polatkan for their helps that they kindly offerred about the specifications and
information on PV panels.
The author also extends his thanks to the distinguished contributors whose
studies shed light to this study.
The last but not the least, gratitutes are for Earth System Science (ESS)
Program of the Middle East Technical University (METU) because of its providing
an opportunity to bring about this thesis.

xi
TABLE OF CONTENTS
ABSTRACT ................................................................................................................. v
ÖZ .............................................................................................................................. vii
ACKNOWLEDGEMENTS ......................................................................................... x
TABLE OF CONTENTS ............................................................................................ xi
LIST OF TABLES .................................................................................................... xiii
LIST OF FIGURES .................................................................................................. xvi
LIST OF ABBREVIATIONS .................................................................................. xvii
CHAPTERS ................................................................................................................. 1
1. INTRODUCTION ................................................................................................... 1
1.1. The Main Scenario of the Study........................................................................ 1
1.2. Global Trends and Threats ................................................................................ 3
1.3. Global Energy Outlook ..................................................................................... 5
1.3.1. PV Outlook ............................................................................................ 6
1.3.2 NUKE Outlook ...................................................................................... 7
1.4. Turkey Energy Outlook..................................................................................... 8
1.4.1. PV Turkey in Particular Karapinar ESIZ ............................................... 9
1.4.2. NUKE Turkey in Particular Mersin Akkuyu ....................................... 12
2. CASE STUDIES .................................................................................................... 13
2.1. Case Study 1 - 1 MW PV PP in Karapinar ESIZ ............................................ 13
2.1.1. Solar Irradiation Computation for Karapinar Energy Specialised Industrial Energy Zone ....................................................................................... 14
2.1.2. 1 MW PV PP System Design in Karapinar ESIZ ................................ 20
2.1.3. PV F-CHART Computations (Electricity Production Calculation) ..... 25
2.1.4. Total Electricity Production of 1 MW PV PP in Karapinar ESIZ ....... 31
2.1.5. LCA of 1 MW PV PP in Karapinar ESIZ ............................................ 32
2.1.6. The Life Cycle Inventory of PV Technology ...................................... 41
2.1.7. PV LCOE ............................................................................................. 67
2.1.8. PV Commissioning and Decommissioning ......................................... 74
2.1.9. PV Scale Projection from 1 MW to 4800 MW .................................... 76
2.2. Case Study 2 – 4800 MW NUKE PP to be established in Mersin – Akkuyu . 78

xii
2.2.1. NUKE Material Use ............................................................................. 80
2.2.2. LCOE of 4800 MW NUKE PP in Mersin Akkuyu .............................. 82
2.3. Mutual Subjects ............................................................................................... 85
2.3.1. PV vs NUKE: CO2 Emission Reduction Potentials ............................. 85
2.3.2. PV vs. NUKE Energy Payback and Profit Comparison ....................... 93
3. OUTCOMES AND RESULTS ............................................................................ 116
4. CONCLUSION AND DISCUSSIONS ................................................................ 123
REFERENCES ......................................................................................................... 126
APPENDICES .......................................................................................................... 137
A - Turkey Solar Energy Atlas and Location of Karapınar ESIZ ............................ 137
B – Some Pictures from NUKE PP in Mersin Akkuyu ............................................ 138
C – Some Pictures from 500 kW PV PP in Balıkesir ............................................... 139

xiii
LIST OF TABLES
TABLES
Table 1 Regulatory Framework of PV in Turkey ...................................................... 11
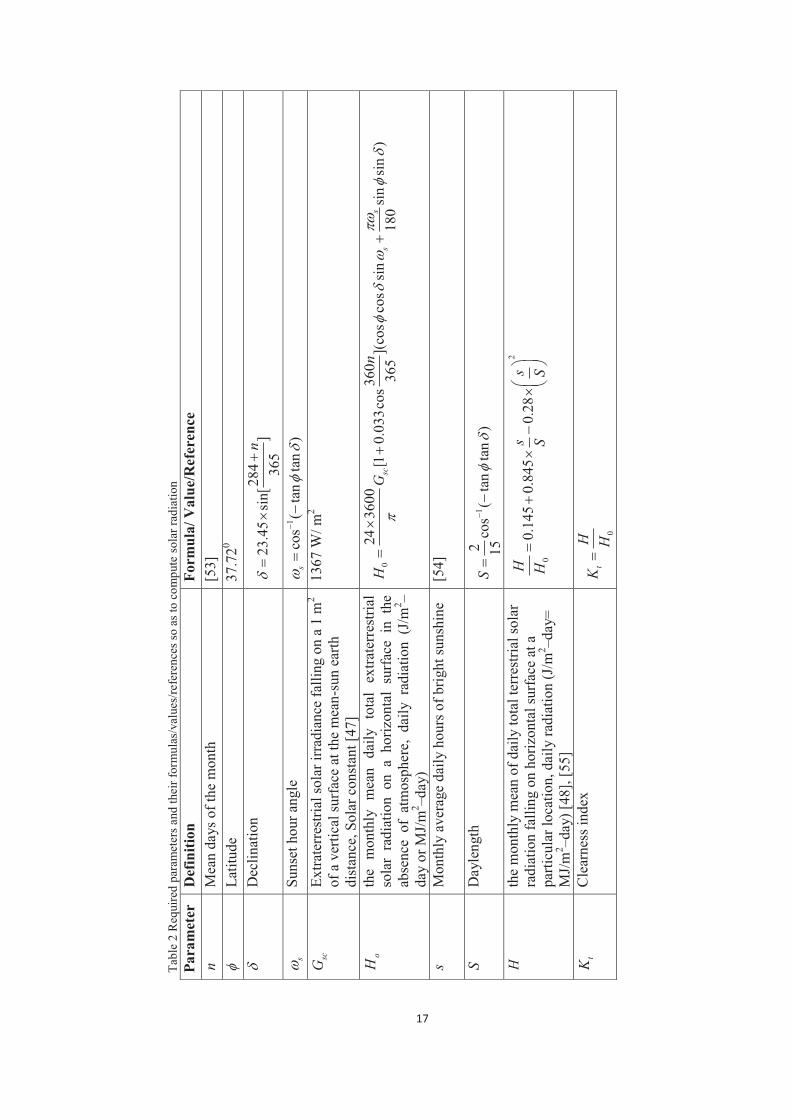
Table 2 Required parameters and their formulas/values/references so as to compute
solar radiation ..................................................................................................... 17
Table 3Excell sheet reckoning solar radiation amount reaching the surface of the
determined field .................................................................................................. 19
Table 4 Features of the selected panel model [58] ..................................................... 20
Table 5 PV array design values .................................................................................. 21
Table 6 Essential dimensions for each line containing PV arrays ............................. 22
Table 7 Array row spacing calculation ...................................................................... 23
Table 8 Excell sheet of the study ............................................................................... 23
Table 9 System features ............................................................................................. 24
Table 10 Monthly solar radiation of a system ............................................................ 26
Table 11 Monthly average temperature of a location [54] ......................................... 26
Table 12 Monthly humidity values [62 - 63] ............................................................. 27
Table 13 Excell sheet projecting total electricity production of 1 MW PV PP ......... 31
Table 14 Recyclable PV materials [87] ..................................................................... 41
Table 15 Preffered data used in this study for the transformation of silica to silicon
(metallurgical grade silicon) process .................................................................. 42
Table 16 Excell sheet revealing the outputs of the transformation of silica to silicon
(metallurgical grade silicon) process .................................................................. 44
Table 17 Preffered data used in this study for the purification of a silicon process by
yielding EG-silicon, off-grade silicon and silicon tetrachloride ......................... 44
Table 18 Excell sheet revealing the outputs of the EG and off-grade silicon
production ........................................................................................................... 46
Table 19 Preffered data used in this study for the purification of a silicon process by
yielding solar grade silicon ................................................................................. 46
Table 20 Excell sheet revealing the outputs of the SoG silicon production .............. 47
Table 21 Preffered data used in this study for the acquisition of silicon production
mix ...................................................................................................................... 48
xiv
Table 22 Excell sheet revealing the outputs of the acquisition of silicon production
mix ...................................................................................................................... 48
Table 23 Preffered data used in this study for material use for CZ-sc-silicon
production ........................................................................................................... 48
Table 24 Excell sheet revealing the outputs of the process of crystal silicon making50
Table 25 Preffered data used in this study for the execution of wafers ..................... 50
Table 26 Excell sheet revealing the outputs of the execution of silicon wafers ........ 52
Table 27 Solar cell production ................................................................................... 52
Table 28 Excell sheet revealing the outputs of the solar cell production process ...... 55
Table 29 Preffered data used in this study for solar panels and laminate formation . 55
Table 30 Excell sheet revealing the outputs of the production of solar panel and
laminate formation process ................................................................................. 57
Table 31 Quantities acquired after computation of LCI ............................................ 58
Table 32 Materials to be used, emissions to be made for 1 MW PV PP .................... 59
Table 33 (Energy use for mounting) Diesel use for the erection of a 1 MWe plant
mounted on open ground .................................................................................... 63
Table 34 Unit process raw data of different mounting systems and correction factor
used in this study ................................................................................................. 63
Table 35 Excell sheet revealing the material uses of mounting systems ................... 64
Table 36 Preffered data for a unit process raw data of "Inverter, 500kW, at plant" .. 65
Table 37 Excell sheet revealing the material uses of inverter production ................. 66
Table 38 Monetary values of the system design ........................................................ 72
Table 39 Excell sheet revealing monetary calculations of 1 MW PV PP in Karapinar
ESIZ .................................................................................................................... 73
Table 40 Features of 4800 MW PV PPs .................................................................... 77
Table 41 Unit values of parameters for LCI key emissions of NUKE PP ................. 81
Table 42 LCI emissions of 4800 MW NUKE PP ...................................................... 81
Table 43 Material use, water consumption, waste generation of LCI of 4800 MW
NUKE PP established in Mersin Akkuyu (just for the construction period) ...... 82
Table 44 Designated total cost and LCOE of NUKE ................................................. 84
Table 45 Share of hydroelectric production in Turkey, 2006 – 2010 [142] ............... 86
Table 46 IPCC emission factors [143] ....................................................................... 87
Table 47 Annual CO2 emissions from electricity production [142]........................... 88
Table 48 Net electricity production from thermal sources [142] ............................... 88

xv
Table 49 OM emission factor for 2008 – 2010 [142] ................................................ 88
Table 50 Default efficiency factors for power plants [141] ....................................... 90
Table 51 Akkuyu Nuclear Power Plant electricity generation amounts .................... 92
Table 52 The amount of CO2 emission reduction enables by the Akkuyu Nuclear
Power Plant ......................................................................................................... 92
Table 53 PV electricity production for the first 10 years ........................................... 94
Table 54 Money earned through feed-in-tariff system for the first ten years ............ 94
Table 55 Money earned through feed-in-tariff system after 10 years ........................ 95
Table 56 Total money earned with day ahead electricity market option ................... 96
Table 57 Revenue from 1 MW PV PP based on the options ..................................... 98
Table 58 Revenue projection to 4800 MW ................................................................ 98
Table 59 Payback table of 1 MW PV PP without land cost....................................... 99
Table 60 Payback table for 1 MW PV PP with land cost ........................................ 100
Table 61 Payback situation of options for 1 MW PV PP ......................................... 101
Table 62 Payback table of 4800 MW PV PP without land cost .............................. 102
Table 63 Payback table for 4800 MW PV PP with land cost .................................. 103
Table 64 Payback times of 4800 MW PV PP for different options ......................... 104
Table 65 Money income via electricity production by NUKE ................................ 105
Table 66 Payback table of 4800 MW NUKE PP without land cost ........................ 108
Table 67 Payback table of 4800 MW NUKE PP with land cost .............................. 112
Table 68 Payback times for NUKE .......................................................................... 115
Table 69 Final comparison table .............................................................................. 116
Table 70 Material use comparison of the options, namely PV and NUKE ............. 118

xvi
LIST OF FIGURES
FIGURES
Figure 1 Comparison of sunshine duration [39] ......................................................... 10
Figure 2 Scheme of a PV array example .................................................................... 21
Figure 3 Layout of a PV line ...................................................................................... 22
Figure 4 Triangle shadow method for the computation of the array row spacing of the
system [59] .......................................................................................................... 22
Figure 5 Layout of 1 MW PV PP to be established in Karapınar ESIZ ..................... 24
Figure 6 PV FChart table revealing monthly radiation, efficiency and electricity
production ........................................................................................................... 30
Figure 7 The lifecycle of a PV system [70] ............................................................... 33
Figure 8 PV Value Chain used for this study [74 - 77] .............................................. 34
Figure 9 Silicon mine and its purification [80] .......................................................... 35
Figure 10 Typical layout production of a silicon metal [81] ...................................... 36
Figure 11 Czochralski equipment [80] ....................................................................... 37
Figure 12 Details of the steps of CZ method [86] ...................................................... 38
Figure 13 Scheme of wafer slicing from ingots [80] ................................................. 38
Figure 14 Scheme of electrically contacted PV module [80] ..................................... 40
Figure 15 Scheme revealing typical ground mounting method ................................. 75
Figure 16 Economy-of-scale benefits: residential and commercial rooftop, ground-
mount utility scale PV [127] ............................................................................... 76

xvii
LIST OF ABBREVIATIONS
AC Alternating Current AOX Adsorbable Organic Halogen APAC Asia Pacific Countries BOD Biochemical Oxygen Demand BM Built Margin BOO Build-Own-Operate BoS Balance of System CDM Clean Development Mechanism CFB Circulating Fluidized Bed CH4 Methane COD Chemical Oxygen Demand CO2 Carbondioxide c-Si Crystalline silicon CZ Czochralski DC Direct Current DG Directorate General DOC Dissolved Organic Carbon EDAM Center for Economics and Foreign Policy Studies EF Emission Factor EG Electronic Grade EIA Environment Impact Assessment EMRA Energy Market Regulatory Authority ESIZ Energy Specialised Industrial Zone ESRI Environmental Services Research Institute FBS Fluidised Seperator GHG Green House Gases GTOE Giga Tones of Oil Equivalent GW Giga watt HA Hectare HCI Hydro chloric acid IEA International Energy Agency IGCC Integrated Gasification Combined Cycle

xviii
kWh Kilo watt hours LCA Life Cycle Assessment LCOE Levelised Cost of Energy LCI Life Cycle Inventory MDG Millennium Development Goals MG Metallurgical Grade MoENR Ministry of Energy and Natural Resources Mtoe Million tones of oil equivalent MW Mega watt N2O Nitrous oxide NMVOC Non Metal Volatile Organic Carbon NOCT Nominal Operating Cell Temperature NPV Net Present Value NUKE Nuclear Energy OM Operating Margin O&M Operation and Maintanance PFBS Pressurised Fluidised Bed Combustion PM Particulate Matter PV Photovoltaic PP Power Plant SEPA Solar Electrical Power Association SoG Solar Grade TOC Total Organic Carbon TWh Tera watt hours TPVTP Turkish PV Technology Platform UNFCCC United Nations Framework Convention on Climate Change VVER Water – Water Power Reactor VAT Value Added Tax
1
CHAPTER 1
INTRODUCTION
1.1. The Main Scenario of the Study
World is facing with environmental destruction threats leaded by an abrupt
climate change phenomenon mainly as a result of the anthropogenic interventions to
the environment [1]. Major reasons for an environmental destruction are over
exploitation of natural resources and undesired emissions as an output of actions. The
fundamental reasons why the anthropocene has above mentioned challenges against
environment are energy consumption [2], population increase, endeavors and greed
for economic growth and unsustainable production and consumption patterns.
The alarms given by the environment revealed that there are limits of growth
and world is about to be a tipping point [1 - 2]. Even if being in charge of climate
change, human is not keen on extermination himself. Consequently, human beings
try to design a new life style rules consisting of economic, environmental and social
aspects. What human being calls for the new life style ambitious to tackle with
environmental threats while meeting needs and aspirations is called as sustainable
development.
Energy sector plays a major role both for being reason of environmental
destruction and having potential to serve as the top sector on tackling global
environmental threats.
Turkey having sharply growing economic and population statistics needs
energy investments to meet extra energy demands even energy efficiency is possible.
In this way, Turkey is in a threshold of having NUKE and PV investments
because of some reasons such as the need to meet future energy demand, diversify
her energy provider technologies, reduce energy dependency on import etc. Both
NUKE and PV are not only unexplored areas for Turkey’s investment climate but
areas also Turkey desires to become mature.
This study compares both economic and environmental feasibilities of NUKE
and PV options for Turkey. For the NUKE part, 4800 MW installed power NUKE

2
PP which is being constructed in Mersin Akkuyu is studied. As for the PV part, 1
MW PV PP is designed to be located in Karapınar ESIZ and then projected to 4800
MW. Former and the latter are compared by using LCA methods for a material use
(environmental) comparison and LCOE method for an economic comparison.
Because NUKE and PV have different capacity factor and working hours, the
comparisons of both LCA and LCOE are carried out per kWh. In other words,
having same installed power, NUKE and PV generates different amounts of
electricity. Then, the comparisons are carried out for a unit production of one kWh of
energy.
For the first case studied under the main scenario, a PV PP having 1 MW
installed power is considered in the Karapınar ESIZ. Firstly, LCA of a PV system
installed in ESIZ is calculated and also its LCI is determined. Moreover, solar
irradiation calculations are carried out for the pre-determined location where the PV
PP would be installed. Owing to the features of the selected technology of PV arrays,
PV system is designed by determining the appropriate PV technology, PV Panels,
BoS components; required amounts of system components, area to establish the
system; CO2 reduction and electricity production potentials of a lifetime. For the
computation of the electricity production of the system, the PV F Chart software is
applied. Furthermore, owing to the method of LCOE, cost of the determined system
is evaluated.
For the second case, NUKE PP having 4800 MW installed power planned to
be established in Mersin Akkuyu by the Government is examined literally so as to
have information concerning the LCOE, LCA, technological necessities and
environmental effects of it.
So as to compare these two cases, the outputs of the first case is projected to
same installed power / electricity production amount planned for the second case.
Finally, the cases are compared in terms of both economic feasibility and
environmental aspects.

3
1.2. Global Trends and Threats
(Relation Among Climate Change and Other Threats; Limits to Growth and
Sustainable Development)
Maintaining its cycle without exceeding the assimilation capacity due to its
nature, world entered the anthropocene as of the beginning of the industrial
revolution. World has faced with 9 major environmental degredation threats1 leaded
by the global climate change as a result of the anthropogenic interventions. Among
these environmental degredations, the followings seem the most important ones:
biodiversity loss highly exceeded the limit, nitrogen cycle has exceeded the tolerance
point and climate change has been sharply reaching the tipping point which has no
return [3].
World history was faced with 5 ecological extinction period which are
ordovocian, devonian, permian, triassic, cratecous. By resulting in environmental
threats leaded by abrupt climate change, Antropocene is foreseen as sixth extinction
period [4].
Major reasons for an environmental degradation are over exploitation of
natural resources and undesired emissions of pollutants as an output of development.
The fundamental reasons why anthropocene has above mentioned challenges against
environment are population increase, endeavors and greed for economic growth and
unsustainable production and consumption patterns.
Letting itself in for the environmental threats lead by climate change within
so-called anthropocene, civilisation is in economic transformation with the intent of
not only mitigating their effects but also adapting to them.
While global population was 1.2 billion in 1850, the time accepted as a
starting point the negative effects of the industrial revolution started to be suffered, it
exceeded 7 billion threshold as of 21st century. Meanwhile, the energy demand of 1.2
billion population was 0.5 GTOE/year; it reached 10 GTOE/year with 7 billion
populations currently [5]. When the change is scrutinized, for the last 150 years
energy demand increased 20 fold while a 7 fold increase in the population was
recorded. According to Malthus, while population has increased geometrically, world
1 Chemical pollution, climate change, ocean acidification, stratospheric ozone depletion, biochemical flow boundary (nitrogen cycle, phosporus cycle), global freshwater use, land system change, biodiversity loss, atmospheric aerosol loading

4
resources have increased arithmetically [6]. Additively, world population is
estimated to reach 10 billion by the end of this century [7].
Scrutinizing specific to abrupt climate change threat, already: world average
temperature increased 0.74 C in the last 100 years; Arctic glaciers has shrinked 2.7
% for every decades as of 1978; at least 420 physical processes, biological species
and community suffered a change; sea level raised 10-20 cm in the last century;
excessive circumstances became more often; algae, plankton and fish seasons has
been altered and precipitation regimes were remarkably changed [8].
The growth, magical word of the anthropocene, has expanded the volume of
the economy by serving more people and resulting in more money handover. Being
non-stable by having solely the growth, shrink and crisis faced in the current market
economy’s most important sources are energy and natural resources [2].
Looking from the energy aspect; actual energy production depended on
hydrocarbon sources that have three major actors: oil, natural gas and coal. However,
this situation has been compelled to change because of losing their feasibilities
across other options, in particular renewable alternatives, with conjectural conditions.
Even oil is becoming out of fashion and renewable energy compensates it,
shale oil/gas’s becoming popular paves the way for the realization of “golden age of
natural gas” as claimed by IEA [9].
In addition to energy resources, almost all other natural resources have
similar situation. Main industrial sectors such as high technology electronic industry
are depended on metal and nonmetals which are rare and some already about to be
extinct. Metals have a vital role on indispensible sectors for the economy such as
energy, manufacturing process equipments, transport vehicles manufacturing,
agricultural truck manufacturing, road infrastructure manufacturing, pipelines
establishment. Referencing to London Metal Stock Exchange except fluctuations in
the crisis periods metals like zinc, copper, nickel, lead etc. have made considerable
increase.
Another resource offered by the nature that has to be considered is water,
which is a source launched to evoke its stress on various territories. MDG on water
cannot also be achieved by having currently 2.5 billion having lack to access
sanitation opportunities and 1.1 billion lack of accession to fresh water [10].
Increase in the production accelerated by an industrial revolution, the
endeavors for the development by the countries like Germany, Japan, China etc.

5
especially after 2nd World War and consumption frenzy of the society brought about
huge pressure on environment and natural resources. However, even these negative
effects were experienced by human being and having some big phenomenon like
London Episode, civilization ignored the destruction of environment and natural
resources. When the threat reached the tipping point, civilization launched the
intervention process.
Sustainable development term which is started to be mentioned in the
Stockholm in 1992 [11]; was initially defined in 1980 [12] had widespread
definition2 in 1987 with Brundtland Report [13] was presented as a solution pathway
in front of human being as of 1992 Rio [14]. This term was strengthened with 2002
Johannesburg [15] and 2012 Rio+20 meetings [16].
Sustainable development term should provide a conversion from brown
economy definition method of today’s economy into energy and resource efficient
green economy, without exceeding the assimilation capacity of the world. The
fundamental needs of the human kind should be accordingly defined, clearly and
properly, which might lead to a better rephrasing of the definition of sustainability
[17].
Energy is at the hub of both the reasons that resulted in the aforementioned
troubles and ironically, the ways to get rid of the negative effects of this global
dilemma. “The Future We Want” document the output of Rio+20 addresses energy
issues many times such as establishing sustainable energy for all initiative, defining
sustainable energy needs etc. Moreover, energy has the major responsiblility across
GHGs production leaded by CO2 which is the fundamental reason of climate change
phenomenon by being responsible of two-thirds of the global GHGs [18 - 19].
1.3. Global Energy Outlook
Global energy issue subsuming many crucial variables like energy diplomacy,
economy, engineering, technology etc. creates a huge stress on natural resources and
effect on competitiveness of the countries, companies etc and contributes to
environmental pollution.
2 Development that meets the needs of the present without compromising the ability of future generations to meet their own needs.

6
While global cumulative GHG emission reached 31.60 billion tones of CO2
with 1.2% increase in 2012, energy related CO2 emission has increased its pie more,
to about 400 million tones per year [19].
World had 12,789.25 Mtoe annual energy production [20] 508.87 quadtrillion
Btu primary energy consumption [21] and 20,238.14 billion kWh electricity
consumption [22] in 2010.
Oil had the biggest share in energy consumption pie with 4,069.38 Mtoe, coal
is runner up with 3,596.04 Mtoe and natural gas, biofuels and waste, nuclear and
hydro are following, respectively [20].
Taking into account the electricity consumption, 13,473.28 billion kWh of
that is provided from fossils, remaining part is from renewable and nuclear with
4,167.20 and 2,620.28 shares respectively in 2010 [22].
In country basis, the USA was the biggest electricity consumer of the world
by having 4,125.06 billion kWh followed by China having 3,904.12 global share
[21].
In specific to NUKE and PV, the former is a mature energy technology and
the latter is an emerging technology.
Pointing out devastating information at this point, PV PPs use the energy
reaching the Earth from the sun which produce its energy based on nuclear reactions
and interestingly, it is in principle, also used in NUKE PP’s.
1.3.1. PV Outlook
The global cumulative PV capacity exceeded 100 GW installed power
capacity by reaching 102 GW as of the end of 2012. This amount being capable of
producing at least 110 TWh of electricity every year is achieved with 31.1 GW
additional capacities in 2012 [23].
Moreover, PV in 2012 became the most prioritized electricity source in the
EU in terms of an added installed capacity. PV with 16.7 GW connected to the grid
outsored gas and wind while nuclear capacity of Europe has decreased by an amount
1.25 GW [23].
Europe is leading with the predominant share of World PV market with 70
GW installed capacity. Next in the ranking are China with 8.3 GW, the USA with 7.8
GW and Japan with 6.9 GW. As a country basis in Europe, Germany leads the

7
market with 32.41 GW installed power followed by Italy with 16.36 GW and Spain
5.17 GW [23].
In terms of types of PV Cells, the dominant PV technology having two main
categories namely monocrystalline and polycrystalline, crystalline silicon (c-Si)
modules represent 85-90% of the global annual market today [24]. It is also foreseen
to maintain its dominant position in the near future [23]. In addition, monocrystalline
cells have comparetively the highest efficiency but, greater energy payback period
[24].
Adressing PV industry, the situation differs depending on value chain of PV
manufacturing. Comparing 2012 data, China generally leads manufacturing steps of
PV. 35% capacity and 27% production of polysilicon, 78% of capacity and 80% of
production of wafers, 71% of capacity and 66% of production of c-Si cells, and 73%
of capacity and 69% of production of c-Si modules are produced in China [23].
APAC, second major actor, has 20% capacity and 19% production of polysilicon,
13% capacity and 12% production of wafers, 22% capacity and 27% production of c-
Si cells, 11% of capacity and 13% of production of c-Si modules. However, Europe,
dominant end-use actor for solar electricity production, has only 17% capacity and
20% production of polysilicon, 8% capacity and 7% production of wafers, 5%
capacity and 5% production of c-Si cells and 13% capacity and 14% production of c-
Si modules [23].
On company basis, according to 2010 data, China dominates the industry of
PV. Other PV manufacturing countries are Taiwan, Japan, USA, Norway and
Germany. The fundamental solar companies from these countries are Suntech
Power/China (sharing 7% pie from total), Ja Solar/China (6%), First Solar/USA
(6%), Yingli Green Energy/China (5%), Trina Solar/China (5%), Q-Cells/Germany
(4%), Kyocera/Japan (3%), Motech/Taiwan (3%), Sharp/Japan (3%),
Gintech/Taiwan (3%), REC/Norway (2%), Sunpower/USA (2%), Canadian
Solar/China (2%), Neo Solar/China (2%) and Hanwha-SolarOne/China (2%) [25].
1.3.2 NUKE Outlook
Nuclear energy presents about % 13 of global electricity [26 - 27] and 5.5%
primary energy demand and little more than 2% of global energy consumption [26].
8
Nuclear energy generated 2,620.217 billion kWh globally in 2010, 2,507.22 in 2011
and 2,343.53 in 2012 [22]. This revels that the nuclear share in commercial primary
energy consumption dropped to 4.5%, “the lowest since 1984” [28].
By July 2013, 427 nuclear reactors in 31 countries are under operation [29].
Besides, there are about 68 plants under construction around the world in 12
countries, principally China, India, Korea, and Russia [29]. The global installed
capacity of nuclear power plants is 364 GW [29]. Owing to that amount, nuclear
electricity corresponded 2.35 TWh3 in 2012 [29].
The number of countries having more than 20% nuclear share in their
electricity production is 15. In terms of the quantity of nuclear reactors the USA
comes in first (with 104 reactor), however, in terms of the share of nuclear in the
total electricity production France comes in first (78%) [28]. France has 79 reactors,
Japan has 55 and Russia has 33 reactors compensating only its 18% electricity
production.
Having non-homogenous deployment, NUKE is intensed in some countries.
Such that, more than 90% of NUKE PPs are in 22 countries and approximately half
of them are in the USA, France and Japan.
1.4. Turkey Energy Outlook
Turkey classified as upper middle income developing country by the
WorldBank, has sharply increasing energy consumption amount in compliance with
population and welfare increase and economic growth endeavors.
While having currently 105.13 Mtoe energy consumption and 180.21 TWh
electricity consumption [20], Turkey is estimated to be consuming the amount
between 259-500 TWh in 2020 [30 - 32].
The share of current electricity and energy consumption by source in Turkey
accomplished as the following: 31.9% natural gas, 31.3% coal, 26.7% oil, 3.7%
hydro, 2.7% non hydro renewables like wind, solar, geothermal for primary energy
consumption [25] and 44.7% natural gas, 27.22% coal (lignite, imported coal,
domestic coal), 1.99% liquid fuel, 24.19% hydro, 2.14% wind for electricity
generation in 2012 [25]. On the basis of installed power as of end of 2012, natural
3 Terawatt-hours = billion kWh

9
gas has 32.10%, hydro 34.38%, 21.73% coal, 7.04% oil, 3.96% wind, 0.28%
geothermal and others [25].
However, future projections and policies reveal that the mentioned picture
can be modified. Turkey has 36,000 MW hydro, 20,000 MW wind, 3,000 MW solar,
600 MW geothermal, 2,000 MW biomass targets for 2023 [33].
Specifically to NUKE and PV, Turkey is in a threshold of having NUKE and
PV investments because of some reasons such as the need to meet future energy
demand, diversify her energy provider technologies, reduce energy dependency on
import etc. Both NUKE and PV are not only virgin areas for Turkey’s field of
investments but areas also Turkey needs to be grown up.
1.4.1. PV Turkey in Particular Karapinar ESIZ
Turkey, owing to her geographical position, has long sunshine duration and
so receiving high solar irradiation as being in the solar belt. According to the DG for
Renewable Energy of the Ministry of Energy and Natural Resources, Turkey’s total
annual sunshine duration is 2,640 hours and average total radiation is 1,311 kWh/m2
[34]. The regions having longest sunshine duration and highest solar irradiation are
Southeast and Mediterrenean parts of Turkey having 2,993 and 2,956 hours average
sunshine durations and 1,460 kWh/m2 and 1,390 kWh/m2 average total irradiation,
respectively.
What DG for Renewable Energy did is not a sole study for PV potantial of
Turkey. For instance, TSMS model for Turkey’s solar energy potential using
sunshine duration and radiation data measured by 157 weather stations of TSMS as
of 1971 till 2000 revealed that Turkey’s average annual total sunshine duration is
2,573 h (7 h/day) and average annual total irradiation is 1,474 kWh/m2-year (4
kWh/m2- day) [35].
Moreover, SEPA, developed by using ESRI Solar Radiation Model
combining solar irradiation, topography and seasonal data of the location revealed
that Turkey has average annual total sunshine duration of 2,738 h (7.5 h/day) and
average annual solar irradiation of 1,527 kWh/m2- year (4.2 kWh/m2-day) [36]. In
other words, Turkey has a technical solar power generation capacity of 380
TWh/year [37 - 38].

10
Though having more solar irradiation than the European leading solar Energy
investor countries like Germany, Spain, Czech Republic as seen in Figure 1, Turkey
still falls behind these countries because of her regulations related to investment
amount are newly done [39].
Figure 1 Comparison of sunshine duration [39]
While Turkey has still no considerable PV power plant being operated,
EMRA decision taken in 24 May 2012 paved the way for the investments on PV.
Pursuant to aforementioned decision, EMRA announced the license distribution for
the installment of PV power plant having totally 600 MW installed capacity country
wide [40]. The investors having realized their 6-month solar measurement
precondition made their license application in 10-14 June 2013.
While the most 600 MW applications were licenced after June 2013, the PV
volume in Turkey is foreseen to reach 3,000 MW in 2023 [41].
Furthermore, Turkey’s installed PV capacity is projected to reach 20 GWp by
2020 according to the EPIA [42]. In addition, TPVTP has a target of 6 GWp with a
moderate scenario and 10 GWp with a policy driven scenario by 2020 [43].
The general arrangements of solar energy plants are regulated by Renewable
Energy Law and secondary legislation determines the methods and procedures. The
regulatory framework of PV in Turkey is listed in Table 1.

11
Table 1 Regulatory Framework of PV in Turkey Law Law on Utilization of Renewable Energy Sources for the
Purpose of Generating Electrical Energy, No 5346
Electricity Market Law, No 4628
Secondary
Legislation
Regulation on Electricity Power Plants based on Solar Energy
(19/06/2011-27969)
Regulation on Competition concerning Applications for the
Establishment of Solar Power Plants (29/05/2012-28307)
Paper on measurement standard concerning applications based
on wind and solar energy (22/02/2012-28212)
Paper on wind and solar measurement implentations to be
done for applications pertaining to wind and solar energy
(10/07/2012-28349)
Regulation on the certification and promotion of renewable
energy sources (21/07/2011-28001)
Regulation on domestic production of assemblies used in
renewable energy power plants (19/06/2012-27969)
Unlicenced Production Regulation (21/07/2011-28001)
Licencing Regulation (04/08/2002-24836)
EMRA Council
Decisions and
MoENR
Announcements
Announcement on grid connection capacities
Announcement on acceptance date of an application
Under the light shed by aforementioned regulatory framework concerning
PV, Turkey investment climate for PV presents some advantages for investors.
Owing to the Law No. 5346, namely Renewable Energy Law, PV PPs have
an opportunity to get benefit from 13.3 $ cents/kWh feed-in-tariff incentive for 10
years providing to be established before 31/12/2015. Moreover this amount can be
extended for 5 years up to 20 $ cents/kWh by subsiding domestic productions.
Listing the subsidies for domestic productions: PV panel integration and
manufacture of solar structucal mechanics (0.8 $ cent/kWh), PV modules (1.3 $

12
cent/kWh), PV cells (3.5 $ cent/kWh), invertor (0.6 $ cent/kWh), PV solar
concentrator (0.5 $ cent/kWh).
1.4.1.1. Karapınar Energy Specialised Industrial Zone
16/07/2012 dated and 2012/3574 numbered decision of the Ministerial
Cabinet establishing Karapınar Energy Specialised Industrial Zone entered into force
after having been published in 08/09/2012 dated and 28405 numbered Official
Journal.
This zone is brought about two parts. The zone constitutes totally about 6,159
ha area. In other words, property having exactly 61,585,762 m2 total area is
determined [44]. Owing to the features of industrial zones, the infrastructure
including cable connection till transformers will be provided by the government,
namely the Ministry of Science, Industry and Technology, and loaned to the
investers.
1.4.2. NUKE Turkey in Particular Mersin Akkuyu
Looking specific to Turkey, first reactor for research purpose was established
in Istanbul in 1962, second one in 1979 and the third one in 1981. All of these
reactors are small scale reactors and not in operation [26].
Turkey has no operating large scale NUKE PP; however, there are 3 PPs
planned to be established. Some steps taken for the two of these planned PPs. The
first one is programmed to be established in Mersin province located in the southern
Anatolia at the coast of Mediterrenean. Second one is planned to be established in
Sinop northern part of the Anatolia and near Blacksea.
The one to be established in Mersin is the closest one to the end. The
intergovernmental agreement to establish NUKE PP having 4800 MW installed
power was signed between Republic of Turkey as a host country and Russian
Federation as a contractor in 2010. Currently, this project is in an EIA process. After
having completed licensing and EIA approval periods, the construction step which
takes about 7 years to start. Bearing in mind that nuclear power constitutes 4 reactors
each having 1200 MW installed power, the electricity production through this PP
will start in 2020 and the last reactor will be put into use in 2023. Moreover, the
operating method of this PP is based on BOO [45].

13
CHAPTER 2
CASE STUDIES
2.1. Case Study 1 - 1 MW PV PP in Karapinar ESIZ
In this part of the study, 1-MW PV ground mounted and on grid PP in
Karapinar ESIZ is planned. The approximate coordinates of the determined area for
the establishment of PV PP are 37⁰ 43’ 45’’ north and 33⁰ 33’ 01’’ east.
The scenario determining PV PP having 1 MW installed power will be
constituted from PV Panels and BoS components pursuant to the necessities to
establish ground-mounted PV system.
PV panel type is selected as monocrystalline a sub technology of crystalline
technology which dominates the PV market. It has the highest efficiency compared
to equivalent technologies and has the highest possibility to be used by investers who
will make an investment in the aforementioned zone. The model of the PV panels is
preffered as YINGLI YL280C/30b Solar Panel having one of the highest efficiency
among other panels in the market. Moreover, the brand producing mentioned panel,
Yingli, is one of the biggest actors of PV industry [46].
The technologies of BoS components were also prefferred based on the same
criteria.
The selections made in the course of the present study consisting of above
mentioned preferences which is believed to seem reasonable and in addition, reflect
the facts of the present market.
In the scenario of this case study; initially the solar radiation falling on the
module having yearly optimal tilt angle of the determined area is designated, then the
necessary parameters essential for the design of PV system having 1 MW installed
power is considered. The parameters identified at this step are the number of PV
panels required and BoS components like inverter, dimensions and necessary area,
required mounting devices, ordering arrays and lines. The calculations are carried
out, starting from fundamental principles, to determine some realistic quantities
about the numbers to weight against. As the third step, to check and settle the

14
outcomes properly, computations about the PV electricity production of the system,
PV F Chart software program is utilized. The LCA of the designed system from
mining to operation step is applied and LCI is computed out. From this step on, the
designed system gets ready to be commissioned. The panels and inverters are ordered
from the real suppliers. Then, the system is commissioned by seasonal workers, since
commission of PV system does not demand highly specialized skilled work force if
the modules are readily imported. Decommission is also realized by seasonal
workers in a similar way.
In accordance with industrial zone features, the infrastructure of a field where
the system is established is prepared by the Ministry of Science, Industry and
Technology. The field is also loaned from the Government with an announced price
by the Ministry of Finance.
Adding all the factors that were resulting in the investing of the capital are
taken into account and the cost of the system is identified.
2.1.1. Solar Irradiation Computation for Karapinar Energy Specialised
Industrial Energy Zone
Solar irradiation reaching the Earth will be the source of the input which will
be converted into electricity, via PV panels for this study. Consequently, the primary
need is to compute the solar irradiation available for PV system that is planned to be
installed, in the region of interest to produce electricity.
The necessary data and conditional information for this computation starts
with the short-wave radiation leaving sun and its value on the top of the atmosphere,
firstly on a horizontal surface and secondly on the tilted PV module installed on the
surface of the Earth. To carry out this computation, we first started with very
fundamental measured value of the solar irradiation at the mean sun-earth distance.
Secondly, we calculated the daily horizontal solar irradiation of the average day of
the month for the location, at the zenith, directly outside of the atmosphere. Then
monthly average of daily solar irradiation is transmitted by the atmosphere, that falls
on the tilted PV panels at the location of interest was computed using a universal
formula [47 - 48]. Solar irradiation reaching the PV modules is then converted into
the electricity by photoelectric conversion process.
Mean Sun-Earth distance is 1.5×10¹¹ meters and it varies by a small amount
day by day, due to the elliptical orbit of the Earth around sun [49]. Solar constant is

15
defined as the solar irradiation (W/m2) reaching outside the atmosphere, on a unit
area perpendicular to sun rays at the mean Sun Earth distance. Its value is determined
using the regular and long-term measurements carried out by satellites. The recent
decleared value is 1,367 Watts per m2 [50 – 51].
Moreover, not the whole solar irradiation coming outside the atmosphere
reaches to the Earth’s surface, mainly because of natural and anthropogenic
obstacles. Due to atmospheric reflection and absorption, reflection and absorption by
the clouds, aerosols and other atmospheric constituents, scattering by particles,
reflection from ground, about %50 of the solar irradiation coming outside of the
atmosphere is transmitted and reaches to the Earth’s surface, on the average [52].
Short wave irradiation of the sun reaches the Earth not only directly but also
in an indirect way. That is, total (global) solar irradiation is classified under two
components as the beam irradiation that reaches the surface without scattering, and
diffuse irradiation which is the part of solar irradiation coming with scattering (by
aerosols, dusts, molecules etc.). An advantage of PV technology is being able to
work with both beam and diffuse irradiation.
2.1.1.1. How to Compute Solar Irradiation?
Computation steps are listed below derived from [47 - 48] and the set of
formulas are debicted in Table 2.
1. Latitude of the place (ф) is determined. The latitude of this study is: 37043’45”.
This is equal to 37.720.
2. Mean days of the months (n) are considered to calculate the monthly mean values
of daily solar irradiation. These days for the 12 months starting from January are
n values and given as 17, 47, 75, 105, 135, 162, 198, 228, 258, 288, 318, 344
respectively throughout a year [47].
3. Declination (δ) is computed from the related formula by using the above given‘n’
values.
4. Sunset hour angle (ωs) is computed by using tangent of latitude and declination.
5. Monthly average daily value of the extraterrestrial irradiation incident on a
horizontal surface (H0) is calculated by reckoning the formula depending on Gsc,
n, Φ, δ, ωs.

16
6. Monthly average daily hours of bright sunshine, s are obtained from State
Meteorological Office of Turkey and, monthly average of maximum possible
daily hours of bright sunshine (daylength), S are computed [47].
7. Monthly average daily radiation on a horizontal surface (H) is then computed
using s/S and the related formula revealed in the table [48].
8. Monthly average daily clearness index (Kt) is computed by determining the ratio
between ‘H’ and ‘H0’.
9. Pursuant to ‘ωs’ and ‘Kt’ values, both the ratio and the amount of the beam and
diffuse components of the solar radiation are determined [47].
10. The ratio of beam radiation, Rb, and ωsı are calculated.
11. Monthly average daily solar irradiation on a tilted south-facing surface (Ht) is
computed.
12. Finally, optimum tilt angle ‘β’ is specified with trials up to reach the maximum
value for cumulative annual solar irradiation.
17
Tabl
e 2
Req
uire
d pa
ram
eter
s and
thei
r for
mul
as/v
alue
s/re
fere
nces
so a
s to
com
pute
sola
r rad
iatio
n Pa
ram
eter
D
efin
ition
Fo
rmul
a/ V
alue
/Ref
eren
ce
n
Mea
n da
ys o
f the
mon
th
[53]
�
La
titud
e 37
.720
�
Dec
linat
ion
284
23.4
5si
n[]
365
n�
��
�
s�
Su
nset
hou
r ang
le
1co
s(
tan
tan
)s
��
��
��
sc
G
Extra
terr
estri
al so
lar i
rrad
ianc
e fa
lling
on
a 1
m2
of a
ver
tical
surf
ace
at th
e m
ean-
sun
earth
di
stan
ce, S
olar
con
stan
t [47
]
1367
W/ m
2
oH
th
e m
onth
ly m
ean
daily
tot
al e
xtra
terr
estri
al
sola
r ra
diat
ion
on a
hor
izon
tal
surf
ace
in t
he
abse
nce
of a
tmos
pher
e, d
aily
rad
iatio
n (J
/m2 –
day
or M
J/m
2 –day
)
024
3600
360
[10.
033c
os](
cos
cos
sin
sin
sin
)36
518
0ssc
sn
HG
��
��
��
��
��
s M
onth
ly a
vera
ge d
aily
hou
rs o
f brig
ht su
nshi
ne
[54]
S
Day
leng
th
12
cos
(ta
nta
n)
15S
��
��
�
H
the
mon
thly
mea
n of
dai
ly to
tal t
erre
stria
l sol
ar
radi
atio
n fa
lling
on
horiz
onta
l sur
face
at a
pa
rticu
lar l
ocat
ion,
dai
ly ra
diat
ion
(J/m
2 –day
= M
J/m
2 –day
) [48
], [5
5]
2
0
0.14
50.
845
0.28
Hs
sH
SS
�
��
��
��
�
�
tK
C
lear
ness
inde
x
0t
HK
H�

18
Tabl
e 2
(con
tinue
d)
Para
met
er
Def
initi
on
Form
ula/
Val
ue/R
efer
ence
d
H H
The
ratio
of
beam
and
diff
use
com
pone
nts
of d
aily
rad
iatio
n [5
6]
db
HH
H�
�
81.4
sFo
r��
2
34
1.0
0.27
272.
4495
11.9
514
9.38
790.
715
0.14
30.
715
tt
tt
td
tKK
KK
for
KH H
for
K�
��
��
��
��
��
��
��
��
23
81.4
1.0
0.28
322.
5557
0.84
480.
722
0.17
50.
722
s
tt
tt
d
t
For
KK
Kfo
rK
H Hfo
rK
�� �
��
��
��
���
��
��
��
�
�
O
ptim
um ti
lt an
gle
Opt
imum
tilt
angl
e is
det
erm
ined
by
exam
inin
g th
e re
late
d va
lues
in o
rder
to
find
max
imum
sol
ar ra
diat
ion
at a
poi
nt. T
he m
ost a
ppro
pria
te ti
lt an
gle
for t
his a
im is
27.
80 . ' s
�
Suns
et h
our
angl
e on
a t
ilted
su
rfac
e fo
r th
e m
ean
day
of th
e m
onth
1'
1
cos
(ta
nta
n)
min
cos
(ta
n()t
an)
s
��
��
��
� �
��
��
��
��
��
��
��
bR
The
ratio
bet
wee
n th
e di
rect
so
lar r
adia
tion
rece
ived
by
a ho
rizon
tal s
urfa
ce a
nd th
e di
rect
so
lar r
adia
tion
over
an
incl
ined
su
rfac
e
''
cos(
)co
ssi
nsi
n()
sin
180
cos
cos
sin
sin
sin
180
ss
b
ss
R
�
��
��
��
�
�
��
��
�
��
��
��
��
��
��
��
�
tH
M
onth
ly
aver
age
daily
so
lar
radi
atio
n on
slo
ped
surf
ace
[57]
an
d ex
tend
ed b
y [5
3]
1co
s1
cos
22
tb
bd
HH
RH
g�
��
��
�
�
��
��
�
�
��
�

19
A
bidi
ng b
y th
e m
entio
ned
step
s, m
onth
ly m
ean
daily
sol
ar ra
diat
ion
on s
lope
d su
rfac
e w
hich
cor
resp
onds
to ti
lted
pane
l is
acqu
ired.
By
sum
min
g al
l the
val
ues,
it is
bro
ught
abo
ut th
at th
e de
term
ined
are
a fo
r thi
s stu
dy h
as a
nnua
l 1,6
88.2
5 kW
h/m
2 sola
r rad
iatio
n. T
he d
etai
ls o
f thi
s
calc
ulat
ion
are
seen
in th
e fo
llow
ing
Tabl
e 3.
Tabl
e 3E
xcel
l she
et re
ckon
ing
sola
r rad
iatio
n am
ount
reac
hing
the
surf
ace
of th
e de
term
ined
fiel
d So
lar Ir
radia
nce f
or th
e det
ermi
ned p
lace i
n Kar
apına
r Ene
rgy S
pecia
lised
Indu
strial
Zon
e1 r
adian
=pi/1
80*d
egree
s
n Φ
δta
n Φta
n δCo
sδSi
nδCo
sΦSi
nΦco
s ωs
ωssin
ωs
360n
/365
Cos 3
60n/3
65(2
4*36
00)/p
iGs
c1+
0,033
..piω
s/180
Ho(J
/m2)
Ho(M
J/m2)
1737
,72-2
0,90,7
7344
6-0
,3818
60,9
3420
447
-0,35
6738
0,791
010,6
118
0,295
3501
472
,8214
655
0,955
3890
816
,7671
20,9
5748
5188
2750
1,974
1713
671,0
3159
71,2
7097
4316
6226
1516
,6226
4737
,72-1
30,7
7344
6-0
,2308
70,9
7437
006
-0,22
4951
10,7
9101
0,611
80,1
7856
398
79,71
3873
20,9
8392
8303
46,35
616
0,690
1733
8827
501,9
7417
1367
1,022
776
1,391
2695
2179
7165
21,79
7275
37,72
-2,4
0,773
446
-0,04
191
0,999
1228
3-0
,0418
757
0,791
010,6
118
0,032
4169
788
,1423
188
0,999
4744
3273
,9726
0,276
0969
7327
501,9
7417
1367
1,009
111
1,538
3737
2847
1823
28,47
1810
537
,729,4
0,773
446
0,165
549
0,986
5721
60,1
6332
596
0,791
010,6
118
-0,12
8043
197
,3565
242
0,991
7686
0710
3,561
6-0
,2344
9139
2750
1,974
1713
670,9
9226
21,6
9919
1935
2060
5235
,2061
135
37,72
18,8
0,773
446
0,340
428
0,946
6492
60,3
2226
570,7
9101
0,611
8-0
,2633
023
105,2
6610
20,9
6471
3364
133,1
507
-0,68
3919
422
2750
1,974
1713
670,9
7743
11,8
3724
0139
8562
8639
,8563
162
37,72
23,1
0,773
446
0,426
536
0,919
8215
0,392
3371
20,7
9101
0,611
8-0
,3299
025
109,2
6285
70,9
4401
5014
159,7
808
-0,93
8377
392
2750
1,974
1713
670,9
6903
41,9
0699
6641
6987
9941
,6988
198
37,72
21,2
0,773
446
0,387
874
0,932
3238
0,361
6245
70,7
9101
0,611
8-0
,2999
998
107,4
5758
90,9
5393
9276
195,2
877
-0,96
4614
176
2750
1,974
1713
670,9
6816
81,8
7548
8740
7097
6840
,7098
228
37,72
13,5
0,773
446
0,240
079
0,972
3699
20,2
3344
536
0,791
010,6
118
-0,18
5687
910
0,701
238
0,982
6087
8422
4,876
7-0
,7086
2667
827
501,9
7417
1367
0,976
615
1,757
5682
3696
5654
36,96
5725
837
,722,2
0,773
446
0,038
416
0,999
2629
20,0
3838
781
0,791
010,6
118
-0,02
9712
891
,7026
676
0,999
5584
7825
4,465
8-0
,2678
1430
527
501,9
7417
1367
0,991
162
1,600
5135
3084
1315
30,84
1328
837
,72-9
,60,7
7344
6-0
,1691
40,9
8599
604
-0,16
6768
70,7
9101
0,611
80,1
3081
853
82,48
3105
70,9
9140
6331
284,0
548
0,242
8497
2227
501,9
7417
1367
1,008
014
1,439
6018
2373
6397
23,73
6431
837
,72-1
8,90,7
7344
6-0
,3423
80,9
4608
536
-0,32
3917
40,7
9101
0,611
80,2
6480
9674
,6443
602
0,964
3007
1731
3,643
80,6
9017
3388
2750
1,974
1713
671,0
2277
61,3
0278
9917
8210
3017
,821
344
37,72
-23
0,773
446
-0,42
447
0,920
5048
5-0
,3907
311
0,791
010,6
118
0,328
3081
670
,8338
80,9
4457
067
339,2
877
0,935
3679
4927
501,9
7417
1367
1,030
867
1,236
2844
1520
1302
15,20
13
sS
H(M
J/m2)
KtHd
/HHd
(MJ/m
2)Hb
(MJ/m
2)β
cos β
sin
β ta
n Φ ta
nδar
ccos
(tan Φ
tanδ
)Φ
-βta
n (Φ
-β) t
anδ
arcc
os(ta
n (Φ
-β) t
anδ)
wspr
ime
sinws
prco
s(Φ-β
)sın
(Φ-β
)Rb
Ht (M
J/m2)
Ht (k
Wh/m
3,29,7
0953
6,533
9534
0,393
076
0,769
542
5,028
1483
41,5
0580
508
27,8
0,884
580,4
6638
664
-0,29
5350
110
7,178
5345
9,92
0,174
8876
5979
,9278
7936
79,92
788
0,984
588
0,985
0493
0,172
273
1,913
947,6
1999
568
2,116
665
4,310
,6285
9,613
2769
0,441
033
0,686
116,5
9576
853
3,017
5083
427
,80,8
8458
0,466
3866
4-0
,1785
6410
0,286
1268
9,92
0,174
8876
5979
,9278
7936
79,92
788
0,984
588
0,985
0493
0,172
273
1,571
6910
,9577
081
3,043
808
6,611
,7523
15,12
529
0,531
237
0,502
326
7,597
8215
27,5
2746
875
27,8
0,884
580,4
6638
664
-0,03
2417
91,85
7681
249,9
20,1
7488
7659
79,92
7879
3679
,9278
80,9
8458
80,9
8504
930,1
7227
31,2
7777
16,77
7752
74,6
6048
77,1
12,98
0918
,4273
490,5
2341
40,5
1916
89,5
6688
361
8,860
4654
827
,80,8
8458
0,466
3866
40,1
2804
308
82,64
3475
859,9
20,1
7488
7659
79,92
7879
3679
,9278
80,9
8458
80,9
8504
930,1
7227
31,0
5546
18,36
6662
35,1
0185
18,5
14,03
5522
,0822
040,5
5404
60,4
5281
79,9
9920
7112
,0829
968
27,8
0,884
580,4
6638
664
0,263
3023
574
,7338
9763
9,92
0,174
8876
5979
,9278
7936
74,73
390,9
6471
30,9
8504
930,1
7227
30,8
9617
20,25
0579
55,6
2516
110
,414
,5684
25,24
9931
0,605
531
0,341
628
8,626
0939
216
,6238
372
27,8
0,884
580,4
6638
664
0,329
9024
970
,7371
4286
9,92
0,174
8876
5979
,9278
7936
70,73
714
0,944
015
0,985
0493
0,172
273
0,820
1921
,7630
194
6,045
283
11,4
14,32
7726
,0572
170,6
4007
30,2
7068
37,0
5325
866
19,00
3958
527
,80,8
8458
0,466
3866
40,2
9999
976
72,54
2411
119,9
20,1
7488
7659
79,92
7879
3672
,5424
10,9
5393
90,9
8504
930,1
7227
30,8
5383
22,87
2286
66,3
5341
311
,113
,4268
24,10
905
0,652
201
0,247
083
5,956
9360
818
,1521
144
27,8
0,884
580,4
6638
664
0,185
6878
579
,2987
6175
9,92
0,174
8876
5979
,9278
7936
79,29
876
0,982
609
0,985
0493
0,172
273
0,990
123
,5856
405
6,551
567
9,412
,227
19,40
3396
0,629
136
0,292
618
5,677
7878
313
,7256
0827
,80,8
8458
0,466
3866
40,0
2971
278
88,29
7332
439,9
20,1
7488
7659
79,92
7879
3679
,9278
80,9
8458
80,9
8504
930,1
7227
31,1
8209
21,57
5052
5,993
077,1
10,99
7713
,6204
610,5
7382
20,4
0976
75,5
8122
208
8,039
2393
27,8
0,884
580,4
6638
664
-0,13
0818
597
,5168
943
9,92
0,174
8876
5979
,9278
7936
79,92
788
0,984
588
0,985
0493
0,172
273
1,462
7817
,0187
494
4,727
435,1
9,952
588,9
9034
660,5
0448
0,559
441
5,029
5722
13,9
6077
436
27,8
0,884
580,4
6638
664
-0,26
4809
610
5,355
6398
9,92
0,174
8876
5979
,9278
7936
79,92
788
0,984
588
0,985
0493
0,172
273
1,811
8511
,9156
353
3,309
899
3,19,4
4452
5,961
8044
0,392
190,7
7096
24,5
9632
379
1,365
4806
427
,80,8
8458
0,466
3866
4-0
,3283
082
109,1
6612
9,92
0,174
8876
5979
,9278
7936
79,92
788
0,984
588
0,985
0493
0,172
273
2,036
717,1
1215
814
1,975
599
199,8
1524
55,50
423
6077
,7135
416
88,25
4

20
2.1.2. 1 MW PV PP System Design in Karapinar ESIZ
Prepared with an aim to reach required panel numbers, total area, array
position etc., necessary parameters to be used in various parts of this study is brought
about and essential PV design parameters are identified.
The parameters needed to designate and the outputs obliged to bring about are
the followings:
2.1.2.1. Features of selected PV Panel
The necessary information of the preffered panel are the followings as seen in
Table 4 [58]: Table 4 Features of the selected panel model [58] Description Data
PV Panel Model Yingli YL280C/30b Monocrystalline Panel
Maximum Power 280 Wp
Solar Cell Monocrystalline 156×156 mm
No. of Cells 60 (6×10)
Cell Area 1.46 m2 (0.156 m×0.156 m×60)
Dimensions 1,650×990×40 mm
Area of a Panel 1.63 m2 (1.65 m×0.99 m)
2.1.2.2. Required amount of PV Panels
Because of the system is designed to have 1 MW installed power; the system
needs 3572 (1,000,000Wp/280Wp) PV Panels having 280 Wp value.
2.1.2.3. PV Design in the Process of PV Mounting
Because of not being any obstacle across the selection [59], the PV arrays are
presumed as subsuming 15 PV modules 5 of which is placed in the same row and 3
of which is mounted to the same column.
PV Array width is found by multiplying PV module width with the number of
PV Modules in the row of the array. This calculation gives 4,950 mm (990×5).
PV Array height is calculated via the multiplication of module height with the
number of modules on the same column. This calculation presents 4,950 mm
(1,650×3).
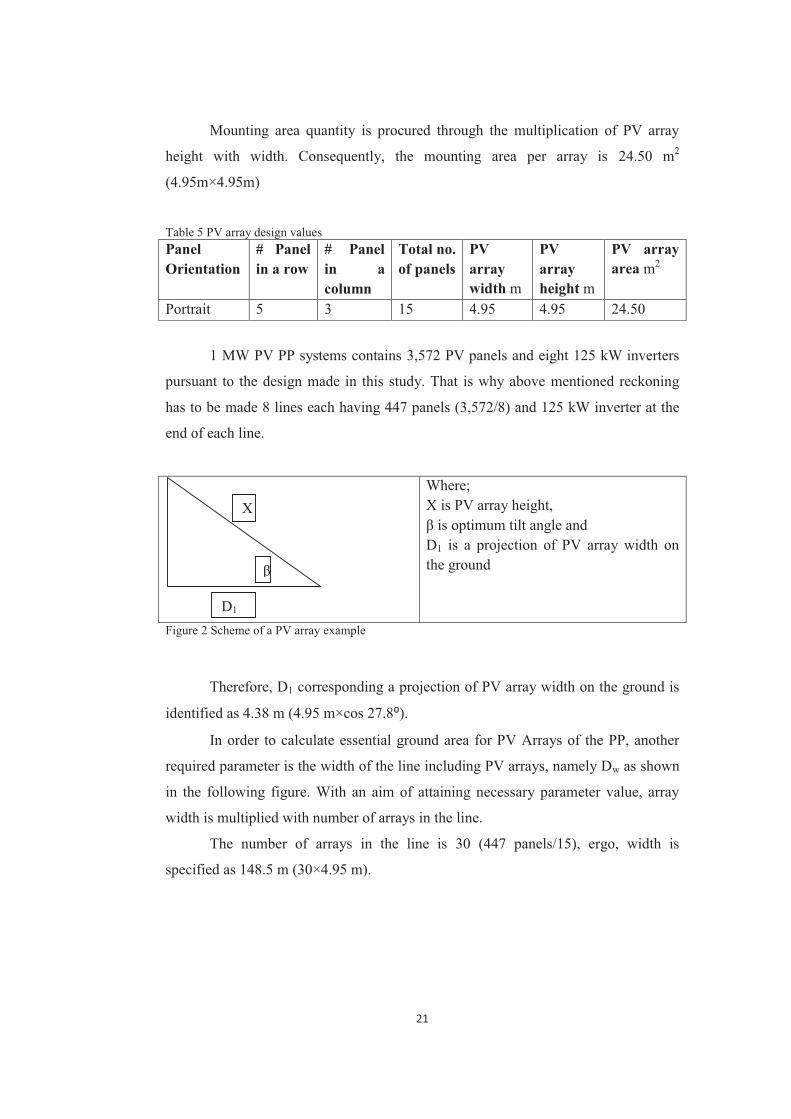
21
Mounting area quantity is procured through the multiplication of PV array
height with width. Consequently, the mounting area per array is 24.50 m2
(4.95m×4.95m)
Table 5 PV array design values Panel Orientation
# Panel in a row
# Panel in a column
Total no. of panels
PV array width m
PV array height m
PV array area m2
Portrait 5 3 15 4.95 4.95 24.50
1 MW PV PP systems contains 3,572 PV panels and eight 125 kW inverters
pursuant to the design made in this study. That is why above mentioned reckoning
has to be made 8 lines each having 447 panels (3,572/8) and 125 kW inverter at the
end of each line.
Where; X is PV array height, β is optimum tilt angle and D1 is a projection of PV array width on the ground
Figure 2 Scheme of a PV array example
Therefore, D1 corresponding a projection of PV array width on the ground is
identified as 4.38 m (4.95 m×cos 27.8⁰).
In order to calculate essential ground area for PV Arrays of the PP, another
required parameter is the width of the line including PV arrays, namely Dw as shown
in the following figure. With an aim of attaining necessary parameter value, array
width is multiplied with number of arrays in the line.
The number of arrays in the line is 30 (447 panels/15), ergo, width is
specified as 148.5 m (30×4.95 m).
β
X
D1

22
………………..
Figure 3 Layout of a PV line
Table 6 Essential dimensions for each line containing PV arrays Line width m Array width m Ground area m2 148.50 4.38 650.43
2.1.2.4. Array Row Spacing
Minimum distance between PV module lines is computed to avoid the
shading which can result in strong reduction of the production of electricity. Hence,
the minimum distance is determined when it marks the beginning of the so-called
phenomenon of shading. The minimum distance for the placement of parallel lines
with β ≠ 0 ° can be derived from the triangle shadows [59].
1
2
1 2
cossintan( )m
T
D XH XD H LD D D
���
� �� �� � �
� �
Figure 4 Triangle shadow method for the computation of the array row spacing of the system [59]
Making calculations consistent with the mentioned method, the approached
value determining the necessary distance between two module lines (DT) is 8.57 m.
The details of the calculations are found in Table 7.
Dw
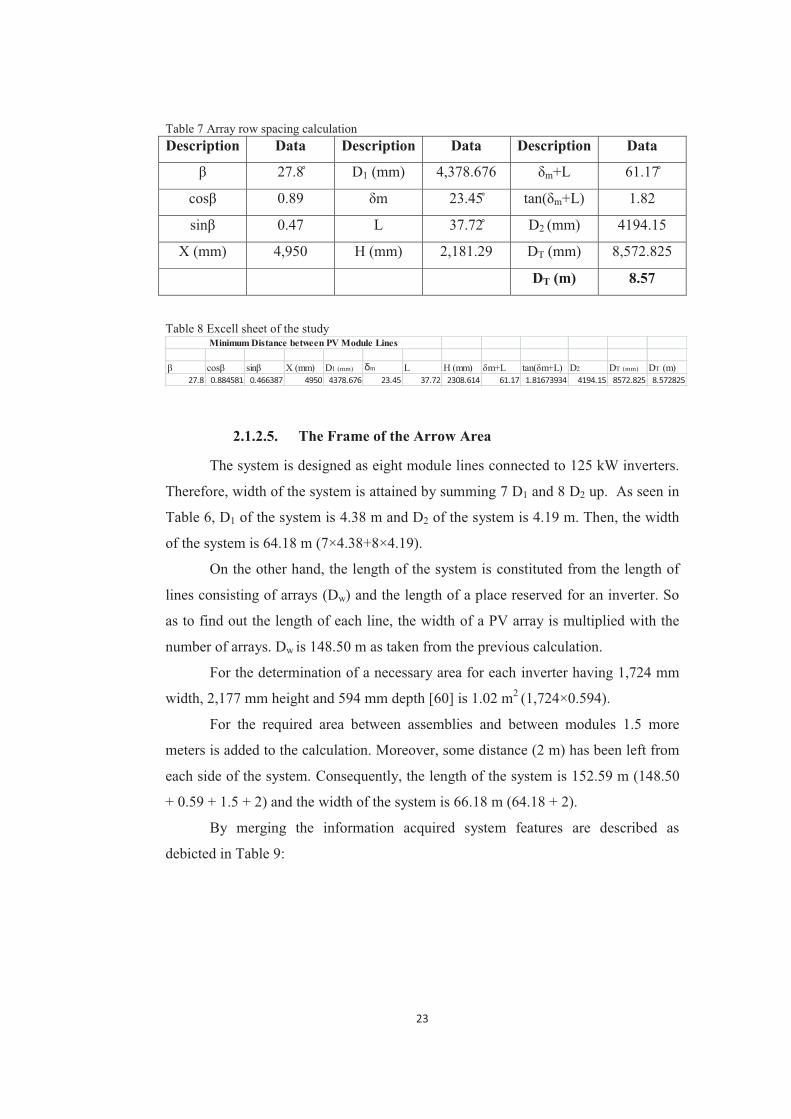
23
Table 7 Array row spacing calculation Description Data Description Data Description Data
β 27.8̊ D1 (mm) 4,378.676 δm+L 61.17̊
cosβ 0.89 δm 23.45̊ tan(δm+L) 1.82
sinβ 0.47 L 37.72̊ D2 (mm) 4194.15
X (mm) 4,950 H (mm) 2,181.29 DT (mm) 8,572.825
DT (m) 8.57
Table 8 Excell sheet of the study
β cosβ sinβ X (mm) D1 (mm) δm L H (mm) δm+L tan(δm+L) D2 DT (mm) DT (m)27.8 0.884581 0.466387 4950 4378.676 23.45 37.72 2308.614 61.17 1.81673934 4194.15 8572.825 8.572825
Minimum Distance between PV Module Lines
2.1.2.5. The Frame of the Arrow Area
The system is designed as eight module lines connected to 125 kW inverters.
Therefore, width of the system is attained by summing 7 D1 and 8 D2 up. As seen in
Table 6, D1 of the system is 4.38 m and D2 of the system is 4.19 m. Then, the width
of the system is 64.18 m (7×4.38+8×4.19).
On the other hand, the length of the system is constituted from the length of
lines consisting of arrays (Dw) and the length of a place reserved for an inverter. So
as to find out the length of each line, the width of a PV array is multiplied with the
number of arrays. Dw is 148.50 m as taken from the previous calculation.
For the determination of a necessary area for each inverter having 1,724 mm
width, 2,177 mm height and 594 mm depth [60] is 1.02 m2 (1,724×0.594).
For the required area between assemblies and between modules 1.5 more
meters is added to the calculation. Moreover, some distance (2 m) has been left from
each side of the system. Consequently, the length of the system is 152.59 m (148.50
+ 0.59 + 1.5 + 2) and the width of the system is 66.18 m (64.18 + 2).
By merging the information acquired system features are described as
debicted in Table 9:

24
Table 9 System features Description Data
Installed Power 1 MW
Needed Panel Number 3572 [(106/280)W]
Total Panel Area 5822.36 m2 [3572×1.63m2]
Number of Panels in each array 15 (5 in a row and 3 in a column)
Number of Arrays 239 [3572/15]
Number of lines 8
Total Area needed for PV arrays 9,530.73 m2 [64.18×148.50]
Total Area needed for the System 10,098.41 m2 [66.18×152.59]
Owing to the determined dimensions, the layout of the system to be installed
within this study is shown in the following figure basically.
…. ……..
. . . . . .
…. ……..
.
Figure 5 Layout of 1 MW PV PP to be established in Karapınar ESIZ
152.59 m
66.18m

25
2.1.3. PV F-CHART Computations (Electricity Production Calculation)
Firstly, the electricity generation of the system is computed by using the
relation of solar irradiance (1,688 kWh/m2), total number of modules (3,572),
module area for each (1.63 m2), efficiency of the modules (0.171). Then, the found
value is checked with PV F Chart programme.
Basically the first year electricity production of the system is 1,680,612.569
kWh (1,688×1.63×3,572×0.171) which corresponds to 1.680 GWh/year. However,
exact value can be found by using PV F-Chart software programme which includes
more inputs from many parameters.
Consequently, next necessarry step to reckon electricity production of the
system is running PV F-Chart programme.
PV F-Chart, a computer program serving for the design and economic
analysis of PV systems, is used for the designation of an electricity production of a
system in this part of the study.
Looking at what is needed to run PV F-Chart programme so as to designate
the electricity production of a system, followings are listed:
General systems features
Load amount
Weather information including monthly solar radiation, temperature, humidity,
reflectivity and latitude
System parameters consisting of cell temperature at NOCT conditions, array
reference efficiency, array reference temperature, array temperature coefficient,
power tracking efficiency, power conditioning efficiency, array area, array slope
and array azimuth [61].
2.1.3.1. Inputs for PV F-CHART
General Systems Features
Since system is composed of utility scale ground mounted array having fixed tilt,
utility interface and flat-plate array options are selected.
Load Amount
Because this study does not deal with certain amount of demand, load quantity is
not entered into the simulation.

26
Weather Information
� Monthly Solar Radiation
Monthly solar radiation is given in Table 10 as calculated in the solar
radiation part of the study. What has been found through the calculation in the solar
radiation part is MJ/m2 basis, while this software demands the data in kJ/m2.
Therefore, unit conversion is applied.
Table 10 Monthly solar radiation of a system Time kJ/m2 Time kJ/m2
January 7,620 July 22,872
February 10,958 August 23,586
March 16,778 September 21,576
April 18,367 October 17,019
May 20,251 November 11,916
June 21,763 December 7,112
� Monthly Average Temperature
Monthly average temperature is taken from the official statistics of Turkish
Meteorological Institute archives covering 50 years between 1962-2012 [54]. The
following values for Konya which constitutes Karapınar as a district are used and be
negligibly closer to Karapınar, since exact values of Karapınar do not exist.
Table 11 Monthly average temperature of a location [54] Time T Time T
January -0.2 July 23.6
February 1.2 August 23
March 5.7 September 18.6
April 11 October 12.5
May 15.7 November 6.1
June 20.2 December 1.8

27
� Humidity
Figuring out from the unit of demanded humidity values, what is requested is
specific humidity values. However, the official statistics of TURKSTAT provides
relative humidity values for the determined city. Conseqently, there is a conversion
need of data from relative one to specific one. Looking at a conversion formula:
0,622 100s
s
SH RH �
�
�� �
� � � ��
Where SH is specific humidity (kg/kg), RH is relative humidity (%), ρws
corresponds density of water vapor (kg/m3) and ρ corresponds density of the moist or
humid air (kg/m3) [62].
Using above mentioned equation and humidity conversion calculator [63] the
following table reveals the humidity values both for former and latter unit types.
Table 12 Monthly humidity values [62 - 63] Time Humidity
(%)
Humidity
(kg/kg)(×E-3)
Time Humidity
(%)
Humidity
(kg/kg)(×E-3)
January 85.9 3.17 July 31.8 5.70
February 83.4 3.42 August 36.4 6.30
March 63.2 3.56 September 34 6.64
April 46.9 3.79 October 59.7 4.48
May 59.3 6.51 November 78 4.52
June 39.6 5.77 December 82.7 3.54
� Reflectivity
The field where the system is established is only composed of a soil. Hence
the reflectivity of a typical soil which is accepted as 0.2 [64] is used in this study.
� Latitude
The latitude of the determined field where the system is established is 37.72⁰.

28
System Parameters
� Cell Temperature at NOCT Conditions
Cell temperature at NOCT conditions is designated as 46⁰C, pursuant to the
information given in the product brochure of the module [58].
Array Reference Efficiency
Array reference efficiency is described as the product of reference cell
efficiency and cell packing factor or reference module efficiency [61]. The module
reference efficiencies is directly given as 17.1% by the manufacturer respectively
[58].. The array reference efficiency is taken as 0.171.
Array Reference Temperature
A temperature at which the array efficiency is known is generally accepted as
250, so, this system also [58].
Array Temperature Coefficient
The rate at which the array efficiency linearly decreases with temperature for
maximum power-tracking operation. This coefficient is primarily a function of the
cell material. Typical values are 0.0043 (1/0C) for silicon cells. The value entered is a
factor of 1000 greater than the actual coefficient.
Power Tracking Efficiency
Power tracking efficiency, the efficiency of the control logic and electronic
equipment used to control the array to operate at its maximum power point. Power
tracking efficiency is not taken into account in this study.
Power Conditioning Efficiency
The power conditioning efficiency parameter corresponds the efficiency of
the inverter used to convert DC power into AC power so as to make it ready for the
connection to the grid. Since the preferred inverter for this study has 96.5%
efficiency, the mentioned value is entered instead of the aforementioned parameter.
29
Array Area
Array area for 1 MW PV system is taken as 5822.36 m2 convenient to
calculation made in PV System Design part of this study.
Array Slope
Array slope is specified as 27.8 0C as fitting with the previous computation.
Array Azimuth
Array azimuth is zero. (south facing)
The above mentioned values are entered into the software and the software is
runned in order to get design results.
2.1.3.2. Design Results
The PV FChart is used to simulate electricity production of 1 MW PV PP in
Karapınar ESIZ in a year. Pursuant to the output of the simulation, first year
electiricty production of the system, as seen in the Figure 6, is 1,497,910.9 kWhs
which is equal to 1.498 GWh. So as to compute lifetime electricity production
degredation factor should be taken into account.
Moreover, when compared, calculation made by taking into account solar
irradiance, module area and efficiency has difference from the outputs of PV F-Chart
simulation applied for the system.

30
Fi
gure
6 P
V F
Cha
rt ta
ble
reve
alin
g m
onth
ly ra
diat
ion,
eff
icie
ncy
and
elec
trici
ty p
rodu
ctio
n .

31
2.1.4. Total Electricity Production of 1 MW PV PP in Karapinar ESIZ
So as to calculate the amount of electrical energy to be produced during
lifetime of the PP, the output acquired via PV F-Chart revealing an electricity
production for the first year of the project is projected to the whole life of the system
by conceiving degradation of the PV system because of the degradation of PV panels
through some reasons like ultraviolet affect. For PV systems an annual output drop
of 0.6% [65 - 68] mainly as a result of module exposure to ultraviolet radiation, has
been considered [69].
Table 13 Excell sheet projecting total electricity production of 1 MW PV PP
Time (years) El. Production (kWh) Time (years) El. Production (kWh)1 1497910.9 16 1496563.3462 1497821.025 17 1496473.5523 1497731.156 18 1496383.7644 1497641.292 19 1496293.9815 1497551.434 20 1496204.2036 1497461.581 21 1496114.4317 1497371.733 22 1496024.6648 1497281.891 23 1495934.9039 1497192.054 24 1495845.147
10 1497102.222 25 1495755.39611 1497012.396 26 1495665.65112 1496922.575 27 1495575.91113 1496832.76 28 1495486.17614 1496742.95 29 1495396.44715 1496653.145 30 1495306.723
Total (kWh) 44898253.41 Total (GWh) 44.89825341
PV PP Electricity ProductionDegradation Factor (%) = 0,6
As seen in the Figure 6, first electricity production exploited from the output
of PV F-Chart simulation is determined as 1,497,910.9 kWh. Electricity production
for remaining years till end of the lifetime of the system is formulated and computed
with 0.6% degradation rate. Therefore, total electricity production of the system is
summed as 44,898,253 kWh or 44.898 GWh.

32
2.1.5. LCA of 1 MW PV PP in Karapinar ESIZ
Because of having operation not generating any carbon dioxide, solar and
nuclear electricity technologies often are considered as “carbon-free” [70]. However,
this is not valid for the entire life cycle of energy production. During extraction,
processing and disposal of related materials, in addition to the material use and
source depletion gases mainly carbon dioxide are certainly emitted as well [71]. This
LCA part of the study was prepared to take a life cycle inventory of PV technology.
2.1.5.1. How Electricity via PV Power Plant is produced?
As mentioned previously, solar irradiation has a possibility to reach the Earth
surface both in a direct and diffused way which are classified as beam and diffuse
irradiations. PV modules have a capability to use both type of irradiations for
electricity production. Consequently, solar energy falling on a PV module being
either direct or diffused is converted into DC electrical energy by PV modules
constituting from PV cells. BoS components like inverters step in exactly at that
point where produced electricity is converted into efficient and usable form, from DC
power to AC power. Then, with direct connection to the grid, the electricity is ready
to be used by the consumers [72].
With more detailed terms, a thin sheet of semiconductor material such as
silicon is placed on the ground where has accessibility to solar irradiation. The sheet,
known as a cell, is composed of two distinct layers formed by introducing impurities
into the silicon resulting in a n-type layer and a p-type layer that form a junction at
the interface. Striking the cell solar photons result in electron-hole pairs generation
that are spatially driven by an intrinsic electric field at the junction. Owing to the
creation of negative charges on one side of the interface and positive charges on the
other side, voltage is brought about. Then, the connection of the two sides of the
illuminated cell to the load provides for flowing of a current from one side of the
device via the load to the other side of the cell generating electricity [73].
2.1.5.2. The Life Cycle of Solar Electiricity Generation
The life cycle of solar electricity generation mainly covers material extraction
and production (e.g mining, smelting, refining, purification), solar cell- and PV
module-production, BoS production (e.g. inverters, transformers, wiring, structural

33
supports), system operation and maintanance, system decomissioning, and disposal
or recycling [67]. The most important nuance to be taken attention is studying the
lifecycles of PV modules and the BoS seperately based upon formers entailing more
options and more evolution than the latter [70].
The basic life cycle of PV panels are shown in Figure 7 [70].
Figure 7 The lifecycle of a PV system [70]
2.1.5.3. PV Manufacturing Process and Value Chain
Exploiting from the solar energy by converting sunlight into electricity needs
a multi-stage production process to be undergone. Within these stages, silicon is
shaped into blocks, so-called ingots after extracted from sand and purified, melted
down to produce crystalline Si material. Then, the ingots are cut into slices, namely
wafers. In the next step, these are coated to produce solar cells which are then put
together to form solar modules [74].
Summary and detailed PV Value Chain scheme derived from the references is
given in the Figure 8 [74 - 77]:

34
Figure 8 PV Value Chain used for this study [74 - 77]
2.1.5.4. Processes for the production of a PV Module with
Monocrystalline Silicon Technology
Mainly, Silicon (Simet.) is produced from silica (SiO2), mined as quartz sand,
that is reacted with carbon (wood, charcoal, and coal) in arc furnaces to yield
metallurgical-grade Si, and then purified to solargrade Si and electronic grade silicon
[70]. In order to bring about monocrystalline silicon, large ingots of silicon crystals
are grown by the Czochralski method from a bath of molten metallurgical-grade Si.
Mono-crystalline products must be cut into wafers, to produce the basis of the solar
cells [77 - 78].
Silica Sand
Metallurgical Grade Silicon (MG-Silicon)
SoG Silicon EG Silicon Offgrade silicon
Silicon Production Mix
CZ silicon
PV wafer
PV cell
PV Panel

35
First Step - Extraction of a silica and Transformation of silica to silicon
(Metallurgical Grade Silicon)
As being the second most frequent element in the Earth’s crust, silicon can be
esteemed to be unlimited (27.6%) [79]. Silicon dioxide (Silica) found mainly as huge
deposists of quartzite or quartz sand is a form of silicon which is used in the PV
industry.
Silicon belongs to the group IV of the periodic system of elements, is easily
obtained and processed, is not toxic and does not build environmentally harmful
effects [79].
Silicon mine and its purification is schematically shown in Figure 9 taken
from [80].
Figure 9 Silicon mine and its purification [80]
Silicon metal is produced in electric arc furnaces from quartz reacting at very
high temperatures with reduction materials such as coal, coke, charcoal, wood chips
and the furnace graphite electrodes [77], as seen in the Figure 10 [81].
.

36
Figure 10 Typical layout production of a silicon metal [81]
The basic reaction to acquire silicon metal is the following:
SiO2 + 2C � Simet. + 2CO.
Pure silicon which is not pure enough in its natural state is the basic
component of a solar cell. The result of above mentioned process is metallurgical
grade silicon (MG-Si), which is the precursor for polycrystalline or solar-grade
silicon used in the photovoltaic industry and has a typical purity of about 98% which
is not a sufficient purity level for monocrystal PV manufacturing. Typical impurities
in metallurgical-grade silicon include carbon, alkali-earth and transition metals, as
well as boron and phosphorus [82 - 83].
Second Step - Purification of a silicon
Since solar panels require at least 99.9999% (6 N) pure silicon, this mg-Si
then goes through another purification step to produce useable solar silicon [81 - 84].
In this process MG-Si, not having required purity with a purity of about 98%
is transformed into electronic grade and/or SoG-Si (1-10-3or-6 purity) [85].
Third Step – Crystal Silicon Making
Monocrystalline method is determined as a manufacturing process for single
crystal ingots. The CZ method is used for the acquisition of ingots. Mono crystalline

37
ingots produce wafers, basis of PV cells, with a regular, perfectly- arrayed crystal
composition.
Within CZ process, a seed crystal of silicon is dipped into melted
polycrystalline silicon. As the seed crystal is withdrawn and rotated, a cylindrical
ingot or "boule" of silicon is formed. The ingot withdrawn is unusually pure, because
impurities tend to remain in the liquid [80].
The scheme of CZ equipment (Czochralski Apparatus) which realizes
aforementioned process is given in Figure 11 [80].
Figure 11 Czochralski equipment [80]
In CZ method, moreover, polycrystalline silicon purified till less than a few
ppb of metal content is molten together with dopants in a quartz crucible. The
dopants, such as boron and phosphorous, are used for the adjustment of resistivity.
Then, a small single silicon rod (seed) is placed on the molten silicon in an inert gas
atmosphere at about 1400 degrees Celcius. As the seed is slowly rotated and pulled
up from the melt, a single crystalline ingot with the same orientation as the seed is
produced [86]. The details of the steps of CZ methods and the apparatus are given in
Figure 12 [86].

38
Figure 12 Details of the steps of CZ method [86]
The following reactions take place [77]:
3 Si + 4 HNO3 -> 3 SiO2 + 4 NO + 2 H2O,
and SiO2 + 6 HF -> H2SiF6 + 2 H2O.
Before being released, the waste gases of the process (e.g. NOx, HF, acetic
acid- and nitric acid) are treated in a gas cleaner. Moreover, deionised water is used
for cleaning and acetone is used for final drying.
Forth Step – Execution of silicon wafers
Once the ingot produced via CZ process, it is sliced by using a circular saw to
acquire silicon wafers. Preferably, the wafers are then polished to remove saw marks
[80].
The slicing process of an ingot can be seen in Figure 13 [80].
Figure 13 Scheme of wafer slicing from ingots [80]
The detailed stages of wafer shaping are the followings:
39
a. Slicing
After sliced into wafers about 1 mm in thickness by saw, a single crystalline ingot is
cut pursuant to uniform diameter.
b. Lapping
In order to increase the parallelism and remove surface roughness made from saw
cuts and process damages, the sliced wafers are mechanically lapped by use of
alumina abrasive.
c. Etching
The mechanical damages induced during the previous processes are removed by
chemical etching. Typically, 10 to 20 microns is etched from both sides of wafers cut
by a wire saw. Alkaline etches are commonly used, with subsequent rinsing in
deionised water.
d. Polishing
The mechano-chemical polishing process improves the parallelism and makes highly
flat surface by use of colloidal silica.
e. Cleaning and inspection
The processed wafers are cleaned and inspected to be polished wafers [86].
Fifth Step – Doping (creation of n-type and p-type wafers)
The pure silicon is doped with phosporous and boron to produce an excess of
electrons and a deficiency of electrons respectively for the acquisiton of a
semiconductor being able to conduct electricity. Because of being shiny, the silicon
disks need an anti reflective coating, usually titanium dioxide [80].
Sixth Step – Placing Electrical Contacts
The machining and coating of their surfaces turns the wafers into solar cells
to load all the technical properties needed to convert sunlight into electric power.
Contacts are coated to the front and rear of the wafer to extract the current produced
by electron-hole pairs [75].
The scheme of electrically contacted PV module is presented in the
following, Figure 14 [80].

40
Figure 14 Scheme of electrically contacted PV module [80]
Seventh Step - The anti-reflective coating
Being shiny, pure silicon is able to reflect up to 35% of the sunlight. An anti-
reflective coating is a solution way to reduce the sunlight lost caused by albedo effect
[85].
Eigthieth Step - Encapsulating the cell
The finished solar cells are then encapsulated; that is, sealed into silicon
rubber or ethylene vinyl acetate. The encapsulated solar cells are then placed into an
aluminum frame that has a mylar or tedlar backsheet and a glass or plastic cover.
Then, the panels are ready to be assembled [80].
Ninth Step - Operations & Maintenance
O & M may require semi-annual / annual system inspections, array cleaning,
electrical checks / maintenance, and inverter maintenance.

41
Tenth Step – Recycling
Recycling of PV industry equipments include dismounting obsolete systems
and recovering materials such as aluminium, glass and silicon to be reused in the
maufacturing process as shown in Table 14 [87].
Table 14 Recyclable PV materials [87]
The 1 MW PV PP system to be installed by this study subsumes 3572 panels
of 280Wp having 60 monocrystalline cells in each. Total panel area of the system is
reckoned as 5822 m2.
2.1.6. The Life Cycle Inventory of PV Technology
Pursuant to Figure revealing the production hyerarchy of silicon based PV
power plants, this inventory work specifies data from the process consisting of quartz
reduction, silicon purification, wafer, panel and laminate production, manufacturing
of inverter, mounting, cabling, infrastructure and 30 years of operation. For each
production stages in the figure following informations have been thought: energy
consumption, air- and waterborne process-specific pollutants at all production
stages, materials, auxiliary chemicals, etc., transport of materials, of energy carriers,
of semi-finished products and of the complete power plant, waste treatment
processes for production wastes, dismantling of all components and infrastructure for
all production facilities with its land use [77]. All the components of the life cycle
inventories especially material use and energy use are dwelled upon this part of the
study.

42
First Step - Extraction of a silica and Transformation of silica to silicon
(Metallurgical Grade Silicon)
In the processes constituting extraction of a silica and transformation of it to
silicon (MG-si), the necessary parameters such as material use, waste emissions etc.
for the production of 1 kg MG-si are given in Table 15.
Table 15 Preffered data used in this study for the transformation of silica to silicon (metallurgical grade silicon) process Description Quantity Unit Reference
MG-Silicon (output)
1 kg -
Silica Sand 2.70 kg Average of references; [78], [84], [94 - 96]
Electricity 11 kWh [78], [86] (47 MJ)
Wood Scraps 1500
kg
Average of references;[78], [84], [94 - 97]
Charcoal 0.17 [78]
Coke4 0.387 [87]
CO2 4 [97]
CO 0.002
[78]
Arsenic 9.42 E-9
Aluminum 1.55 E-6
Antimony 7.85 E-6
Boron 2.79 E-7
Cadmium 3.14 E-10
Calcium 7.75 E-7
kg
[77]
Chromium 7.85 E-9
Chlorine 7.85 E-8
Cyanide 6.87 E-6
4 11.36 MJ/29.3 MJ/ kg because pursuant to European Nuclear Society, 1 kg coal equivalent is equal to 29.3MJ.
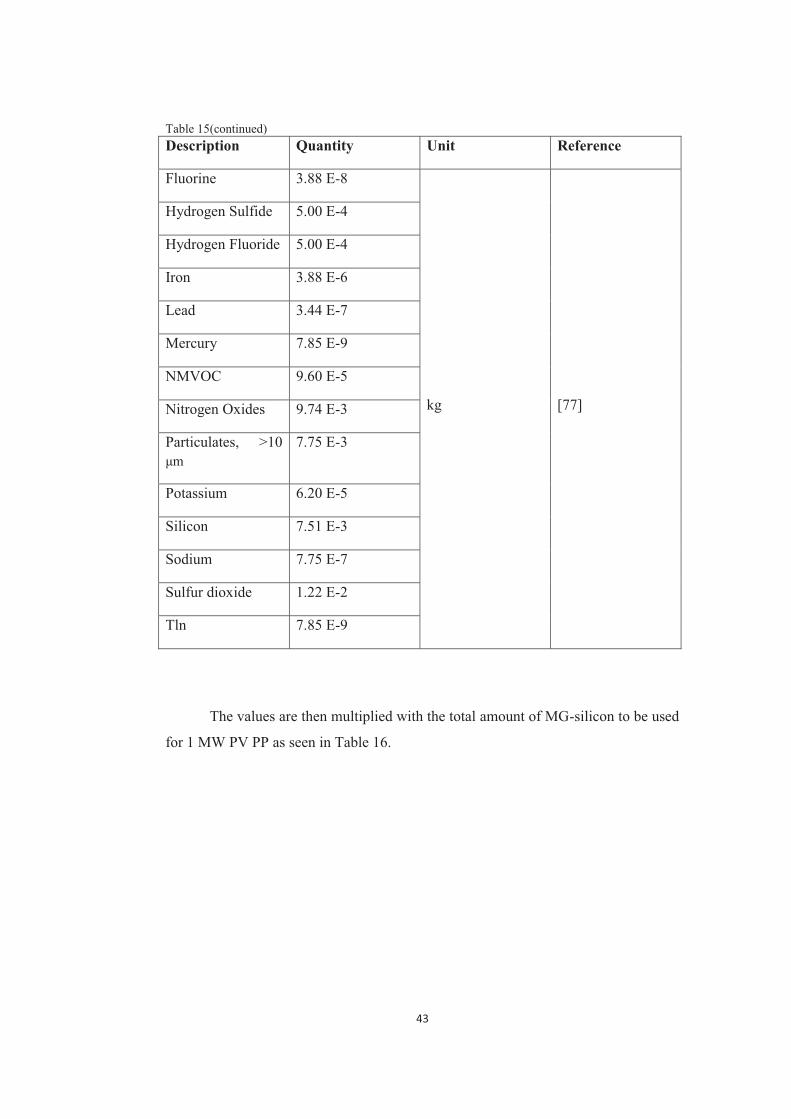
43
Table 15(continued) Description Quantity Unit Reference
Fluorine 3.88 E-8
kg
[77]
Hydrogen Sulfide 5.00 E-4
Hydrogen Fluoride 5.00 E-4
Iron 3.88 E-6
Lead 3.44 E-7
Mercury 7.85 E-9
NMVOC 9.60 E-5
Nitrogen Oxides 9.74 E-3
Particulates, >10 μm
7.75 E-3
Potassium 6.20 E-5
Silicon 7.51 E-3
Sodium 7.75 E-7
Sulfur dioxide 1.22 E-2
Tln 7.85 E-9
The values are then multiplied with the total amount of MG-silicon to be used
for 1 MW PV PP as seen in Table 16.

44
Table 16 Excell sheet revealing the outputs of the transformation of silica to silicon (metallurgical grade silicon) process
Description Unit Amount Materials Unit Unit Amount TotalPanel No. - 3572 Mg-Si kg 11 panel m2 1.63 Silica sand kg 2.7 15206.9Panel Total m2 5822.36 Electricity kWh 11 61954Solar Cell m2 5426.4395 Wood scraps kg 1500 8448270Silicon wafers m2 5752.0264 Charcoal kg 0.17 957.471Crystal Silicon kg 5090.5466 Coke kg 0.387 2179.65Silicon Production Mix kg 5446.8885 CO2 kg 4 22528.7SoG Silicon kg 4368.4058 CO kg 0.002 11.2644MG-Si kg 5632.18 Arsenic kg 9.42E-09 5.3E-05Silica sand kg 15206.886 Aluminium kg 0.00000155 0.00873
Antimony kg 0.00000785 0.04421Boron kg 0.000000279 0.00157Cadmium kg 3.14E-10 1.8E-06Calcium kg 0.000000775 0.00436Chromium kg 7.85E-09 4.4E-05Chlorine kg 7.85E-08 0.00044Cyanide kg 0.00000687 0.03869Fluorine kg 3.88E-08 0.00022Hydrogen Sulfide kg 0.0005 2.81609Iron kg 0.00000388 0.02185Lead kg 0.000000344 0.00194
PV LCI for Karapınar ESIZMG - Silicon
Second Step - Purification of a silicon
Purification of silicon comprises the conversion of metallurgical grade silicon
into the harmonisation of electrical grade silicon and solar grade silicon.
The esmissions made, materials used during EG-silicon, off-grade silicon and
silicon tetrachloride exploitation from MG-silicon are listed in Table 17.
Table 17 Preffered data used in this study for the purification of a silicon process by yielding EG-silicon, off-grade silicon and silicon tetrachloride Description Unit Value Comment
MG silicon (Input) kg 1
EG-silicon kg 0.676 [77] 0.95, [91] 0.8, [92] 0.87
Off-grade silicon kg 0.084
Silicon tetrachloride kg 1.20
Water m3 43.50 [77]

45
Table 17 (continued) Description Unit Value Comment
Polyethylene
kg
6.37 E-4 [83]
HCl 2
[77]
Graphite 6.64 E-4
AOX5 8.81 E-6
BOD5 1.43 E-4
COD 1.41 E-3
Chloride 2.51 E-2
Copper, ion 7.15 E-8
Nitrogen 1.45 E-4
Phospate 1.96 E-8
Sodium, ion 2.38 E-2
Zinc, ion 1.37 E-8
Iron, ion 3.92 E-8
DOC6 6.35 E-4
TOC7 6.35 E-4
Then, the cumulative values for parameters to acquire necessary amount of
inputs are calculated as follows, in Table 18.
5 Adsorbable Organic halogen as Cl 6 Dissolved Organic Carbon 7 Total Organic Carbon

46
Table 18 Excell sheet revealing the outputs of the EG and off-grade silicon production
Description Unit Amount Materials Unit Unit AmountTotalPanel No. - 3572 Mg-Si kg 1 1176.41 panel m2 1.63 Eg-silicon kg 0.676 795.246Panel Total m2 5822.36 off-grade kg 0.0844 99.2881Solar Cell m2 5426.44 silicon tetrachloridekg 1.2 1411.68Silicon wafers m2 5752.03 water m3 43.5 51173.4Crystal Silicon kg 5090.55 Polyethylene kg 0.000637 0.74937Silicon Production Mix kg 5446.89 HCl kg 2 2352.8SoG Silicon kg 4368.41 Graphite kg 0.000664 0.78113
AOX kg 0.00000881 0.01036BOD5 kg 0.000143 0.16823COD kg 0.00141 1.65872Chloride kg 0.0251 29.5276Copper, ion kg 7.15E-08 8.4E-05Nitrogen kg 0.000145 0.17058Phospate kg 1.96E-08 2.3E-05Sodium, ion kg 0.0238 27.9983Zinc, ion kg 1.37E-08 1.6E-05ıron, ion kg 3.92E-08 4.6E-05DOC kg 0.000635 0.74701TOC kg 0.000635 0.74701
PV LCI for Karapınar ESIZEG-Off Grade Silicon EG-silicon=0,676 kg; off-grade silicon=0,0844 kg
The same calculations for the attainment of solar grade silicon are given in
Table 19 as a unit basis and in Table 20 for cumulative amounts.
Table 19 Preffered data used in this study for the purification of a silicon process by yielding solar grade silicon Description Quantity Unit Reference
Sog Silicon (Output) 1
kg
-
Mg-Si 1.02 [85]
HCl 1.60
[93] HL 0.05
NaOH 0.35
AOX8 1.26 E-5 [77]
8 Adsorbable Organic halogen as Cl

47
Table 19(continued) Description Quantity Unit Reference
BOD5 2.05 E-4
kg
[77]
COD 2.02 E-3
Chloride 3.60 E-2
Copper, ion 1.02 E-7
Nitrogen 2.08 E-4
Phospate 2.80 E-6
Sodium, ion 3.38 E-2
Zinc, ion 1.96 E-6
Iron, ion 5.61 E-6
DOC9 9.10 E-4
TOC10 9.10 E-4
Table 20 Excell sheet revealing the outputs of the SoG silicon production
Description Unit Amount MaterialsUnit Unit Amoun TotalPanel No. - 3572 Mg-Si kg 1.02 4455.781 panel m2 1.63 HCl kg 1.6 6989.46Panel Total m2 5822.36 Hl kg 0.05 218.421Solar Cell m2 5426.44 NaOH kg 0.348 1520.21Silicon wafers m2 5752.03 AOX kg 0.0000126 0.05504Crystal Silicon kg 5090.55 BOD5 kg 0.000205 0.89552Silicon Production Mix kg 5446.89 COD kg 0.00202 8.82419SoG Silicon kg 4368.41 Chloride kg 0.036 157.263
Copper kg 1.02E-07 0.00045Nitrogen kg 0.000208 0.90863Phospate kg 0.0000028 0.01223Sodium kg 0.0338 147.652Zinc kg 0.00000196 0.00856Iron kg 0.00000561 0.02451DOC kg 0.00091 3.97525TOC kg 0.00091 3.97525
PV LCI for Karapınar ESIZSoG Silicon
9 Dissolved Organic Carbon 10 Total Organic Carbon

48
With ratios, the determination of required EG-silicon, off-grade silicon and
SoG - silicon are another step to be applied.
Table 21 Preffered data used in this study for the acquisition of silicon production mix Silicon production mix
kg
1 [94]
EG-silicon 14.6%
[77] Off-grade silicon 5.2%
SoG-silicon 80.2%
Table 22 Excell sheet revealing the outputs of the acquisition of silicon production mix
Description Unit Amount Materials Unit Unit Amount TotalPanel No. - 3572 EG-silicon % 14,6 795,2461 panel m2 1,63 Off-grade silicon % 5,2 283,238Panel Total m2 5822,36 SoG-Silicon % 80,2 4368,41Solar Cell m2 5426,44Silicon wafers m2 5752,03Crystal Silicon kg 5090,55Silicon Production Mix kg 5446,89
PV LCI for Karapınar ESIZSilicon Production Mix
Third Step – Crystal Silicon Making
In this part of LCI; the inputs and outputs of CZ process is brought about as a
unit basis in Table 23 and as total in Table 24.
Table 23 Preffered data used in this study for material use for CZ-sc-silicon production Description Quantity Unit Reference
CZ single crystalline silicon, PV
1 kg -
Water, cooling 2.33 m3 [95]
Water, river11 2.05 m3
Electricity 85.60 kWh [93]
11 Water supplied from river

49
Table 23 (continued) Description Quantity Unit Reference
Natural gas 68.20 MJ [93]
Tap water 94.10 kg [80]
Silicon Production Mix 1.07 [93]
Argon 5.79 [93]; protection gas for crystal growing
Hydrogen Flouride 0.05 [83], for etching
Nitric Acid 0.09
Acetic Acid 0.10
Acetone 0.05
Socium Hydroxide 0.04 [83], waste gas neutralization
Ceramic Ties 0.34 [93], quartz crucible for melting the silicon
Lime 0.19 [83], waste water treatment
Fluoride 2.37E-3 [83], 50% reduction, basic uncertainity=3
Hydrocarbons 2.28E-2
Hydroxide 7.42E-3
Acetic Acid 5.4E-2
BOD5 0.13 [77]
COD 0.13
DOC 0.04
TOC 0.04
Nitrogen 9.10E-3 [95], 50% of total emissions

50
Table 24 Excell sheet revealing the outputs of the process of crystal silicon making
Description Unit Amount Materials Unit Unit AmounTotalPanel No. - 3572 Water, cooling m3 2.33 118611 panel m2 1.63 water, river m3 2.05 10435.6Panel Total m2 5822.36 Electricity kWh 85.6 435751Solar Cell m2 5426.44 Natural gas MJ 68.2 347176Silicon wafers m2 5752.03 Tap water kg 94.1 479021Crystal Silicon kg 5090.55 Silicon Production Mix kg 1.07 5446.89
Argon kg 5.79 29474.3Hydrogen Flouride kg 0.05 254.528Nitric Acid kg 0.094 478.512Acetic Acid kg 0.1 509.055Acetone kg 0.049 249.437Sodium Hydroxide kg 0.041 208.713Ceramic Ties kg 0.336 1710.42Lime kg 0.191 972.295Flouride kg 0.00237 12.0646Hydrocarbons kg 0.0228 116.065Hydroxide kg 0.00742 37.7719Acetic Acid kg 0.054 274.89BOD5 kg 0.13 661.772COD kg 0.13 661.772DOC kg 0.0405 206.167TOC kg 0.0405 206.167Nitrogen kg 0.0091 46.324
PV LCI for Karapınar ESIZCrystal Silicon Making
Forth Step – Execution of silicon wafers
For 1 m2 of wafer acquisiton how much material is used and related
emissions are calculated and presented in Table 25.
Table 25 Preffered data used in this study for the execution of wafers Description Unit Quantity General Comment
Wafer m2 1
Electricity kWh 8 [77]
Natural gas MJ 4 [93], for removing adhesives after sawing
Tap water kg 6 E-3 [93]
Water kg 6.5 [93], for wafer cleaning

51
Table 25(continued) Description Unit Quantity General Comment CZ single cryst. silicon
kg
0.89 [77]; calculation with [102], data Silicon carbide 2.14 [93], SiC use for sawing NaOH 1.50 E-2
[93], for wafer cleaning HCl 2.70 E-3
Acetic acid 0.04 Tryethylene glycol 2.6 [93], for sawing slurry Dipropylene Glycol Monomethyl Ether
0.3 [93], for wafer cleaning
Alkylbenzene sulfonate 0.24 [93], for wafer cleaning Acrylic binder 0.20 E-2 [93], for temporarily attachment of
bricks to wire sawing equipment Glass wool mat 0.01 Paper 0.19 [83] Ploystyrene 0.20
[77] Packaging Film 0.10 Brass 7.45 E-3 [93], wire saws, high resistance brass-
coated steel with carbon content in the range 0,7%-0,9%, 5g/kg brass
Steel 1.48
Wire drawing 1.49 [93], wire saws Disposal 0.11 [93], estimate for unused parts of
crystal AOX 5.01 E-4 [95], formed by nitric acid use Cadmium 6.05 E-6 [96] Chromium 3.03 E-5 COD 0.03 [95], formed by nitric acid use Copper 6.05 E-5 [96] Lead 3.03 E-5 Mercury 6.05 E-6 Nickel 6.05 E-5 Nitrogen 9.94 E-3 [95], 50% of total emissions Phospate 5 E-4 [95] BOD5 0.03 [77] DOC 0.01 TOC 0.01
Total emissions made and materials used for the acquisition of necessary
amount of wafer are calculated as follows in Table 26:

52
Table 26 Excell sheet revealing the outputs of the execution of silicon wafers
Description Unit Amount Materials Unit Unit Amoun TotalPanel No. - 3572 Electricity kWh 8 46016.21 panel m2 1.63 natural gas MJ 4 23008.1Panel Total m2 5822.36 Tap water kg 0.006 34.5122Solar Cell m2 5426.44 Water kg 6.5 37388.2Silicon wafers m2 5752.03 CZ single cryst. Silicon kg 0.885 5090.55
Silicon Carbide kg 2.14 12309.3NaOH 0.015 86.2805HCl 0.0027 15.5305Acetic Acid 0.039 224.329Tryethylene glycol 2.6 14955.3dipropylene Glycol Monomethyl Ether 0.3 1725.61Alkylbenzene sulfonate 0.24 1380.49Acrylic binder 0.002 11.5041Glass wool mat 0.01 57.5203paper 0.19 1092.89polystyrene 0.2 1150.41packaging film 0.1 575.203Brass 0.00745 42.8526Steel 1.48 8513Wire drawing 1.49 8570.52Disposal 0.11 632.723AOX 0.000501 2.88177Cadmium 0.00000605 0.0348Chromium 0.0000303 0.17429COD 0.0296 170.26Copper 0.0000605 0.348Lead 0.0000303 0.17429Mercury 0.00000605 0.0348Nickel 0.0000605 0.348Nitrogen 0.00994 57.1752Phospate 0.0005 2.87602BOD5 0.0296 170.26DOC 0.011 63.2723TOC 0.011 63.2723
PV LCI for Karapınar ESIZExecution of Silicon Wafers
Fifth Step - PV Cell Production
The inputs and by products of PV Cell production process are computed then.
The amounts in Table 27 are identified for 1 m2 single Si PV Cell production.
Table 27 Solar cell production Description Unit Quantity General Comments
Single Si PV Cell (Output) m2 1
Water m3 9.99E-1 [93]

53
Table 27 (continued) Description Unit Quantity General Comments
Electricity kWh 0.30 [93]
Natural Gas MJ 4.77
Light Fuel Oil MJ 1.16
Single-si wafer m2 1.06 [93] 6% losses
Metallization paste, front size
kg
7.40 E-3
[93], for electric contacts Metallization paste, back side
4.90 E-3
Metallization paste, back side, aluminum
7.19 E-2
Ammonia 6.74 E-3 [93], for re-oxidation
Phosphoric acid 7.67 E-3
[77], [93] Phosphoryl Chloride 1.59 E-3
Titanium dioxide 1.42 E-6
Ethanol from ethylene 6.41 E-4
[93], for cleaning; [77] Isopropanol 7.89 E-2
Solvents 1.43 E-3
Silicone product 1.21 E-3 [93], silane (SiH4) for silicon nitride deposition; [77]
Sodium silicate 7.48 E-2 [77], [93]
Calcium chloride 2.16 E-2 [93]
Acetic acid 2.83 E-3 [93], for cleaning
Hydrochloric acid 4.56 E-2 [93], for surface etching
Hydrogen Flouride 3.77 E-2 [93], for etching phosporous glasses
Nitric Acid 2.57 E-2 [93]
Sodium Hydroxide 0.16 [93], for etching and cleaning
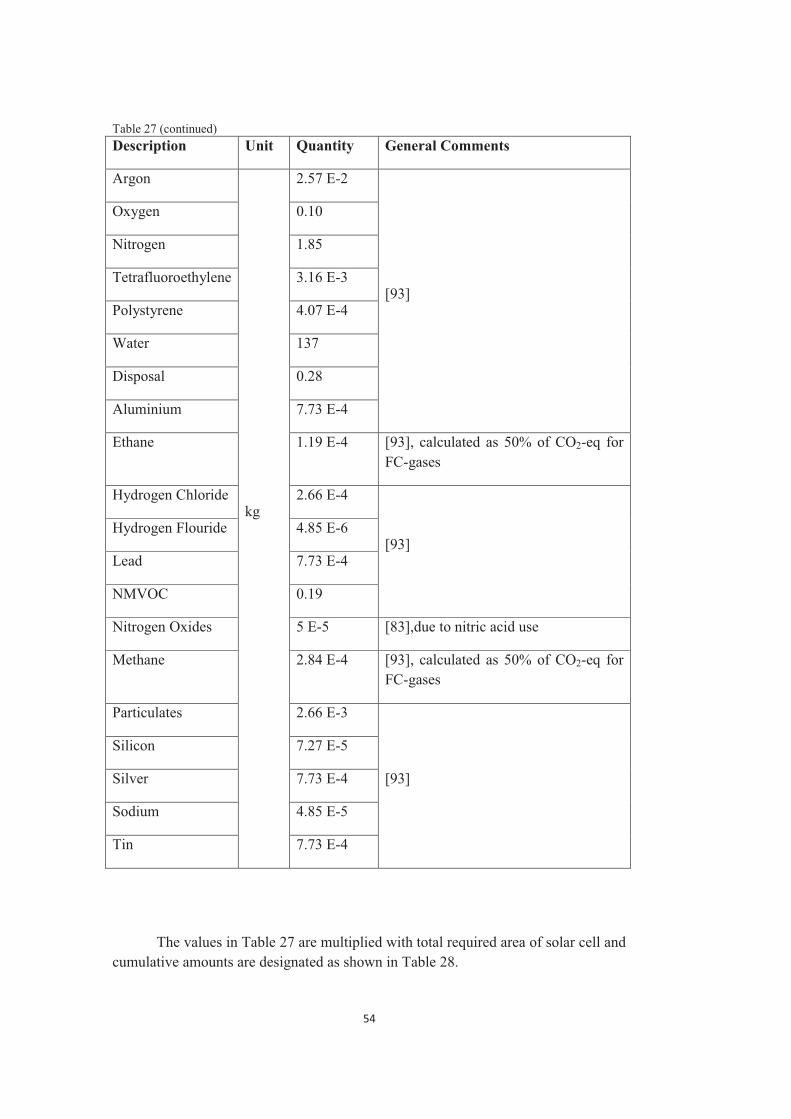
54
Table 27 (continued) Description Unit Quantity General Comments
Argon
kg
2.57 E-2
[93]
Oxygen 0.10
Nitrogen 1.85
Tetrafluoroethylene 3.16 E-3
Polystyrene 4.07 E-4
Water 137
Disposal 0.28
Aluminium 7.73 E-4
Ethane 1.19 E-4 [93], calculated as 50% of CO2-eq for FC-gases
Hydrogen Chloride 2.66 E-4
[93] Hydrogen Flouride 4.85 E-6
Lead 7.73 E-4
NMVOC 0.19
Nitrogen Oxides 5 E-5 [83],due to nitric acid use
Methane 2.84 E-4 [93], calculated as 50% of CO2-eq for FC-gases
Particulates 2.66 E-3
[93]
Silicon 7.27 E-5
Silver 7.73 E-4
Sodium 4.85 E-5
Tin 7.73 E-4
The values in Table 27 are multiplied with total required area of solar cell and cumulative amounts are designated as shown in Table 28.

55
Table 28 Excell sheet revealing the outputs of the solar cell production process
Description Unit Amount Materials Unit Unit AmountTotalPanel No. - 3572 Electricity kWh 0.302 1638.781 panel m2 1.63 natural gas MJ 4.77 25884.1Panel Total m2 5822.36 Water m3 0.999 5421.01Solar Cell m2 5426.44 Light Fuel Oil MJ 1.16 6294.67
Single-si Wafer m2 1.06 5752.03Metallization paste, front side kg 0.0074 40.1557Metallization paste, back side kg 0.0049 26.5896metallization paste, back side aluminium kg 0.0719 390.161Ammonia kg 0.00674 36.5742Phosporic Acid kg 0.00767 41.6208Phosphoryl Chloride kg 0.00159 8.62804Titanium Dioxide kg 0.00000142 0.00771Ethanol from ethylene kg 0.000641 3.47835Isopropanol kg 0.0789 428.146Solvents kg 0.00143 7.75981Silicone product kg 0.00121 6.56599Socium silicate kg 0.0748 405.898Calcium chloride kg 0.0216 117.211Acetic acid kg 0.00283 15.3568Hydrochloric acid kg 0.0456 247.446Hydrogen Flouride kg 0.0377 204.577Nitric Acid kg 0.0257 139.46Sodium Hydroxide kg 0.157 851.951Argon kg 0.0257 139.46Oxygen kg 0.102 553.497
PV LCI for Karapınar ESIZSolar Cell Production
Sixth Step - Solar Panels and Laminate Formation
The requirements of each m2 of single Si PV panel formation and emissions
to produce them are calculated. The results are given in Table 29.
Table 29 Preffered data used in this study for solar panels and laminate formation Description Unit Quantity General Comment
Single Si PV panel (output) m2 1
Electricity kWh 4.71 [77]
Natural Gas MJ 5.41
Tap water kg 21.30 [93]
Tempering 10.10

56
Table 29 (continued) Description Unit Quantity General Comment
Wire drawing kg 0.11
[93]
Single- Si PV cell m2 0.93
Aluminium alloy
kg
2.63
Nickel 1.63 E-4
Brazing solder 8.76E-3
Solar glass 10.10
Copper 0.11
Glass fibre reinforced plastic 0.19
Ethylvinylacetate 1
Polyvinylacetate 0.11
Polyethylene terephthalate 0.37
Silicone product 0.12
Acetone 1.30E-2
Methanol 2.16E-3
Vinyl acetate 1.64E-3
Lubricating oil 1.61E-3
Corrugated board 1.10
1-propanol 8.14E-3
Disposal, municipal solid waste 0.03
Disposal, polyvinylflouride 0.11
Disposal, plastics 1.69
Disposal, used mineral oil 1.61E-3
Treatment wastewater class 2 m3 2.13E-2

57
Total panel area required for 1 MW is multiplied with the parameter values
identified in Table 29 and given in Table 30.
Table 30 Excell sheet revealing the outputs of the production of solar panel and laminate formation process
Description Unit Amount Materials Unit Unit Amount TotalPanel No. - 3572 Electricity kWh 4.71 27423.31 panel m2 1.63 natural gas MJ 5.41 31499Panel Total m2 5822.36 tap water kg 21.3 124016
tempering kg 10.1 58805.8wire drawing kg 0.113 657.927Single Si PV Cell m2 0.932 5426.44Aluminium Alloy kg 2.63 15312.8Nickel kg 0.000163 0.94904Brazing Solder kg 0.00876 51.0039Solar Glass kg 10.1 58805.8Copper kg 0.113 657.927Glass Fibre reinforced Plastic kg 0.188 1094.6ethylvinylacetate kg 1 5822.36polyvinylacetate kg 0.11 640.46polyethylene terephthalate kg 0.373 2171.74Silicon Product kg 0.122 710.328Acetone kg 0.013 75.6907Methanol kg 0.00216 12.5763Vinyl Acetate kg 0.00164 9.54867Lubricating Oil kg 0.00161 9.374Corrugated Board kg 1.1 6404.61-propanol kg 0.00814 47.394Disposal, municipal waste kg 0.03 174.671Disposal, polyvinylflouride kg 0.11 640.46Disposal, plastics kg 1.69 9839.79Disposal, used mineral oil kg 0.00161 9.374Treatment ww class 2 m3 0.0213 124.016
PV LCI for Karapınar ESIZSolar Panels and Laminate Formation
2.1.6.1. Outputs of LCA
Necessary inputs for the manufacturing of 1 MW PV PP are determined and
gathered in Table 31.

58
Table 31 Quantities acquired after computation of LCI Description Unit Quantity
Panel Numbers - 3,572
Panel Area
m2
5,822
PV Cell Area 5,426
Wafer 5,752
CZ Single crystalline Silicon
kg
5,091
Silicon Production Mix 5,447
Mg-Silicon 5,632
SiO2 15,207
All the values calculated in LCI for each step of LCA are emerged and total
material use and emission made is found out. The result is presented in Table 32.

59 Tabl
e 32
Mat
eria
ls to
be
used
, em
issi
ons t
o be
mad
e fo
r 1 M
W P
V P
P D
escr
iptio
n
Uni
t Q
uant
ity
Des
crip
tion
U
nit
Qua
ntity
Elec
trici
ty
kWh
548,
104
Poly
viny
lace
tate
kg
640
Nat
ural
Gas
M
J 42
7,56
7 Po
lyet
hyle
ne T
erep
htha
late
21
72
Ligh
t Fue
l Oil
MJ
6,29
5 Si
licon
Pro
duct
71
0
Wat
er
kg
719,
350
Ace
tone
32
5
Tem
perin
g 58
,806
M
etha
nol
13
Wire
Dra
win
g 65
8 V
inyl
Ace
tate
10
Alu
min
ium
Allo
y 15
,313
Lu
bric
atin
g O
il 9
Nic
kel
1 C
orru
gate
d B
oard
6,
405
Bra
zing
Sol
der
51
1-pr
opan
ol
47
Sola
r Gla
ss
58,8
06
Dis
posa
l, m
unic
ipal
was
te
175
Cop
per
658
Dis
posa
l, po
lyvi
nylfl
ourid
e 64
0
Gla
ss F
ibre
rein
forc
ed P
last
ic
1095
D
ispo
sal,
plas
tics
9,84
0
Ethy
lvin
ylac
etat
e 5,
822
Dis
posa
l, us
ed m
iner
al o
il 9
Cha
rcoa
l 95
7 C
alci
um c
hlor
ide
117

60 Tabl
e 32
(con
tinue
d)
Des
crip
tion
U
nit
Qua
ntity
D
escr
iptio
n
Uni
t Q
uant
ity
Cok
e
kg
2,18
0 Ir
on
kg
5E-0
2
Met
alliz
atio
n pa
ste,
fron
t sid
e an
d ba
ck si
de
67
Ace
tic a
cid
1023
Met
alliz
atio
n pa
ste,
bac
k si
de a
lum
iniu
m
390
Hyd
roch
loric
aci
d 24
7
Am
mon
ia
37
Hyd
roge
n Fl
ourid
e 45
9
Phos
poric
Aci
d 42
N
itric
Aci
d 61
7
Phos
phor
yl C
hlor
ide
9 So
dium
Hyd
roxi
de
1060
Tita
nium
Dio
xide
8E
-3
Arg
on
29,6
13
Etha
nol f
rom
eth
ylen
e 3
Oxy
gen
554
Isop
ropa
nol
428
Silic
on C
arbi
de
12,3
09
Solv
ents
8
NaO
H
1,60
6
Silic
one
prod
uct
7 H
Cl
9,35
8
Soci
um si
licat
e 40
6 Po
lyet
hyle
ne
8E-0
1
Trye
thyl
ene
glyc
ol
14,9
55
AO
X
3
dipr
opyl
ene
Gly
col M
onom
ethy
l Eth
er
1,72
6 Fl
uorin
e 2E
-4

61 Tabl
e 32
(con
tinue
d)
Des
crip
tion
U
nit
Qua
ntity
D
escr
iptio
n
Uni
t Q
uant
ity
Alk
ylbe
nzen
e su
lfona
te
kg
1,38
0 H
ydro
gen
Sulfi
de
kg
3
Acr
ylic
bin
der
12
CO
D
843
Gla
ss w
ool m
at
58
Cya
nide
4E
-02
Pape
r 1,
093
Lead
2E
-01
Poly
styr
ene
1,15
0 M
ercu
ry
3E-0
2
Pack
agin
g fil
m
575
Nic
kel
3E-0
1
Bra
ss
43
Nitr
ogen
58
Stee
l 8,
513
Phos
pate
3
Wire
dra
win
g 8,
571
BO
D5
803
Dis
posa
l 63
3 D
OC
27
3
Gra
phite
8E
-01
TOC
27
3
Woo
d sc
raps
8E
+06
CO
2 22
,529
Cer
amic
Tie
s 1,
710
CO
11

62 Tabl
e 32
(con
tinue
d)
Des
crip
tion
U
nit
Qua
ntity
D
escr
iptio
n
Uni
t Q
uant
ity
Lim
e
kg
972
Ars
enic
kg
5E-5
Flou
ride
12
Alu
min
ium
8E
-03
Hyd
roca
rbon
s 11
6 A
ntim
ony
4E-0
2
Hyd
roxi
de
38
Bor
on
2E-3
Nitr
ogen
46
C
adm
ium
2E
-6
Hl
218
Cal
cium
4E
-3
Chl
orid
e 18
7 C
hrom
ium
4E
-5
Sodi
um
28
Chl
orin
e 4E
-4
Zinc
9E
-2
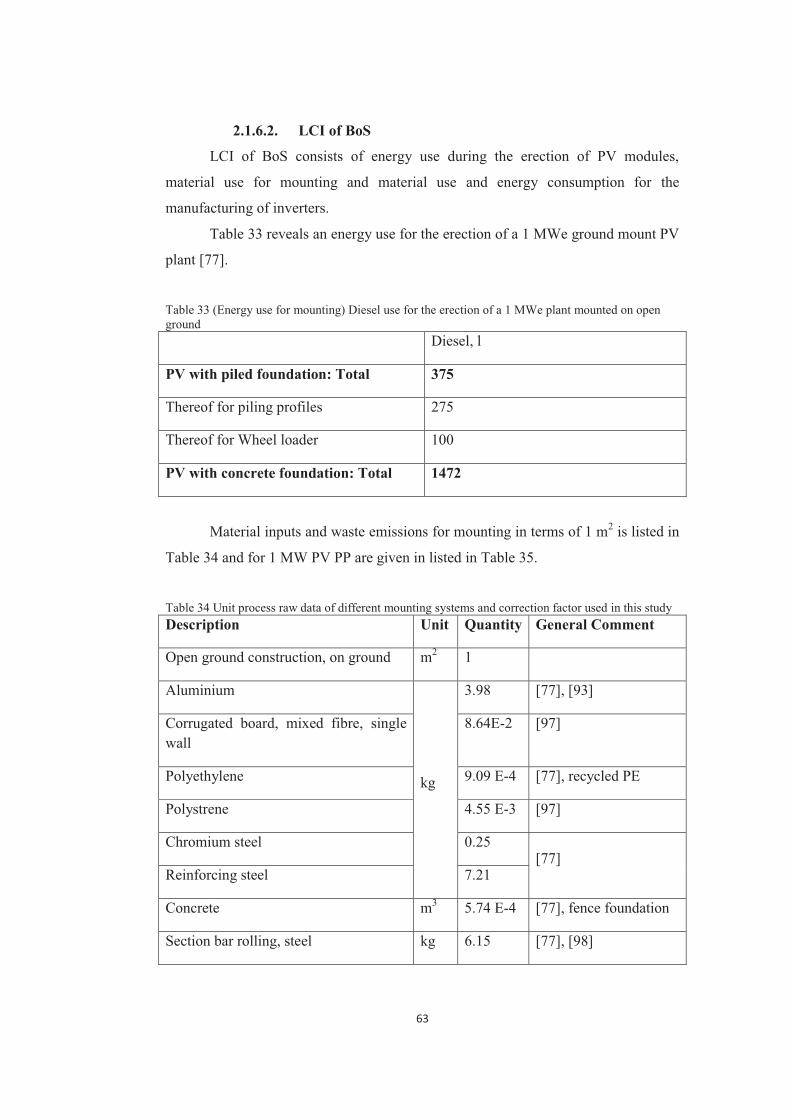
63
2.1.6.2. LCI of BoS
LCI of BoS consists of energy use during the erection of PV modules,
material use for mounting and material use and energy consumption for the
manufacturing of inverters.
Table 33 reveals an energy use for the erection of a 1 MWe ground mount PV
plant [77].
Table 33 (Energy use for mounting) Diesel use for the erection of a 1 MWe plant mounted on open ground Diesel, l
PV with piled foundation: Total 375
Thereof for piling profiles 275
Thereof for Wheel loader 100
PV with concrete foundation: Total 1472
Material inputs and waste emissions for mounting in terms of 1 m2 is listed in
Table 34 and for 1 MW PV PP are given in listed in Table 35.
Table 34 Unit process raw data of different mounting systems and correction factor used in this study Description Unit Quantity General Comment
Open ground construction, on ground m2 1
Aluminium
kg
3.98 [77], [93]
Corrugated board, mixed fibre, single wall
8.64E-2 [97]
Polyethylene 9.09 E-4 [77], recycled PE
Polystrene 4.55 E-3 [97]
Chromium steel 0.25 [77]
Reinforcing steel 7.21
Concrete m3 5.74 E-4 [77], fence foundation
Section bar rolling, steel kg 6.15 [77], [98]

64
Table 34 (continued) Description Unit Quantity General Comment
Wire drawing, steel
kg
1.06 [77]
Zinc coating, pieces 0.25 [77], [98]
Disposal, packaging cardboard 8.64E-2 [77]
Disposal, building 9.09 E-4 [77], disposal of plastics parts at end of life
Total weight, materials 11.50
Total weight structure 11.40
Panel area m2 1
Table 35 Excell sheet revealing the material uses of mounting systems
Materials Unit Unit AmountTotalArea (m2) 5822,36 Aluminium kg 3,98 23173
Corrugated Board kg 0,0864 503,052Polyethylene kg 0,000909 5,29253Polystrene kg 0,00455 26,4917Chromium Steel kg 0,247 1438,12Reinforcing Steel kg 7,21 41979,2Concrete m3 0,000574 3,34203Section bar rolling, steel 6,15 35807,5Wire drawing, steel 1,06 6171,7Zinc coating kg 0,25 1455,59Disposal, packaging cardboard 0,0864 503,052Disposal, building 0,000904 5,26341
PV BoS LCIMounting Systems
Inverters
The material use, energy consumption and waste emision during the
manufacturing of inverters which are another major equipment besides PV modules
are calculated as listed in Table 36 for each inverter and total use, consumption and
emission are listed in Table 37.

65
Table 36 Preffered data for a unit process raw data of "Inverter, 500kW, at plant" Description Unit Quantity General Comments
Electricity kWh 4580 [97]
Aluminium
kg
131
[98], recycled after use, [77]
Copper 335
Steel 1440
Polyethylene 22
[77], [98]
Alkyd paint 22
Lubricating oil 881
Glass fibre reinforced plastic
115
Printed wiring board m2 2.25 E-1
Connector
kg
47.40
Inductor 0.35
Integrated circuit 2.8 E-2
Transistor 3.8 E-2
Diode 4.7 E-2
Capacitor 0.6
Resistor 0.5 E-2
Sheet rolling, steel 144
Injection moulding 71
Wire drawing, copper 335
Section bar extrusion, alum.
131
[77] Corrugated board 13.6
Polystyrene foam slab 1.60 [97]
Fleece 0.3

66
Table 36 (continued) Description Unit Quantity General Comments
Disposal kg 3.9 Sum of polystrene, polyethylene, electronics, mineral oil, treatment of printed wiring boards, [77]
Table 37 Excell sheet revealing the material uses of inverter production
Materials Unit Unit Amount TotalInverter 125 kW 8 Electircity kWh 4850 9700
16 Aluminium kg 131 262Copper kg 335 670Steel kg 1440 2880Ploethylene kg 22 44Alkyd paint kg 22 44Lubricating Oil kg 881 1762Glass fibre reinforced pkg 115 230Printed wiring board m2 0,225 0,45Connector kg 47,4 94,8Inductor kg 0,351 0,702Integrated circuit kg 0,028 0,056Transistor kg 0,038 0,076Diode kg 0,047 0,094Capacitor kg 0,6 1,2Resistor kg 0,005 0,01Sheet rolling, steel kg 144 288Injection moulding kg 71 142Wire drawing, copper kg 335 670Section bar extrusion, akg 131 262Corrugated Board kg 13,6 27,2Polystryrene foam slab kg 1,6 3,2Fleece kg 0,3 0,6Disposal kg 3,9 7,8
PV BoS LCIInverter

67
2.1.7. PV LCOE
The Basic Definition of LCOE
The economic feasibility of an electricity generation project can be evaluated
by various methods, but LCOE is the most frequently used when comparing
electricity generation technologies or considering grid parities for emerging
technologies [99 - 101].
LCOE is basically the constant unit cost (per kWh or MWh) of a payment
stream that has the same present value as the total cost of building and operating a
generating plant over its life [99].
LCOE Formula For PV Cost
The basic LCOE formula reckoning the energy cost of a system is the
following:
1
1
( )(1 )
(1 )(1 )
N
nn
nN
nn
OPEX I CC LrLCOE Total Electricity d
r
�
�
� �� �
��� �
�
�
�
Where:
C is a cost of the system; L is a land cost; OPEX is operation and maintenance cost; I
is insurance cost; r is discount rate; n is determined year; N is lifetime of the system;
d is annual degredation rate [103].
2.1.7.1. Factors to compute LCOE of 1 MW PV in Karapinar ESIZ
1. Initial Investment
Initial investment constitutes the cost of the system, C, and the cost of the
required land, L.
a. Cost of a PV System, C
Cost of a PV system constitutes from the module costs and BoS costs.

68
i. Module Cost
For the computation of total module cost, module price proposal is taken
from and checked with the companies which are currently operating in Turkey on PV
investments. Pursuant to the proposal taken module price is calculated from 0.59
€/Wp unit price. Having 3572 modules each have 280 Wp, total amount of module
price is found as 796,627 $ (0.59 €/Wp ×3572×280×1.35$/€) [102].
Under favour of investment incentive certificate, solar energy projects are
exempt from customs duty and value added tax [104].
With the intention of avoidance from duplication, the costs reasoned by
mounting systems, erection of PV modules and installation of PV modules are
considered in commission part separately.
ii. Balance of System (BoS) Costs
BoS components include all non-module costs of a solar PV installation,
including mainly wiring, inverter and land [103].
Inverter cost proposal is also taken from Turkish Companies, as mentioned in
module price part. Accordingly, the unit cost of 125 kW inverter is 33,750 $
(25,000€×1.35$/€) [102]. The system will need eight 125 kW – inverters to be
changed every 10 years [103]. Hereupon, on the brink of 8 in the launching, 8 in 10th
year and 8 in 20th year afterwards, there will totally be 24 inverters needed. As
technology matures, the inverter price is not supposed to increase, rather supposed to
be decreased. This study assumes the decrease in the inverter price will compensate
the inflate rate. Therefore, the inverter price is assumed to stay as it is. By this way,
the NPV value computed for the inverters is 537,517$.
Some part of remaining part of BoS cost excluding inverters and land is
negligible because wiring is made by the Ministry of Science, Industry and
Technology as an advantage of ESIZ. Therefore, the cost of the wiring and the
environmental effects in producing its primary products were assumed to be
irrevelant and negligible, respectively.
b. Land Cost, L
According to the advantages Karapınar ESIZ serves for, the infrastructure of
the field is prepared by the Ministry of Science, Industry and Technology of the
Republic of Turkey. The investor is only responsible for the payment of current

69
value of the loan of the land determined by the Ministry of Finance of the Republic
of Turkey [105].
The appropriate adequate pay amount for the determined site is 15 TL/m2
yearly according to the verbal information gathered from the officers of the Ministry
of Finance of the Republic of Turkey which is solely responsible authority to adjust
adequate pay amount. Although this value is quite outsized, this study takes this
declared value, hence, the adequate pay amount is taken as 15 TL/m2 annually. The
Exchange Rate designated by the Central Bank of the Republic of Turkey 1 $
corresponds 2 TL in 04/10/2013.
Taking into account 1 TL corresponds 0.5 $, the lifetime of the system is 30
years, discount rate is 5% and total necessary area is 10,098 m2, the NPV of the total
landcost is 1,239,968 $.
2. Annual Costs
a. Operation and Maintanance Costs, OPEX
Operation and maintanance costs of PV PP are comperatively low owing to
its not consuming fuel which is a major item for OPEX. Moreover, because of not
having tracking part by the system taken into account for this study, OPEX only
consists of regular cleaning, monitoring of performance and inverter replacement
approximately every 10 years [106 – 108].
This study, based on the average of reported values, considers annual
operation and maintenance cost as 1.5% of the total cost of the system, C [42], [109-
113]. Consequently, the OPEX of the system is reckoned as 20,012 $.
b. Insurance Costs
Owing to the relatively high technological risks associated with PV system, in
contrast with conventional ones, an insurance policy should be adopted. The annual
insurance rate for PV systems is foreseen as 0.25% [107] of the capital cost of the
system, C. So the insurance cost of the system is 3,336 $.

70
3. Electricity Production
Electricity production values of the system is referenced to the part where
electricity production is calculated for this study. The values gathered from
electricity production part are exposed to the division of discount rate in order to
identify net present value of the electricity production which is compelled by LCOE
method. The values computed is 23,011 MWh.
4. Financial Factors
a. Discount Rate
Taking into account the time value of money as well as the risk of the
investment, discount rate is one of the most important assumptions on the input
parameters to the LCOE.
According to the information taken from the Central Bank of the Republic,
the interest rate of Turkey is about 5% [114]. Similar studies also use the same
discount rate [115].
b. Lifetime of the System
PV modules, the key component of PV systems, are warranted for a duration
in the range 25–30 years by most producers [101], [111], [116-118]. The practical
lifetime of the silicon-made PV modules is expected to be at least 30 years [119 -
120]. In parallel with the mentioned information, the lifetime assumption for this
study is 30 years.
5. Additional Expenditures and Benefits
a. Carbon Trading
PV systems are included in the carbon trading mechanism. Hence, each tones
of CO2 emission reduction is awarded with certificates which is saleable in
appropriate markets. The carbon emission price is taken as 2.4 €/tones of CO2 that is
equal to the actual average price (1.8-3€) in Turkish voluntary carbon market [121].

71
The CO2 emission reduction potential, 0.6031 tCO2/MWh, of the studied PV
system is computed in CO2 reduction comparison part of this study. The electricity
production amount of the studied PV system is also reckoned in the electricity
production part of the study. So, the amount the system will gain from the carbon
trading is calculated as 87,733$(0.6031 tCO2/MWh×44,898.25 MWh×1.35$/€×2.4€).
b. Commissioning
As seen details in the next subtitle, labour cost of commission of 1 MW PV
PP is 4,500$ (2 workers×150 days×15 $/day).
c. Decommissioning
Since decommissioning will be applied at 31st year of the project, the NPV of
the value is taken. This amount is 992$.
d. Ground Mounting
Another spending item for commissioning is PV module erection materials.
According to the calculations made in PV mounting part of this study, the cost of
aluminium and steel to be used for mounting are 41,755$ and 8,383$, respectively.
2.1.7.2. Total Cost and LCOE
Designated total cost and LCOE are compiled in Table 38.

72
Table 38 Monetary values of the system design Description Unit Quantity
Module Price
$
796,627
NPV of Inverter Price 537,517
L 1,239,968
C 1,334,144
OPEX 20,012
I 3,336
Carbon Trade Gain 87,733
Commissioning+Decommissioning 5,492
Ground Mounting 50,139
NPV of the Total Cost 2,565,357
NPV of the Total Cost (excluding land) 1,325,389
NPV of the Total Electricity Production MWh 23,011
LCOE (including Land cost) $/MWh
111.49
LCOE (excluding Land cost) 57.60

73
Ta
ble
39 E
xcel
l she
et re
veal
ing
mon
etar
y ca
lcul
atio
ns o
f 1 M
W P
V P
P in
Kar
apin
ar E
SIZ
Total
($)
796.6
2753
7.517
1334
144,2
1239
968
2001
2,16
3335
,3687
733,1
5602
2.565
.357
23.01
111
1,485
1006
Time (
years
)M
odule
Cos
t ($)I
nvert
er ($)
C ($)
L ($)
OPEX
($)I
($)
r Ca
rbon T
rading
($)
Comm
ission
ing ($
)De
comm
ission
ing ($
)Gr
ound
Mou
nting
($)T
otal C
ost ($
)El.
Prod
. (NPV
)LC
OE ($
/MW
h)0
796.6
2727
0.000
1.334
.144
7573
520
012,1
633
35,36
0,05
8773
3,156
0245
0099
1,617
6371
5013
8,91
111,4
8510
061
7212
8,57
0,05
1426
581,8
12
6869
3,88
0,05
1358
567,8
233
6542
2,74
0,05
1293
796,4
854
6230
7,37
0,05
1232
113,1
975
5934
0,35
0,05
1173
370,7
346
5651
4,62
0,05
1117
428,8
887
5382
3,45
0,05
1064
154,1
358
5126
0,43
0,05
1013
419,3
29
4881
9,46
0,05
9651
03,34
7310
1657
56,58
4649
4,72
0,05
9190
90,89
611
4428
0,69
0,05
8752
72,14
3412
4217
2,08
0,05
8335
42,50
1913
4016
3,89
0,05
7938
02,37
114
3825
1,32
0,05
7559
56,89
7915
3642
9,83
0,05
7199
15,75
2716
3469
5,08
0,05
6855
92,91
2217
3304
2,93
0,05
6529
06,45
3818
3146
9,46
0,05
6205
31,79
9619
2997
0,91
0,05
5921
34,33
820
1017
60,16
2854
3,72
0,05
5639
03,62
8321
2718
4,50,0
553
7018
,8516
2225
890
0,05
5114
15,83
8523
2465
7,14
0,05
4870
33,47
9824
2348
2,99
0,05
4638
13,57
8825
2236
4,76
0,05
4422
90,72
9226
2129
9,77
0,05
4206
42,10
6927
2028
5,49
0,05
4005
87,49
3728
1931
9,52
0,05
3814
89,00
7929
1839
9,54
0,05
3633
01,06
5430
1752
3,37
0,05
3459
80,25
4599
1,617
6371
LCOE
OF P
V (1
MW
)

74
2.1.8. PV Commissioning and Decommissioning
PV system for 4800 MW installed power has commissioning and
decommissioning periods which must be taken into account.
In this part of the study the time and cost for commissioning and
decommissioning of PV system having cumulative 4800 MW installed power by
addressing the calculation to be made for 1 MW one.
According to the calculations made previously, 1 MW PV PP needs 3572 PV
modules having 280 Wp. Owing to direct correlation, total amount of modules
needed for 4800 MW PV PP is designated as 17,145,600 (3572×4,800).
One more point to be taken into consideration is 4800 MW installed power
PV PP’s being constituted by 4800 1 MW PV PP’s.
Here are the assumptions made for the computation:
- Each enterprise having 1 MW PV PP employs 2 workers.
- Each worker is capable of commission / decommission 12 panels in a day.
- These workers will be seasonal workers.
- Gender of these workers will be male.
Thus, each enterprise having 2 workers has an ability to commission /
decommission 40 panels in a day.
Each enterprises has to pay 15 $ / day salary for each worker. This value is
stemming from the seasonal worker prices announced by TURKSTAT [122].
For 4800 enterprises 9600 workers to be appointed in commissioning /
decommissioning processes are needed.
Moreover, the commissioning process will be applied in the beginning of the
project. On the other hand, the decommissioning process is applied when the lifetime
of the system ends.
Gathering all the information and assumptions, the commissioning and
decommissioning requires 150 days (3572/24) for each. The salary to be paid for the
commissioning will be 21.60 million $ (9600×150×15$). The NPV of the cost to be
paid for the decommissioning is 4.76 million $ ([9600×150×15$]/(1+0.05)31).
As a result, the first half of the first year of the investment is reserved for the
commission. In addition, there will approximately be half year need at the end of the
project to be allocated for decommissioning.
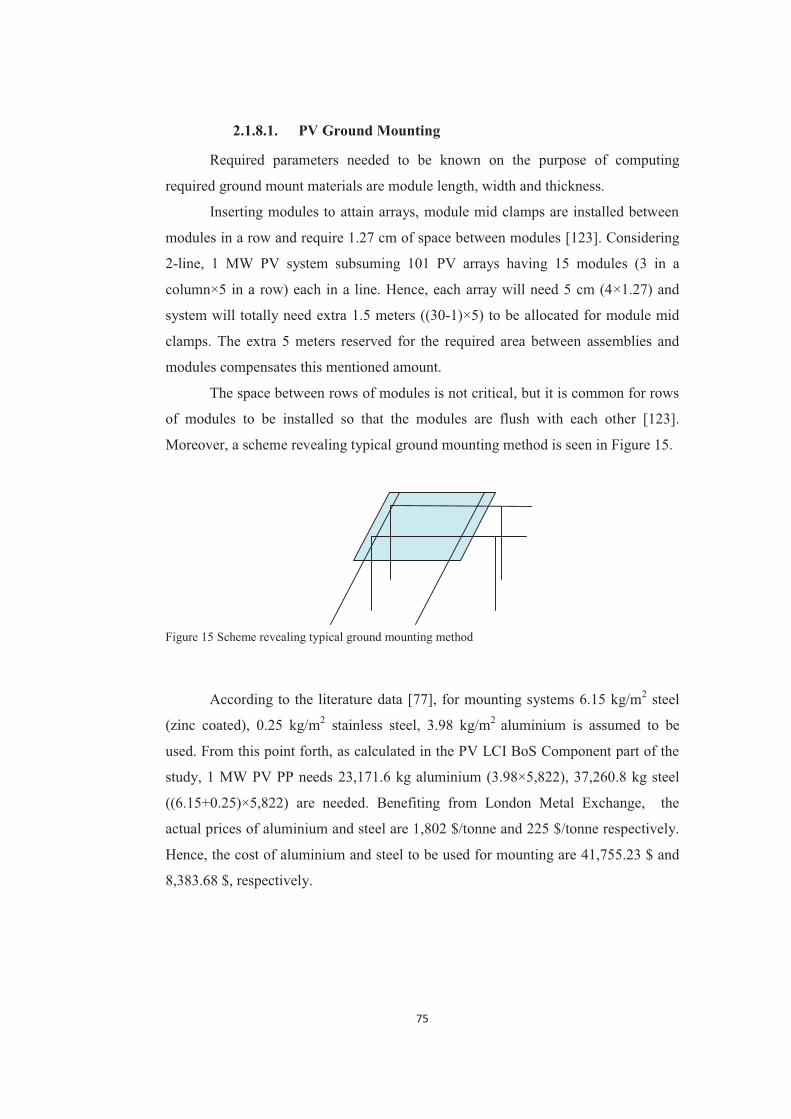
75
2.1.8.1. PV Ground Mounting
Required parameters needed to be known on the purpose of computing
required ground mount materials are module length, width and thickness.
Inserting modules to attain arrays, module mid clamps are installed between
modules in a row and require 1.27 cm of space between modules [123]. Considering
2-line, 1 MW PV system subsuming 101 PV arrays having 15 modules (3 in a
column×5 in a row) each in a line. Hence, each array will need 5 cm (4×1.27) and
system will totally need extra 1.5 meters ((30-1)×5) to be allocated for module mid
clamps. The extra 5 meters reserved for the required area between assemblies and
modules compensates this mentioned amount.
The space between rows of modules is not critical, but it is common for rows
of modules to be installed so that the modules are flush with each other [123].
Moreover, a scheme revealing typical ground mounting method is seen in Figure 15.
Figure 15 Scheme revealing typical ground mounting method
According to the literature data [77], for mounting systems 6.15 kg/m2 steel
(zinc coated), 0.25 kg/m2 stainless steel, 3.98 kg/m2 aluminium is assumed to be
used. From this point forth, as calculated in the PV LCI BoS Component part of the
study, 1 MW PV PP needs 23,171.6 kg aluminium (3.98×5,822), 37,260.8 kg steel
((6.15+0.25)×5,822) are needed. Benefiting from London Metal Exchange, the
actual prices of aluminium and steel are 1,802 $/tonne and 225 $/tonne respectively.
Hence, the cost of aluminium and steel to be used for mounting are 41,755.23 $ and
8,383.68 $, respectively.
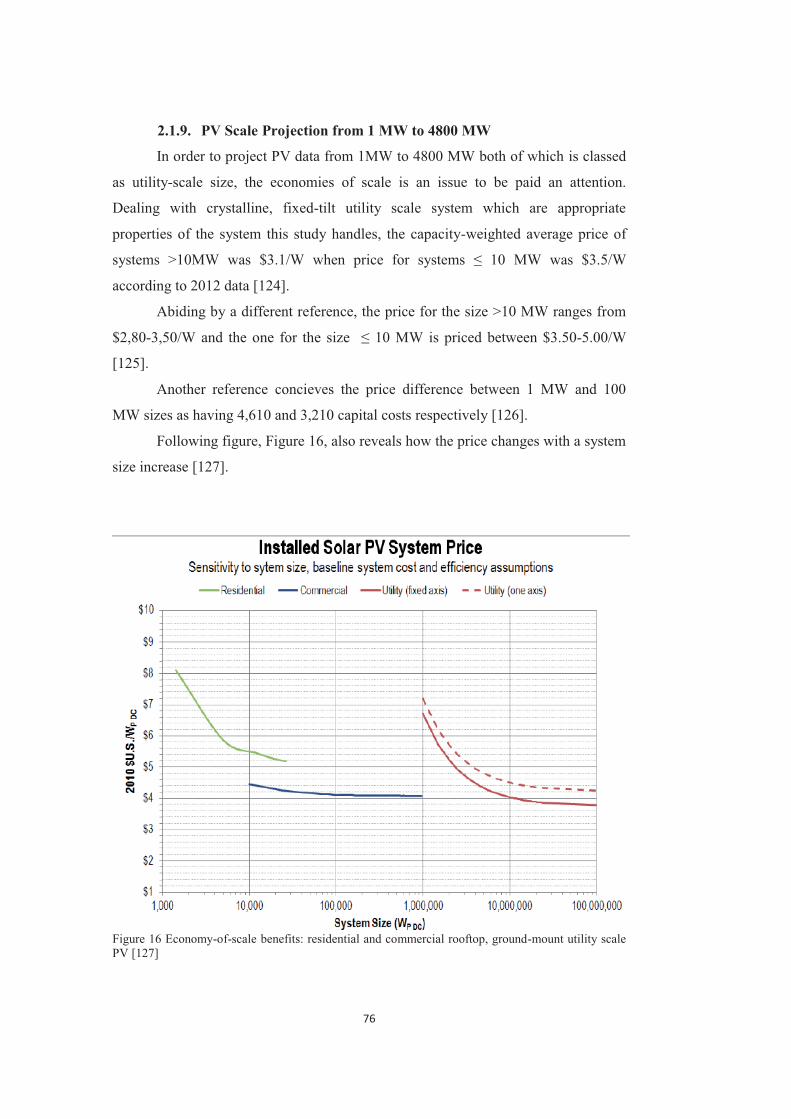
76
2.1.9. PV Scale Projection from 1 MW to 4800 MW
In order to project PV data from 1MW to 4800 MW both of which is classed
as utility-scale size, the economies of scale is an issue to be paid an attention.
Dealing with crystalline, fixed-tilt utility scale system which are appropriate
properties of the system this study handles, the capacity-weighted average price of
systems >10MW was $3.1/W when price for systems ≤ 10 MW was $3.5/W
according to 2012 data [124].
Abiding by a different reference, the price for the size >10 MW ranges from
$2,80-3,50/W and the one for the size ≤ 10 MW is priced between $3.50-5.00/W
[125].
Another reference concieves the price difference between 1 MW and 100
MW sizes as having 4,610 and 3,210 capital costs respectively [126].
Following figure, Figure 16, also reveals how the price changes with a system
size increase [127].
Figure 16 Economy-of-scale benefits: residential and commercial rooftop, ground-mount utility scale PV [127]

77
While projecting 1 MW PV to 4800 MW PV, the assumption derived from
the aforementioned information can be constituted as multiplication of system price
of 1MW with 3.1/3.5 ratio as the most conservative conjecture.
Based upon 1 MW PV PP cost designed in this study which is 2,565,357 $ for
total cost including landing and 1,366,454 $ excluding land cost. Projecting these
values to 4800 MW with an aforementioned ratio, the results are attained as 10.91
Billion $ (2,565,357×4800×3.1/3.5) for the total cost including land cost and 5.63
Billion $ (1,325,389×4800×3.1/3.5) for the total cost excluding land cost.
Furthermore, electricity projection is directly projected by multiplying
electricity production of 1 MW PV PP with 4800. Then, the electricity amount to be
produced by PV PPs having 4800 MW cumulative is 215,510 GWh (44.898
GWh×4800) which equals to 215.51 TWh.
As done previously, so as to take electricity production into account its net
present value should be taken. Consequently, it is better to multiply annual electricity
productions year by year and sum them up. That is the way how the required
electricity production value by LCOE is acquired. This reveals that NPV of
cumulative electricity production of 4800 MW PV PP’s are also 110.45 TWh
(4800×23.011) which differs from the total electricity production amount.
LCOE of 4800 MW is determined as 98.74 $/MWh (10,906,432,046 /
110,452,800) for the total cost. In addition, the LCOE for the cost excluding land
cost is 51.02 $/MWh. (5,634,796,663 / 110,452,800).
The results for PV PPs having cumulative 4800 MW installed power is given
in Table 40.
Table 40 Features of 4800 MW PV PPs Description Quantity Installed Power 4800 MW Project Duration 31 years Lifetime 30 years Total area needed 48.47 km2 Electricity Production 215.51 TWh NPV of Electricity Production 110.45 TWh Total cost (w land cost) 10.91 Billion $ Total cost (w/o land cost) 5.63 Billion $ LCOE (w land cost) 98.74 $/MWh LCOE (w/o land cost) 51.02 $/MWh

78
Moreover, LCI of 4800 MW PV PPs revealing the Material and energy use
during LCA of system manufacturing is given in Table 70 in order to avoid from
duplication.
2.2. Case Study 2 – 4800 MW NUKE PP to be established in Mersin –
Akkuyu
Together with having no currently established and operating NUKE PP,
Turkey is about the investment of 2 NUKE PPs, one in the South of Turkey on which
studied through this thesis and the other is in the North part of Turkey, namely Sinop
Province. Akkuyu NUKE PP is the initial one entering an investment period owing
to an Intergovernmental Aggreement signed in 12 May 2010 between Russian and
Turkish governments.
This part of the study analyses NUKE PP to be established in Mersin
Akkuyu. During monitoring and assessment process of NUKE PP, literature
information gathered are used and results are derived from this knowledge. The weld
pool for this part of the study is accumulated from sources like EIA of PP;
declerations and statements by project contractor company, namely Rosatom
(Росатом); statement made by government authorities such as the Minister,
Undersecretary etc.; studies of internationally accepted instutitions and academic
studies. The assumption at this point is a trust to mentioned information weld pool.
The followings are the devastating information gathered from information
weld pool concerning NUKE PP in Akkuyu related to this study:
Project has 4 years preperation and 30 years decomissioning stage [128].
The installed power of the PP is 4800 MW;
The reactors have VVER 1200 (AER 2006) technology;
The system have 4 reactors each having 1200 MW installed power;
Total worth of the construction part of the Project is foreseen between 20-25
billion USD excluding VAT by the related Authorities recent declarations [29],
128 - 130].
Yearly operating time is 7800 hours [131].
Capacity factor is 90% [131 - 132].
After all the reactors are taken into operation yearly electricity production will be
33.70 TWh (4800×0.90×7800) [131].

79
Construction periods of the units of PP covers the time between 2016-2024.
First unit will start its operation 7 years after having all necessary permits and
approvals for launching the construction. Consequently, the electiricity
production will most probably start at the end of 2020. Remaining units will start
operation every other year in a row [133].
The designed lifetime for the units are 60 years [45].
The management method of the Project is Built-Own-Operate [45].
The Project site is located in the maritime province of Mersin. Detailed adress is
Gulnar District, Buyukeceli Municipality.
Nuclear fuel is uraniumdioxide which has been enriched via U-235 isotope with
5% enrichment.
The weight of uranium for each fuel assemblies is 534 kg while the nuclear
reactor has 163 fuel assemblies, 312 fuel rods and consequently 50,856 emerged
fuel sticks [134].
Total uranium dioxide included by them are 87,042 kg. (534kg×163 fuel
assembly)
Taking 60 years life time an account total 10,080 used fuel assemblies or
approximately 5,382 tonnes of used uranium dioxide are brought about.
The flowrate of cooling water for each unit will be totally 220,000 m3/hours. The
cooling water will be provided from the Mediterrenean. Taking into account four
units, the total 880,000 m3/hours [131].
The neccessary flowrate for the requirements of drinking and using waters are
450 m3/days [135].
Approximate mean flowrate of industrial water supply system is 342 m3/days
[131].
Every power unit is constituted from a reactor and turbine building.
1,023 ha (10,230,000m2) public domain is allocated for the Project site.
Moreover 35 ha extra area is reserved for the living space and 125 ha for sea
embankment. Hence, total 1,183 ha area is necessary for the Project [131].
The total volume of excavation waste is foreseen as 12.6 million m3, 4.8 million
m3 of this waste will be used as filling material; 3.3 million m3 of which is for sea
embankment and 1.5 million m3 of which is for earth embankment. The remaning
7.8 million m3 will be stored on the fields allocated by the Ministry of Forestry
and Water Works of the Republic of Turkey [131].

80
In the statistics brought about by TURKSTAT, Mersin Province has 212 L/day
per capita wastewater production [133]. Pursuant to this assumption, the part of
employess working in the contruction field but not staying there will have totally
461 m3 of domestic wastewater production. (5,800 people×0.212 m3/capita
days×9/24 hours) (9 hours amount comes from 63th Article of 4857 numbered
Labor Law.)
For 6,700 remaining employees who will not only be working but also staying in
Wellness Center, total wastewater production is 1,420 m3/days. (6700
people×0.212 m3/capita day). Consequently, total wastewater consumption of the
mentioned NUKE PP is 1,881 m3/days [131].
The fresh water requirement of operation term of the abovementioned PP will be
507 m3/hours. This amount will be provided from desalination method by using
the Mediterranean [131].
The tap water requirement which is 92 m3/ hours will be provided from Babadil
wells [131].
The daily domestic solid waste production per capita is 1.21 kg according to
TURKSTAT statistics [137]. 5800 people will then have 2,631.25 kg daily
domestic solid waste (5,800 people×1.21 kg/capita daily×9/24 hours). Remaining
6,700 people will produce 8,107 kg/days (6,700 people×1.21 kg/capita days).
Then the total amount of domestic solid waste is 10,738.25 kg/day.
For the construction 516 trees will be uprooted [131].
In the construction period, more than 2 million m3 cement and 500 thousand
tonnes of steel will be used [131].
2.2.1. NUKE Material Use
The material use and output emissions constituting LCI for 4800 MW NUKE
PP are compiled in this part of the study. The major method used to form this LCI is
supplied with literature informations and their transpositions.
Initially, benefitting from per kWh electiricity literature data [138] given in
the Table 27, total approximate life cycle CO2 (fossil); CH4 (fossil); NOx; NMVOC;
SO2; PM 2.5-10; PM 2.5; Carbon-14; Iodine-129; Radon-222 values are identified.

81
Table 41 Unit values of parameters for LCI key emissions of NUKE PP Parameter Unit Quantity
CO2 (fossil)
kg/kWh
5.91E-3
CH4 (fossil) 1.02E-5
NOx 3.05E-5
NMVOC 7.35E-6
SO2 2.74E-5
PM 2.5-10 2.39E-6
PM 2.5 4.68E-6
Carbon-14
kBq/kWh
5.09E-2
Iodine-129 5.29E-5
Radon-222 776
Then, taking into consideration 33,696,000,000 kWh annual electricity
production potential, the values transposed to the study is as given in Table 42. Table 42 LCI emissions of 4800 MW NUKE PP Parameter Unit Quantity
CO2 (fossil)
kg/year
199,143,360
CH4 (fossil) 343,699
NOx 1,027,728
NMVOC 247,666
SO2 923,270
PM 2,5-10 80,533
PM 2,5 157,697
Carbon-14 kBq/year 1.72E+09
Iodine-129 1,782,518
Radon-222 2.62E+13

82
Moreover, material use, water consumption, waste generation amounts
derived from calculations and references stemming from literature are compiled in
the following Table 43.
Table 43 Material use, water consumption, waste generation of LCI of 4800 MW NUKE PP established in Mersin Akkuyu (just for the construction period) Description Unit Quantity
Uranium fuel sticks amount 50,586
Uranium dioxide kg 5,382,000
Cooling water use
m3/hours
880,000
Drinking and using water use 450
Industrial water use 342
Excavation waste m3 12,600,000
Wastewater consumption m3/days 1,881
Freshwater requirement m3/hours 507
Tap water requirement m3/days 92
Domestic solid waste kg/day 10,738.25
Uprooted trees unit 516
Cement m3 2,000,000
Steel kg 500,000,000
2.2.2. LCOE of 4800 MW NUKE PP in Mersin Akkuyu
The formula identified for the NUKE so as to compute LCOE is [139];
� �
� �
&1
1
T
tt
T
tt
Investment O M Decommissioningr
LCOE Electricityr
� � �! "
�! "# $�
�
�
�

83
The components of the LCOE formula and the data used for this study are the
followings:
1. Discount Rate
The discount rate is assumed as 5% as the same with PV.
2. Investment Cost
As the mean quantity of what is declared by the authorities as a cost, the
investment cost of the Mersin Akkuyu NUKE PP is assumed as 22.5 billion $
excluding VAT. According to current VAT rates designated by Revenue
Administration, assuming VAT is taken as 1% of the exact investment cost is 22.5
billion $ [140]. At a 5% discount rate, the ratio of the investment cost is assumed as
60% of the total cost [139].
The investment cost including VAT is then 22.725 billion $.
3. Operation and Maintanance (O&M)
O&M cost is assumed as 24% of the total cost [139]. Consequently, the O&M
is calculated as 5.478 billion $.
4. Decommissioning
The decomission made after the operation life time of the systems end has a
cost being 15% of the investment cost [139]. So the cost to be spent for
decommissioning is 3.409 billion $. The NPV of the mentioned cost is 101,616,824 $
5. Fuel Cycle Cost
The fuel cycle cost is assumed as 16% of the total cost [139]. Consequently,
the designated fuel cycle cost is 3.652 billion $.
6. Land Cost
As previously described the required land for the establishment of the project
is 1,183 ha which is equal to 11.83 km2.
The appropriate adequate pay amount for the determined site is 0.83 TL/m2
yearly according to the verbal information gathered from the officers of the Ministry

84
of Finance of the Republic of Turkey which is solely responsible authority to adjust
adequate pay amount. This study takes thus declared value, hence, the adequate pay
amount for this study is assumed as 0.83 TL/m2 annually. The Exchange Rate
designated by the Central Bank of the Republic of Turkey 1 $ corresponds 2 TL in
04/10/2013.
Taking into account 1TL corresponds 0,5 $, the duration of the project is 101
years, discount rate is 5% and total necessary area is 1183 ha (11,83 km2), the NPV
of the total landcost is 104,779,847 $.
7. Electricity Production
Taking into account 4 years preperation time and 7 years construction time
the first unit launches its electricity production process in 12th year of the project,
then the other units will be taken into operation every other year in a row. Electricity
production process will have been maintained during 60 years.
The NPV of the electiricty production is calculated by bearing in mind
abovementioned information. The result is 347,363,212 MWh.
Total Cost and LCOE
Designated total cost and LCOE are compiled in Table 44.
Table 44 Designated total cost and LCOE of NUKE Description Unit Quantity
Investment
$
22.725 billion
Decomissioning (cost) 3.409 billion
Decommissioning (NPV) 101.617 million
O&M 5.478 billion
Fuel Cycle 3.652 billion
L 104.780 million
NPV of the Total Cost 32.062 billion
NPV of the Total Electricity Production MWh 347,360,213
LCOE $/MWh 92.30
P.S. These calculations do not include opportunity costs and externality costs, i.e. damage costs for nuclear plants cost from radioactive wastes and associated risks.

85
2.3. Mutual Subjects
2.3.1. PV vs NUKE: CO2 Emission Reduction Potentials
As being major actor for the formation of a green house effect which is the
fundamental reason of climate change threat, CO2 means more than a gas emitted by
the technology and/or because of manufacturing of a technology. This situation
paves the way for CO2 emission comparison between technology options being
necessity. Moreover, since solar energy is in the scope of carbon trading, the
recknoning made in this part of the study provide an input for carbon trading cost
calculations.
So as to examine and compare the effectiveness of a nuclear power plant and
PV power plant in reducing green house gas emissions in Turkey, the national
emission factor12 should be calculated in conformity with the international
methodology. Since the level of greenhouse gas emissions other than CO2, such as
CH4 and N2O, is negligibly small, computations are focused on CO2 emission
reduction.
1. Methodology to Calculate an Emission Factor for Turkey
UNFCCC’s latest methodological tool namely “Tool to Calculate the
Emission Factor for an Electricity System” is a reference document to compute
Turkey’s emission factor for electricity generation [141]. With reference to the above
mentioned tool, Operating Margin (OM)13 and Build Margin (BM)14 have to be
determined and integrated so as to designate an emission factor. Consequently, the
computation method includes the determination of OM and BM and their integration
by relevant formula to be determined later on this study [141]. Incidentally, during
the calculation process, the support was taken from EDAM’s study [142] which has
done the relevant work previously.
On the occasion of the Turkish transmission system’s being interconnected,
the estimation of OM and BM emission factors are based on the definition of the
12 The amount emission per unit electricity generation 13 OM is the emission factor that refers to the group of existing power plants whose current electricity generation would be affected by the project activity. 14 BM is the emission factor that refers to the group of prospective power plants whose construction and future operation would be affected by the proposed CDM project activity.

86
Turkish electricity network as one single interconnected system and grid power
plants serving the system.
a. Operating Margin Emission Factor
There are four alternative methods available to calculate the OM emission
factor: “Simple OM”; “Simple adjusted OM”; “Dispatch data analysis OM”; and
“Average OM”.
Because of not being able to have plant-specific data which belong to power
plants connected to the grid, “Simple adjusted OM”, “Dispatch data analysis OM”
and “Average OM” calculation methods are eliminated. Hence, “Simple OM”
method leaves in wake of that selection. This method, based on the total net
electricity generation of all power plants serving the system, is applicable when low
cost and/or must run resources constitute, as an average of the five most recent years,
less than 50 percent of the total generation for the grid. The only major low operating
cost and must run resource in Turkey is hydropower because the share of all other
renewable resources is negligibly small. As seen in a Table 45, the share of low-cost
/ must run sources do not exceed 50% for the most recent 5 years [142].
Table 45 Share of hydroelectric production in Turkey, 2006 – 2010 [142] 2006 2007 2008 2009 2010
Turkey’s Gross Electricity
Production (GWh)
176,300 191,558 198,418 194,813 211,208
Electricity Production from
Hydro (GWh)
44,244 35,851 33,270 35,958 51,796
Total Share of Hydro (%) 25 19 17 18 25
The way to calculate emission factor via simple OM method is based on the
calculation of the generation weighted average CO2 emissions per unit net electricity
generation (tCO2 /MWh) of all generating power plants serving the system, not
including low-cost/must run power plants/units.
The formula given below is applied for computing EFgrid, OMsimple, y15 with
respect to the aforementioned tool:
15 Simple operating margin carbondioxide emission factor in year y (tCO2/MWh)
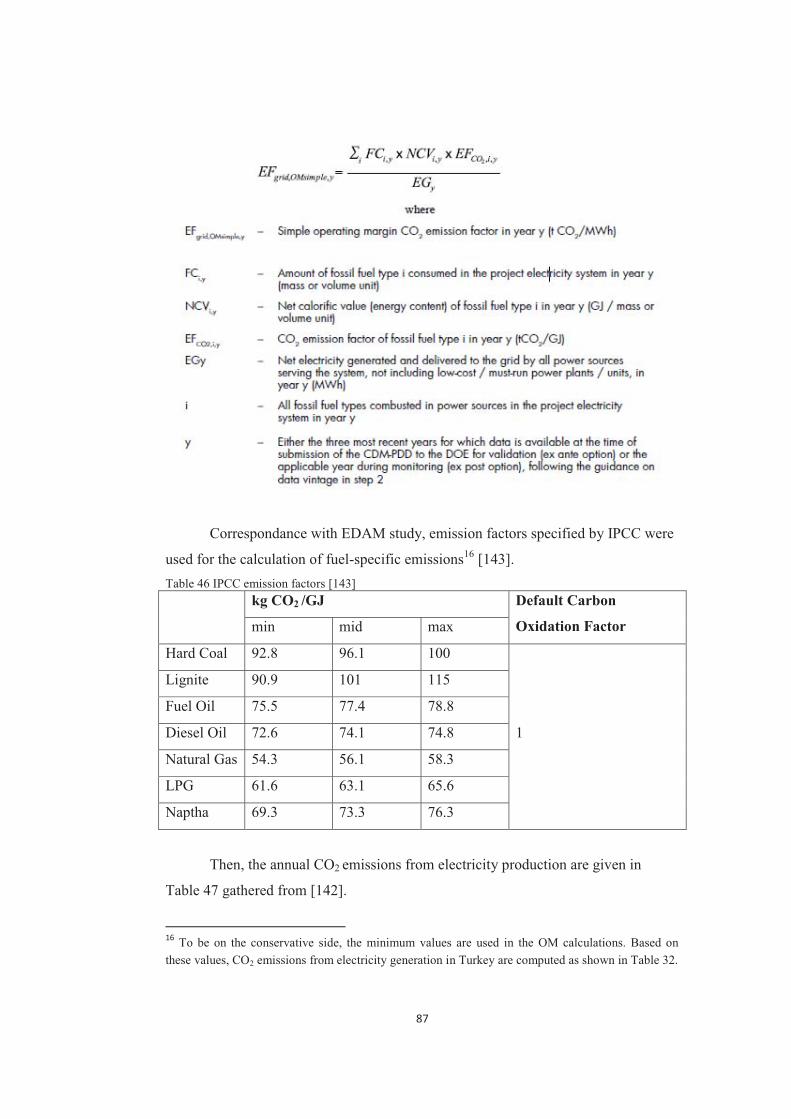
87
Correspondance with EDAM study, emission factors specified by IPCC were
used for the calculation of fuel-specific emissions16 [143]. Table 46 IPCC emission factors [143] kg CO2 /GJ Default Carbon
Oxidation Factor min mid max
Hard Coal 92.8 96.1 100
1
Lignite 90.9 101 115
Fuel Oil 75.5 77.4 78.8
Diesel Oil 72.6 74.1 74.8
Natural Gas 54.3 56.1 58.3
LPG 61.6 63.1 65.6
Naptha 69.3 73.3 76.3
Then, the annual CO2 emissions from electricity production are given in
Table 47 gathered from [142].
16 To be on the conservative side, the minimum values are used in the OM calculations. Based on these values, CO2 emissions from electricity generation in Turkey are computed as shown in Table 32.

88
Table 47 Annual CO2 emissions from electricity production [142] 2008 2009 2010
Annual CO2 Emissions from
Electricity Production (tCO2)
104,062,368 98,532,497 99,128,859
Net Electricity Production from Thermal Sources17 are also referred to [142]
and given in Table 48.
Table 48 Net electricity production from thermal sources [142] 2008 2009 2010
Gross Electricity Production [GWh]
(a)
198,418 194,813 211,208
Net Electricity Production [GWh] (b) 189,762 186,619 203,046
Net/Gross (c-a/b) 0.956 0.958 0.961
Gross Electricty Production from
Thermal Sources [GWh] (d)
163,919 156,583 155,370
Net Electricity Production from
Thermal Sources [GWh] (c*d)
156,768 149,998 149,366
Using the same relation for both overall electricity production and thermal
production is an approximation based on a rough assumption. Yet, obviously, such
an assumption results in a conservative estimation because the efficiency of thermal
plants is typically much lower than other plants. The OM emission factors are
calculated by dividing total emissions by net electricity production from thermal
sources as shown in Table 49 [142].
Table 49 OM emission factor for 2008 – 2010 [142] 2008 2009 2010
EFgrid, OMsimple, y [tCO2/MWh] 0.6638 0.6569 0.6637
17 As the efficiency factor from gross to net electricity for thermal resources is not known, the overall relation between overall gross and net electricity production is assumed to be the same for thermal production [142].

89
As the generation-weighted average of the figures between 2008 and 2010,
Turkey’s OM emission factor is computed as 0.6603 tCO2 / MWh [142].
b. Build Margin Emission Factor
Another essential parameter is build margin (BM) which is based on the
sample of the plants. There are two ways to compute BM as; the set of five power
units that have been built most recently, or the set of power capacity additions in the
electricity system that comprise 20% of the system generation (in MWh) and that
have been built most recently.
Among these two options, the sample group that comprises the larger annual
generation should be used. The data for recently built power plants is available in
TEİAŞ’s capacity projection reports documenting capacity, type of utility, fuel type
and date of commissioning. According to the data:
- The total annual generation of the five plants that have been built most recently is
5,271 GWh. This represents approximately 2.7% of the overall electricity generation
capacity in Turkey. Obviously, it is far below the 20 percent threshold proposed by
the methodology.
- The most recent capacity additions that comprise the 20% of the total system
generation corresponds to 42.1 TWh [142].
According to the methodology, BM Emission Factor EFBM is calculated as the
generation-weighted average emission factor of a simple of power plants for a
specific year, as follows:
As electricity production figures of some small facilities were not available,
annual electricity productions of these plants have been calculated as

90
In the calculation of EFgrid,,BM,y first FEEL,m,y values are computed by using
the formula
For this computation, the default efficiency values shown in Table 50 were
used [141].
Table 50 Default efficiency factors for power plants [141] Grid Power Plants
Generation technology Old units (before and in
2000)
New units (after 2000)
Coal
Subcritical 37% 39%
Supercritical - 45%
Ultra-supercritical - 50%
IGCC - 50%
FBS 35.5% -
CFBS 36.5% 40%
PFBS - 41.5%
Oil
Steam Turbine 37.5% 39%
Open Cycle 30% 39.5%
Combined Cycle 46% 46%

91
Table 50 (continued) Grid Power Plants
Generation technology Old units (before and in
2000)
New units (after 2000)
Natural Gas
Steam Turbine 37.5% 37.5%
Open Cycle 30% 39.5%
Combined Cycle 46% 60%
Accordingly, the BM emission factor is calculated as 0.4315 tCO2/MWh.
c. The Combined Margin Emission Factor
The combined margin emissions factor is calculated as follows:
i. For NUKE
The methodological tool namely “Tool to calculate the emission factos for an
electricity system” favors equal weighting for electricity generation projects other
than wind and solar power. Hence, the emission factor for nuclear is reckoned as:
EF grid, OM,y = 0.6603 × 0.5 + 0.4315 × 0.5 = 0.5459 tCO2/MWh
ii. For PV
The tool suggests the related values for PV projects as EFOM=0.75
EFBM=0.25. Consequently, the emission factor for PV is reckoned as:
EF grid, OM,y = 0.6603 × 0.75 + 0.4315 × 0.25 = 0.6031 tCO2/MWh

92
d. Total CO2 Emission Reduction by NUKE and PV
i. By NUKE
The assumption for a capacity factor of the Akkuyu Nuclear Power Plant is
taken as 85% [139]. Owing to that assumption, the total electricity power to be
generated by Akkuyu Nuclear Power Plant can be reckoned as 33,696,000
MWh/year ( = 4,800 MW × 7,800 hours/year × 0.85).
Table 51 Akkuyu Nuclear Power Plant electricity generation amounts Year Generation Amount
2019 1200 MW×7800 hours×0.90 = 8,424,000 MWh
2020 2400MW× 7800hours×0.90 = 16,848,000 MWh
2021 3600 MW×7800 hours×0.90=25,272,000 MWh
2022 4800 MW×7800 hours×0.90=33,696,000 MWh
2023 - 2086 33,696,000 MWh/year
2087 25,272,000 MWh
2088 16,848,000 MWh
2089 8,424,000 MWh
The total CO2 emission reduction to be achieved by the Akkuyu Nuclear
Power Plant is calculated and depicted in Table 52:
Table 52 The amount of CO2 emission reduction enables by the Akkuyu Nuclear Power Plant Year CO2 Emission Reduction Amount
2019 8,424,000 MWh×0.5459 tCO2 / MWh = 4,592,662 tCO2
2020 16,848,000 MWh × 0.5459 tCO2 / MWh = 9,197,323 tCO2
2021 25,272,000 MWh × 0.5459 tCO2 / MWh = 13,795,985 tCO2
2022 33,696,000 MWh × 0.5459 tCO2 / MWh = 18,394,646 tCO2
2023-2086 18,394,646 tCO2 / year
2087 25,272,000 MWh × 0.5459 tCO2 / MWh = 13,795,985 tCO2
2088 16,848,000 MWh × 0.5459 tCO2 / MWh = 9,197,323 tCO2
2089 8,424,000 MWh × 0.5459 tCO2 / MWh = 4,592,662 tCO2
Total 1,048,482,824 tCO2

93
ii. By PV
Cumulative electricity production of the PV system for the lifetime of the
study is 44,898.253 MWh. Hence, total CO2 emission reduction of 1 MW PV PP is
27,078.14 tCO2 (44,898.253 MWh × 0.6031 tCO2/MWh). The cumulative CO2
reduction potential of 4800 MW PV PPs is then 129,975,055 tCO2.
2.3.2. PV vs. NUKE Energy Payback and Profit Comparison
This part of the study compares payback time and profits of PV and NUKE
investments to examine the monetary feasbilities of the options. In order to make this
comparison, when the cost is worked out and how much investments reap a profit are
matched. While making these matches previously calculated data in this study are
utilized.
Before passing to the comparison part, the last but not the least, following
calculations stem from the assumption that PV and NUKE are in the same boat in the
eye of governmental policies.
1. When 4800 MW PV investment work out the cost and how much does it reap a
profit?
With respect to the outputs gathered during this study, PV PPs having
cumulative 4800 MW installed power having 30 years life time and 215.51 TWh
electricity production cost for 11.08 billion $.
In accordance with the legal arrangement covering PV investments, namely
Renewable Energy Law, during first 10 years government presents guarantee of
purchase to the electricity produced by PV PPs. This procurement price is 13.3 $
cents per kWh. Moreover, if the system have domestic equipments, this price
increases for 5 years in compliance with mentioned quantities in the aforementioned
regulation.
Taking notice of annual electricity production of 1 MW PV PP during its life
time, seen in the Table 13 as transferred from electricity production part of this
study, whole electricity produced during first 10 years are foreseen as purchased by
the goverment in paralel with government decision.

94
Table 53 PV electricity production for the first 10 years Year Electricity Production (kWh) Year Electricity Production (kWh)
1 1,497,910.900 6 1,497,461.581
2 1,497,821.025 7 1,497,371.733
3 1,497,731.156 8 1,497,281.891
4 1,497,641.292 9 1,497,192.054
5 1,497,551.434 10 1,497,102.222
With only domestic PV mounting production, feed-in-tariff proposal for this
system is 14.1 dollar cents per kWh (13.3 + 0.8) for the first 5 years. Next 5 years
have 13.3 dollar cents subsidy. Hence, if the electricity produced by the system is
sold to the government, the money earned is given in Table 54. Table 54 Money earned through feed-in-tariff system for the first ten years Year Money Earned with 5%
discount rate ($ cents) Year Money Earned with 5%
discount rate ($ cents)
1 20,114,803.51 6 14,861,804.20
2 19,155,806.31 7 14,153,249.99
3 18,242,530.44 8 13,478,476.95
4 17,372,796.08 9 12,835,874.52
5 16,544,527.35 10 12,223,908.92
Total 158,983,778.3 $ cents
The mentioned table reveals that if whole electricity is benefited from the
feed-in-tariff system of the government, total money earned becomes 1,589,837.78 $
with 5% discount rate.
After 10 years, electricity to be produced can be sold in an open market
unless government decides not to maintain its feed-in-tariff system. Important point
to emphasize is the possiblity of sustaining feed-in-tariff system applied to solar
energy with governmental decision in accordance with the Regulation.
At this point of the study, therefore, both options, maintanance of the feed-in-
tariff system and selling electricity to open market is assessed.

95
As the first option, namely maintanance of the feed-in-tariff system, the
benefit gained for the time period between 10th year and end of the Project lifetime
are summarised in Table 55. Table 55 Money earned through feed-in-tariff system after 10 years Time Electricity Produced (kWh) with 5% disc. Rate ($ cents)
10 158,983,778.3
11 149,701,239.6 11,641,119.51
12 149,692,257.5 11,086,115.28
13 149,683,276.0 10,557,571.53
14 149,674,295.0 10,054,226.74
15 149,665,314.5 9,574,879.51
16 149,656,334.6 9,118,385.73
17 149,647,355.2 8,683,655.84
18 149,638,376.4 8,269,652.21
19 149,629,398.1 7,875,386.70
20 149,620,420.3 7,499,918.26
21 149,611,443.1 7,142,350.78
22 149,602,466.4 6,801,830.65
23 149,593,490.3 6,477,545.28
24 149,584,514.7 6,168,720.60
25 149,575,539.6 5,874,619.50
26 149,566,565.1 5,594,540.02
27 149,557,591.1 5,327,813,67
28 149,548,617.6 5,073,803.81
29 149,539,644.7 4,831,904.17
30 149,530,672.3 4,601,537.39
Total Revenue 311,239,355.40 $ cents

96
Together with an assumption claiming all the electricity to be produced sold
at the moment the amount to be earned from the system is 3,112,394 $ if 5%
discount rate is conceived.
Multiplying the results with 4800 so as to acquire money earned via 4800
MW PV PPs, the related quantity becomes 14.94 billion $.
For the second option, this electricity produced is sold to Day Ahead
Electricity Market which is a system determined by the Ministry of Energy and
Natural Resources in order to purchase electricity produced. Together with no future
projections existed current average price in Day Ahead Electricity Market is about 15
krş18/kWh corresponding 7.5 $ cents per kWh.
Depending on many variables such as supply-demand relation, international
connections, the change in the share of energy options, fluctuations in dollar –
Turkish lira parity etc., the estimation of future electricity cost is a hard work and
does not give exact values. Consequently, future electricity prices are accepted in
three ways in this study as an electricity price with constant 7.5 $ cents per kWh, one
increasing with 1% inflation rate and one increasing with 1.5% inflation rate.
Taking into account three electricity price options, the quantity gained from
Day Ahead Electricity Market is summarised in the following Table 56.
Table 56 Total money earned with day ahead electricity market option Time
(yrs)
Electricity Produced (kWh)
Revenue ($ cents) with 5% discount rate
with no inflation rate
with 1% inflation rate
with 1.5% inflation rate
10 158,983,778.3
11 149,701,239.6 6,564,541.08 7,323,850.69 7,732,694.19
12 149,692,257.5 6,251,568.77 7,044,424.16 7,474,489.22
13 149,683,276.0 5,953,517.78 6,775,658.58 7,224,906.06
14 149,674,295.0 5,669,676.73 6,517,147.20 6,983,656.81
15 149,665,314.5 5,399,368.15 6,268,498.80 6,750,463.20
16 149,656,334.6 5,141,946.84 6,029,337.06 6,525,056.23
18 1 krş = 0,01 Turkish Lira
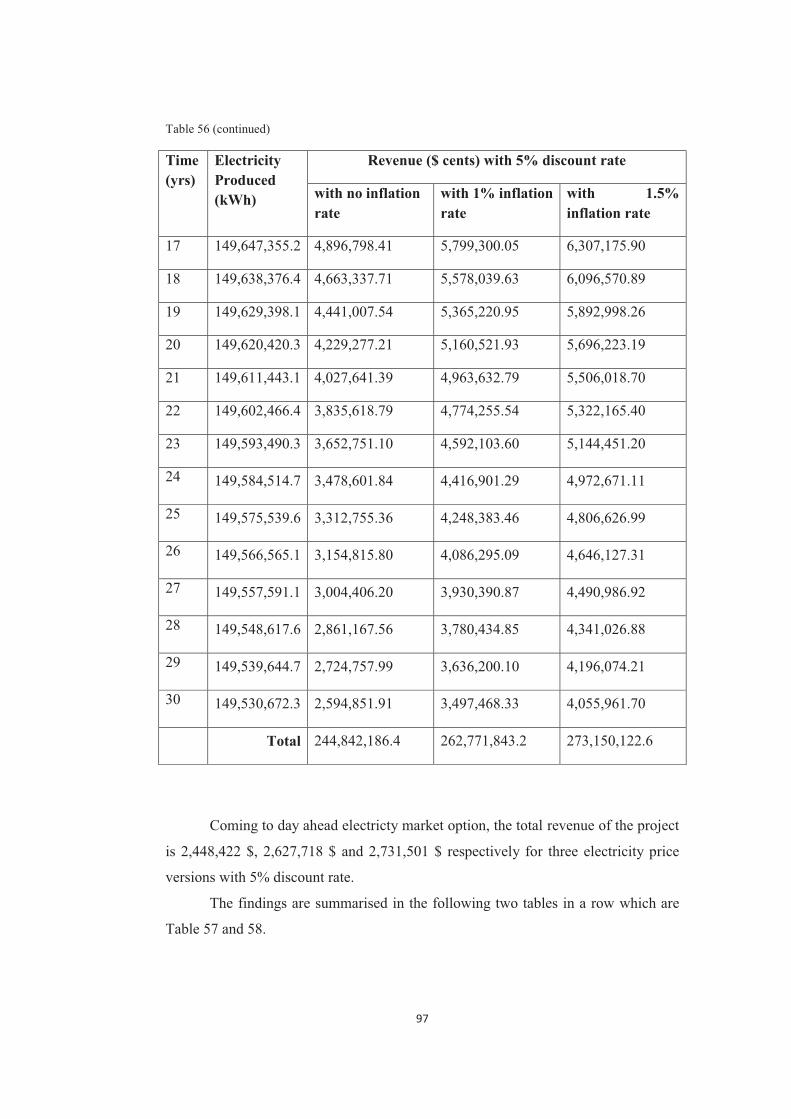
97
Table 56 (continued)
Time (yrs)
Electricity Produced (kWh)
Revenue ($ cents) with 5% discount rate
with no inflation rate
with 1% inflation rate
with 1.5% inflation rate
17 149,647,355.2 4,896,798.41 5,799,300.05 6,307,175.90
18 149,638,376.4 4,663,337.71 5,578,039.63 6,096,570.89
19 149,629,398.1 4,441,007.54 5,365,220.95 5,892,998.26
20 149,620,420.3 4,229,277.21 5,160,521.93 5,696,223.19
21 149,611,443.1 4,027,641.39 4,963,632.79 5,506,018.70
22 149,602,466.4 3,835,618.79 4,774,255.54 5,322,165.40
23 149,593,490.3 3,652,751.10 4,592,103.60 5,144,451.20
24 149,584,514.7 3,478,601.84 4,416,901.29 4,972,671.11
25 149,575,539.6 3,312,755.36 4,248,383.46 4,806,626.99
26 149,566,565.1 3,154,815.80 4,086,295.09 4,646,127.31
27 149,557,591.1 3,004,406.20 3,930,390.87 4,490,986.92
28 149,548,617.6 2,861,167.56 3,780,434.85 4,341,026.88
29 149,539,644.7 2,724,757.99 3,636,200.10 4,196,074.21
30 149,530,672.3 2,594,851.91 3,497,468.33 4,055,961.70
Total 244,842,186.4 262,771,843.2 273,150,122.6
Coming to day ahead electricty market option, the total revenue of the project
is 2,448,422 $, 2,627,718 $ and 2,731,501 $ respectively for three electricity price
versions with 5% discount rate.
The findings are summarised in the following two tables in a row which are
Table 57 and 58.

98
Table 57 Revenue from 1 MW PV PP based on the options Options Revenue with 5% discount rate ($)
No inflation With 1% inflation With 1.5% inflation
Feed-in tariff 3,112,394
Feed-in Tariff + Day Ahead Market
2,448,422 2,627,718 2,731,501
Table 58 Revenue projection to 4800 MW Options Revenue with 5% discount rate ($)
No inflation With 1% inflation With 1.5% inflation
Feed-in tariff 14,939,491,200
Feed-in Tariff + Day Ahead Market
11,752,425,600 12,613,046,400 13,111,204,800
Comparing with total cost of the system both including and excluding land
costs which are 2,606,422 $ and 1,366,454 $ respectively that are projected to 4800
MW as 11.08 Billion $ and 5.81 Billion $, the payback times changing with options
are calculated.
In order to determine payback time for PV PP initial invesment and yearly
gains remaining after expenditure are determined and the time when the Project start
to earn money after compensating its expenditure including initial investment gives
the payback time.
The following two tables are designed for the determination of a payback
time of 1MW PV PP for both options for the total cost both exluding and including
land costs.

99
Tabl
e 59
Pay
back
tabl
e of
1 M
W P
V P
P w
ithou
t lan
d co
st
Time (
years
)Inv
estm
ent ($
)El. P
roduc
tion (
kWh)
Opt 1
Op
t 2 no
inf
Opt 2
1% in
fOp
t 2 1.
5% in
fOpt
1Op
t 2 no
inf
Opt 2
1% in
fOp
t 2 1.
5% in
fOpt
1Op
t 2 no
infO
pt 2 1
%inf
Opt 2
1.5%
infOp
t 1Op
t 2 no
inf
Opt 2
1%inf
Opt2
1.5%
inf0
1033
533
00
00
-103
3533
-103
3533
-103
3533
-103
3533
-103
3533
-103
3533
-103
3533
-103
3533
177
8,266
6667
1497
910,9
14,1
14,1
14,1
14,1
2011
48,03
5120
1148
,0351
2011
48,03
5120
1148
,0351
2003
69,8
2003
69,77
2003
69,77
2003
69,76
85-8
3316
3,23
-833
163,2
3-8
3316
3,23
-833
163,2
322
778,2
6666
6714
9782
1,025
14,1
14,1
14,1
14,1
1915
58,06
3119
1558
,0631
1915
58,06
3119
1558
,0631
1907
79,8
1907
79,8
1907
79,8
1907
79,79
64-6
4238
3,44
-642
383,4
4-6
4238
3,44
-642
383,4
353
778,2
6666
6714
9773
1,156
14,1
14,1
14,1
14,1
1824
25,30
4418
2425
,3044
1824
25,30
4418
2425
,3044
1816
4718
1647
,0418
1647
,0418
1647
,0377
-460
736,4
-460
736,4
-460
736,4
-460
736,3
974
778,2
6666
6714
9764
1,292
14,1
14,1
14,1
14,1
1737
27,96
0817
3727
,9608
1737
27,96
0817
3727
,9608
1729
49,7
1729
49,69
1729
49,69
1729
49,69
42-2
8778
6,7-2
8778
6,7-2
8778
6,7-2
8778
6,703
577
8,266
6667
1497
551,4
3414
,114
,114
,114
,116
5445
,2735
1654
45,27
3516
5445
,2735
1654
45,27
3516
4667
1646
67,01
1646
67,01
1646
67,00
68-1
2311
9,7-1
2311
9,7-1
2311
9,7-1
2311
9,696
677
8,266
6667
1497
461,5
8113
,313
,313
,313
,314
8618
,042
1486
18,04
214
8618
,042
1486
18,04
214
7839
,814
7839
,7814
7839
,7814
7839
,7754
2472
0,079
2472
0,079
2472
0,079
2472
0,079
777
8,266
6667
1497
371,7
3313
,313
,313
,313
,314
1532
,4999
1415
32,49
9914
1532
,4999
1415
32,49
9914
0754
,214
0754
,2314
0754
,2314
0754
,2333
1654
74,31
1654
74,31
216
5474
,312
1654
74,31
238
778,2
6666
6714
9728
1,891
13,3
13,3
13,3
13,3
1347
84,76
9513
4784
,7695
1347
84,76
9513
4784
,7695
1340
06,5
1340
06,5
1340
06,5
1340
06,50
2829
9480
,8229
9480
,815
2994
80,81
529
9480
,8151
977
8,266
6667
1497
192,0
5413
,313
,313
,313
,312
8358
,7452
1283
58,74
5212
8358
,7452
1283
58,74
5212
7580
,512
7580
,4812
7580
,4812
7580
,4785
4270
61,29
4270
61,29
442
7061
,294
4270
61,29
3610
1665
35,26
6714
9710
2,222
13,3
13,3
13,3
13,3
1222
39,08
9212
2239
,0892
1222
39,08
9212
2239
,0892
-442
96,2
-442
96,18
-442
96,18
-442
96,17
7538
2765
,1238
2765
,116
3827
65,11
638
2765
,1161
1177
8,266
6667
1497
012,3
9613
,37,5
8,367
5126
8,834
6170
3111
6411
,1951
6564
5,410
7673
238,5
0689
7732
6,941
8511
5632
,964
867,1
4472
460,2
476
548,6
7519
4983
98,04
4476
32,26
4552
25,35
645
9313
,7913
1277
8,266
6667
1496
922,5
7513
,37,5
8,451
1877
268,9
6713
6286
1108
61,15
2862
515,6
8765
7044
4,241
6374
744,8
9216
1100
82,9
6173
7,421
6966
5,975
7396
6,625
4960
8480
,9350
9369
,681
5248
91,33
153
3280
,4168
1377
8,266
6667
1496
832,7
613
,37,5
8,535
6996
039,1
0164
333
1055
75,71
5359
535,1
7782
6775
6,585
8372
249,0
6055
1047
97,4
5875
6,911
6697
8,319
7147
0,793
8971
3278
,3856
8126
,592
5918
69,65
6047
51,21
0714
778,2
6666
6714
9674
2,95
13,3
7,58,6
2105
6599
9,238
1679
810
0542
,2674
5669
6,767
3465
171,4
7204
6983
6,568
0999
764
5591
8,501
6439
3,205
6905
8,301
4281
3042
,3862
4045
,093
6562
62,85
667
3809
,5121
1577
8,266
6667
1496
653,1
4513
,37,5
8,707
2671
659,3
7674
0595
748,7
9513
5399
3,681
4762
684,9
8797
6750
4,631
9694
970,5
353
215,4
1561
906,7
2166
726,3
653
9080
12,91
6772
60,50
871
8169
,577
7405
35,87
7416
778,2
6666
6714
9656
3,346
13,3
7,58,7
9433
9837
9,517
3916
0791
183,8
5734
5141
9,468
4260
293,3
7061
6525
0,562
390
405,5
950
641,2
0259
515,1
0464
472,2
9563
9984
18,5
7279
01,71
7776
84,68
180
5008
,1731
1777
8,266
6667
1496
473,5
5213
,37,5
8,882
2832
359,6
6015
2482
8683
6,558
3948
967,9
8405
5799
3,000
5163
071,7
5902
8605
8,29
4818
9,717
5721
4,734
6229
3,492
3510
8447
6,877
6091
,427
8348
99,41
586
7301
,6654
1877
8,266
6667
1496
383,7
6413
,37,5
8,971
1060
689,8
0505
4769
8269
6,522
0946
633,3
7712
5578
0,396
3260
965,7
0889
8191
8,26
4585
5,11
5500
2,13
6018
7,442
2311
6639
582
1946
,537
8899
01,54
592
7489
,1076
1977
8,266
6667
1496
293,9
8113
,37,5
9,060
8171
289,9
5213
059
7875
3,866
9544
410,0
7535
5365
2,209
5258
929,9
8258
7797
5,643
631,8
0952
873,9
4358
151,7
1592
1244
370,6
8655
78,34
694
2775
,487
9856
40,82
3520
1025
38,26
6714
9620
4,203
13,3
7,59,1
5142
5310
,1014
1255
7499
9,182
5942
292,7
7214
5160
5,219
3256
962,2
3189
-275
39,1
-602
45,49
-509
33,05
-455
76,03
4812
1683
1,680
5332
,852
8918
42,44
9400
64,78
8821
778,2
6666
6714
9611
4,431
13,3
7,59,2
4293
9553
10,25
2933
7471
423,5
0727
4027
6,413
8849
636,3
2785
5506
0,187
0270
645,2
439
498,1
4748
858,0
6154
281,9
2035
1287
476,8
8448
30,99
994
0700
,501
9943
46,70
9122
778,2
6666
6714
9602
4,664
13,3
7,59,3
3536
8948
10,40
6727
7468
018,3
0654
3835
6,187
947
742,5
5539
5322
1,653
9667
240,0
437
577,9
2146
964,2
8952
443,3
873
1354
716,8
8824
08,92
9876
64,79
1046
790,0
9623
778,2
6666
6714
9593
4,903
13,3
7,59,4
2872
2638
10,56
2828
6664
775,4
528
3652
7,510
9845
921,0
3595
5144
4,511
9763
997,1
935
749,2
4445
142,7
6950
666,2
4531
1418
714
9181
58,16
410
3280
7,56
1097
456,3
4224
778,2
6666
6714
9584
5,147
13,3
7,59,5
2300
9864
10,72
1271
0961
687,2
0597
3478
6,018
4144
169,0
1285
4972
6,711
1360
908,9
434
007,7
5243
390,7
4648
948,4
4446
1479
623
9521
65,91
610
7619
8,31
1146
404,7
8625
778,2
6666
6714
9575
5,396
13,3
7,59,6
1823
9963
10,88
2090
1658
746,1
9499
3312
7,553
5742
483,8
3461
4806
6,269
9457
967,9
332
349,2
8741
705,5
6847
288,0
0327
1537
590,9
9845
15,20
311
1790
3,87
1193
692,7
8926
778,2
6666
6714
9566
5,651
13,3
7,59,7
1442
2362
11,04
5321
5155
945,4
0021
3154
8,158
0140
862,9
5089
4646
1,273
155
167,1
330
769,8
9140
084,6
8445
683,0
0643
1592
758
1015
285,0
911
5798
8,56
1239
375,7
9627
778,2
6666
6714
9557
5,911
13,3
7,59,8
1156
6586
11,21
1001
3353
278,1
3665
3004
4,062
0239
303,9
0867
4490
9,869
2452
499,8
729
265,7
9538
525,6
4244
131,6
0257
1645
257,9
1044
550,8
911
9651
4,212
8350
7,398
2877
8,266
6667
1495
486,1
7613
,37,5
9,909
6822
5211
,3791
6635
5073
8,038
0628
611,6
756
3780
4,348
5243
410,2
6883
4995
9,77
2783
3,409
3702
6,082
4263
2,002
1616
9521
7,710
7238
4,312
3354
0,28
1326
139,4
0129
778,2
6666
6714
9539
6,447
13,3
7,510
,0087
7907
11,54
9853
8548
319,0
4169
2724
7,579
936
362,0
0101
4196
0,742
0747
540,7
826
469,3
1335
583,7
3441
182,4
754
1742
758,4
1098
853,6
112
6912
4,02
1367
321,8
7630
778,2
6666
6714
9530
6,723
13,3
7,510
,1088
6686
11,72
3101
6546
015,3
7386
2594
8,519
0934
974,6
8331
4055
9,616
9545
237,1
125
170,2
5234
196,4
1739
781,3
5028
1787
995,6
1124
023,8
613
0332
0,43
1407
103,2
2631
992
00
-992
-992
-991
,617
-991
,617
1787
003,6
1123
031,8
613
0232
8,82
1406
111,6
09
Cumu
lative
Profi
t ($)
PV Pa
ybac
k and
Rev
enue
Che
ck (1
MW
) w/o
Land
Cos
tRe
venu
e r=5
% ($
)Pr
ofit ($
)Ele
ctrici
ty Pr
ice ($
cents
)

100
Tabl
e 60
Pay
back
tabl
e fo
r 1 M
W P
V P
P w
ith la
nd c
ost
Tim
e (y
ears
)In
vest
men
t ($)
Land
Cos
t ($)
Inv.
w L
($) O
pt 1
Opt
2 n
o in
f O
pt 2
1%
inf
Opt
2 1
.5%
inf
Opt
1O
pt 2
no
infO
pt 2
1%
infO
pt 2
1.5
%in
fOpt
1O
pt 2
no
inf
Opt
2 1
%in
fOpt
2 1.
5%in
f0
1033
533
7573
511
0926
80
00
0-1
1092
68-1
1092
68-1
1092
68-1
1092
68-1
1092
68-1
1092
68-1
1092
68-1
1092
681
778,
2666
667
7212
8,57
143
7290
6,83
820
1148
,035
120
1148
,035
120
1148
,035
120
1148
,035
112
8241
,212
8241
,212
8241
,212
8241
,197
-981
026,
803
-981
026,
8-9
8102
6,8
-981
026,
803
277
8,26
6666
768
693,
8775
569
472,
144
1915
58,0
631
1915
58,0
631
1915
58,0
631
1915
58,0
631
1220
85,9
1220
85,9
212
2085
,92
1220
85,9
189
-858
940,
884
-858
940,
88-8
5894
0,88
-858
940,
884
377
8,26
6666
765
422,
7405
266
201,
007
1824
25,3
044
1824
25,3
044
1824
25,3
044
1824
25,3
044
1162
24,3
1162
24,3
1162
24,3
1162
24,2
972
-742
716,
587
-742
716,
59-7
4271
6,59
-742
716,
587
477
8,26
6666
762
307,
3719
363
085,
639
1737
27,9
608
1737
27,9
608
1737
27,9
608
1737
27,9
608
1106
42,3
1106
42,3
211
0642
,32
1106
42,3
222
-632
074,
265
-632
074,
26-6
3207
4,26
-632
074,
265
577
8,26
6666
759
340,
3542
260
118,
621
1654
45,2
735
1654
45,2
735
1654
45,2
735
1654
45,2
735
1053
26,7
1053
26,6
510
5326
,65
1053
26,6
526
-526
747,
612
-526
747,
61-5
2674
7,61
-526
747,
612
677
8,26
6666
756
514,
6230
657
292,
8914
8618
,042
1486
18,0
4214
8618
,042
1486
18,0
4291
325,
1591
325,
152
9132
5,15
291
325,
1522
9-4
3542
2,46
-435
422,
46-4
3542
2,46
-435
422,
467
778,
2666
667
5382
3,45
054
5460
1,71
714
1532
,499
914
1532
,499
914
1532
,499
914
1532
,499
986
930,
7886
930,
783
8693
0,78
386
930,
7827
3-3
4849
1,67
7-3
4849
1,68
-348
491,
68-3
4849
1,67
78
778,
2666
667
5126
0,42
908
5203
8,69
613
4784
,769
513
4784
,769
513
4784
,769
513
4784
,769
582
746,
0782
746,
074
8274
6,07
482
746,
0737
6-2
6574
5,60
3-2
6574
5,6
-265
745,
6-2
6574
5,60
39
778,
2666
667
4881
9,45
627
4959
7,72
312
8358
,745
212
8358
,745
212
8358
,745
212
8358
,745
278
761,
0278
761,
022
7876
1,02
278
761,
0222
3-1
8698
4,58
1-1
8698
4,58
-186
984,
58-1
8698
4,58
110
1665
35,2
667
4649
4,72
026
2130
29,9
912
2239
,089
212
2239
,089
212
2239
,089
212
2239
,089
2-9
0790
,9-9
0790
,9-9
0790
,898
-907
90,8
977
-277
775,
479
-277
775,
48-2
7777
5,48
-277
775,
479
1177
8,26
6666
744
280,
6859
645
058,
953
1164
11,1
951
6564
5,41
076
7323
8,50
689
7732
6,94
185
7135
2,24
2058
6,45
828
179,
554
3226
7,98
923
-206
423,
236
-257
189,
02-2
4959
5,92
-245
507,
489
1277
8,26
6666
742
172,
0818
742
950,
349
1108
61,1
528
6251
5,68
765
7044
4,24
163
7474
4,89
216
6791
0,8
1956
5,33
927
493,
893
3179
4,54
363
-138
512,
432
-237
623,
68-2
2210
2,03
-213
712,
946
1377
8,26
6666
740
163,
8874
940
942,
154
1055
75,7
153
5953
5,17
782
6775
6,58
583
7224
9,06
055
6463
3,56
1859
3,02
426
814,
432
3130
6,90
639
-738
78,8
708
-219
030,
66-1
9528
7,6
-182
406,
039
1477
8,26
6666
738
251,
3214
239
029,
588
1005
42,2
674
5669
6,76
734
6517
1,47
204
6983
6,56
809
6151
2,68
1766
7,17
926
141,
884
3080
6,98
-123
66,1
915
-201
363,
48-1
6914
5,72
-151
599,
059
1577
8,26
6666
736
429,
8299
237
208,
097
9574
8,79
513
5399
3,68
147
6268
4,98
797
6750
4,63
196
5854
0,7
1678
5,58
525
476,
891
3029
6,53
537
4617
4,50
7-1
8457
7,89
-143
668,
82-1
2130
2,52
416
778,
2666
667
3469
5,07
612
3547
3,34
391
183,
8573
451
419,
4684
260
293,
3706
165
250,
5623
5571
0,51
1594
6,12
624
820,
028
2977
7,21
951
1018
85,0
22-1
6863
1,77
-118
848,
8-9
1525
,304
617
778,
2666
667
3304
2,92
964
3382
1,19
686
836,
5583
948
967,
9840
557
993,
0005
163
071,
7590
253
015,
3615
146,
788
2417
1,80
429
250,
5627
215
4900
,384
-153
484,
98-9
4676
,992
-622
74,7
419
1877
8,26
6666
731
469,
4568
3224
7,72
382
696,
5220
946
633,
3771
255
780,
3963
260
965,
7088
950
448,
814
385,
654
2353
2,67
328
717,
9854
320
5349
,182
-139
099,
33-7
1144
,319
-335
56,7
564
1977
8,26
6666
729
970,
9112
330
749,
178
7875
3,86
695
4441
0,07
535
5365
2,20
952
5892
9,98
258
4800
4,69
1366
0,89
722
903,
032
2818
0,80
468
2533
53,8
71-1
2543
8,43
-482
41,2
88-5
375,
9517
620
1025
38,2
667
2854
3,72
499
1310
81,9
974
999,
1825
942
292,
7721
451
605,
2193
256
962,
2318
9-5
6082
,8-8
8789
,22
-794
76,7
72-7
4119
,759
819
7271
,062
-214
227,
65-1
2771
8,06
-794
95,7
115
2177
8,26
6666
727
184,
4999
927
962,
767
7142
3,50
727
4027
6,41
388
4963
6,32
785
5506
0,18
702
4346
0,74
1231
3,64
721
673,
561
2709
7,42
037
2407
31,8
03-2
0191
4-1
0604
4,5
-523
98,2
911
2277
8,26
6666
725
889,
9999
926
668,
267
6801
8,30
654
3835
6,18
7947
742,
5553
953
221,
6539
641
350,
0411
687,
921
2107
4,28
926
553,
3873
128
2081
,843
-190
226,
08-8
4970
,21
-258
44,9
038
2377
8,26
6666
724
657,
1428
425
435,
4164
775,
4528
3652
7,51
098
4592
1,03
595
5144
4,51
197
3934
0,04
1109
2,10
120
485,
626
2600
9,10
246
3214
21,8
86-1
7913
3,98
-644
84,5
8416
4,19
8621
2477
8,26
6666
723
482,
9931
924
261,
2661
687,
2059
734
786,
0184
144
169,
0128
549
726,
7111
337
425,
9510
524,
759
1990
7,75
325
465,
4512
735
8847
,832
-168
609,
22-4
4576
,831
2562
9,64
9925
778,
2666
667
2236
4,75
541
2314
3,02
258
746,
1949
933
127,
5535
742
483,
8346
148
066,
2699
435
603,
1799
84,5
315
1934
0,81
324
923,
2478
639
4451
,005
-158
624,
69-2
5236
,018
5055
2,89
7826
778,
2666
667
2129
9,76
706
2207
8,03
455
945,
4002
131
548,
1580
140
862,
9508
946
461,
2731
3386
7,37
9470
,124
318
784,
917
2438
3,23
937
4283
18,3
72-1
4915
4,56
-645
1,10
1174
936,
1371
2777
8,26
6666
720
285,
4924
421
063,
759
5327
8,13
665
3004
4,06
202
3930
3,90
867
4490
9,86
924
3221
4,38
8980
,302
918
240,
1523
846,
1101
346
0532
,749
-140
174,
2611
789,
048
9878
2,24
7328
778,
2666
667
1931
9,51
661
2009
7,78
350
738,
0380
628
611,
6756
3780
4,34
852
4341
0,26
883
3064
0,25
8513
,892
317
706,
565
2331
2,48
555
4911
73,0
04-1
3166
0,37
2949
5,61
412
2094
,733
2977
8,26
6666
718
399,
5396
319
177,
806
4831
9,04
169
2724
7,57
9936
362,
0010
141
960,
7420
729
141,
2480
69,7
736
1718
4,19
522
782,
9357
852
0314
,239
-123
590,
646
679,
808
1448
77,6
6930
778,
2666
667
1752
3,37
107
1830
1,63
846
015,
3738
625
948,
5190
934
974,
6833
140
559,
6169
527
713,
7476
46,8
814
1667
3,04
622
257,
9792
5480
27,9
75-1
1594
3,71
6335
2,85
416
7135
,648
3199
299
20
0-9
92-9
92-9
92-9
9254
7035
,975
-116
935,
7162
360,
854
1661
43,6
48
Rev
enue
r=5%
($)
Prof
it ($
)C
umul
ativ
e Pr
ofit
($)
PV P
ayba
ck a
nd R
even
ue C
heck
(1 M
W) w
Lan
d C
ost

101
According to the computations made at above mentioned two tables, payback
times of 1MW PV PP with options are given in Table 61.
Table 61 Payback situation of options for 1 MW PV PP Opt 1
(years)
Opt 2 (years)
w/o inf. w 1% inf. w 1.5% inf.
Pay Back Time with 5%
discount rate with land cost
14.20 No payback 26.36 23
Pay Back Time with 5%
discount rate w/o land cost 5.86 (for all options)
With scaling to 4800 MW, the following two tables are designed for the
determination of a payback time of 4800 MW PV PP for both options for the total
cost both exluding and including land costs. Although one of the options, without
accounting the inflation rate and with the land cost, 1 MW PV PP does not pay back,
but the scale projected 4800 MW PV PP does give pay back of 24.77 years (see
below).

102
Tabl
e 62
Pay
back
tabl
e of
480
0 M
W P
V P
P w
ithou
t lan
d co
st
Tim
e (y
ears
)In
vest
men
t ($)
Opt
1O
pt 2
no
inf
Opt
2 1
% in
fO
pt 2
1.5
% in
fOpt
1O
pt 2
no
inf
Opt
2 1
%in
fO
pt 2
1.5
%in
fOpt
1O
pt 2
no
inf
Opt
2 1
%in
fO
pt2
1.5%
inf
043
4586
2777
00
00
-434
5862
777
-434
5862
777
-434
5862
777
-434
5862
777
-434
5862
777
-434
5862
777
-434
5862
777
-434
5862
777
133
0874
5,14
396
5510
569
9655
1056
996
5510
569
9655
1056
996
2201
823,
996
2201
823,
996
2201
824
9622
0182
3,9
-338
3660
953
-338
3660
953
-338
3660
953
-338
3660
953
233
0874
5,14
391
9478
703
9194
7870
391
9478
703
9194
7870
391
6169
957,
991
6169
957,
991
6169
958
9161
6995
7,9
-246
7490
995
-246
7490
995
-246
7490
995
-246
7490
995
333
0874
5,14
387
5641
461
8756
4146
187
5641
461
8756
4146
187
2332
715,
987
2332
715,
987
2332
716
8723
3271
5,9
-159
5158
280
-159
5158
280
-159
5158
280
-159
5158
280
433
0874
5,14
383
3894
212
8338
9421
283
3894
212
8338
9421
283
0585
466,
983
0585
466,
983
0585
467
8305
8546
6,9
-764
5728
13-7
6457
2813
-764
5728
13-7
6457
2813
533
0874
5,14
379
4137
313
7941
3731
379
4137
313
7941
3731
379
0828
567,
979
0828
567,
979
0828
568
7908
2856
7,9
2625
5755
,14
2625
5755
,14
2625
5755
,126
2557
55,1
46
3308
745,
143
7133
6660
271
3366
602
7133
6660
271
3366
602
7100
5785
6,9
7100
5785
6,9
7100
5785
771
0057
856,
973
6313
612
7363
1361
273
6313
612
7363
1361
27
3308
745,
143
6793
5600
067
9356
000
6793
5600
067
9356
000
6760
4725
4,9
6760
4725
4,9
6760
4725
567
6047
254,
914
1236
0867
1412
3608
6714
1236
0867
1412
3608
678
3308
745,
143
6469
6689
464
6966
894
6469
6689
464
6966
894
6436
5814
8,9
6436
5814
8,9
6436
5814
964
3658
148,
920
5601
9016
2056
0190
1620
5601
9016
2056
0190
169
3308
745,
143
6161
2197
761
6121
977
6161
2197
761
6121
977
6128
1323
1,9
6128
1323
1,9
6128
1323
261
2813
231,
926
6883
2248
2668
8322
4826
6883
2248
2668
8322
4810
7080
1099
6,8
5867
4762
858
6747
628
5867
4762
858
6747
628
-121
2633
68,8
-121
2633
68,8
-121
2633
69-1
2126
3369
2547
5688
7925
4756
8879
2547
5688
7925
4756
8879
1133
0874
5,14
355
8773
736
3150
9797
235
1544
833
3711
6932
155
5464
990,
931
1789
226,
934
8236
088
3678
6057
5,9
3103
0338
7028
5935
8106
2895
8049
6729
1542
9455
1233
0874
5,14
353
2133
533
3000
7530
133
8132
360
3587
7548
252
8824
787,
929
6766
555,
933
4823
615
3554
6673
6,9
3631
8586
5831
5612
4662
3230
6285
8232
7089
6192
1333
0874
5,14
350
6763
434
2857
6885
432
5231
612
3467
9549
150
3454
688,
928
2460
108,
932
1922
867
3434
8674
5,9
4135
3133
4634
3858
4770
3552
5514
4836
1438
2937
1433
0874
5,14
348
2602
884
2721
4448
331
2823
066
3352
1552
747
9294
138,
926
8835
737,
930
9514
321
3319
0678
1,9
4614
6074
8537
0742
0508
3862
0657
6939
4628
9719
1533
0874
5,14
345
9594
217
2591
6967
130
0887
942
3240
2223
345
6285
471,
925
5860
925,
929
7579
197
3207
1348
7,9
5070
8929
5739
6328
1434
4159
6449
6642
6700
3207
1633
0874
5,14
343
7682
515
2468
1344
828
9408
179
3132
0269
943
4373
769,
924
3504
702,
928
6099
434
3098
9395
3,9
5505
2667
2742
0678
6137
4445
7444
0045
7689
7161
1733
0874
5,14
341
6815
480
2350
4632
327
8366
402
3027
4444
341
3506
734,
923
1737
577,
927
5057
657
2994
3569
7,9
5918
7734
6244
3852
3715
4720
8020
5748
7633
2859
1833
0874
5,14
339
6943
306
2238
4021
026
7745
902
2926
3540
339
3634
560,
922
0531
464,
926
4437
157
2893
2665
7,9
6312
4080
2346
5905
5180
4985
2392
1451
6565
9517
1933
0874
5,14
337
8018
561
2131
6836
225
7530
606
2828
6391
637
4709
815,
920
9859
616,
925
4221
861
2795
5517
0,9
6687
1178
3948
6891
4797
5239
4610
7554
4521
4688
2043
5934
796,
835
9996
076
2030
0530
624
7705
053
2734
1871
3-7
5938
720,
8-2
3292
9490
,8-1
8822
9744
-162
5160
8466
1117
9118
4635
9853
0650
5123
1331
5282
6986
0421
3308
745,
143
3428
3283
519
3326
787
2382
5437
426
4288
898
3395
2408
9,9
1900
1804
1,9
2349
4562
926
0980
152,
969
5070
3208
4826
0033
4852
8617
6960
5543
6787
5722
3308
745,
143
3264
8787
118
4109
702
2291
6426
625
5463
939
3231
7912
5,9
1808
0095
6,9
2258
5552
125
2155
193,
972
7388
2333
5006
8043
0455
1203
2480
5795
8339
5023
3308
745,
143
3109
2217
317
5332
053
2204
2097
324
6933
657
3076
1342
7,9
1720
2330
7,9
2171
1222
824
3624
911,
975
8149
5761
5178
8276
1257
2914
4708
6039
4588
6224
3308
745,
143
2960
9858
916
6972
888
2120
1126
223
8688
213
2927
8984
3,9
1636
6414
2,9
2087
0251
723
5379
467,
978
7428
5605
5342
4917
5559
3784
7225
6274
8383
3025
3308
745,
143
2819
8173
615
9012
257
2039
2240
623
0718
096
2786
7299
0,9
1557
0351
1,9
2006
1366
122
7409
350,
981
5295
8596
5498
1952
6761
3846
0886
6502
2476
8126
3308
745,
143
2685
3792
115
1431
158
1961
4216
422
3014
111
2652
2917
5,9
1481
2241
2,9
1928
3341
921
9705
365,
984
1818
7772
5646
3176
8063
3129
4305
6721
9530
4727
3308
745,
143
2557
3505
614
4211
498
1886
5876
221
5567
372
2524
2631
0,9
1409
0275
2,9
1853
5001
721
2258
626,
986
7061
4083
5787
2204
3365
1664
4322
6934
2116
7428
3308
745,
143
2435
4258
313
7336
043
1814
6087
320
8369
290
2402
3383
7,9
1340
2729
7,9
1781
5212
820
5060
544,
989
1084
7921
5921
2477
3166
9479
6450
7139
2722
1929
3308
745,
143
2319
3140
013
0788
384
1745
3760
520
1411
562
2286
2265
4,9
1274
7963
8,9
1712
2886
019
8102
816,
991
3947
0575
6048
7273
6968
6602
5309
7337
3750
3530
3308
745,
143
2208
7379
512
4552
892
1678
7848
019
4686
161
2175
6504
9,9
1212
4414
6,9
1645
6973
519
1377
415,
993
5703
5625
6169
9715
1670
3059
5044
7528
7524
5131
4761
600
00
00
-476
1600
-476
1600
-476
1600
-476
1600
9352
2740
2561
6520
9916
7025
8334
4475
2399
0851
Cum
ulat
ive
Prof
it ($
)PV
Pay
back
and
Rev
enue
Che
ck (4
800
MW
) w/o
Lan
d C
ost
Rev
enue
r=5%
($)
Prof
it ($
)

103
Tabl
e 63
Pay
back
tabl
e fo
r 480
0 M
W P
V P
P w
ith la
nd c
ost
PV P
ayba
ck a
nd R
even
ue C
heck
(480
0 M
W) w
ith L
and
Cost
Tim
e (y
ears
Inve
stm
ent (
$)La
nd C
ost (
$)In
v. w
L ($
)O
pt 1
Opt
2 n
o in
f O
pt 2
1%
inf
Opt
2 1
.5%
infO
pt 1
Opt
2 n
o in
fO
pt 2
1%
inf
Opt
2 1
.5%
infO
pt 1
Opt
2 n
o in
fO
pt 2
1%
inf
Opt
2 1.
5%in
f0
4345
8627
7736
3528
000
4709
3907
770
00
0-4
7093
9077
7-4
7093
9077
7-4
7093
9077
7-4
7093
9077
7-4
7093
9077
7-4
7093
9077
7-4
7093
9077
7-4
7093
9077
71
3308
745,
143
3462
1714
334
9525
888,
196
5510
569
9655
1056
996
5510
569
9655
1056
961
5984
680,
961
5984
680,
961
5984
680,
961
5984
680,
9-4
0934
0609
6-4
0934
0609
6-4
0934
0609
6-4
0934
0609
62
3308
745,
143
3297
3061
233
3039
357,
191
9478
703
9194
7870
391
9478
703
9194
7870
358
6439
345,
958
6439
345,
958
6439
345,
958
6439
345,
9-3
5069
6675
0-3
5069
6675
0-3
5069
6675
0-3
5069
6675
03
3308
745,
143
3140
2915
431
7337
899,
187
5641
461
8756
4146
187
5641
461
8756
4146
155
8303
561,
955
8303
561,
955
8303
561,
955
8303
561,
9-2
9486
6318
9-2
9486
6318
9-2
9486
6318
9-2
9486
6318
94
3308
745,
143
2990
7538
530
2384
130,
183
3894
212
8338
9421
283
3894
212
8338
9421
253
1510
081,
953
1510
081,
953
1510
081,
953
1510
081,
9-2
4171
5310
7-2
4171
5310
7-2
4171
5310
7-2
4171
5310
75
3308
745,
143
2848
3370
028
8142
445,
179
4137
313
7941
3731
379
4137
313
7941
3731
350
5994
867,
950
5994
867,
950
5994
867,
950
5994
867,
9-1
9111
5823
9-1
9111
5823
9-1
9111
5823
9-1
9111
5823
96
3308
745,
143
2712
7019
127
4578
936,
171
3366
602
7133
6660
271
3366
602
7133
6660
243
8787
665,
943
8787
665,
943
8787
665,
943
8787
665,
9-1
4723
7057
3-1
4723
7057
3-1
4723
7057
3-1
4723
7057
37
3308
745,
143
2583
5256
326
1661
308,
167
9356
000
6793
5600
067
9356
000
6793
5600
041
7694
691,
941
7694
691,
941
7694
691,
941
7694
691,
9-1
0546
7588
1-1
0546
7588
1-1
0546
7588
1-1
0546
7588
18
3308
745,
143
2460
5006
024
9358
805,
164
6966
894
6469
6689
464
6966
894
6469
6689
439
7608
088,
939
7608
088,
939
7608
088,
939
7608
088,
9-6
5706
7792
-657
0677
92-6
5706
7792
-657
0677
92,3
933
0874
5,14
323
4333
390
2376
4213
5,1
6161
2197
761
6121
977
6161
2197
761
6121
977
3784
7984
1,9
3784
7984
1,9
3784
7984
1,9
3784
7984
1,9
-278
5879
50-2
7858
7950
-278
5879
50-2
7858
7950
,410
7080
1099
6,8
2231
7465
793
1185
653,
858
6747
628
5867
4762
858
6747
628
5867
4762
8-3
4443
8025
,8-3
4443
8025
,8-3
4443
8026
-344
4380
26-6
2302
5976
-623
0259
76-6
2302
5976
-623
0259
76,2
1133
0874
5,14
321
2547
293
2158
5603
8,1
5587
7373
631
5097
972
3515
4483
337
1169
321
3429
1769
7,9
9924
1933
,86
1356
8879
4,9
1553
1328
2,9
-280
1082
78-5
2378
4042
-487
3371
81-4
6771
2693
,312
3308
745,
143
2024
2599
320
5734
738,
153
2133
533
3000
7530
133
8132
360
3587
7548
232
6398
794,
994
3405
62,8
613
2397
621,
915
3040
743,
946
2905
16,5
-429
4434
79-3
5493
9559
-314
6719
49,5
1333
0874
5,14
319
2786
660
1960
9540
5,1
5067
6343
428
5768
854
3252
3161
234
6795
491
3106
6802
8,9
8967
3448
,86
1291
3620
6,9
1507
0008
5,9
3569
5854
5-3
3977
0031
-225
8033
53-1
6397
1863
,614
3308
745,
143
1836
0634
318
6915
088,
148
2602
884
2721
4448
331
2823
066
3352
1552
729
5687
795,
985
2293
94,8
612
5907
977,
914
8300
438,
965
2646
341
-254
5406
36-9
9895
374,
8-1
5671
424,
7515
3308
745,
143
1748
6318
417
8171
929,
145
9594
217
2591
6967
130
0887
942
3240
2223
328
1422
287,
980
9977
41,8
612
2716
012,
914
5850
303,
993
4068
629
-173
5428
9422
8206
38,1
1301
7887
9,1
1633
0874
5,14
316
6536
365
1698
4511
0,1
4376
8251
524
6813
448
2894
0817
931
3202
699
2678
3740
4,9
7696
8337
,86
1195
6306
8,9
1433
5758
8,9
1201
9060
34-9
6574
556
1423
8370
727
3536
468
1733
0874
5,14
315
8606
062
1619
1480
7,1
4168
1548
023
5046
323
2783
6640
230
2744
443
2549
0067
2,9
7313
1515
,86
1164
5159
4,9
1408
2963
5,9
1456
8067
07-2
3443
040,
225
8835
301,
841
4366
103,
818
3308
745,
143
1510
5339
315
4362
138,
139
6943
306
2238
4021
026
7745
902
2926
3540
324
2581
167,
969
4780
71,8
611
3383
763,
913
8273
264,
916
9938
7875
4603
5031
,67
3722
1906
5,7
5526
3936
8,7
1933
0874
5,14
314
3860
374
1471
6911
9,1
3780
1856
121
3168
362
2575
3060
628
2863
916
2308
4944
1,9
6599
9242
,86
1103
6148
6,9
1356
9479
6,9
1930
2373
1711
2034
274,
548
2580
552,
568
8334
165,
520
4359
3479
6,8
1370
0988
057
2944
676,
835
9996
076
2030
0530
624
7705
053
2734
1871
3-2
1294
8600
,8-3
6993
9370
,8-3
2523
9624
-299
5259
6417
1728
8716
-257
9050
9615
7340
928,
738
8808
201,
721
3308
745,
143
1304
8560
013
3794
345,
134
2832
835
1933
2678
723
8254
374
2642
8889
820
9038
489,
959
5324
41,8
610
4460
028,
913
0494
552,
919
2632
7206
-198
3726
5426
1800
957,
651
9302
754,
622
3308
745,
143
1242
7200
012
7580
745,
132
6487
871
1841
0970
222
9164
266
2554
6393
919
8907
125,
956
5289
56,8
610
1583
520,
912
7883
193,
921
2523
4331
-141
8436
9836
3384
478,
464
7185
948,
423
3308
745,
143
1183
5428
612
1663
031,
131
0922
173
1753
3205
322
0420
973
2469
3365
718
9259
141,
953
6690
21,8
698
7579
41,8
612
5270
625,
923
1449
3473
-881
7467
5,7
4621
4242
0,3
7724
5657
4,3
2433
0874
5,14
311
2718
367
1160
2711
2,1
2960
9858
916
6972
888
2120
1126
223
8688
213
1800
7147
6,9
5094
5775
,86
9598
4149
,86
1226
6110
0,9
2494
5649
50-3
7228
899,
855
8126
570,
289
5117
675,
225
3308
745,
143
1073
5082
611
0659
571,
128
1981
736
1590
1225
720
3922
406
2307
1809
617
1322
164,
948
3526
85,8
693
2628
34,8
612
0058
524,
926
6588
7115
1112
3786
,02
6513
8940
510
1517
6200
2633
0874
5,14
310
2238
882
1055
4762
7,1
2685
3792
115
1431
158
1961
4216
422
3014
111
1629
9029
3,9
4588
3530
,86
9059
4536
,86
1174
6648
3,9
2828
8774
0957
0073
16,8
774
1983
941,
911
3264
2684
2733
0874
5,14
397
3703
6410
0679
109,
125
5735
056
1442
1149
818
8658
762
2155
6737
215
5055
946,
943
5323
88,8
687
9796
52,8
611
4888
262,
929
8393
3356
1005
3970
5,7
8299
6359
4,7
1247
5309
4728
3308
745,
143
9273
3680
9604
2425
,14
2435
4258
313
7336
043
1814
6087
320
8369
290
1475
0015
7,9
4129
3617
,86
8541
8447
,86
1123
2686
4,9
3131
4335
1414
1833
323,
691
5382
042,
613
5985
7812
2933
0874
5,14
388
3177
9091
6265
35,1
423
1931
400
1307
8838
417
4537
605
2014
1156
214
0304
864,
939
1618
48,8
682
9110
69,8
610
9785
026,
932
7173
8378
1809
9517
2,4
9982
9311
2,4
1469
6428
3830
3308
745,
143
8411
2181
8742
0926
,14
2208
7379
512
4552
892
1678
7848
019
4686
161
1334
5286
8,9
3713
1965
,86
8045
7553
,86
1072
6523
4,9
3405
1912
4721
8127
138,
310
7875
0666
1576
9080
7331
4761
600
4761
600
00
00
-476
1600
-476
1600
-476
1600
-476
1600
3400
4296
4721
3365
538,
310
7398
9066
1572
1464
73
Cum
ulat
ive
Prof
it ($
)Pr
ofit
($)
Rev
enue
r=5%
($)

104
Then, the payback times for 4800 MW PV PP for different options are given
in Table 64. Table 64 Payback times of 4800 MW PV PP for different options Opt 1
(years)
Opt 2 (years)
w/o inf. w 1% inf. w 1.5% inf.
Pay Back Time with 5%
discount rate with land cost
11.86 24.77 14.81 14.10
Pay Back Time with 5%
discount rate w/o land cost 4.97 (for all options)
Moreover, cumulative revenue of the system is found as 14.94, 11.75, 12.61 and 13.11 billion $ respectively for option 1 and different verisons of option 2.
� When 4800 MW NUKE investment work out the cost and how much does it reap a profit?
The intergovernmental aggrement between the Republic of Turkey as a host of the Project and Russian Federation as an contractor of the Project adresses that the 70% of the output of the first two units and 30% of that from units 3 & 4 of the NUKE PP in Mersin is guaranteed to be purchased with 12.35 $ cents per kWh during 15 years by TETAS which is Turkish Electricity Trading and Contracting Corporation. The remaining amount of the electiricity can be sold in open electricity market. Therefore the formula is derived as 70% of the electricity from the first two reactors is sold with 12.35 $ cents, 30% of it is with 7.5 $ cents for contant price option; 30% of the electricity from the third and fourth reactors are sold with 12.35 $ cents and remaining is with 7.5 $ cents for the first 15 years. As of sixteenth year the electricity is sold to day ahead electricity market with three options such as contant 7.5 $ per kWh price, increasing price with 1% inflation rate and increasing price with 1.5% inflation rate. Multiplying electricity production of NUKE PP with related prices, Table 65 is brought about.

105
Tabl
e 65
Mon
ey in
com
e vi
a el
ectri
city
pro
duct
ion
by N
UK
E T
ime
(yea
rs)
Ele
ctri
city
Pr
oduc
tion
(kW
h)
Rev
enue
with
5%
dis
coun
t ($
cent
s)
Tim
e (y
ears
) E
lect
rici
ty
Prod
uctio
n (k
Wh)
Rev
enue
with
5%
dis
coun
t ($
cent
s)
With
no
infla
tion
rate
W
ith 1
%
infla
tion
With
1.5
%
infla
tion
With
no
infla
tion
rate
With
1%
in
flatio
n W
ith 1
.5%
in
flatio
n
12
8.42
4 E+
9 5.
111E
+10
5.24
4E+1
0 5.
317E
+10
24
3.37
0E+1
0 1.
037E
+11
1.20
2E+1
1 1.
239E
+11
13
1.68
5E+1
0 9.
735E
+10
1.00
1E+1
1 1.
016E
+11
25
3.37
0E+1
0 9.
876E
+10
1.14
7E+1
1 1.
185E
+11
14
2.52
72E+
10
1.30
8E+1
1 1.
434E
+11
1.45
7E+1
1 26
3.
370E
+10
9.40
6E+1
0 1.
095E
+11
1.13
3E+1
1
15
3.37
0E+1
0 1.
609E
+11
1.82
5E+1
1 1.
857E
+11
27
3.37
0E+1
0 6.
769E
+10
1.04
6E+1
1 1.
084E
+11
16
3.37
0E+1
0 1.
532E
+11
1.74
2E+1
1 1.
775E
+11
28
3.37
0E+1
0 6.
447E
+10
8.51
8E+1
0 9.
781E
+10
17
3.37
0E+1
0 1.
459E
+11
1.66
3E+1
1 1.
697E
+11
29
3.37
0E+1
0 6.
140
E+10
8.
194E
+10
9.45
5E+1
0
18
3.37
0E+1
0 1.
390E
+11
1.58
7E+1
1 1.
622E
+11
30
3.37
0E+1
0 5.
847
E+10
7.
881E
+10
9.14
0E+1
0
19
3.37
0E+1
0 1.
323E
+11
1.51
5E+1
1 1.
551E
+11
31
3.37
0E+1
0 5.
569E
+10
7.58
1E+1
0 8.
835E
+10
20
3.37
0E+1
0 1.
260E
+11
1.44
7E+1
1 1.
483E
+11
32
3.37
0E+1
0 5.
304E
+10
7.29
2E+1
0 8.
541E
+10
21
3.37
0E+1
0 1.
200E
+11
1.38
1E+1
1 1.
418E
+11
33
3.37
0E+1
0 5.
051E
+10
7.01
5E+1
0 8.
256E
+10
22
3.37
0E+1
0 1.
143E
+11
1.31
8E+1
1 1.
355E
+11
34
3.37
0E+1
0 4.
811E
+10
6.74
7E+1
0 7.
981E
+10
23
3.37
0E+1
0 1.
089E
+11
1.25
9E+1
1 1.
296E
+11
35
3.37
0E+1
0 4.
582E
+10
6.49
0E+1
0 7.
715E
+10

106
Tabl
e 65
(con
tinue
d)
Tim
e (y
ears
) E
lect
rici
ty
Prod
uctio
n (k
Wh)
Rev
enue
with
5%
dis
coun
t ($
cent
s)
Tim
e (y
ears
) E
lect
rici
ty
Prod
uctio
n (k
Wh)
Rev
enue
with
5%
dis
coun
t ($
cent
s)
With
no
infla
tion
rate
W
ith 1
%
infla
tion
With
1.5
%
infla
tion
With
no
infla
tion
rate
With
1%
in
flatio
n W
ith 1
.5%
in
flatio
n
36
3.37
0E+1
0 4.
363E
+10
6.24
3E+1
0 7.
458E
+10
48
3.37
0E+1
0 2.
430E
+10
3.91
7E+1
0 4.
965E
+10
37
3.37
0E+1
0 4.
156E
+10
6.00
5E+1
0 7.
209E
+10
49
3.37
0E+1
0 2.
314E
+10
3.76
8E+1
0 4.
780E
+10
38
3.37
0E+1
0 3.
958E
+10
5.77
6E+1
0 6.
969E
+10
50
3.37
0E+1
0 2.
204E
+10
3.62
4E+1
0 4.
640E
+10
39
3.37
0E+1
0 3.
769E
+10
5.55
6E+1
0 6.
736E
+10
51
3.37
0E+1
0 2.
099E
+10
3.48
6E+1
0 4.
485E
+10
40
3.37
0E+1
0 3.
590E
+10
5.34
5E+1
0 6.
512E
+10
52
3.37
0E+1
0 1.
999E
+10
3.35
4E+1
0 4.
335E
+10
41
3.37
0E+1
0 3.
419E
+10
5.14
1E+1
0 6.
295E
+10
53
3.37
0E+1
0 1.
904E
+10
3.22
6E+1
0 4.
191E
+10
42
3.37
0E+1
0 3.
256E
+10
4.94
5E+1
0 6.
085E
+10
54
3.37
0E+1
0 1.
813E
+10
3.10
3E+1
0 4.
051E
+10
43
3.37
0E+1
0 3.
101E
+10
4.75
7E+1
0 5.
882E
+10
55
3.37
0E+1
0 1.
727E
+10
2.98
5E+1
0 3.
916E
+10
44
3.37
0E+1
0 2.
953E
+10
4.57
6E+1
0 5.
686E
+10
56
3.37
0E+1
0 1.
645E
+10
2.87
1E+1
0 3.
786E
+10
45
3.37
0E+1
0 2.
813E
+10
4.40
1E+1
0 5.
497E
+10
57
3.37
0E+1
0 1.
566E
+10
2.76
2E+1
0 3.
660E
+10
46
3.37
0E+1
0 2.
679E
+10
4.23
4E+1
0 5.
313E
+10
58
3.37
0E+1
0 1.
492E
+10
2.65
6E+1
0 3.
537E
+10
47
3.37
0E+1
0 2.
551E
+10
4.07
2E+1
0 5.
136E
+10
59
3.37
0E+1
0 1.
421E
+10
2.55
5E+1
0 3.
420E
+10

107
Tabl
e 65
(con
tinue
d)
Tim
e (y
ears
) E
lect
rici
ty
Prod
uctio
n (k
Wh)
Rev
enue
with
5%
dis
coun
t ($
cent
s)
Tim
e (y
ears
) E
lect
rici
ty
Prod
uctio
n (k
Wh)
Rev
enue
with
5%
dis
coun
t ($
cent
s)
With
no
infla
tion
rate
W
ith 1
%
infla
tion
With
1.
5%
infla
tion
With
no
infla
tion
rate
With
1%
in
flatio
n W
ith 1
.5%
in
flatio
n
60
3.37
0E+1
0 1.
353E
+10
2.45
8E+1
0 3.
306E
+10
68
3.37
0E+1
0 9.
157E
+9
1.80
1E+1
0 2.
520E
+10
61
3.37
0E+1
0 1.
289E
+10
2.36
4E+1
0 3.
195E
+10
69
2.52
7E+1
0 8.
721E
+9
1.73
3E+1
0 2.
436E
+10
62
3.37
0E+1
0 1.
227E
+10
2.27
4E+1
0 3.
089E
+10
70
1.68
5E+1
0 8.
306E
+9
1.66
7E+1
0 2.
355E
+10
63
3.37
0E+1
0 1.
169E
+10
2.18
8E+1
0 2.
986E
+10
71
8.42
4E+9
7.
910E
+9
1.60
3E+1
0 2.
277E
+10
64
3.37
0E+1
0 1.
113E
+10
2.10
4E+1
0 2.
886E
+10
72
5.
650E
+9
1.15
7E+1
0 1.
651E
+10
65
3.37
0E+1
0 1.
060E
+10
2.02
4E+1
0 2.
790E
+10
73
3.
587E
+9
7.41
7E+9
1.
064E
+10
66
3.37
0E+1
0 1.
010E
+10
1.94
7E+1
0 2.
697E
+10
74
1.
708E
+9
3.56
7E+9
5.
141E
+9
67
3.37
0E+1
0 9.
615E
+9
1.87
3E+1
0 2.
607E
+10
Tot
al
($ce
nts)
3.
0506
E+1
2 3.
9723
E+1
2 4.
4765
E+1
2
T
otal
(b
illio
n $)
30
.506
39
.723
44
.765
O
win
g to
hav
e in
com
e an
d ex
pend
iture
cos
ts o
f 480
0 M
W N
UK
E PP
, pay
back
tim
e is
cal
cula
ted
as fo
llow
s:

108
Tabl
e 66
Pay
back
tabl
e of
480
0 M
W N
UK
E PP
with
out l
and
cost
N
UK
E P
ayba
ck a
nd R
even
ue C
heck
(480
0 M
W)
Tim
e (y
rs)
Inve
stm
ent
($)
Rev
enue
w
no
inte
rest
ra
te ($
) R
even
ue w
1%
int r
ate
Rev
enue
w
1.5%
int
rate
Pr
ofit
w n
o
int r
ate
($)
Prof
it w
1%
in
t rat
e ($
)
Prof
it w
1.
5% in
t ra
te ($
) C
umul
ativ
e Pr
ofit
($)
0 22
7250
0000
0 0
0 0
-227
2500
0000
- 2.
2725
E+10
-2
.272
5E+1
0 -2
2725
0000
00
- 2272
5000
000
-2.2
725E
+10
1 0
0 0
0 0
0 -2
2725
0000
00
- 2272
5000
000
-2.2
725E
+10
2 0
0 0
0 0
0 -2
2725
0000
00
- 2272
5000
000
-2.2
725E
+10
3 0
0 0
0 0
0 -2
2725
0000
00
- 2272
5000
000
-2.2
725E
+10
4 0
0 0
0 0
0 -2
2725
0000
00
- 2272
5000
000
-2.2
725E
+10
5 0
0 0
0 0
0 -2
2725
0000
00
- 2272
5000
000
-2.2
725E
+10
6 0
0 0
0 0
0 -2
2725
0000
00
- 2272
5000
000
-2.2
725E
+10
7 0
0 0
0 0
0 -2
2725
0000
00
- 2272
5000
000
-2.2
725E
+10
8 0
0 0
0 0
0 -2
2725
0000
00
- 2272
5000
000
-2.2
725E
+10
9 0
0 0
0 0
0 -2
2725
0000
00
- 2272
5000
000
-2.2
725E
+10
10
0 0
0 0
0 0
-227
2500
0000
- 22
7250
0000
0 -2
.272
5E+1
0
11
0 0
0 0
0 0
-227
2500
0000
- 22
7250
0000
0 -2
.272
5E+1
0
12
3665
3225
.81
5110
6248
6.8
5244
4797
6 53
1708
608.
5 47
4409
261
4877
9475
1 49
5055
382.
7 -2
2250
5907
39
- 2223
7205
249
-2.2
23E+
10
13
7330
6451
.61
9734
5235
5.9
1001
2138
30
1016
3837
04
9001
4590
4.3
9279
0737
9 94
3077
252.
8 -2
1350
4448
35
- 2130
9297
870
-2.1
287E
+10
14
1099
5967
7.4
1308
1051
89
1433
5739
82
1457
2045
54
1198
1455
12
1323
6143
05
1347
2448
77
-201
5229
9323
- 19
9856
8356
6 -1
.994
E+10
15
1466
1290
3.2
1608
6789
50
1824
6033
99
1857
1565
78
1462
0660
46
1677
9904
96
1710
5436
75
-186
9023
3276
- 18
3076
9307
0 -1
.822
9E+1
0
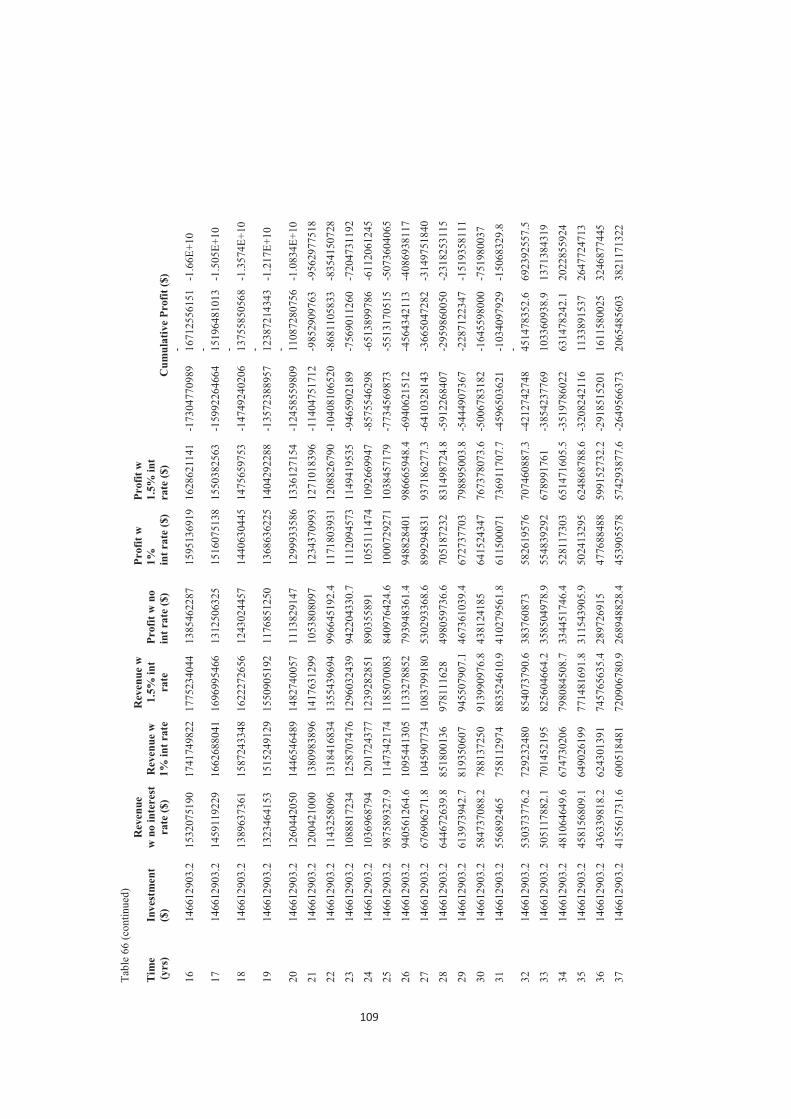
109
Tabl
e 66
(con
tinue
d)
Tim
e (y
rs)
Inve
stm
ent
($)
Rev
enue
w
no
inte
rest
ra
te ($
) R
even
ue w
1%
int r
ate
Rev
enue
w
1.5%
int
rate
Pr
ofit
w n
o
int r
ate
($)
Prof
it w
1%
in
t rat
e ($
)
Prof
it w
1.
5% in
t ra
te ($
) C
umul
ativ
e Pr
ofit
($)
16
1466
1290
3.2
1532
0751
90
1741
7498
22
1775
2340
44
1385
4622
87
1595
1369
19
1628
6211
41
-173
0477
0989
- 16
7125
5615
1 -1
.66E
+10
17
1466
1290
3.2
1459
1192
29
1662
6880
41
1696
9954
66
1312
5063
25
1516
0751
38
1550
3825
63
-159
9226
4664
- 15
1964
8101
3 -1
.505
E+10
18
1466
1290
3.2
1389
6373
61
1587
2433
48
1622
2726
56
1243
0244
57
1440
6304
45
1475
6597
53
-147
4924
0206
- 13
7558
5056
8 -1
.357
4E+1
0
19
1466
1290
3.2
1323
4641
53
1515
2491
29
1550
9051
92
1176
8512
50
1368
6362
25
1404
2922
88
-135
7238
8957
- 12
3872
1434
3 -1
.217
E+10
20
1466
1290
3.2
1260
4420
50
1446
5464
89
1482
7400
57
1113
8291
47
1299
9335
86
1336
1271
54
-124
5855
9809
- 11
0872
8075
6 -1
.083
4E+1
0
21
1466
1290
3.2
1200
4210
00
1380
9838
96
1417
6312
99
1053
8080
97
1234
3709
93
1271
0183
96
-114
0475
1712
-9
8529
0976
3 -9
5629
7751
8
22
1466
1290
3.2
1143
2580
96
1318
4168
34
1355
4396
94
9966
4519
2.4
1171
8039
31
1208
8267
90
-104
0810
6520
-8
6811
0583
3 -8
3541
5072
8
23
1466
1290
3.2
1088
8172
34
1258
7074
76
1296
0324
39
9422
0433
0.7
1112
0945
73
1149
4195
35
-946
5902
189
-756
9011
260
-720
4731
192
24
1466
1290
3.2
1036
9687
94
1201
7243
77
1239
2828
51
8903
5589
1 10
5511
1474
10
9266
9947
-8
5755
4629
8 -6
5138
9978
6 -6
1120
6124
5
25
1466
1290
3.2
9875
8932
7.9
1147
3421
74
1185
0700
83
8409
7642
4.6
1000
7292
71
1038
4571
79
-773
4569
873
-551
3170
515
-507
3604
065
26
1466
1290
3.2
9405
6126
4.6
1095
4413
05
1133
2788
52
7939
4836
1.4
9488
2840
1 98
6665
948.
4 -6
9406
2151
2 -4
5643
4211
3 -4
0869
3811
7
27
1466
1290
3.2
6769
0627
1.8
1045
9077
34
1083
7991
80
5302
9336
8.6
8992
9483
1 93
7186
277.
3 -6
4103
2814
3 -3
6650
4728
2 -3
1497
5184
0
28
1466
1290
3.2
6446
7263
9.8
8518
0013
6 97
8111
628
4980
5973
6.6
7051
8723
2 83
1498
724.
8 -5
9122
6840
7 -2
9598
6005
0 -2
3182
5311
5
29
1466
1290
3.2
6139
7394
2.7
8193
5060
7 94
5507
907.
1 46
7361
039.
4 67
2737
703
7988
9500
3.8
-544
4907
367
-228
7122
347
-151
9358
111
30
1466
1290
3.2
5847
3708
8.2
7881
3725
0 91
3990
976.
8 43
8124
185
6415
2434
7 76
7378
073.
6 -5
0067
8318
2 -1
6455
9800
0 -7
5198
0037
31
1466
1290
3.2
5568
9246
5 75
8112
974
8835
2461
0.9
4102
7956
1.8
6115
0007
1 73
6911
707.
7 -4
5965
0362
1 -1
0340
9792
9 -1
5068
329.
8
32
1466
1290
3.2
5303
7377
6.2
7292
3248
0 85
4073
790.
6 38
3760
873
5826
1957
6 70
7460
887.
3 -4
2127
4274
8 - 45
1478
352.
6 69
2392
557.
5
33
1466
1290
3.2
5051
1788
2.1
7014
5219
5 82
5604
664.
2 35
8504
978.
9 55
4839
292
6789
9176
1 -3
8542
3776
9 10
3360
938.
9 13
7138
4319
34
1466
1290
3.2
4810
6464
9.6
6747
3020
6 79
8084
508.
7 33
4451
746.
4 52
8117
303
6514
7160
5.5
-351
9786
022
6314
7824
2.1
2022
8559
24
35
1466
1290
3.2
4581
5680
9.1
6490
2619
9 77
1481
691.
8 31
1543
905.
9 50
2413
295
6248
6878
8.6
-320
8242
116
1133
8915
37
2647
7247
13
36
1466
1290
3.2
4363
3981
8.2
6243
0139
1 74
5765
635.
4 28
9726
915
4776
8848
8 59
9152
732.
2 -2
9185
1520
1 16
1158
0025
32
4687
7445
37
1466
1290
3.2
4155
6173
1.6
6005
1848
1 72
0906
780.
9 26
8948
828.
4 45
3905
578
5742
9387
7.6
-264
9566
373
2065
4856
03
3821
1713
22

110
Tabl
e 66
(con
tinue
d)
Tim
e (y
rs)
Inve
stm
ent
($)
Rev
enue
w
no
inte
rest
ra
te ($
) R
even
ue w
1%
int r
ate
Rev
enue
w
1.5%
int
rate
Pr
ofit
w n
o
int r
ate
($)
Prof
it w
1%
in
t rat
e ($
)
Prof
it w
1.
5% in
t ra
te ($
) C
umul
ativ
e Pr
ofit
($)
38
1466
1290
3.2
3957
7307
7.8
5776
4158
6 69
6876
554.
8 24
9160
174.
5 43
1028
683
5502
6365
1.6
-240
0406
199
2496
5142
86
4371
4349
74
39
1466
1290
3.2
3769
2674
0.7
5556
3619
3 67
3647
336.
3 23
0313
837.
5 40
9023
289
5270
3443
3.1
-217
0092
361
2905
5375
75
4898
4694
07
40
1466
1290
3.2
3589
7784
8.3
5344
6910
0 65
1192
425.
1 21
2364
945.
1 38
7856
196
5045
7952
1.9
-195
7727
416
3293
3937
71
5403
0489
29
41
1466
1290
3.2
3418
8366
5.1
5141
0837
2 62
9486
011
1952
7076
1.8
3674
9546
9 48
2873
107.
7 -1
7624
5665
4 36
6088
9240
58
8592
2037
42
1466
1290
3.2
3256
0349
0.5
4945
2329
1 60
8503
143.
9 17
8990
587.
3 34
7910
388
4618
9024
0.7
-158
3466
067
4008
7996
28
6347
8122
77
43
1466
1290
3.2
3100
9856
2.4
4756
8430
9 58
8219
705.
8 16
3485
659.
2 32
9071
405
4416
0680
2.6
-141
9980
408
4337
8710
33
6789
4190
80
44
1466
1290
3.2
2953
3196
4.2
4575
6300
2 56
8612
382.
3 14
8719
061
3109
5009
8 42
1999
479.
1 -1
2712
6134
7 46
4882
1132
72
1141
8559
45
1466
1290
3.2
2812
6853
7.3
4401
3203
0 54
9658
636.
2 13
4655
634.
1 29
3519
127
4030
4573
3 -1
1366
0571
3 49
4234
0258
76
1446
4292
46
1466
1290
3.2
2678
7479
7.5
4233
6509
6 53
1336
681.
7 12
1261
894.
2 27
6752
192
3847
2377
8.4
-101
5343
818
5219
0924
51
7999
1880
71
47
1466
1290
3.2
2551
1885
4.7
4072
3690
1 51
3625
458.
9 10
8505
951.
5 26
0623
998
3670
1255
5.7
-906
8378
66.8
54
7971
6449
83
6620
0626
48
1466
1290
3.2
2429
7033
7.8
3917
2311
5 49
6504
610.
3 96
3574
34.6
1 24
5110
212
3498
9170
7.1
-810
4804
32.2
57
2482
6661
87
1609
2333
49
1466
1290
3.2
2314
0032
1.7
3768
0032
9 47
9954
456.
6 84
7874
18.5
2 23
0187
426
3333
4155
3.4
-725
6930
13.7
59
5501
4087
90
4943
3887
50
1466
1290
3.2
2203
8125
8.8
3624
4603
1 46
3955
974.
7 73
7683
55.5
8 21
5833
128
3173
4307
1.5
-651
9246
58.1
61
7084
7215
93
6677
6958
51
1466
1290
3.2
2098
8691
3.1
3486
3856
3 44
8490
775.
6 63
2740
09.9
2 20
2025
660
3018
7787
2.4
-588
6506
48.2
63
7287
2875
96
6865
4831
52
1466
1290
3.2
1998
9229
8.2
3353
5709
4 43
3541
083.
1 53
2793
95.0
1 18
8744
191
2869
2817
9.8
-535
3712
53.2
65
6161
7066
99
5558
3010
53
1466
1290
3.2
1903
7361
7.4
3225
8158
6 41
9089
713.
6 43
7607
14.1
4 17
5968
683
2724
7681
0.4
-491
6105
39
6737
5857
49
1022
8059
821
54
1466
1290
3.2
1813
0820
7 31
0292
764
4051
2005
6.5
3469
5303
.79
1636
7986
0 25
8507
153.
3 -4
5691
5235
.2
6901
2656
09
1048
6566
974
55
1466
1290
3.2
1726
7448
2.9
2984
7208
7 39
1616
054.
6 26
0615
79.6
5 15
1859
184
2450
0315
1.4
-430
8536
55.6
70
5312
4793
10
7315
7012
6
56
1466
1290
3.2
1644
5188
8.5
2871
0172
2 37
8562
186.
1 17
8389
85.2
2 14
0488
818
2319
4928
2.9
-413
0146
70.4
71
9361
3611
10
9635
1940
8
57
1466
1290
3.2
1566
2084
6.1
2761
6451
3 36
5943
446.
6 10
0079
42.9
2 12
9551
610
2193
3054
3.4
-403
0067
27.5
73
2316
5221
11
1828
4995
2
58
1466
1290
3.2
1491
6271
0.6
2656
4396
0 35
3745
331.
7 25
4980
7.38
7 11
9031
057
2071
3242
8.5
-400
4569
20.1
74
4219
6278
11
3899
8238
0
59
1466
1290
3.2
1420
5972
4.4
2555
2419
0 34
1953
820.
7 -4
5531
78.8
33
1089
1128
7 19
5340
917.
4 -4
0501
0098
.9
7551
1075
65
1158
5323
298
60
1466
1290
3.2
1352
9497
5.6
2457
8993
6 33
0555
360
-113
1792
7.61
99
1770
32.3
18
3942
456.
7 -4
1632
8026
.5
7650
2845
97
1176
9265
754
61
1466
1290
3.2
1288
5235
7.7
2364
2650
9 31
9536
848
-177
6054
5.5
8981
3606
.2
1729
2394
4.7
-434
0885
72
7740
0982
04
1194
2189
699

111
Tabl
e 66
(con
tinue
d)
Tim
e (y
rs)
Inve
stm
ent
($)
Rev
enue
w
no
inte
rest
ra
te ($
) R
even
ue w
1%
int r
ate
Rev
enue
w
1.5%
int
rate
Pr
ofit
w n
o
int r
ate
($)
Prof
it w
1%
in
t rat
e ($
)
Prof
it w
1.
5% in
t ra
te ($
) C
umul
ativ
e Pr
ofit
($)
62
1466
1290
3.2
1227
1653
1.2
2274
1978
5 30
8885
619.
7 -2
3896
372.
06
8080
6882
16
2272
716.
5 -4
5798
4944
.1
7820
9050
86
1210
4462
416
63
1466
1290
3.2
1168
7288
6.8
2187
5617
4 29
8589
432.
4 -2
9740
016.
4 72
1432
71.2
15
1976
529.
2 -4
8772
4960
.5
7893
0483
57
1225
6438
945
64
1466
1290
3.2
1113
0751
1.3
2104
2260
6 28
8636
451.
3 -3
5305
391.
96
6380
9702
.6
1420
2354
8.1
-523
0303
52.4
79
5685
8059
12
3984
6249
3
65
1466
1290
3.2
1060
0715
3.6
2024
0650
7 27
9015
236.
3 -4
0605
749.
64
5579
3603
.3
1324
0233
3 -5
6363
6102
.1
8012
6516
63
1253
0864
826
66
1466
1290
3.2
1009
5919
3.9
1946
9578
3 26
9714
728.
4 -4
5653
709.
34
4808
2879
.3
1231
0182
5.2
-609
2898
11.4
80
6073
4542
12
6539
6665
1
67
1466
1290
3.2
9615
1613
.23
1872
7880
0 26
0724
237.
4 -5
0461
290
4066
5897
.1
1141
1133
4.2
-659
7511
01.4
81
0140
0439
12
7680
7798
5
68
1466
1290
3.2
9157
2964
.98
1801
4437
0 25
2033
429.
5 -5
5039
938.
25
3353
1466
.6
1054
2052
6.3
-714
7910
39.7
81
3493
1906
12
8734
9851
2
69
1466
1290
3.2
8721
2347
.6
1732
8172
7 24
3632
315.
2 -5
9400
555.
63
2666
8823
.9
9701
9411
.98
-774
1915
95.3
81
6160
0730
12
9705
1792
4
70
1466
1290
3.2
8305
9378
.67
1666
8051
9 23
5511
238
-635
5352
4.56
20
0676
15.3
88
8983
34.8
-8
3774
5119
.8
8181
6683
45
1305
9416
258
71
1466
1290
3.2
7910
4170
.16
1603
3078
4 22
7660
863.
4 -6
7508
733.
07
1371
7881
.2
8104
7960
.2
-905
2538
52.9
81
9538
6226
13
1404
6421
9
72
1099
5967
7.4
5650
2978
.68
1156
6720
9 16
5054
126
-534
5669
8.74
57
0753
1.38
55
0944
48.5
7 -9
5871
0551
.6
8201
0937
58
1319
5558
667
73
7330
6451
.61
3587
4907
.1
7417
3892
.6
1063
6821
4.5
-374
3154
4.51
86
7441
.012
33
0617
62.9
1 -9
9614
2096
.2
8201
9611
99
1322
8620
430
74
3665
3225
.81
1708
3289
.1
3567
4110
.3
5141
1303
.69
-195
6993
6.71
- 97
9115
.544
14
7580
77.8
8 -1
0157
1203
3 82
0098
2083
13
2433
7850
8
75
8778
0433
-8
7780
433
-877
8043
3 -8
7780
433
-110
3492
466
8113
2016
50
1315
5598
075
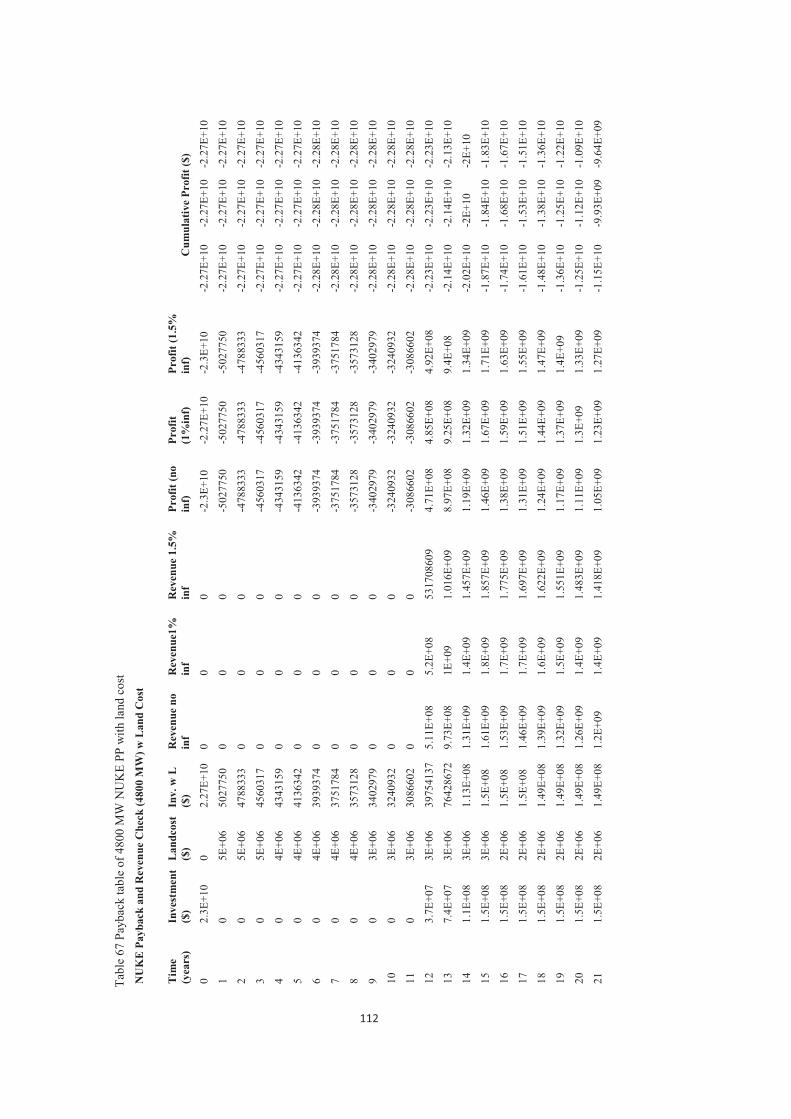
112
Tabl
e 67
Pay
back
tabl
e of
480
0 M
W N
UK
E PP
with
land
cos
t N
UK
E P
ayba
ck a
nd R
even
ue C
heck
(480
0 M
W) w
Lan
d C
ost
Tim
e
(yea
rs)
Inve
stm
ent
($)
Lan
dcos
t ($
) In
v. w
L
($)
Rev
enue
no
inf
Rev
enue
1%
inf
Rev
enue
1.5
%
inf
Prof
it (n
o in
f)
Prof
it (1
%in
f)
Prof
it (1
.5%
in
f)
Cum
ulat
ive
Prof
it ($
) 0
2.3E
+10
0 2.
27E+
10
0 0
0 -2
.3E+
10
-2.2
7E+1
0 -2
.3E+
10
-2.2
7E+1
0 -2
.27E
+10
-2.2
7E+1
0
1 0
5E+0
6 50
2775
0 0
0 0
-502
7750
-5
0277
50
-502
7750
-2
.27E
+10
-2.2
7E+1
0 -2
.27E
+10
2 0
5E+0
6 47
8833
3 0
0 0
-478
8333
-4
7883
33
-478
8333
-2
.27E
+10
-2.2
7E+1
0 -2
.27E
+10
3 0
5E+0
6 45
6031
7 0
0 0
-456
0317
-4
5603
17
-456
0317
-2
.27E
+10
-2.2
7E+1
0 -2
.27E
+10
4 0
4E+0
6 43
4315
9 0
0 0
-434
3159
-4
3431
59
-434
3159
-2
.27E
+10
-2.2
7E+1
0 -2
.27E
+10
5 0
4E+0
6 41
3634
2 0
0 0
-413
6342
-4
1363
42
-413
6342
-2
.27E
+10
-2.2
7E+1
0 -2
.27E
+10
6 0
4E+0
6 39
3937
4 0
0 0
-393
9374
-3
9393
74
-393
9374
-2
.28E
+10
-2.2
8E+1
0 -2
.28E
+10
7 0
4E+0
6 37
5178
4 0
0 0
-375
1784
-3
7517
84
-375
1784
-2
.28E
+10
-2.2
8E+1
0 -2
.28E
+10
8 0
4E+0
6 35
7312
8 0
0 0
-357
3128
-3
5731
28
-357
3128
-2
.28E
+10
-2.2
8E+1
0 -2
.28E
+10
9 0
3E+0
6 34
0297
9 0
0 0
-340
2979
-3
4029
79
-340
2979
-2
.28E
+10
-2.2
8E+1
0 -2
.28E
+10
10
0 3E
+06
3240
932
0 0
0 -3
2409
32
-324
0932
-3
2409
32
-2.2
8E+1
0 -2
.28E
+10
-2.2
8E+1
0
11
0 3E
+06
3086
602
0 0
0 -3
0866
02
-308
6602
-3
0866
02
-2.2
8E+1
0 -2
.28E
+10
-2.2
8E+1
0
12
3.7E
+07
3E+0
6 39
7541
37
5.11
E+08
5.
2E+0
8 53
1708
609
4.71
E+08
4.
85E+
08
4.92
E+08
-2
.23E
+10
-2.2
3E+1
0 -2
.23E
+10
13
7.4E
+07
3E+0
6 76
4286
72
9.73
E+08
1E
+09
1.01
6E+0
9 8.
97E+
08
9.25
E+08
9.
4E+0
8 -2
.14E
+10
-2.1
4E+1
0 -2
.13E
+10
14
1.1E
+08
3E+0
6 1.
13E+
08
1.31
E+09
1.
4E+0
9 1.
457E
+09
1.19
E+09
1.
32E+
09
1.34
E+09
-2
.02E
+10
-2E+
10
-2E+
10
15
1.5E
+08
3E+0
6 1.
5E+0
8 1.
61E+
09
1.8E
+09
1.85
7E+0
9 1.
46E+
09
1.67
E+09
1.
71E+
09
-1.8
7E+1
0 -1
.84E
+10
-1.8
3E+1
0
16
1.5E
+08
2E+0
6 1.
5E+0
8 1.
53E+
09
1.7E
+09
1.77
5E+0
9 1.
38E+
09
1.59
E+09
1.
63E+
09
-1.7
4E+1
0 -1
.68E
+10
-1.6
7E+1
0
17
1.5E
+08
2E+0
6 1.
5E+0
8 1.
46E+
09
1.7E
+09
1.69
7E+0
9 1.
31E+
09
1.51
E+09
1.
55E+
09
-1.6
1E+1
0 -1
.53E
+10
-1.5
1E+1
0
18
1.5E
+08
2E+0
6 1.
49E+
08
1.39
E+09
1.
6E+0
9 1.
622E
+09
1.24
E+09
1.
44E+
09
1.47
E+09
-1
.48E
+10
-1.3
8E+1
0 -1
.36E
+10
19
1.5E
+08
2E+0
6 1.
49E+
08
1.32
E+09
1.
5E+0
9 1.
551E
+09
1.17
E+09
1.
37E+
09
1.4E
+09
-1.3
6E+1
0 -1
.25E
+10
-1.2
2E+1
0
20
1.5E
+08
2E+0
6 1.
49E+
08
1.26
E+09
1.
4E+0
9 1.
483E
+09
1.11
E+09
1.
3E+0
9 1.
33E+
09
-1.2
5E+1
0 -1
.12E
+10
-1.0
9E+1
0
21
1.5E
+08
2E+0
6 1.
49E+
08
1.2E
+09
1.4E
+09
1.41
8E+0
9 1.
05E+
09
1.23
E+09
1.
27E+
09
-1.1
5E+1
0 -9
.93E
+09
-9.6
4E+0
9

113
Tabl
e 67
(con
tinue
d)
Tim
e
(yea
rs)
Inve
stm
ent
($)
Lan
dcos
t ($
) In
v. w
L
($)
Rev
enue
no
inf
Rev
enue
1%
inf
Rev
enue
1.5
%
inf
Prof
it (n
o in
f)
Prof
it (1
%in
f)
Prof
it (1
.5%
in
f)
Cum
ulat
ive
Prof
it ($
) 22
1.
5E+0
8 2E
+06
1.49
E+08
1.
14E+
09
1.3E
+09
1.35
5E+0
9 9.
94E+
08
1.17
E+09
1.
21E+
09
-1.0
5E+1
0 -8
.76E
+09
-8.4
3E+0
9
23
1.5E
+08
2E+0
6 1.
49E+
08
1.09
E+09
1.
3E+0
9 1.
296E
+09
9.4E
+08
1.11
E+09
1.
15E+
09
-9.5
4E+0
9 -7
.65E
+09
-7.2
8E+0
9
24
1.5E
+08
2E+0
6 1.
49E+
08
1.04
E+09
1.
2E+0
9 1.
239E
+09
8.88
E+08
1.
05E+
09
1.09
E+09
-8
.66E
+09
-6.5
9E+0
9 -6
.19E
+09
25
1.5E
+08
2E+0
6 1.
49E+
08
9.88
E+08
1.
1E+0
9 1.
185E
+09
8.39
E+08
9.
99E+
08
1.04
E+09
-7
.82E
+09
-5.6
E+09
-5
.16E
+09
26
1.5E
+08
1E+0
6 1.
49E+
08
9.41
E+08
1.
1E+0
9 1.
133E
+09
7.92
E+08
9.
47E+
08
9.85
E+08
-7
.03E
+09
-4.6
5E+0
9 -4
.17E
+09
27
1.5E
+08
1E+0
6 1.
49E+
08
6.77
E+08
1E
+09
1.08
4E+0
9 5.
28E+
08
8.97
E+08
9.
35E+
08
-6.5
E+09
-3
.75E
+09
-3.2
4E+0
9
28
1.5E
+08
1E+0
6 1.
49E+
08
6.45
E+08
8.
5E+0
8 97
8111
628
4.96
E+08
7.
03E+
08
8.3E
+08
-6E+
09
-3.0
5E+0
9 -2
.41E
+09
29
1.5E
+08
1E+0
6 1.
49E+
08
6.14
E+08
8.
2E+0
8 94
5507
907
4.65
E+08
6.
71E+
08
7.97
E+08
-5
.54E
+09
-2.3
8E+0
9 -1
.61E
+09
30
1.5E
+08
1E+0
6 1.
48E+
08
5.85
E+08
7.
9E+0
8 91
3990
977
4.36
E+08
6.
4E+0
8 7.
66E+
08
-5.1
E+09
-1
.74E
+09
-8.4
4E+0
8
31
1.5E
+08
1E+0
6 1.
48E+
08
5.57
E+08
7.
6E+0
8 88
3524
611
4.08
E+08
6.
1E+0
8 7.
35E+
08
-4.6
9E+0
9 -1
.13E
+09
-1.0
9E+0
8
32
1.5E
+08
1E+0
6 1.
48E+
08
5.3E
+08
7.3E
+08
8540
7379
1 3.
82E+
08
5.81
E+08
7.
06E+
08
-4.3
1E+0
9 -5
.47E
+08
5963
8740
9
33
1.5E
+08
1E+0
6 1.
48E+
08
5.05
E+08
7E
+08
8256
0466
4 3.
57E+
08
5.53
E+08
6.
77E+
08
-3.9
5E+0
9 56
5547
4.8
1.27
4E+0
9
34
1.5E
+08
1E+0
6 1.
48E+
08
4.81
E+08
6.
7E+0
8 79
8084
509
3.33
E+08
5.
26E+
08
6.5E
+08
-3.6
2E+0
9 53
2122
708
1.92
4E+0
9
35
1.5E
+08
1E+0
6 1.
48E+
08
4.58
E+08
6.
5E+0
8 77
1481
692
3.1E
+08
5.01
E+08
6.
23E+
08
-3.3
1E+0
9 1.
033E
+09
2.54
7E+0
9
36
1.5E
+08
9E+0
5 1.
48E+
08
4.36
E+08
6.
2E+0
8 74
5765
635
2.88
E+08
4.
76E+
08
5.98
E+08
-3
.02E
+09
1.50
9E+0
9 3.
144E
+09
37
1.5E
+08
9E+0
5 1.
48E+
08
4.16
E+08
6E
+08
7209
0678
1 2.
67E+
08
4.52
E+08
5.
73E+
08
-2.7
5E+0
9 1.
961E
+09
3.71
7E+0
9
38
1.5E
+08
8E+0
5 1.
48E+
08
3.96
E+08
5.
8E+0
8 69
6876
555
2.48
E+08
4.
3E+0
8 5.
49E+
08
-2.5
1E+0
9 2.
391E
+09
4.26
6E+0
9
39
1.5E
+08
8E+0
5 1.
48E+
08
3.77
E+08
5.
6E+0
8 67
3647
336
2.29
E+08
4.
08E+
08
5.26
E+08
-2
.28E
+09
2.79
9E+0
9 4.
792E
+09
40
1.5E
+08
7E+0
5 1.
48E+
08
3.59
E+08
5.
3E+0
8 65
1192
425
2.11
E+08
3.
86E+
08
5.03
E+08
-2
.07E
+09
3.18
5E+0
9 5.
295E
+09
41
1.5E
+08
7E+0
5 1.
48E+
08
3.42
E+08
5.
1E+0
8 62
9486
011
1.94
E+08
3.
66E+
08
4.82
E+08
-1
.87E
+09
3.55
1E+0
9 5.
776E
+09
42
1.5E
+08
7E+0
5 1.
48E+
08
3.26
E+08
4.
9E+0
8 60
8503
144
1.78
E+08
3.
47E+
08
4.61
E+08
-1
.69E
+09
3.89
8E+0
9 6.
237E
+09
43
1.5E
+08
6E+0
5 1.
48E+
08
3.1E
+08
4.8E
+08
5882
1970
6 1.
62E+
08
3.28
E+08
4.
4E+0
8 -1
.53E
+09
4.22
6E+0
9 6.
677E
+09
44
1.5E
+08
6E+0
5 1.
48E+
08
2.95
E+08
4.
6E+0
8 56
8612
382
1.47
E+08
3.
1E+0
8 4.
21E+
08
-1.3
8E+0
9 4.
535E
+09
7.09
8E+0
9
45
1.5E
+08
6E+0
5 1.
48E+
08
2.81
E+08
4.
4E+0
8 54
9658
636
1.33
E+08
2.
92E+
08
4.02
E+08
-1
.25E
+09
4.82
8E+0
9 7.
5E+0
9
46
1.5E
+08
6E+0
5 1.
48E+
08
2.68
E+08
4.
2E+0
8 53
1336
682
1.2E
+08
2.76
E+08
3.
84E+
08
-1.1
3E+0
9 5.
103E
+09
7.88
3E+0
9

114
Tabl
e 67
(con
tinue
d)
T
ime
(y
ears
) In
vest
men
t ($
) L
andc
ost
($)
Inv.
w L
($
) R
even
ue n
o in
f R
even
ue1%
in
f R
even
ue 1
.5%
in
f Pr
ofit
(no
inf)
Pr
ofit
(1%
inf)
Pr
ofit
(1.5
%
inf)
C
umul
ativ
e Pr
ofit
($)
47
1.5E
+08
5E+0
5 1.
48E+
08
2.55
E+08
4.
1E+0
8 51
3625
459
1.07
E+08
2.
59E+
08
3.66
E+08
-1
.02E
+09
5.36
3E+0
9 8.
249E
+09
48
1.5E
+08
5E+0
5 1.
48E+
08
2.43
E+08
3.
9E+0
8 49
6504
610
9520
4726
2.
44E+
08
3.49
E+08
-9
.29E
+08
5.60
6E+0
9 8.
598E
+09
49
1.5E
+08
5E+0
5 1.
48E+
08
2.31
E+08
3.
8E+0
8 47
9954
457
8365
8879
2.
29E+
08
3.32
E+08
-8
.45E
+08
5.83
6E+0
9 8.
93E+
09
50
1.5E
+08
5E+0
5 1.
48E+
08
2.2E
+08
3.6E
+08
4639
5597
5 72
6628
34
2.15
E+08
3.
16E+
08
-7.7
2E+0
8 6.
05E+
09
9.24
6E+0
9
51
1.5E
+08
4E+0
5 1.
48E+
08
2.1E
+08
3.5E
+08
4484
9077
6 62
1904
10
2.01
E+08
3.
01E+
08
-7.1
E+08
6.
251E
+09
9.54
7E+0
9
52
1.5E
+08
4E+0
5 1.
48E+
08
2E+0
8 3.
4E+0
8 43
3541
083
5221
6673
1.
88E+
08
2.86
E+08
-6
.58E
+08
6.43
9E+0
9 9.
833E
+09
53
1.5E
+08
4E+0
5 1.
48E+
08
1.9E
+08
3.2E
+08
4190
8971
4 42
7178
76
1.75
E+08
2.
71E+
08
-6.1
5E+0
8 6.
614E
+09
1.01
E+10
54
1.5E
+08
4E+0
5 1.
48E+
08
1.81
E+08
3.
1E+0
8 40
5120
057
3367
1403
1.
63E+
08
2.57
E+08
-5
.82E
+08
6.77
6E+0
9 1.
036E
+10
55
1.5E
+08
4E+0
5 1.
48E+
08
1.73
E+08
3E
+08
3916
1605
5 25
0557
14
1.51
E+08
2.
44E+
08
-5.5
7E+0
8 6.
927E
+09
1.06
1E+1
0
56
1.5E
+08
3E+0
5 1.
48E+
08
1.64
E+08
2.
9E+0
8 37
8562
186
1685
0296
1.
4E+0
8 2.
31E+
08
-5.4
E+08
7.
067E
+09
1.08
4E+1
0
57
1.5E
+08
3E+0
5 1.
48E+
08
1.57
E+08
2.
8E+0
8 36
5943
447
9035
612
1.29
E+08
2.
18E+
08
-5.3
1E+0
8 7.
195E
+09
1.10
6E+1
0
58
1.5E
+08
3E+0
5 1.
48E+
08
1.49
E+08
2.
7E+0
8 35
3745
332
1593
056
1.18
E+08
2.
06E+
08
-5.2
9E+0
8 7.
313E
+09
1.12
6E+1
0
59
1.5E
+08
3E+0
5 1.
48E+
08
1.42
E+08
2.
6E+0
8 34
1953
821
-549
5093
1.
08E+
08
1.94
E+08
-5
.35E
+08
7.42
1E+0
9 1.
146E
+10
60
1.5E
+08
3E+0
5 1.
48E+
08
1.35
E+08
2.
5E+0
8 33
0555
360
-1.2
E+07
98
2492
50
1.83
E+08
-5
.47E
+08
7.52
E+09
1.
164E
+10
61
1.5E
+08
3E+0
5 1.
48E+
08
1.29
E+08
2.
4E+0
8 31
9536
848
-1.9
E+07
88
8992
82
1.72
E+08
-5
.66E
+08
7.60
9E+0
9 1.
181E
+10
62
1.5E
+08
3E+0
5 1.
48E+
08
1.23
E+08
2.
3E+0
8 30
8885
620
-2.5
E+07
79
9053
75
1.61
E+08
-5
.9E+
08
7.68
9E+0
9 1.
197E
+10
63
1.5E
+08
2E+0
5 1.
48E+
08
1.17
E+08
2.
2E+0
8 29
8589
432
-3.1
E+07
71
2539
71
1.51
E+08
-6
.21E
+08
7.76
E+09
1.
212E
+10
64
1.5E
+08
2E+0
5 1.
47E+
08
1.11
E+08
2.
1E+0
8 28
8636
451
-3.6
E+07
62
9320
28
1.41
E+08
-6
.57E
+08
7.82
3E+0
9 1.
226E
+10
65
1.5E
+08
2E+0
5 1.
47E+
08
1.06
E+08
2E
+08
2790
1523
6 -4
.1E+
07
5492
7001
1.
32E+
08
-6.9
9E+0
8 7.
878E
+09
1.24
E+10
66
1.5E
+08
2E+0
5 1.
47E+
08
1.01
E+08
1.
9E+0
8 26
9714
728
-4.7
E+07
47
2268
22
1.22
E+08
-7
.45E
+08
7.92
5E+0
9 1.
252E
+10
67
1.5E
+08
2E+0
5 1.
47E+
08
9615
1613
1.
9E+0
8 26
0724
237
-5.1
E+07
39
8198
82
1.13
E+08
-7
.96E
+08
7.96
5E+0
9 1.
263E
+10
68
1.5E
+08
2E+0
5 1.
47E+
08
9157
2965
1.
8E+0
8 25
2033
430
-5.6
E+07
32
6950
16
1.05
E+08
-8
.52E
+08
7.99
7E+0
9 1.
274E
+10
69
1.5E
+08
2E+0
5 1.
47E+
08
8721
2348
1.
7E+0
8 24
3632
315
-6E+
07
2584
1482
96
1920
70
-9.1
3E+0
8 8.
023E
+09
1.28
3E+1
0
70
1.5E
+08
2E+0
5 1.
47E+
08
8305
9379
1.
7E+0
8 23
5511
238
-6.4
E+07
19
2489
49
8807
9668
-9
.77E
+08
8.04
2E+0
9 1.
292E
+10
71
1.5E
+08
2E+0
5 1.
47E+
08
7910
4170
1.
6E+0
8 22
7660
863
-6.8
E+07
12
9074
77
8023
7556
-1
.05E
+09
8.05
5E+0
9 1.
3E+1
0

115
Tabl
e 67
(con
tinue
d)
Tim
e
(yea
rs)
Inve
stm
ent
($)
Lan
dcos
t ($
) In
v. w
L
($)
Rev
enue
no
inf
Rev
enue
1%
inf
Rev
enue
1.5
%
inf
Prof
it (n
o in
f)
Prof
it (1
%in
f)
Prof
it (1
.5%
in
f)
Cum
ulat
ive
Prof
it ($
) 72
1.
1E+0
8 2E
+05
1.11
E+08
56
5029
79
1.2E
+08
1650
5412
6 -5
.4E+
07
5066
286
5445
3203
-1
.1E+
09
8.06
E+09
1.
305E
+10
73
7.4E
+07
1E+0
5 73
7789
12
3587
4907
7.
4E+0
7 10
6368
215
-3.8
E+07
39
4980
.2
3258
9302
-1
.14E
+09
8.06
1E+0
9 1.
309E
+10
74
3.7E
+07
1E+0
5 36
9572
59
1708
3289
3.
6E+0
7 51
4113
04
-2E+
07
-128
3149
14
4540
45
-1.1
6E+0
9 8.
06E+
09
1.31
E+10
75
8.8E
+07
1E+0
5 87
9163
79
0 -8
.8E+
07
-879
1637
9 -8
.8E+
07
-1.2
5E+0
9 7.
972E
+09
1.30
1E+1
0
Then
, the
pay
back
tim
es o
f 480
0 M
W N
UK
E PP
for d
iffer
ent o
ptio
ns a
re sh
own
in T
able
68.
Ta
ble
68 P
ayba
ck ti
mes
for N
UK
E
C
ost w
ith la
nd c
ost
Cos
t w/o
land
cos
t Pa
ybac
k tim
e w
ith 5
% d
isco
unt r
ate
w/o
infla
tion
rate
N
o pa
ybac
k N
o pa
ybac
k Pa
ybac
k tim
e w
ith 1
% in
flatio
n ra
te
32.5
0 ye
ars
32.4
5 ye
ars
Payb
ack
time
with
1.5
infla
tion
rate
31
.20
year
s 31
.15
year
s

116
Th
e el
igib
ility
com
paris
on o
f PV
and
NU
KE
for T
urke
y w
ithin
the
cont
ext o
f det
erm
ined
circ
umst
ance
s is g
iven
in
Tab
le 6
9.
Tabl
e 69
Fin
al c
ompa
rison
tabl
e T
echn
olog
y PV
N
UK
E
Com
men
ts, E
xpla
natio
ns, U
nits
CHAPTER 3
OUTCOMES AND RESULTS
Inst
alle
d Po
wer
48
00 M
W
4800
MW
PV
has
480
0 PP
s eac
h ha
ving
1 M
W in
stal
led
pow
er
NU
KE
has 1
PP
with
4 u
nits
Proj
ect D
urat
ion
31 y
ears
10
1 ye
ars
PV, c
onst
ruct
ion
and
deco
mm
issi
onin
g w
ill b
e co
mpl
eted
in
a y
ear
NU
KE,
4 y
ears
pre
para
tion
+ 7
year
s con
stru
ctio
n +
60
year
s ope
ratio
n +
30 y
ears
dec
omm
issi
onin
g
Life
time
30
60
year
s
Tota
l Cos
t with
land
cos
t 10
.91
32.0
6 B
illio
n $
Tota
l Cos
t with
out l
and
cost
5.
63
31.9
1 B
illio
n $
Elec
trici
ty P
rodu
ctio
n 21
5.51
19
20.6
7 TW
h
NPV
of E
lect
ricity
Pr
oduc
tion
110.
45
347.
36
TWh

117
Tabl
e 69
(con
tinue
d)
Tec
hnol
ogy
PV
NU
KE
C
omm
ents
, Exp
lana
tions
, Uni
ts
LCO
E w
ith la
nd c
ost
98.7
4 92
.30
$/M
Wh
LCO
E w
/o la
nd c
ost
51.0
2 92
$/
MW
h
Tota
l Are
a N
eede
d 48
.47
11.8
3 km
2
CO
2 re
duct
ion
pote
ntia
l 0.
6031
0.
5459
t C
O2/M
Wh
Cum
ulat
ive
CO
2 red
uctio
n 12
9,97
5,05
5 1,
048,
482,
824
t CO
2
Rev
enue
14
.94
30.5
0 39
.72
44.7
7 PV
: with
2 o
ptio
ns a
nd 3
ele
ctric
ity p
rice
vers
ions
; B
oth:
Bill
ion
$, p
rice
with
5%
dis
coun
t rat
e 11
.75
12.6
1 13
.11
Payb
ack
(with
land
cos
t) 11
.86
No
payb
ack
32.5
0 31
.20
PV: w
ith 2
opt
ions
and
3 e
lect
ricity
pric
e ve
rsio
ns;
Bot
h: Y
ears
, with
5%
dis
coun
t rat
e 24
.77
14.8
1 14
.10
Payb
ack
(with
out l
and
cost
) 4.
97
No
payb
ack
32.4
5 31
.15
PV: w
ith 2
opt
ions
and
3 e
lect
ricity
pric
e ve
rsio
ns;
Bot
h: Y
ears
, with
5%
dis
coun
t rat
e

118
Tabl
e 70
Mat
eria
l use
com
paris
on o
f the
opt
ions
, nam
ely
PV a
nd N
UK
E N
UK
E
Use
d M
ater
ial
Uni
t A
mou
nt
Use
d M
ater
ial
Uni
t A
mou
nt
Ura
nium
fuel
stic
ks
unit
50,5
86
Was
tew
ater
con
sum
ptio
n m
3 /day
s 1,
881
Ura
nium
dio
xide
kg
5,
382,
000
Fres
hwat
er re
quire
men
t m
3 /hou
rs
507
Coo
ling
wat
er u
se
m3 /h
ours
880,
000
Tap
wat
er re
quire
men
t m
3 /day
s 92
Drin
king
and
usi
ng w
ater
use
45
0 D
omes
tic so
lid w
aste
kg
/day
10
,738
Indu
stria
l wat
er u
se
342
CO
2 (fo
ssil)
kg/y
ear
199,
143,
360
Upr
oote
d tre
es
unit
516
CH
4 (f
ossi
l) 34
3,69
9
Cem
ent
m3
2,00
0,00
0 N
Ox
1,02
7,72
8
Stee
l kg
50
0,00
0,00
0 N
MV
OC
24
7,66
6
Exca
vatio
n w
aste
m
3 12
,600
,000
SO
2 92
3,27
0
Car
bon-
14
kBq/
year
1.72
E+09
PM
2,5
-10
80,5
33
Iodi
ne-1
29
1,78
2,51
8 PM
2,5
15
7,69
7
Rad
on-2
22
2.62
E+13
PV
Mat
eria
l U
nit
Am
ount
M
ater
ial
Uni
t A
mou
nt
Elec
trici
ty
kWh
2,63
0,88
9,20
0 Te
mpe
ring
kg
282,
268,
800
Nat
ural
gas
M
J 2,
052,
321,
600
Wire
dra
win
g 3,
158,
400

119
Tabl
e 70
(con
tinue
d)
Mat
eria
l U
nit
Am
ount
M
ater
ial
Uni
t A
mou
nt
Ligh
t Fue
l Oil
MJ
30,2
16,0
00
Alu
min
um a
lloy
kg
73,5
02,4
00
Wat
er
kg
3,45
2,88
0,00
0 N
icke
l 4,
800
Bra
zing
Sol
der
244,
800
Poly
viny
lace
tate
3,
072,
000
Sola
r Gla
ss
282,
268,
800
Poly
ethy
lene
Ter
epht
hala
te
10,4
25,6
00
Cop
per
kg
3,15
8,40
0 Si
licon
Pro
duct
3,
408,
000
Gla
ss F
ibre
rein
forc
ed p
last
ic
5,25
6,00
0 A
ceto
ne
1,56
0,00
0
Ethy
lvin
ylac
etat
e 27
,945
,600
M
etha
nol
62,4
00
Vin
yl A
ceta
te
48,0
00
Fluo
rine
1
Lubr
icat
ing
Oil
43,2
00
Met
alliz
atio
n pa
ste
321,
600
Cor
ruga
ted
Boa
rd
30,7
44,0
00
Met
alliz
atio
n pa
ste
back
side
alu
min
um
1,87
2,00
0
1-pr
opan
ol
225,
600
Am
mon
ia
177,
600
Dis
posa
l, m
unic
ipal
was
te
840,
000
Phos
phor
ic A
cid
201,
600
Dis
posa
l, po
lyvi
nylfl
ourid
e 3,
072,
000
Phos
phor
yl C
hlor
ide
43,2
00
Dis
posa
l, pl
astic
s 47
,232
,000
Ti
tani
um D
ioxi
de
38
Dis
posa
l, us
ed m
iner
al o
il 43
,200
Et
hano
l fro
m e
thyl
ene
14,4
00
Isop
ropa
nol
2,05
4,40
0 H
Cl
4490
0

120
Tabl
e 70
(con
tinue
d)
Mat
eria
l U
nit
Am
ount
M
ater
ial
Uni
t A
mou
nt
Solv
ents
kg
38,4
00
Poly
ethy
lene
kg
3,84
0
Silic
one
prod
uct
33,6
00
Trye
thyl
ene
glyc
ol
71,7
84,0
00
Soci
um si
licat
e 1,
948,
800
dipr
opyl
ene
Gly
col M
onom
ethy
l Eth
er
8,28
4,80
0
Cal
cium
chl
orid
e 56
1,60
0 A
lkyl
benz
ene
sulfo
nate
6,
624,
000
Ace
tic a
cid
4,91
0,00
0 A
cryl
ic b
inde
r 57
,600
Hyd
roch
loric
aci
d 1,
190,
000
Gla
ss w
ool m
at
278,
400
Hyd
roge
n Fl
ourid
e 2,
200,
000
Pape
r 5,
246,
400
Nitr
ic A
cid
2,96
0,00
0 Po
lyst
yren
e 5,
520,
000
Sodi
um H
ydro
xide
5,
090,
000
Pack
agin
g fil
m
2,76
0,00
0
Arg
on
142,
000
Bra
ss
206,
400
Oxy
gen
2,66
0,00
0 St
eel
40,8
62,4
00
Silic
on C
arbi
de
59,1
00,0
00
Wire
dra
win
g 41
,140
,800
NaO
H
7,71
0 D
OC
1,
310,
400
Dis
posa
l 3,
038,
400
TOC
1,
310,
400
Gra
phite
3,
840
Alu
min
um
38
AO
X
14,4
00
Cer
amic
Tie
s 8,
208,
000

121
Tabl
e 70
(con
tinue
d)
Mat
eria
l U
nit
Am
ount
M
ater
ial
Uni
t A
mou
nt
Cad
miu
m
kg
1E-2
Li
me
kg
4,66
5,60
0
Chr
omiu
m
2E-1
Fl
ourid
e 57
,600
CO
D
4,04
6,40
0 H
ydro
carb
ons
556,
800
Cop
per
3,15
8,40
0 H
ydro
xide
18
2,40
0
Lead
96
0 N
itrog
en
220,
800
Mer
cury
14
4 H
l 1,
046,
400
Nic
kel
1,44
0 C
hlor
ide
897,
600
Nitr
ogen
27
8,40
0 So
dium
13
4,40
0
Phos
phat
e 14
,400
Zi
nc
432
BO
D5
3,85
4,40
0 Ir
on
240
Woo
d Sc
raps
38
,400
,000
,000
B
oron
10
Cha
rcoa
l 4,
593,
600
Hyd
roge
n Su
lfide
14
,400
Cok
e 10
,464
,000
C
alci
um
19
CO
2 10
8,00
0,00
0 A
ntim
ony
192
CO
52
,800
C
hlor
ine
2
Ars
enic
2E
-01
Cya
nide
19
2

122

123
CHAPTER 4
CONCLUSION AND DISCUSSIONS
The physical mechanisms behind the solar and nuclear energy are somewhat
similar mechanisms, as both are the nuclear reactions. Solar energy which is the
input of PV PP and originated and sourced by the sun has working principle based on
nuclear reactions (fusion). A different type of nuclear reaction (fission) is used in
NUKE PP’s.
This study deals with the selection of better option to be invested in order to
contribute to meet the electricity needs of Turkey. The options, PV and NUKE, are
compared through their costs, electricity production amounts, CO2 reduction
potantials, material uses, environmental affectabilities, required land amounts,
payback times, revenues and profits, life time and project durations. The scenario of
the study stems from the comparison of above mentioned parameters by sticking to
fixed 4800 MW installed for both options.
Long story short, following outputs are determined owing to this study:
While PV has 31 years project duration with 30 years operation and about 1 year
commission and decommission, NUKE has 101 years, 4 years of which is
allocated to preparation period, 11 years for construction period and 30 years for
decommissioning. NUKE has 60 years operation lifetime.
4800 MW PV PP’s have cumulative 10.91 billion $ cost if the land cost is taken
into account. If not, this amount decreases to 5.63 billion $. The moral of a story,
the location of ESIZ where PV PP is established does not seem to be an optimum
place because of having huge loan quantity.The total cost of PV without land cost
is calculated with the presumption whether the government accords the same
right which NUKE has to PV. This right is land cost exemptions as determined in
the intergovernmental agreement.
NUKE has 32.06 billion $ total cost only 105 million $ of which is land cost. It is
obviously seen that PV is cheaper investment compared to NUKE.
124
Total electricity production of PV is 215.51 TWh during its whole lifetime.
However, this amount is 1920.67 TWh for NUKE. Matching electricity
production amounts, it is obviously seen that NUKE has quite more electricity
production capacity than PV with same installed power.
On the other hand, dealing with NPVs of electricity productions of two option,
the value is 110.45 and 347.36 respectively for PV and NUKE.
PV is better pursuant to LCOE amounts. In other words, PV generates cheaper
electricity than NUKE (Note however that, if the high land cost of PV-PP is
accounted, they produce unit electricity almost with the same price.)
For 1 MW PV PP, taking C as generally accepted turnkey price in market which
is 1.26 Million € instead of the value calculated by this study, the LCOE with
land cost becomes 127.51 $/MWh. And the LCOE without land cost becomes
73.63 $/MWh which is still cheaper than NUKE.
PV needs about 4 fold area of NUKE PP. The total area necessary for PV is
48.47 km2; however, it is 11.83 km2 for NUKE.
Designing system having 2 lines instead of 8 lines, total area needed decreases
about 4.5 km2.
PV reduces more CO2 per MWh; however, owing to considerably high electricity
production amount, NUKE reduces more CO2 totally.
Payback time and expenditure-income balances of NUKE do not seem feasible.
Paranthetically, PV has insufficient feasibility unless government subsidy the
cost of land allocation. If it is, then, having reasonable payback time, PV PP
investment becomes feasible.
Therefore, even if the options of PV investment both with and without land cost
can be taken into account as profitable, PV investment seems quite much
profitable with land cost exemption.
The quantity of feed-in-tariff purchacement amount and time is insufficient for
having profitable investment with land cost.
Even both options are environmental friendly during operation unless force
majeur occurs for NUKE, the life cycle has intense material use and
environmental effect in the construction stage. PV has intense electricity, natural
gas consumption and considerable metal consumptions like aluminum, steel etc
in its life cycle. NUKE has highly considerable amount uranium waste, water
consumption, excavation waste, cement and steel use.

125
Both options create the junk of industry. Consequently, in order not to face on the
hardness at the end of project life, recycling possibilities should be worked well.
In reality, both options are supported by the government from different aspects.
For instance, government establishes the infrastructure of PV PP to be
established in ESIZ. On the other hand, the government allocates the land to
NUKE PP for free.
For the calculation of solar irradiance shifting the assumption from isotropic sky
to anisotropic one, 5-10 % more energy input is attained according to Perez
model.
The location of Karapinar ESIZ does not seem to be the best place being exposed
the highest solar irradiation. The cities like Antalya, Gaziantep which are located
south of Karapinar are capable of having more solar irradiation amount when
compared to Karapinar. Turkish solar maps constituting solar irradiance amounts,
locations available to feed-in-tariff systems and location of Karapinar ESIZ are
given in Appendix A [36], [144-145].
Since NUKE PP to be established in Mersin does not have operating example,
some pictures taken from animations of aforementioned PP are given in
Appendix B [146-147].
Together with feed-in-tariff subsidy and unlicensed PV PP establishment
opportunity for investments lower than 1 MW installed-power have boosted
Turkish solar investments. In the upcoming days, Turkey will be able to have
many PV PP investments. One of them which has 500 kW installed power has
newly established in Bandırma by Mumcu Teneke Company. Some pictures from
mentioned PP which has similarity with the system this study dealth with are
given in Appendix C [148].

126
REFERENCES
[1] IPCC, Working Group 1 Contribution to the Fifth Assessment Report (Final Draft), Intergovernmental Panel on Climate Change, 2013.
[2] Meadows, Donella H., et al., Limits to Growth. MIT : Club of Rome, 1972.
[3] Beklioğlu, M., Ecologic Crisis: Anthropocene (Ekolojik Krizler: Antroposen Dönemi). "İklim Değişikliği, Uyum Politikaları ve Türkiye", METU CEC (ODTÜ SEM), 2010.
[4] Skeptikal Science, [Online] 2013. Avaliable: http://www.skepticalscience.com/Earths-five-mass-extinction-events.html. [Accessed: 12 04 2013].
[5] Maddison, A. Historical Statistics for the World Economy 1-2001 AD., OECD Publishing, 2006.
[6] Malthus, T. R., Essay on the Principle of Population, London, 1798.
[7] UNDESA, World Population Prospects: 2010 Revision Volume 1: Comprehensive Tables., United Nations Department of Economic and Social Affairs, 2011.
[8] IPCC, 4th Assessment Report Part 1:Sythesis Report, Intergovernmental Panel on Climate Change, 2007.
[9] IEA, Key World Energy Statistics. International Energy Agency, 2012.
[10] UNEP, Global Environmental Outlook 5, United Nations Environment Programme, 2012.
[11] United Nations, Report of the United Nations Conference on the Human Development, United Nations, 1972.
[12] IUCN, World Conservation Strategy, International Union for the Conservation of Nature, 1980.
[13] World Commission on Environment and Development, Report of the World Commission on Environment and Development (Our Common Future) (Brundtland Report), United Nations, 1987.
[14] United Nations, Rio Decleration on Environment and Development, The United Nations Conference on Environment and Development, 1992.

127
[15] United Nations, Report of the World Summit on Sustainable Development, World Summit on Sustainable Development, 2002.
[16] United Nations, The future we want, United Nations Conference on Sustainable Development (Rio+20), 2012.
[17] Akınoğlu B. G., Energy, Environment and Sustainable Development (Enerji, Çevre ve Sürdürülebilir Gelişme), III. Ege Energy Symposium (III. Ege Enerji Sempozyumu), Muğla University, 24-26 May 2006
[18] WRI, World Resources Institute. [Online] 2013. Avaliable:http://www.wri.org/news/statement-iea-report-finds-world-not-track-meet-climate-goals. [Accessed: 08 09 2013].
[19] IEA, Redrawing Energy-Climate Map, International Energy Agency, 2013.
[20] IEA, KeyWorld Energy Statistics, International Energy Agency, 2012.
[21] EIA, International Energy Statistics. [Online] 2012. Avaliable:http://www.eia.gov/cfapps/ipdbproject/iedindex3.cfm?tid=44&pid=44&aid=1&cid=ww,&syid=2008&eyid=2012&unit=QBTU. [Accessed: 10 09 2013].
[22] EIA, International Energy Statistics. [Online] 2012. Avaliable: http://www.eia.gov/cfapps/ipdbproject/iedindex3.cfm?tid=2&pid=2&aid=12&cid=ww,&syid=2007&eyid=2011&unit=BKWH. [Accessed: 09 10, 2013.]
[23] EPIA, Global Market Outlook for PV 2013-2017, European Photovoltaic Industry Association, 2013.
[24] IEA, Technology Roadmap Solar PV Energy, International Energy Agency, 2011.
[25] ICCI, International Energy and Environment Conference, 2012. International Energy and Environment Conference Outputs.
[26] Nitzer, N. ve Stainhilber, J., The end of nuclear energy? International perspectives after Fukushima., Friedrich Ebert Stiftung, 2012.
[27] Ferguson, C. D., Nuclear Energy: What everyone needs to know, Oxford, 2011.
[28] BP, Statistics Review of World Energy, British Petroleum, 2013.
[29] Schneider, M. and Froggatt, A., World Nuclear Industry Status Report. 2013.
[30] Dilaver, Z. and Hunt, L. C., Turkish Aggregate Electricity Demand: An Outlook to 2020, Surrey Energy Economics Centre, 2011.
[31] Hamzaçebi, C., Forecasting of Turkey's net electricity energy consumption on sectoral bases, Energy Policy, Vol 35, pp. 2009-2016, 2007.

128
[32] Ozturk, H. K. ve Ceylan, H., Forecasting total and industrial sector electricity demand based on genetic algorith approach: Turkey case study, International Journal of Energy Research, Vol 29, pp. 829-840, 2005.
[33] Yildiz, Taner, Turkey Renewable Targets, Plenary Meeting Budget Discussions (Genel Kurul Bütçe Görüşmeleri). December 2012.
[34] MoENR, The official page of the Ministry of Energy and Natural Resources . www.enerji.gov.tr. [Online] 10 08 2010. Avaliable: http://www.enerji.gov.tr/index.php?dil=tr&sf=webpages&b=gunes&bn=233&hn=&nm=384&id=40695. [Accessed: 12 06 2013]
[35] Topkaya, S. O., A discussion on recent developments in Turkey's emerging solar power market. International Journal of Renewable and Sustainable Energy Reviews, Vol 16, p. 3754-3765, 2012.
[36] DG for Renewable Energy, The Atlas of Solar Energy Potantial. Directorate General for Renewable Energy, 2007.
[37] MoENR, Solar part at the official website of MOENR. [Online] Ministry of Energy and Natural Resources, 11 08 2010. Avaliable: http://www.enerji.gov.tr/index.php?dil=tr&sf=webpages&b=gunes&bn=233&hn=&nm=384&id=40695 [Accessed: 12 06 2013]
[38] Oktik, S. Rising opportunities for photovoltaic power systems in Turkey. 19th International Photovoltaic Science and Engineering Conference & Exhibition. 09-13 November 2009.
[39] Deloitte, Sunny Days in Renewable Energy (Yenilenebilir Enerjide Güneşli Günler), 2012.
[40] EMRA, Energy Market Regulatory Authority Official Page. [Online] 2012. www.epdk.gov.tr. [Accessed: 11 09 2013].
[41] MoENR, Electric Energy Market and Security of Supply Strategy Paper. Ministerial Council of the Republic of Turkey, 2009.
[42] EPIA, Unlocking the Sunbelt, Potential of Photovoltaics, European Photovoltaic Industry Association, 2010.
[43] TPVTP, PV Technology Roadmap in Turkey, Turkish PV Technology Platform. 2009.
[44] Official Journal, Decision of Ministerial Cabinet on the establishment of Karapınar Energy Specialised Industrial Zone, 2012.
[45] Official Journal. Intergovernmental Aggreement between Russian Federation and the Republic of Turkey on the establishment of Nuclear Power Plant in Mersin Akkuyu, 2010.

129
[46] REN21, Renewables 2012 Global Status Report, REN21 Secretariat, 2012.
[47] Duffie, J. A. ve Beckman, W. A. Solar Engineering of Thermal Processes, John Wiley and Sons, 2006.
[48] Akınoğlu B. G., Ecevit A., Construction of a Quadratic Model Using Modified Angstrom Coefficients to estimate global solar radiation, Solar Energy, Vol 45, pp. 85-92, 1990.
[49] NASA, Near Earth Object Program. [Online] National Aeronautics and Space Administration, 12 11 2013. Avaliable: http://neo.jpl.nasa.gov/glossary/au.html. [Accessed: 11 12 2013].
[50] Akınoğlu, B. G., PHYS 471: Solar Energy I Lecture Notes. Middle East Technical University. 2012.
[51] ACRIM, Active Cavity Radiometer Irradiance Monitor. [Online] 2013. Avaliable: http://www.acrim.com/ [Accessed: 14 12 2013].
[52] University of British Columbia, Physical Geography. [Online] 05 07 2009. Avaliable: http://physicalgeography.net/fundamentals/7f.html [Accessed: 11 09 2013].
[53] Klein, A. S., Calculation of monthly average insulation on tilted surfaces. Sol Energy, Vol 19, pp. 325-329, 1977.
[54] Turkish Meteorology Institute, Official Statistics. Turkish Meteorology Institute. [Online] 2012. Avaliable: http://www.meteor.gov.tr/veridegerlendirme/il-ve-ilceler-istatistik.aspx?m=KONYA#sfB. [Accessed: 07 05 2013].
[55] Akınoğlu, B. G., A review of sunshine-based models used to estimate monthly average global solar radiation. 3/4, Renewable Energy, Vol 1, pp. 479-493, 1991.
[56] Erbs, D. G., S. A. Klein and J. A. Duffie, Estimation of the Diffuse Radiation Fraction for Hourly, Daily and Monthly- Average Global Radiation, Solar Energy, Vol 28, pp. 293-302, 1982.
[57] Liu, B. Y. H. and Jordan, R. C, A Rational Procedure for Predicting The Long-Term Average Performance of Flat-Plate Solar-Energy Collectors. 1963.
[58] YINGLI, PV Module Brochure. [Online] 2013. Avaliable:http://www.yinglisolar.com/assets/uploads/products/downloads/Yingli%20Solar_PANDA%2060%20Cell.pdf [Accesed: 31 01 2014]
[59] In Balance Energy Ltd. [Online] 2013. Avaliable: http://www.inbalance-energy.co.uk/articles/solar_panels_pv_calculator.html. [Accessed: 08 08 2013].

130
[60] Satcon Solstice, Inverter Manual. [Online] 2013. Avaliable: http://www.sdlsolar.com/data-sheets/125kW-Solstice.pdf [Accessed: 31 01 2014]
[61] Klein, S. A. and Beckman, W A., PV F-Chart User's Manual Windows Version, F-Chart Software, 1983-2001.
[62] The engineering tool box. [Online] 2013. Avaliable: http://www.engineeringtoolbox.com/specific-relative-humidity-air-d_688.html. [Accessed: 01 12 2013]
[63] VAISALA, [Online] VAISALA, 2011-2013. [Cited: 12 10 2013.] Avaliable: http://www.vaisala.com/en/services/technicalsupport/humiditycalculator/pages/default.aspx. [Accessed: 20 10 2013]
[64] Ahrens, C. D., Meteorology Today. An Introduction to Weather, Climate and the Environment, Thompson, 2006.
[65] Loferski, J. J., The first forty years: a brief history of the modern photovoltaic, Progress in Photovoltaics: Research and Application, Vol 1, pp. 67-78, 1993
[66] Jordan, D. C. ve Kurtz, S. R., Photovoltaic Degradation Rates - An Analytical Review, National Renewable Energy Laboratory, 2012.
[67] Dunlop, E., Halton, D. and Ossenbrink, H., 20 years of life and more: where is the end of life of a PV module? IEEE Proceedings, 2005.
[68] Dunlop, E. D. and Halton, D., The performance of crystalline silicon photovoltaic solar modules after 22 years of continous outdoor exposure. Progress in Photovoltaics: Research and Application, Vol 14, pp. 53-64, 2006.
[69] Skoczek, A, Sample, T ve Dunlop, E D. The results of performance measurements of field-aged crystalline silicon photovoltaic modules, Progress in Photovoltaics: Research and Application, Vol 17, pp. 227-290, 2009.
[70] Fthenakis, V. M. ve Kima, H. C., Greenhousegas emissions from solar electric and nuclear power: A life-cycle study, Energy Policy, Vol 35, pp. 2549-2557, 2007.
[71] Zhang, T. Z. ve Dornfield, D. A. A Cradle to Grave Framework for Environmental Assessment of Photovoltaic Systems, UC Berkeley, 2006.
[72] Kaplan, S., CRS Report for Congress: Power Plants: Characterics and Costs. 2008.
[73] German Solar Energy Society, Planning and Installing Photovoltaic Systems: A Guide for Installers, Earthscan, 2008.

131
[74] Dean, Ryan, An Analysis of the Photovoltaic Value Chain for Reviewing Solar Energy Policy Options in Massachusets, Massachusetts Institute of Technology, 2008.
[75] China Greentech Initiative, China's Solar PV Value Chain. 2011.
[76] EPIA, Economic Benefits of Solar Photovoltaics: The PV Value Chain, European Photovoltaic Industry Association, 2012.
[77] Jungbluth, N., Stucki, M. and Karin, F., Life Cycle Inventories of Photovoltaics, ESU Services, 2012.
[78] Markvart, T. and Castaner, L., Practical Handbook of Photovoltaics, Fundamentals and Applications, Elseiver, 2003.
[79] Pavlovic, T., et al., Possibility of electricity generation using PV solar plants in Serbia, Renewable and Sustainable Energy Reviews, Vol 20, pp. 201-218, 2013.
[80] Made how. [Online] 2013. Avaliable: http://www.madehow.com/Volume-1/Solar-Cell.html. [Accessed: 10 10 2013]
[81] Xakalashe, B. S. and Tangstad, M., Silicon Processing: from quartz to crystalline silicon solar cells, South African Pyromettalurgy, 2011.
[82] Pizzini, S., Towards solar grade silicon: Challanges and benefits for low cost photovoltaics, Solar Energy Materials and Solar Cells, Vol 94, pp. 1528-1533, 2010.
[83] Hagedorn, G. and Hellriegel, E., Umweltrelevante Masseneintrage bei der Herstellung vershiedener Solarzellentypen-Endbericht-Teil I: Konventionelle Verfahren, Research Institute for Energy Economy, 1992.
[84] Specification Guide for Mono-Crystalline and Poly-Crystalline PV Modules. solarworld. [Online] 2013. Avaliable: www.solarworld-usa.com. [Accessed: 07 07 2013].
[85] Stoppato, A., Life Cycle Assessment of Photovoltaic Electricity Generation. Energy, Vol 33, pp. 224-232, 2008.
[86] SUMCO. [Online] 2010. Avaliable: http://www.sumcosi.com/english/products/process/step_03.html. [Accessed: 15 10 2013]
[87] Mulvaney, D., Just and Sustainable PV Recycling, Envisioning Sustainable Solar Technology Forum on Solar Recycling, 2011.
[88] IPPC, Reference Document on Best Avaliable Techniques in the Non Ferrous Metals Industries, European Commission Directorate-general JRC, 2001.

132
[89] Zulehner, W., Neuer, B. ve Rau, G., Silicon. In: Ullman's encyclopedia of industrial chemistry, Wiley-VCH, 2002.
[90] Elkem, Environmental Report, Elkem, 2001.
[91] Hartmann, D., Ganzheitliche Bilanzierung der Stromerzeugang aus regenerativen Energien, Institut für Energiewirtschaft und Rationelle Energieanwendung, 2001.
[92] Nijs, J., et al., Energy Payback Time of Crystalline Silicon Solar Modules, American Solar Energy Society, Vol 11, p. 291, 1997
[93] de Wild-Scholten, M. J. and Alsema, E. A., Environmental Life Cycle Inventory of Crystalline Silicon Photovoltaic System Production, The Netherlands and Copernicus Institute for Sustainable Development and Innovation, 2007.
[94] Rogol, M., Silicon and the solar sector, CLSA Asia Pacific Markets, 2005.
[95] Wacker, Daten und Fakten zu Emwelt und Sicherheit, Wacker Siltronic AG, 2006.
[96] Wacker, Daten und Fakten zu Umwelt und Sicherheit, Wacker Siltronic AG, 2000.
[97] Schwarz, U. and Keller, M., ERZ und OPRZ einer 3kW- Photovoltaikanlage, ETh Zurich, 1992.
[98] de Wild-Scholten, M. J., et al., A cost and environmental impact comparison of grid connected rooftop and ground based PV systems. 21th European Photovoltic Solar Energy Conference, 04-08 September 2006.
[99] Branker, K, Pathak, M J M ve Pearce, J M., A Review of Solar Photovoltaic LCOE, 2011.
[100] IRENA, Renewable Energy Technologies: Cost analysis series, Volume 1, Power Sector, Issue 2/5, Concentrating Solar Power, International Renewable Energy Agency, 2012.
[101] Hoffmann, W., PV solar electricity in EUMENA: headway in the world, Mediterrenean solar plan-introduction, European Photovoltaic Industry Association, 2010.
[102] Ayse Banu Kosif, Project Manager in Nurol Ar-Ge, Personal Communication, 31 01 2014.
[103] Hernandez-Moro, J. ve Martinez-Duart, J. M., Analytical Model for Solar PV and CSP Electricity Costs: Present LCOE Values and Their Future Evloution, Renewable and Sustainable Energy Reviews, Vol 20, pp. 119-132, 2013.

133
[104] MoE, Energy Investments and Incentive Schemes (Enerji Yatırımları ve Teşvik Tedbirleri). Ministry of Economy, April 2012.
[105] MoSIT, 4737 numbered Law of Industrial Zones, Ministry of Science, Industry and Technology of the Republic of Turkey, 2002.
[106] Ayompe, L. M., et al., Projected costs of a grid connected domestic PV system under different scenarios in Ireland, using measured data from a trial installation, Energy Policy, 2010, Vol 38, pp. 3731-3743.
[107] Zweibel, K., Should solar photovoltaics be deployed sooner because of long operating life at low, predictable cost?, Energy Policy, Vol 38, pp. 7519-7530, 2010.
[108] Branker, K., Pathak, M. J. M. ve Pearce, J. M., A review of solar photovoltaic levelized cost of electricity, Renewable and Sustainable Energy Reviews, Vol 15, pp. 4470-4482, 2011.
[109] IEA, Technology roadmap solar photovoltaic energy, International Energy Agency, 2010.
[110] Beyer, C. H. ve Gerlach, A., Global overview on grid parity event dynamics, Qcells, 2010.
[111] Van der Zwaan, B. ve Rabl, A, The learning potential of photovoltaics: implications for energy policy, Energy Policy, Vol 32, p. 1545-1554, 2004.
[112] Yang, C. J., Reconsidering solar grid parity, Energy Policy, Vol 38, pp. 3270-3273, 2010.
[113] Cellura, M., et al., Photovoltaic electricity scenario analysis in urban contests: an Italian case study, Renewable and Sustainable Energy Reviews, Vol 16, pp. 2041-2052, 2012.
[114] Györffy, K., Trading economics. [Online] Central Bank of the Republic of Turkey, 19 11 2013. Avaliable: http://www.tradingeconomics.com/turkey/interest-rate. [Accessed: 25 11 2013].
[115] Çelik, A. N., Muneer, T. ve Clarke, P., Optimal Sizing and Life Cycle Assessment of Residential Photovoltaic Energy Systems With Battery Storage, Progress in Photovoltaics: Research and Application,Vol 16, pp.69-85, 2007.
[116] Dunlop, E D ve Halton, D., The performance of crystalline silicon photovoltaic solar modules after 22 years of continous outdoor exposure, Progress in Photovoltaics: Research and Application, Vol 14, p. 53-64, 2006.
[117] Sherwani, A. F., Usmani, J. A. ve Varun., Life cycle assessment of solar PV based electricity generation systems: a review, Renewable and Sustainable Energy Reviews, Vol 14, pp. 540-544, 2010.

134
[118] Pacca, S., Sivaraman, D. ve Keoleian, G. A., Parameters affecting the life cycle performance of PV technologies and systems, Energy Policy, Vol 35, pp. 3316-3326, 2007.
[119] Pavlovic, T., et al., Comparison and assessment of electricity generation capacity for different types of PV solar plants of 1MW in Soko Banja, Serbia, Thermal Science, Vol 15, pp. 605-618, 2011.
[120] Djurdjevic, D., Perspectives and assessment of solar PV power engineering in the Republic of Serbia, Renewable and Sustainable Energy Reviews, Vol 15, p. 2431-2446, 2011.
[121] Climate Change and Carbon Management Association, Personal Communication, 30 09 2013.
[122] TURKSTAT, Seasonal Workers Statistics, Turkish Statistics Institute, 2012.
[123] AEE Solar, SnapNrack Ground Mount Installation Manual, AEE Solar, 2009.
[124] Barbose, G., et al., Tracking the Sun VI An Historical Summary of the Installed Price of Photovoltaics in the United States from 1998 to 2012, 2013.
[125] Feldman, D., et al., Photovoltaics (PV) pricing Trends: Historical, Recent, and Near-Term Projections, SunShot U.S. Department of Energy, 2012.
[126] Tidball, R., et al., Cost and Performance Assumptions for Modeling Electricity Generation Technologies, NREL, 2010.
[127] National Renewable Energy Laboratory, Cost and Performance Data for Power Generation Technologies, 2012.
[128] Rosatom, Akkuyu Nuclear PowerPlant - Progress To-date and the Way Forward. The official website of Akkuyu NGS A.Ş. [Online] 2013. Avaliable: www.akkunpp.com. [Accessed: 25 10 2013].
[129] Cometto, M., Financing the Akkuyu NPP in Turkey. Nuclear Energy Agency. [Online] 09 19, 2013. Avaliable: www.oecd-nea.org. [Accessed: 01 11 2013].
[130] Ivanovski, V., Akkuyu Nuclear Plant Cost. [interv.] Zaman. 10 07 2012.
[131] Dokay Mühendislik A.Ş., Environmental Impact Assessment Report of Mersin Akkuyu 4800 MW Nuclear Power Plant Project 4800 MW installed power. Ministry of Environment and Urbanisation of the Republic of Turkey, 2013.
[132] Berkovic, V. Y. and Semcenkov, Y. M., Перспективные проекты реакторных установок ВВЭР. The official site of Rosatom. [Online] 23 05 2012. Avaliable: http://mntk.roseenergoatom.ru. [Accessed: 02 11 2013.]

135
[133] Atomenergoproject, Akkuyu Nuclear Power Plant Units 1,2,3,4 Process Water Supply System Explanatory Note, Atomenergoproject JSC, 2011.
[134] Fil, N. S., VVER-1200 Reactor Plant and Safety Systems. [Online] 02 04 2012. Avaliable: www.rosatom.ru. [Accessed: 04 11 2013].
[135] Rosatom, Akkuyu NPP Units 1,2,3,4 Preproject Materials, Volume 1, General Explanatory Note, Book 2, Section 3.1, Rosatom, 2011.
[136] TURKSTAT, Mersin 2012 with Selected Parameters (Seçilmiş Göstergelerle Mersin 2012), Turkish Statistical Institute, 2013.
[137] Facenna, C., et al., Slab detachment beneath eastern Anatolia: A possible cause for the formation of the North Anatolian fault, Earth and Plenatery Science Letters, Vol 242, pp. 85-97, 2006.
[138] Bauer, C., et al., Final Report on technical data, costs, and life cycle inventories of advanced fossil power generation systems, New Energy Externatilities Developments for Sustainability, 2008.
[139] NEA, Projected Costs of Generating Electricity, OECD/IEA/ Nuclear Energy Agency, 2010.
[140] Ministerial Council, Current VAT Ratios. Current VAT Ratios. Ankara, Turkey : Official Journal, 24 02 2013.
[141] UNFCCC, Tool to Calculate the Emission Factor for an Electricity System, United Nations Framework Convention on Climate Change, 2011.
[142] EDAM, The Turkish Model For Transition to Nuclear Energy, Centre for Economics and Foreign Policy Studies, 2011.
[143] IPCC, IPCC Guidelines for National Greenhouse Gas Inventories, Intergovernmental Panel on Climate Change, 2006.
[144] Turkish Electricity Transmission Company. [Online] 2011. Avaliable: http://www.teias.gov.tr/ebulten/haberler/2012/G%C3%9CNE%C5%9E%20ENERJ%C4%B0S%C4%B0%20HABER/sayfam1.html [Accessed: 02 01 2014]
[145] Aşker, M., Solar Energy Potantial of Turkey, DG for Renewable Energy, 2012
[146] Haberinvakti, [Online] 2013. Avaliable: http://www.haberinvakti.com/album-p2-aid,293.html#galeri [Accessed: 30 12 2013].
[147] Hurriyet, [Online] 2013. Avaliable: http://fotogaleri.hurriyet.com.tr/galeridetay/58560/2/1/iste-akkuyu-nukleer-santrali [Accessed: 30 12 2013].

136
[148] Mumcu Teneke, [Online] 2013. Avaliable: http://www.mumcuteneke.com.tr/gunes.html [Accessed: 30 12 2013.]

137
APP
EN
DIC
ES
A -
Tur
key
Sola
r E
nerg
y A
tlas a
nd L
ocat
ion
of K
arap
ınar
ESI
Z
Left
top
Map
reve
alin
g lo
catio
ns th
at c
an b
e be
nefit
ed fr
om 6
00 M
W fe
ed-
in-ta
riff s
ubsi
dies
toge
ther
with
the
men
tion
of th
e lo
catio
n of
K
arap
inar
ESI
Z [1
44]
Rig
ht
Top
Turk
ey’s
sola
r atla
s pot
entia
l in
para
llel w
ith p
revi
ous m
ap
toge
ther
with
the
men
tion
of th
e lo
catio
n of
Kar
apin
ar E
SIZ.
P.
S. R
ed re
veal
s are
as h
avin
g m
ore
than
165
0 kW
h/m
2 year
sola
r irr
adia
tion.
Gre
en sh
ows p
lace
s with
162
0-16
50 k
Wh/
m2 ye
ar so
lar
irrad
iatio
n. B
lue
show
s pla
ces h
avin
g so
lar i
rrad
iatio
n lo
wer
than
16
20 k
Wh/
m2 ye
ar [
145]
Le
ft do
wn
Turk
ey’s
sola
r atla
s pot
entia
l in
para
llel w
ith p
revi
ous m
ap
toge
ther
with
the
men
tion
of th
e lo
catio
n of
Kar
apin
ar E
SIZ.
P.
S. T
otal
Sol
ar Ir
radi
atio
n: (k
Wh/
m2 ye
ar) [
36]

138
B –
Som
e Pi
ctur
es fr
om N
UK
E P
P in
Mer
sin
Akk
uyu
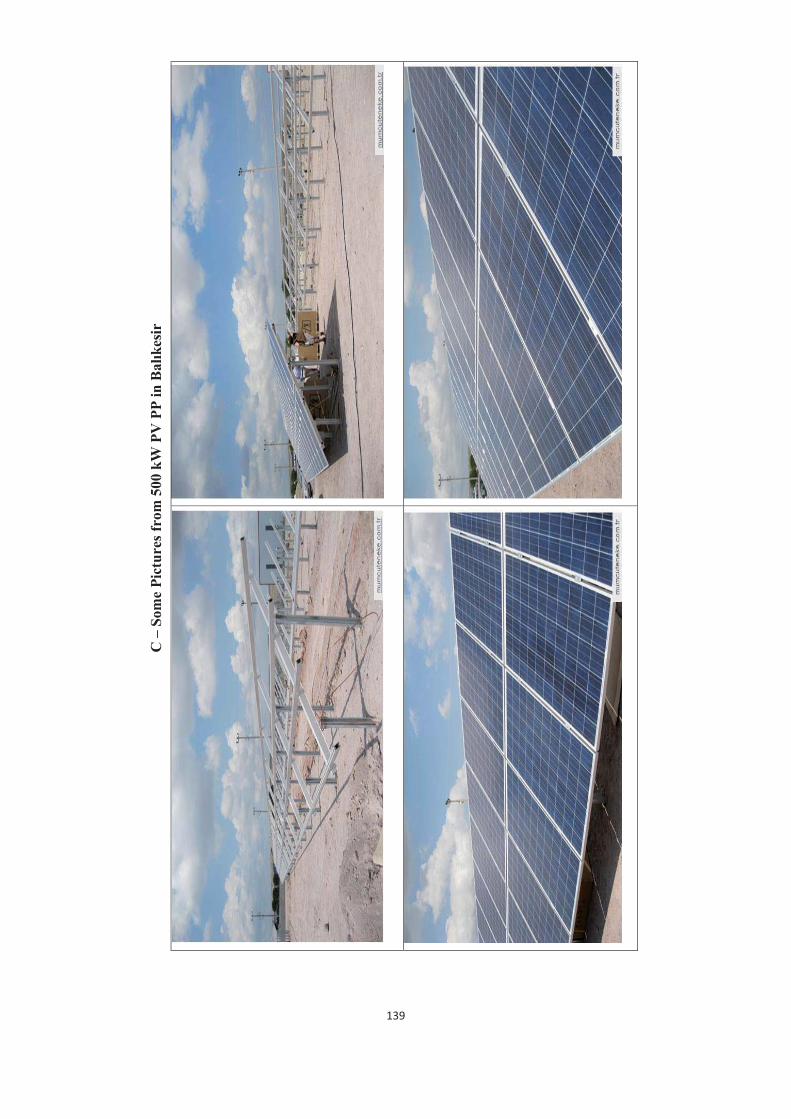
139
C –
Som
e Pi
ctur
es fr
om 5
00 k
W P
V P
P in
Bal
ıkes
ir