nuclear engineering and design - catatan studi tsdipura · pdf filenuclear engineering and...
TRANSCRIPT
Nuclear Engineering and Design 238 (2008) 3002–3012
Contents lists available at ScienceDirect
Nuclear Engineering and Design
journa l homepage: www.e lsev ier .com/ locate /nucengdes
The Reactor Core Neutronic model for the Pebble Bed Modular Reactor
Trevor Dudleya,∗, Piet de Villiersa, Werner Bouwera,Oliver Tsaoib, Eben Mulderc
a Pebble Bed Modular Reactor (Proprietary) Limited, Die Anker Building, Centurion 0046, South Africab GSE Systems, Inc. 7133 Rutherford Suite 200, Baltimore, MD 21244, USAc MTech Industrial, South Africa
a r t i c l e i n f o
Article history:Received 8 June 2007Received in revised form 11 December 2007Accepted 11 December 2007
a b s t r a c t
This paper describes the technical aspects of the Reactor Core Neutronic model for the Pebble Bed Mod-ular Reactor (PBMR). Included is a model design review with preliminary simulation results and modelconstraints. The PBMR Demonstration Power Plant is a First of a Kind Engineering plant which will beused for the production and generation of electricity in South Africa.
The theory and solution techniques used for modelling and simulating the neutronic core are alsodescribed. The neutronic model is discussed, as well as the model capabilities and model requirements.The model formulation for the PBMR plant is also derived from GSE’s nuclear (neutronic) simulation
model known as REMARK© (Real Time Multigroup Advanced Reactor Kinetics). The derived neutronicmodel for PBMR is aptly called the PBMR-REMARK© Reactor Core Neutronic model. Preliminary results ofc mo
1
1
TtggtiPtibasfltbbas
habopaota
1
1
aTldt
0d
the Reactor Core Neutroni
. Introduction
.1. The PBMR plant-technological basis
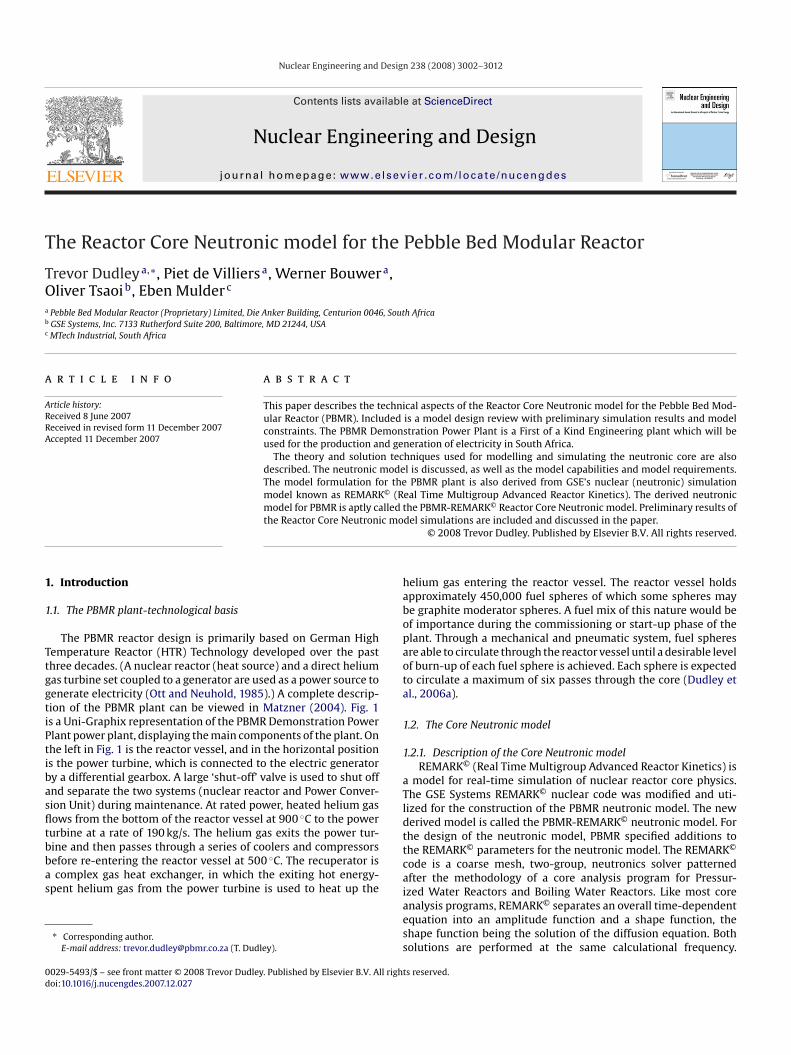
The PBMR reactor design is primarily based on German Highemperature Reactor (HTR) Technology developed over the pasthree decades. (A nuclear reactor (heat source) and a direct heliumas turbine set coupled to a generator are used as a power source toenerate electricity (Ott and Neuhold, 1985).) A complete descrip-ion of the PBMR plant can be viewed in Matzner (2004). Fig. 1s a Uni-Graphix representation of the PBMR Demonstration Powerlant power plant, displaying the main components of the plant. Onhe left in Fig. 1 is the reactor vessel, and in the horizontal positions the power turbine, which is connected to the electric generatory a differential gearbox. A large ‘shut-off’ valve is used to shut offnd separate the two systems (nuclear reactor and Power Conver-ion Unit) during maintenance. At rated power, heated helium gasows from the bottom of the reactor vessel at 900 ◦C to the powerurbine at a rate of 190 kg/s. The helium gas exits the power tur-
ine and then passes through a series of coolers and compressorsefore re-entering the reactor vessel at 500 ◦C. The recuperator iscomplex gas heat exchanger, in which the exiting hot energy-pent helium gas from the power turbine is used to heat up the
∗ Corresponding author.E-mail address: [email protected] (T. Dudley).
tcaiaess
029-5493/$ – see front matter © 2008 Trevor Dudley. Published by Elsevier B.V. All rightoi:10.1016/j.nucengdes.2007.12.027
del simulations are included and discussed in the paper.© 2008 Trevor Dudley. Published by Elsevier B.V. All rights reserved.
elium gas entering the reactor vessel. The reactor vessel holdspproximately 450,000 fuel spheres of which some spheres maye graphite moderator spheres. A fuel mix of this nature would bef importance during the commissioning or start-up phase of thelant. Through a mechanical and pneumatic system, fuel spheresre able to circulate through the reactor vessel until a desirable levelf burn-up of each fuel sphere is achieved. Each sphere is expectedo circulate a maximum of six passes through the core (Dudley etl., 2006a).
.2. The Core Neutronic model
.2.1. Description of the Core Neutronic modelREMARK© (Real Time Multigroup Advanced Reactor Kinetics) is
model for real-time simulation of nuclear reactor core physics.he GSE Systems REMARK© nuclear code was modified and uti-ized for the construction of the PBMR neutronic model. The newerived model is called the PBMR-REMARK© neutronic model. Forhe design of the neutronic model, PBMR specified additions tohe REMARK© parameters for the neutronic model. The REMARK©
ode is a coarse mesh, two-group, neutronics solver patternedfter the methodology of a core analysis program for Pressur-
zed Water Reactors and Boiling Water Reactors. Like most corenalysis programs, REMARK© separates an overall time-dependentquation into an amplitude function and a shape function, thehape function being the solution of the diffusion equation. Botholutions are performed at the same calculational frequency.s reserved.
T. Dudley et al. / Nuclear Engineering an
Tb
snficPfEdet
iipcldo
gbcampt
dnepiCcogn
ou
(
(
(
cPPdmprvrtcothotttF
2
2
(
(
(
(
(
e
(
Fig. 1. A Uni-Graphix picture of the PBMR power plant.
his separation is made so that a numerical solution is possi-le.
The original REMARK© utilizes a two-group neutron cross-ection data set from the core design code output to establish theuclear properties at each node. This data is loaded into block datales through the use of a utility program. Each node in REMARK©
alculates concentrations of the following isotopes: Iodine, Xenon,romethium and Samarium. Each node calculates the contributionrom each of the six classical delayed neutron precursor groups.ach node also calculates a decay heat contribution from a 23-groupecay heat source term. Each node will add the contribution fromxternal neutron sources, based on the proximity of those sourceso each node.
Fuel burn-up may be calculated at each node, but the changen burn-up during a single training session is insignificant, hencegnored. Changes in core kinetics based on core burn-up are accom-lished by having different core initial conditions based on differentore analysis data sets corresponding to different times in a core’sife. Changes in core composition (i.e. build-up of Plutonium, Xenoneposits and Samarium effects) are accommodated through the usef cross-sectional data from various periods in a core life.
Local nuclear property data is initialized through the utility pro-ram, which takes care of the geometric nodalization differenceetween the REMARK© model and the fuel analysis model (VSOPode, Teuchert et al., 1994). Data sets for various times in a core lifend at different temperature operating points are supplied into theodel. This input of data allows the determination of the nuclear
roperties with a change in local conditions such as moderatoremperature and fuel temperature.
The energy levels that comprise the two neutron groups areetermined by the fuel analysis code. REMARK© calculates theeutron absorption in the control rods and losses in the mod-rator, as well as leakage from the core. Additionally, REMARK©
erforms the heat transfer calculations from the fuel to the cool-ng medium, in this case the surrounding helium gas. The Reactorore Thermal–hydraulic model is designed in a software packagealled JTopMeret (Dudley et al., 2006b) from GSE Systems Jade suitef software. The JTopMeret programme calculates the surrounding
©
as temperatures based on the power input from PBMR-REMARKeutronic model.The PBMR-REMARK© Reactor Core Neutronic model forms partf the overall PBMR Plant Training Simulator model. The main sim-lator component models include (Dudley et al., 2006b):
d Design 238 (2008) 3002–3012 3003
a) The Reactor Core Neutronic model (model presented in detail,with mathematical modelling equations, Dudley et al., 2006c).
b) The Reactor Core Thermal–hydraulic model (model discussedin detail, from first principles, Dudley et al., 2006d).
c) The Power Conversion Unit model and the Auxiliary models(discussed in Dudley et al., 2006b).
Four neutron energy groups are used in the PBMR-REMARK©
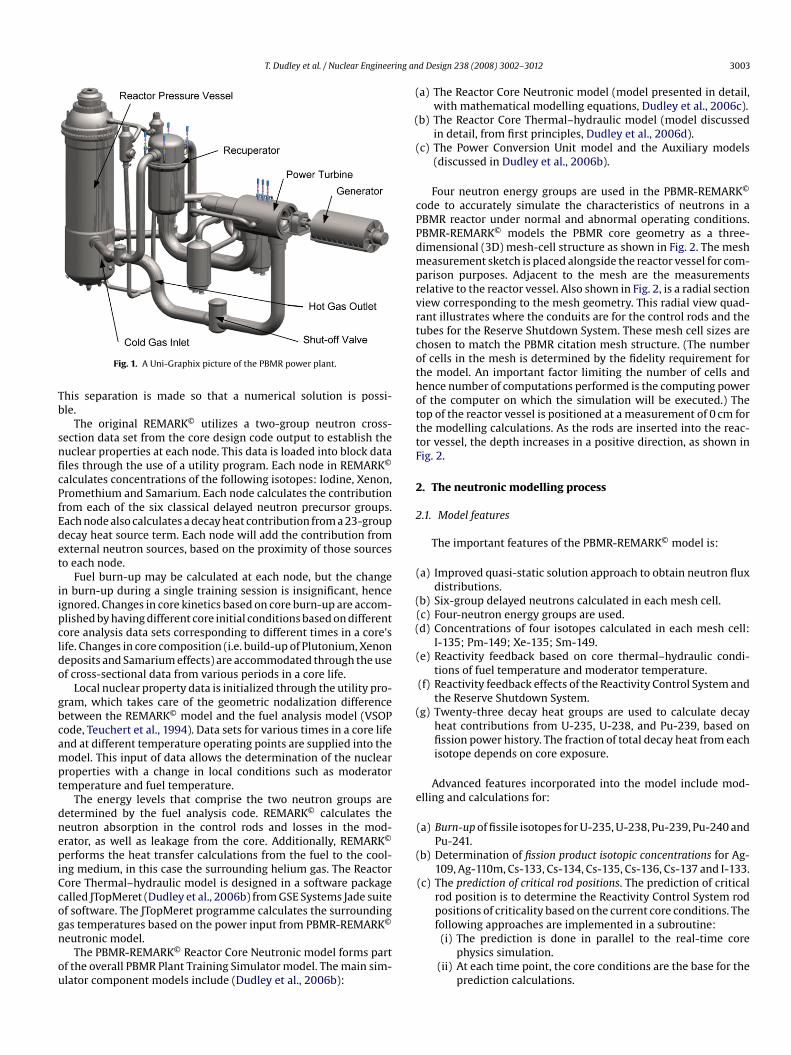
ode to accurately simulate the characteristics of neutrons in aBMR reactor under normal and abnormal operating conditions.BMR-REMARK© models the PBMR core geometry as a three-imensional (3D) mesh-cell structure as shown in Fig. 2. The mesheasurement sketch is placed alongside the reactor vessel for com-
arison purposes. Adjacent to the mesh are the measurementselative to the reactor vessel. Also shown in Fig. 2, is a radial sectioniew corresponding to the mesh geometry. This radial view quad-ant illustrates where the conduits are for the control rods and theubes for the Reserve Shutdown System. These mesh cell sizes arehosen to match the PBMR citation mesh structure. (The numberf cells in the mesh is determined by the fidelity requirement forhe model. An important factor limiting the number of cells andence number of computations performed is the computing powerf the computer on which the simulation will be executed.) Theop of the reactor vessel is positioned at a measurement of 0 cm forhe modelling calculations. As the rods are inserted into the reac-or vessel, the depth increases in a positive direction, as shown inig. 2.
. The neutronic modelling process
.1. Model features
The important features of the PBMR-REMARK© model is:
a) Improved quasi-static solution approach to obtain neutron fluxdistributions.
b) Six-group delayed neutrons calculated in each mesh cell.(c) Four-neutron energy groups are used.d) Concentrations of four isotopes calculated in each mesh cell:
I-135; Pm-149; Xe-135; Sm-149.e) Reactivity feedback based on core thermal–hydraulic condi-
tions of fuel temperature and moderator temperature.(f) Reactivity feedback effects of the Reactivity Control System and
the Reserve Shutdown System.g) Twenty-three decay heat groups are used to calculate decay
heat contributions from U-235, U-238, and Pu-239, based onfission power history. The fraction of total decay heat from eachisotope depends on core exposure.
Advanced features incorporated into the model include mod-lling and calculations for:
(a) Burn-up of fissile isotopes for U-235, U-238, Pu-239, Pu-240 andPu-241.
b) Determination of fission product isotopic concentrations for Ag-109, Ag-110m, Cs-133, Cs-134, Cs-135, Cs-136, Cs-137 and I-133.
(c) The prediction of critical rod positions. The prediction of criticalrod position is to determine the Reactivity Control System rodpositions of criticality based on the current core conditions. The
following approaches are implemented in a subroutine:(i) The prediction is done in parallel to the real-time corephysics simulation.(ii) At each time point, the core conditions are the base for the
prediction calculations.
3004 T. Dudley et al. / Nuclear Engineering and Design 238 (2008) 3002–3012
l mesh
(
owsTfw
hn
RtTpsmp
Fig. 2. The PBMR reactor vessel and vertica
(iii) Pseudo Reactivity Control System positions are moved,without affecting the actual positions, to search for the crit-ical positions for banks 1 and 2 of the Reactivity ControlSystem. Banks 1 and 2 are moved at the same time.
(iv) When no critical positions can be found, the predicted rodpositions will be displayed.
d) Control rod insertion limit. The calculation of control rod inser-tion limit is based on the following definition and approaches:
The control rod insertion limit calculates the insertion depthf Reactivity Control System Bank 2 of maximum reactivity
orth. This calculation is only to be performed in core modeltand-alone mode to calculate the insertion limit based on fixedhermal–hydraulic conditions. When the insertion limit is per-ormed, the rods are inserted until the slope is determined andhen keff starts to become positive while the Bank 2 is still inserted,
2
d(
structure for the PBMR-REMARK© model.
ence the maximum reactivity worth is reached. When this phe-omenon occurs it is known as the “horse-shoe” effect (Section 4.2).
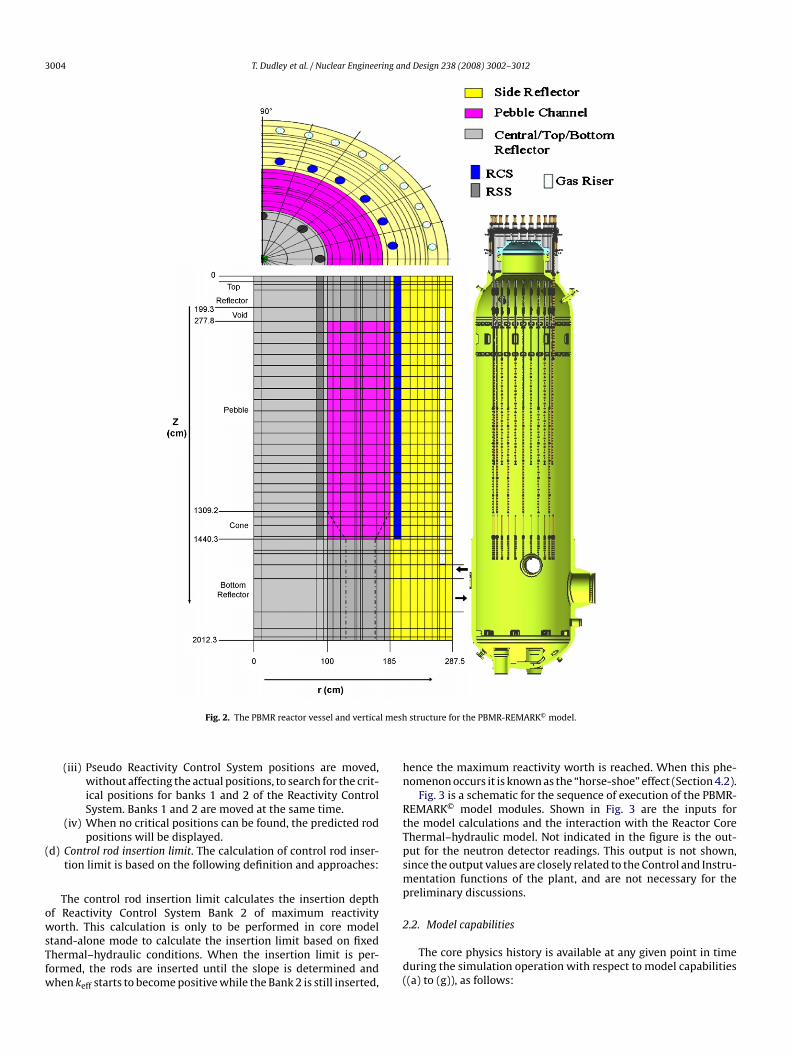
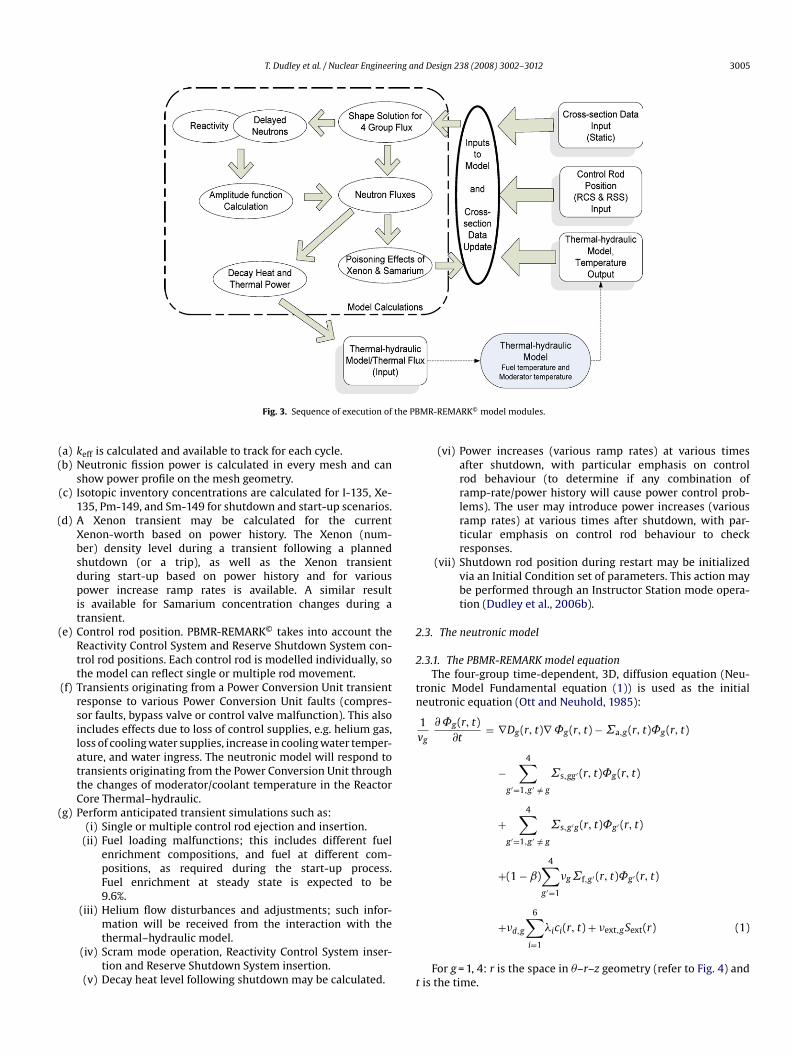
Fig. 3 is a schematic for the sequence of execution of the PBMR-EMARK© model modules. Shown in Fig. 3 are the inputs forhe model calculations and the interaction with the Reactor Corehermal–hydraulic model. Not indicated in the figure is the out-ut for the neutron detector readings. This output is not shown,ince the output values are closely related to the Control and Instru-entation functions of the plant, and are not necessary for the
reliminary discussions.
.2. Model capabilities
The core physics history is available at any given point in timeuring the simulation operation with respect to model capabilities(a) to (g)), as follows:
T. Dudley et al. / Nuclear Engineering and Design 238 (2008) 3002–3012 3005
the PB
((
(
(
(
2
2
tn
Fig. 3. Sequence of execution of
a) keff is calculated and available to track for each cycle.b) Neutronic fission power is calculated in every mesh and can
show power profile on the mesh geometry.(c) Isotopic inventory concentrations are calculated for I-135, Xe-
135, Pm-149, and Sm-149 for shutdown and start-up scenarios.d) A Xenon transient may be calculated for the current
Xenon-worth based on power history. The Xenon (num-ber) density level during a transient following a plannedshutdown (or a trip), as well as the Xenon transientduring start-up based on power history and for variouspower increase ramp rates is available. A similar resultis available for Samarium concentration changes during atransient.
e) Control rod position. PBMR-REMARK© takes into account theReactivity Control System and Reserve Shutdown System con-trol rod positions. Each control rod is modelled individually, sothe model can reflect single or multiple rod movement.
(f) Transients originating from a Power Conversion Unit transientresponse to various Power Conversion Unit faults (compres-sor faults, bypass valve or control valve malfunction). This alsoincludes effects due to loss of control supplies, e.g. helium gas,loss of cooling water supplies, increase in cooling water temper-ature, and water ingress. The neutronic model will respond totransients originating from the Power Conversion Unit throughthe changes of moderator/coolant temperature in the ReactorCore Thermal–hydraulic.
g) Perform anticipated transient simulations such as:(i) Single or multiple control rod ejection and insertion.
(ii) Fuel loading malfunctions; this includes different fuelenrichment compositions, and fuel at different com-positions, as required during the start-up process.Fuel enrichment at steady state is expected to be9.6%.
(iii) Helium flow disturbances and adjustments; such infor-
mation will be received from the interaction with thethermal–hydraulic model.(iv) Scram mode operation, Reactivity Control System inser-tion and Reserve Shutdown System insertion.
(v) Decay heat level following shutdown may be calculated. t
MR-REMARK© model modules.
(vi) Power increases (various ramp rates) at various timesafter shutdown, with particular emphasis on controlrod behaviour (to determine if any combination oframp-rate/power history will cause power control prob-lems). The user may introduce power increases (variousramp rates) at various times after shutdown, with par-ticular emphasis on control rod behaviour to checkresponses.
(vii) Shutdown rod position during restart may be initializedvia an Initial Condition set of parameters. This action maybe performed through an Instructor Station mode opera-tion (Dudley et al., 2006b).
.3. The neutronic model
.3.1. The PBMR-REMARK model equationThe four-group time-dependent, 3D, diffusion equation (Neu-
ronic Model Fundamental equation (1)) is used as the initialeutronic equation (Ott and Neuhold, 1985):
1vg
∂ ˚g(r, t)∂t
= ∇Dg(r, t)∇ ˚g(r, t) − ˙a,g(r, t)˚g(r, t)
−4∑
g′=1,g′ /= g
˙s,gg′ (r, t)˚g(r, t)
+4∑
g′=1,g′ /= g
˙s,g′g(r, t)˚g′ (r, t)
+(1 − ˇ)4∑
g′=1
�g˙f,g′ (r, t)˚g′ (r, t)
6∑
+�d,gi=1
�ici(r, t) + �ext,gSext(r) (1)
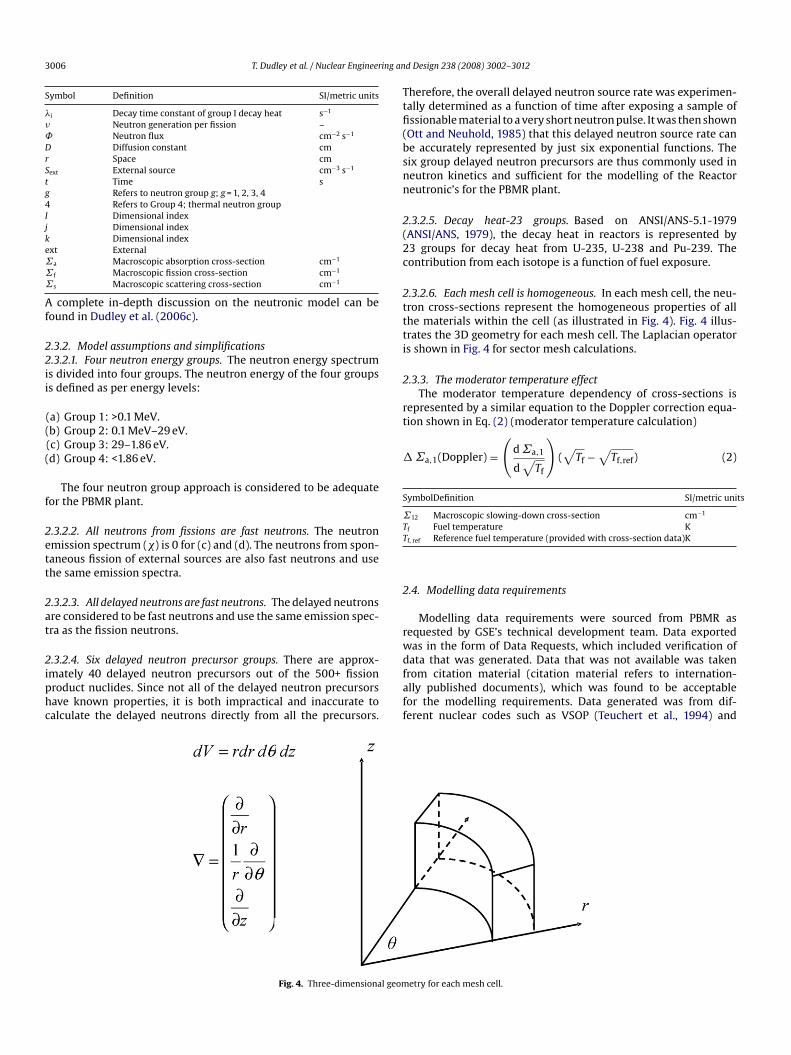
For g = 1, 4: r is the space in �–r–z geometry (refer to Fig. 4) andis the time.
3 ing an
S
��˚DrStg4Ijke˙˙˙
Af
22ii
(
(
f
2ett
2at
2iphc
Ttfi(bsnn
2(2c
2ttti
2
rt
�
S ts
˙TT
2
rw
006 T. Dudley et al. / Nuclear Engineer
ymbol Definition SI/metric units
i Decay time constant of group I decay heat s−1
Neutron generation per fission –Neutron flux cm−2 s−1
Diffusion constant cmSpace cm
ext External source cm−3 s−1
Time sRefers to neutron group g; g = 1, 2, 3, 4Refers to Group 4; thermal neutron groupDimensional indexDimensional indexDimensional index
xt Externala Macroscopic absorption cross-section cm−1
f Macroscopic fission cross-section cm−1
s Macroscopic scattering cross-section cm−1
complete in-depth discussion on the neutronic model can beound in Dudley et al. (2006c).
.3.2. Model assumptions and simplifications
.3.2.1. Four neutron energy groups. The neutron energy spectrums divided into four groups. The neutron energy of the four groupss defined as per energy levels:
(a) Group 1: >0.1 MeV.b) Group 2: 0.1 MeV–29 eV.
(c) Group 3: 29–1.86 eV.d) Group 4: <1.86 eV.
The four neutron group approach is considered to be adequateor the PBMR plant.
.3.2.2. All neutrons from fissions are fast neutrons. The neutronmission spectrum (�) is 0 for (c) and (d). The neutrons from spon-aneous fission of external sources are also fast neutrons and usehe same emission spectra.
.3.2.3. All delayed neutrons are fast neutrons. The delayed neutronsre considered to be fast neutrons and use the same emission spec-ra as the fission neutrons.
.3.2.4. Six delayed neutron precursor groups. There are approx-mately 40 delayed neutron precursors out of the 500+ fissionroduct nuclides. Since not all of the delayed neutron precursorsave known properties, it is both impractical and inaccurate toalculate the delayed neutrons directly from all the precursors.
dfaff
Fig. 4. Three-dimensional geom
d Design 238 (2008) 3002–3012
herefore, the overall delayed neutron source rate was experimen-ally determined as a function of time after exposing a sample ofssionable material to a very short neutron pulse. It was then shownOtt and Neuhold, 1985) that this delayed neutron source rate cane accurately represented by just six exponential functions. Theix group delayed neutron precursors are thus commonly used ineutron kinetics and sufficient for the modelling of the Reactoreutronic’s for the PBMR plant.
.3.2.5. Decay heat-23 groups. Based on ANSI/ANS-5.1-1979ANSI/ANS, 1979), the decay heat in reactors is represented by3 groups for decay heat from U-235, U-238 and Pu-239. Theontribution from each isotope is a function of fuel exposure.
.3.2.6. Each mesh cell is homogeneous. In each mesh cell, the neu-ron cross-sections represent the homogeneous properties of allhe materials within the cell (as illustrated in Fig. 4). Fig. 4 illus-rates the 3D geometry for each mesh cell. The Laplacian operators shown in Fig. 4 for sector mesh calculations.
.3.3. The moderator temperature effectThe moderator temperature dependency of cross-sections is
epresented by a similar equation to the Doppler correction equa-ion shown in Eq. (2) (moderator temperature calculation)
˙a,1(Doppler) =(
d ˙a,1
d√
Tf
)(√
Tf −√
Tf,ref) (2)
ymbolDefinition SI/metric uni
12 Macroscopic slowing-down cross-section cm−1
f Fuel temperature Kf, ref Reference fuel temperature (provided with cross-section data)K
.4. Modelling data requirements
Modelling data requirements were sourced from PBMR asequested by GSE’s technical development team. Data exportedas in the form of Data Requests, which included verification of
ata that was generated. Data that was not available was takenrom citation material (citation material refers to internation-lly published documents), which was found to be acceptableor the modelling requirements. Data generated was from dif-erent nuclear codes such as VSOP (Teuchert et al., 1994) andetry for each mesh cell.
T. Dudley et al. / Nuclear Engineering an
Table 1Base cross-sections
Dg Diffusion group (g) constant; g = 1, 2, 3, 4˙a,g Fuel macroscopic absorption cross-section of group (g), g = 1, 2, 3, 4˙f,g Fuel macroscopic fission cross-section of group (g), g = 1, 2, 3, 4˙s,g→g+1 Fuel macroscopic slowing down cross-section of group (g), g = 1, 2, 3�˙f,g Fuel macroscopic nu-fission cross-section of group (g), g = 1, 2, 3, 4
Symbol Subscripts
Definition
g Refers to neutron group g; g = 1, 2, 3, 4˙a Macroscopic absorption cross-section cm−1
˙˙�
Tf
(
(
2
mbo
fiBeTai
ed
WStc
RttSi
3
nUARtCisfNs
3t
3m
Ri
f Macroscopic fission cross-section cm−1
s Macroscopic scattering cross-section cm−1
Neutron generation per fission
INTE (Gerwin and Scherer, 2001). Data loaded included theollowing:
(a) Geometrical configuration� Matching citation meshes (radial and axial).� PBMR specification description.
b) Neutron cross-sections� Citation Data at 100% power output.� Citation Data at different temperature cross-sections.
(c) Other data� ANSI 5.1 Decay Heat Data.� I-135, Xe-135, Pm-149, Sm-149 cross-section characteristics.
d) Input data from fuel reload analysis codes� Fuel lattice codes: Data as functions of fuel type, exposure,
moderator temperature, fuel temperature, control rod posi-tion.
� Four group cross-sections, Dg, ˙a,g, ��f,g, (s,gg′, (s,g′g, �a,Xe,g, �a, Sm,g, �.
� Decay constants and fission yields of neutron poisons, �I135,�I135, �I135, �I135, �Xe135, �Pm149.
� Six group delayed neutron precursor decay constants andfission yields, �i, �i.
� Neutron lifetime and neutron velocities.
.4.1. Usage of cross-section data in PBMR-REMARK modelThe following base cross-sections are determined for each
esh-cell based on reference temperatures and the mesh-cellurn-up, Xenon and Samarium free, no Reactivity Control Systemr Reserve Shutdown System presence (Table 1).
Fission cross-sections will be derived from dividing the neutron-ssion cross-sections by the value of neutron concentrations.
ased on the number density of Xenon and Samarium inach mesh cell, the absorption cross-sections are calculated.he fast-group absorption cross-section of each mesh-cell isdded with a term to account for Doppler broadening effect asn Eq. (3).(
T
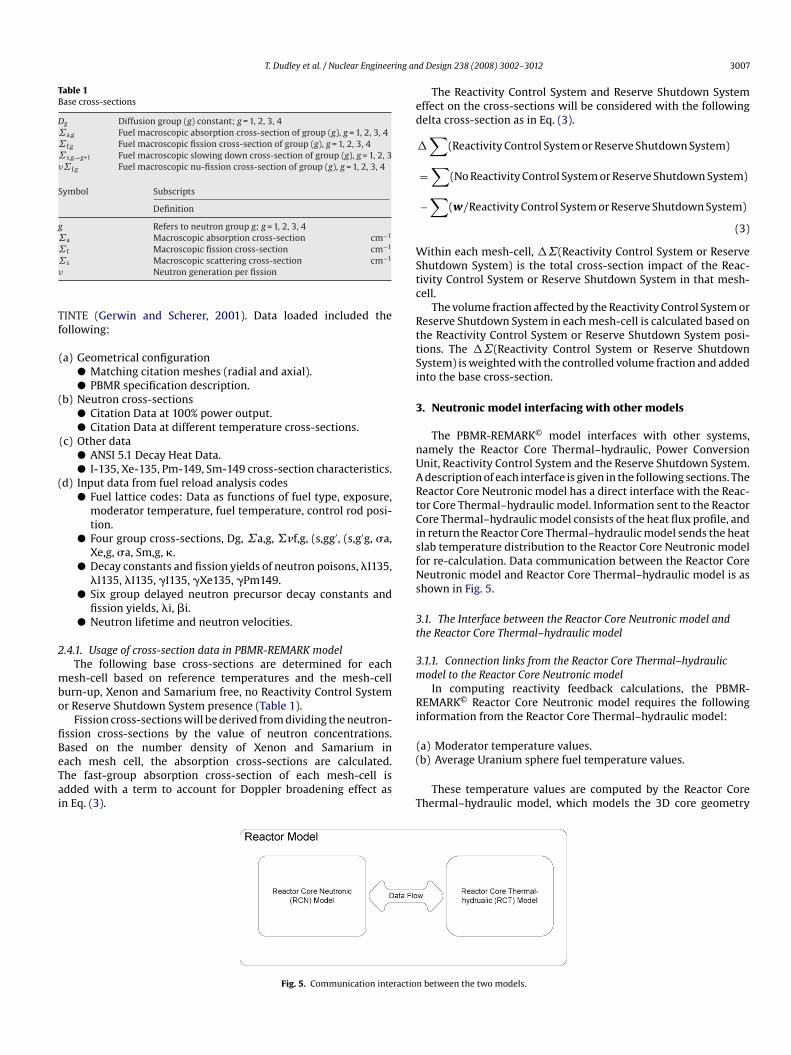
Fig. 5. Communication interactio
d Design 238 (2008) 3002–3012 3007
The Reactivity Control System and Reserve Shutdown Systemffect on the cross-sections will be considered with the followingelta cross-section as in Eq. (3).
�∑
(Reactivity Control System or Reserve Shutdown System)
=∑
(No Reactivity Control System or Reserve Shutdown System)
−∑
(w/Reactivity Control System or Reserve Shutdown System)
(3)
ithin each mesh-cell, �˙(Reactivity Control System or Reservehutdown System) is the total cross-section impact of the Reac-ivity Control System or Reserve Shutdown System in that mesh-ell.
The volume fraction affected by the Reactivity Control System oreserve Shutdown System in each mesh-cell is calculated based onhe Reactivity Control System or Reserve Shutdown System posi-ions. The �˙(Reactivity Control System or Reserve Shutdownystem) is weighted with the controlled volume fraction and addednto the base cross-section.
. Neutronic model interfacing with other models
The PBMR-REMARK© model interfaces with other systems,amely the Reactor Core Thermal–hydraulic, Power Conversionnit, Reactivity Control System and the Reserve Shutdown System.description of each interface is given in the following sections. Theeactor Core Neutronic model has a direct interface with the Reac-or Core Thermal–hydraulic model. Information sent to the Reactorore Thermal–hydraulic model consists of the heat flux profile, and
n return the Reactor Core Thermal–hydraulic model sends the heatlab temperature distribution to the Reactor Core Neutronic modelor re-calculation. Data communication between the Reactor Coreeutronic model and Reactor Core Thermal–hydraulic model is as
hown in Fig. 5.
.1. The Interface between the Reactor Core Neutronic model andhe Reactor Core Thermal–hydraulic model
.1.1. Connection links from the Reactor Core Thermal–hydraulicodel to the Reactor Core Neutronic model
In computing reactivity feedback calculations, the PBMR-EMARK© Reactor Core Neutronic model requires the following
nformation from the Reactor Core Thermal–hydraulic model:
(a) Moderator temperature values.b) Average Uranium sphere fuel temperature values.
These temperature values are computed by the Reactor Corehermal–hydraulic model, which models the 3D core geometry
n between the two models.
3008 T. Dudley et al. / Nuclear Engineering and Design 238 (2008) 3002–3012
Reac
ut2raaoe
idaR
ztalssm
3t
ttiCdehaR
csti
3
aSRitltPtrSi
4
tsetsrnalpaoonao
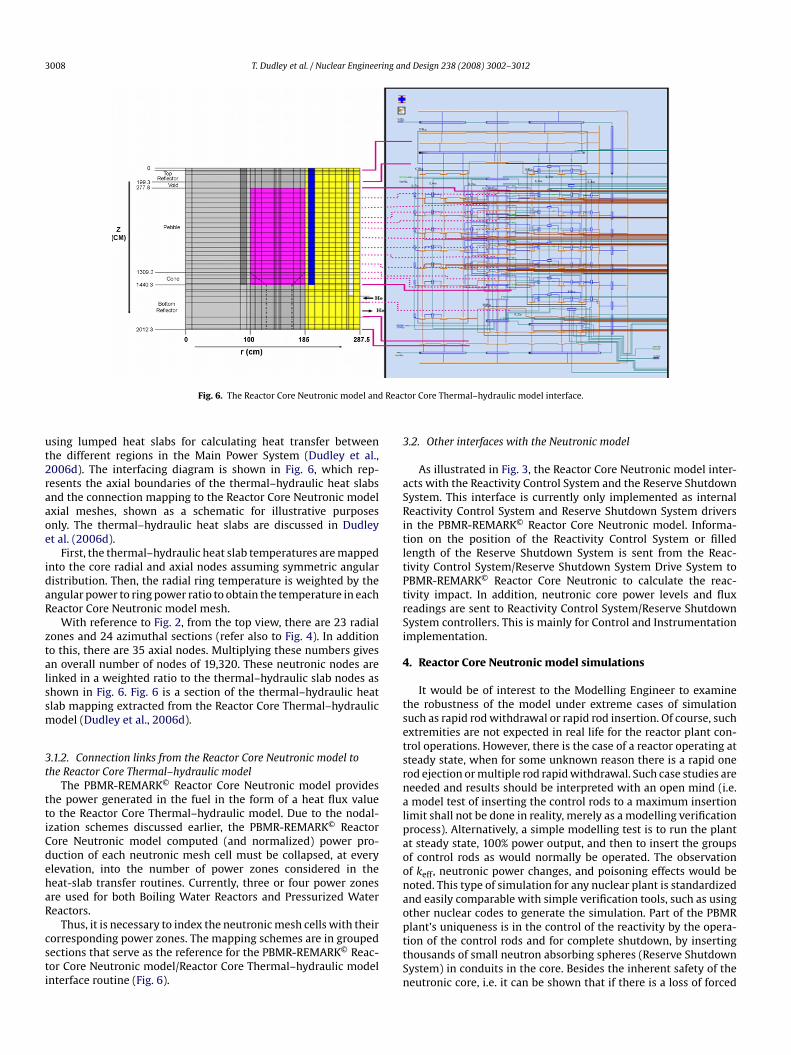
Fig. 6. The Reactor Core Neutronic model and
sing lumped heat slabs for calculating heat transfer betweenhe different regions in the Main Power System (Dudley et al.,006d). The interfacing diagram is shown in Fig. 6, which rep-esents the axial boundaries of the thermal–hydraulic heat slabsnd the connection mapping to the Reactor Core Neutronic modelxial meshes, shown as a schematic for illustrative purposesnly. The thermal–hydraulic heat slabs are discussed in Dudleyt al. (2006d).
First, the thermal–hydraulic heat slab temperatures are mappednto the core radial and axial nodes assuming symmetric angularistribution. Then, the radial ring temperature is weighted by thengular power to ring power ratio to obtain the temperature in eacheactor Core Neutronic model mesh.
With reference to Fig. 2, from the top view, there are 23 radialones and 24 azimuthal sections (refer also to Fig. 4). In additiono this, there are 35 axial nodes. Multiplying these numbers givesn overall number of nodes of 19,320. These neutronic nodes areinked in a weighted ratio to the thermal–hydraulic slab nodes ashown in Fig. 6. Fig. 6 is a section of the thermal–hydraulic heatlab mapping extracted from the Reactor Core Thermal–hydraulicodel (Dudley et al., 2006d).
.1.2. Connection links from the Reactor Core Neutronic model tohe Reactor Core Thermal–hydraulic model
The PBMR-REMARK© Reactor Core Neutronic model provideshe power generated in the fuel in the form of a heat flux valueo the Reactor Core Thermal–hydraulic model. Due to the nodal-zation schemes discussed earlier, the PBMR-REMARK© Reactorore Neutronic model computed (and normalized) power pro-uction of each neutronic mesh cell must be collapsed, at everylevation, into the number of power zones considered in theeat-slab transfer routines. Currently, three or four power zonesre used for both Boiling Water Reactors and Pressurized Watereactors.
Thus, it is necessary to index the neutronic mesh cells with theirorresponding power zones. The mapping schemes are in groupedections that serve as the reference for the PBMR-REMARK© Reac-or Core Neutronic model/Reactor Core Thermal–hydraulic modelnterface routine (Fig. 6).
pttSn
tor Core Thermal–hydraulic model interface.
.2. Other interfaces with the Neutronic model
As illustrated in Fig. 3, the Reactor Core Neutronic model inter-cts with the Reactivity Control System and the Reserve Shutdownystem. This interface is currently only implemented as internaleactivity Control System and Reserve Shutdown System drivers
n the PBMR-REMARK© Reactor Core Neutronic model. Informa-ion on the position of the Reactivity Control System or filledength of the Reserve Shutdown System is sent from the Reac-ivity Control System/Reserve Shutdown System Drive System toBMR-REMARK© Reactor Core Neutronic to calculate the reac-ivity impact. In addition, neutronic core power levels and fluxeadings are sent to Reactivity Control System/Reserve Shutdownystem controllers. This is mainly for Control and Instrumentationmplementation.
. Reactor Core Neutronic model simulations
It would be of interest to the Modelling Engineer to examinehe robustness of the model under extreme cases of simulationuch as rapid rod withdrawal or rapid rod insertion. Of course, suchxtremities are not expected in real life for the reactor plant con-rol operations. However, there is the case of a reactor operating atteady state, when for some unknown reason there is a rapid oneod ejection or multiple rod rapid withdrawal. Such case studies areeeded and results should be interpreted with an open mind (i.e.model test of inserting the control rods to a maximum insertion
imit shall not be done in reality, merely as a modelling verificationrocess). Alternatively, a simple modelling test is to run the plantt steady state, 100% power output, and then to insert the groupsf control rods as would normally be operated. The observationf keff, neutronic power changes, and poisoning effects would beoted. This type of simulation for any nuclear plant is standardizednd easily comparable with simple verification tools, such as usingther nuclear codes to generate the simulation. Part of the PBMR
lant’s uniqueness is in the control of the reactivity by the opera-ion of the control rods and for complete shutdown, by insertinghousands of small neutron absorbing spheres (Reserve Shutdownystem) in conduits in the core. Besides the inherent safety of theeutronic core, i.e. it can be shown that if there is a loss of forced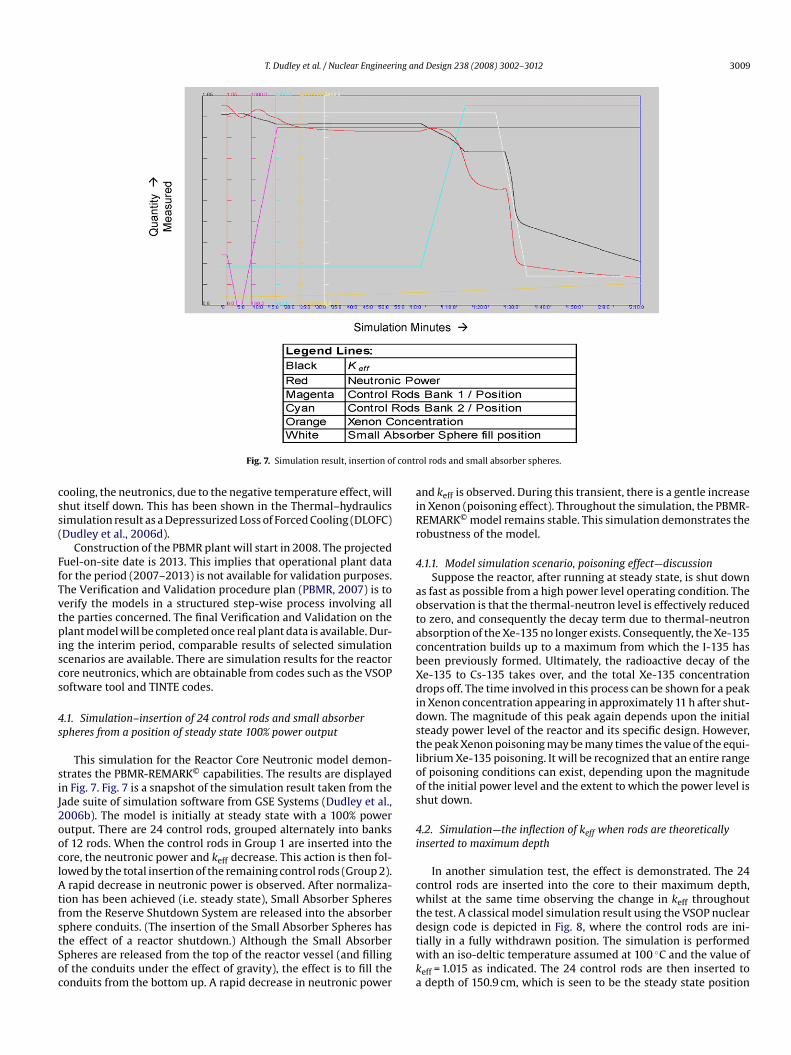
T. Dudley et al. / Nuclear Engineering and Design 238 (2008) 3002–3012 3009
contr
css(
FfTvtpiscs
4s
siJ2ooclAtfstSoc
aiRr
4
aotacbXdidstloos
4i
cwt
Fig. 7. Simulation result, insertion of
ooling, the neutronics, due to the negative temperature effect, willhut itself down. This has been shown in the Thermal–hydraulicsimulation result as a Depressurized Loss of Forced Cooling (DLOFC)Dudley et al., 2006d).
Construction of the PBMR plant will start in 2008. The projecteduel-on-site date is 2013. This implies that operational plant dataor the period (2007–2013) is not available for validation purposes.he Verification and Validation procedure plan (PBMR, 2007) is toerify the models in a structured step-wise process involving allhe parties concerned. The final Verification and Validation on thelant model will be completed once real plant data is available. Dur-
ng the interim period, comparable results of selected simulationcenarios are available. There are simulation results for the reactorore neutronics, which are obtainable from codes such as the VSOPoftware tool and TINTE codes.
.1. Simulation–insertion of 24 control rods and small absorberpheres from a position of steady state 100% power output
This simulation for the Reactor Core Neutronic model demon-trates the PBMR-REMARK© capabilities. The results are displayedn Fig. 7. Fig. 7 is a snapshot of the simulation result taken from theade suite of simulation software from GSE Systems (Dudley et al.,006b). The model is initially at steady state with a 100% powerutput. There are 24 control rods, grouped alternately into banksf 12 rods. When the control rods in Group 1 are inserted into theore, the neutronic power and keff decrease. This action is then fol-owed by the total insertion of the remaining control rods (Group 2).
rapid decrease in neutronic power is observed. After normaliza-ion has been achieved (i.e. steady state), Small Absorber Spheresrom the Reserve Shutdown System are released into the absorber
phere conduits. (The insertion of the Small Absorber Spheres hashe effect of a reactor shutdown.) Although the Small Absorberpheres are released from the top of the reactor vessel (and fillingf the conduits under the effect of gravity), the effect is to fill theonduits from the bottom up. A rapid decrease in neutronic powerdtwka
ol rods and small absorber spheres.
nd keff is observed. During this transient, there is a gentle increasen Xenon (poisoning effect). Throughout the simulation, the PBMR-EMARK© model remains stable. This simulation demonstrates theobustness of the model.
.1.1. Model simulation scenario, poisoning effect—discussionSuppose the reactor, after running at steady state, is shut down
s fast as possible from a high power level operating condition. Thebservation is that the thermal-neutron level is effectively reducedo zero, and consequently the decay term due to thermal-neutronbsorption of the Xe-135 no longer exists. Consequently, the Xe-135oncentration builds up to a maximum from which the I-135 haseen previously formed. Ultimately, the radioactive decay of thee-135 to Cs-135 takes over, and the total Xe-135 concentrationrops off. The time involved in this process can be shown for a peak
n Xenon concentration appearing in approximately 11 h after shut-own. The magnitude of this peak again depends upon the initialteady power level of the reactor and its specific design. However,he peak Xenon poisoning may be many times the value of the equi-ibrium Xe-135 poisoning. It will be recognized that an entire rangef poisoning conditions can exist, depending upon the magnitudef the initial power level and the extent to which the power level ishut down.
.2. Simulation—the inflection of keff when rods are theoreticallynserted to maximum depth
In another simulation test, the effect is demonstrated. The 24ontrol rods are inserted into the core to their maximum depth,hilst at the same time observing the change in keff throughout
he test. A classical model simulation result using the VSOP nuclear
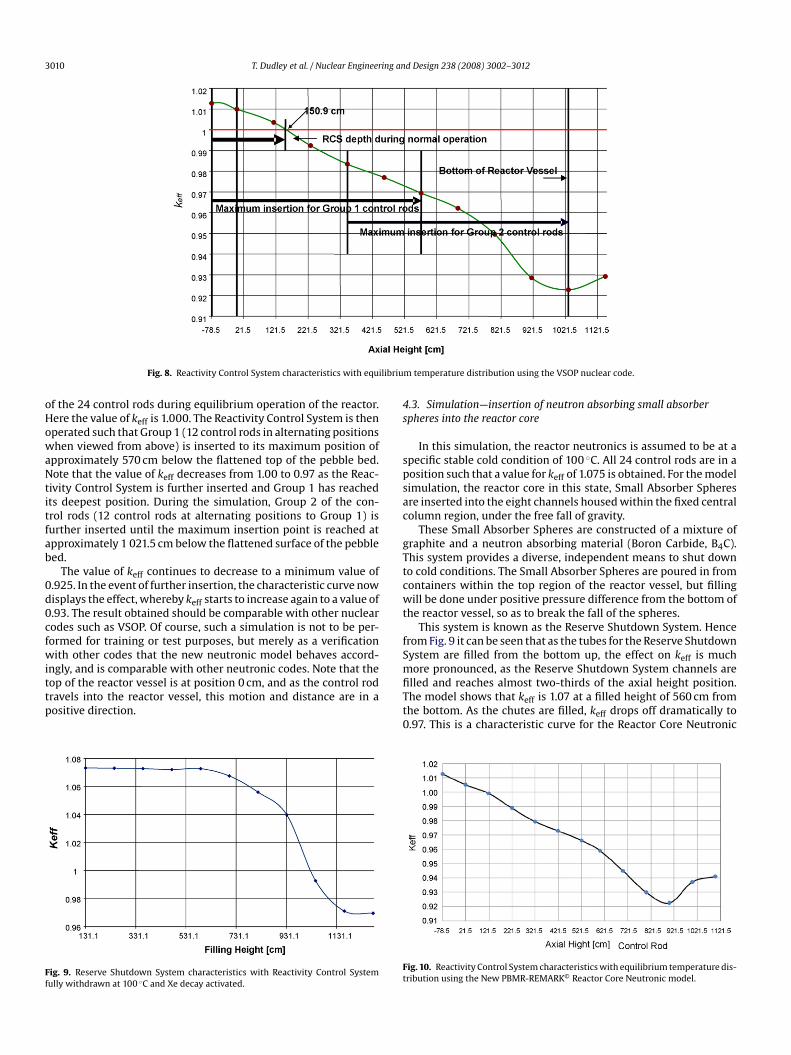
esign code is depicted in Fig. 8, where the control rods are ini-ially in a fully withdrawn position. The simulation is performedith an iso-deltic temperature assumed at 100 ◦C and the value ofeff = 1.015 as indicated. The 24 control rods are then inserted todepth of 150.9 cm, which is seen to be the steady state position
3010 T. Dudley et al. / Nuclear Engineering and Design 238 (2008) 3002–3012
libriu
oHowaNtitfab
0d0cfwittp
Ff
4s
spsac
gTtcwt
fS
Fig. 8. Reactivity Control System characteristics with equi
f the 24 control rods during equilibrium operation of the reactor.ere the value of keff is 1.000. The Reactivity Control System is thenperated such that Group 1 (12 control rods in alternating positionshen viewed from above) is inserted to its maximum position of
pproximately 570 cm below the flattened top of the pebble bed.ote that the value of keff decreases from 1.00 to 0.97 as the Reac-
ivity Control System is further inserted and Group 1 has reachedts deepest position. During the simulation, Group 2 of the con-rol rods (12 control rods at alternating positions to Group 1) isurther inserted until the maximum insertion point is reached atpproximately 1 021.5 cm below the flattened surface of the pebbleed.
The value of keff continues to decrease to a minimum value of.925. In the event of further insertion, the characteristic curve nowisplays the effect, whereby keff starts to increase again to a value of.93. The result obtained should be comparable with other nuclearodes such as VSOP. Of course, such a simulation is not to be per-ormed for training or test purposes, but merely as a verificationith other codes that the new neutronic model behaves accord-
ngly, and is comparable with other neutronic codes. Note that theop of the reactor vessel is at position 0 cm, and as the control rodravels into the reactor vessel, this motion and distance are in aositive direction.
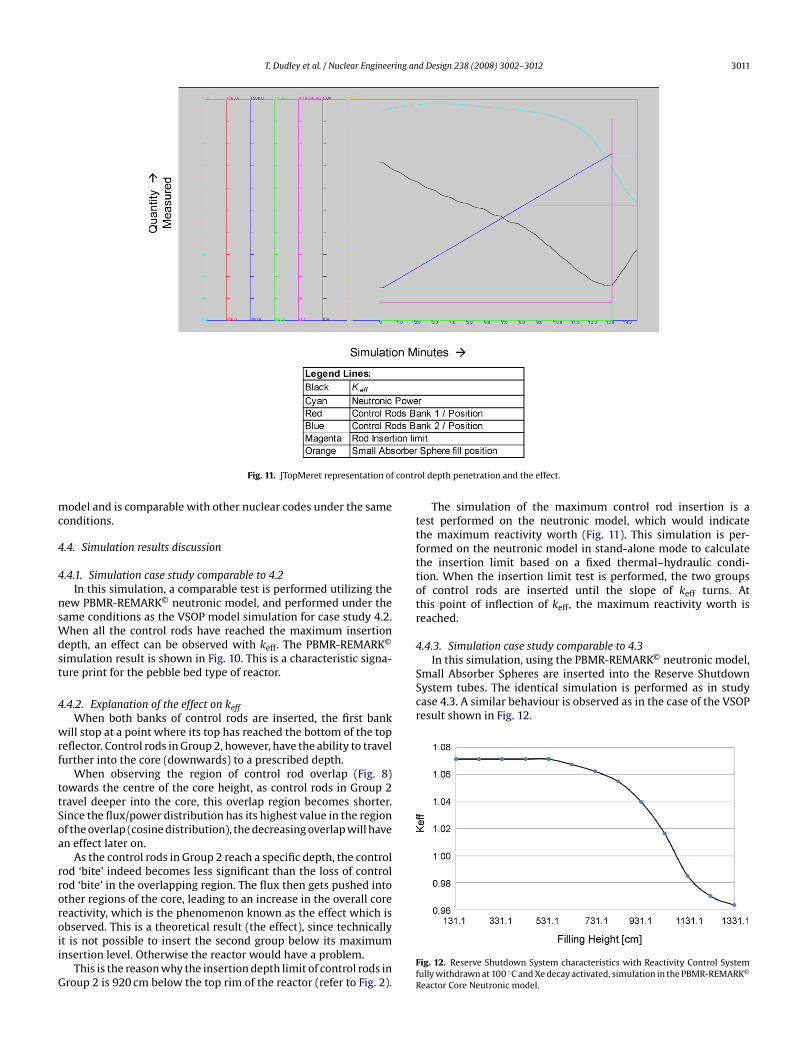
ig. 9. Reserve Shutdown System characteristics with Reactivity Control Systemully withdrawn at 100 ◦C and Xe decay activated.
mfiTt0
Ft
m temperature distribution using the VSOP nuclear code.
.3. Simulation—insertion of neutron absorbing small absorberpheres into the reactor core
In this simulation, the reactor neutronics is assumed to be at apecific stable cold condition of 100 ◦C. All 24 control rods are in aosition such that a value for keff of 1.075 is obtained. For the modelimulation, the reactor core in this state, Small Absorber Spheresre inserted into the eight channels housed within the fixed centralolumn region, under the free fall of gravity.
These Small Absorber Spheres are constructed of a mixture ofraphite and a neutron absorbing material (Boron Carbide, B4C).his system provides a diverse, independent means to shut downo cold conditions. The Small Absorber Spheres are poured in fromontainers within the top region of the reactor vessel, but fillingill be done under positive pressure difference from the bottom of
he reactor vessel, so as to break the fall of the spheres.This system is known as the Reserve Shutdown System. Hence
rom Fig. 9 it can be seen that as the tubes for the Reserve Shutdownystem are filled from the bottom up, the effect on keff is muchore pronounced, as the Reserve Shutdown System channels are
lled and reaches almost two-thirds of the axial height position.he model shows that keff is 1.07 at a filled height of 560 cm fromhe bottom. As the chutes are filled, keff drops off dramatically to.97. This is a characteristic curve for the Reactor Core Neutronic
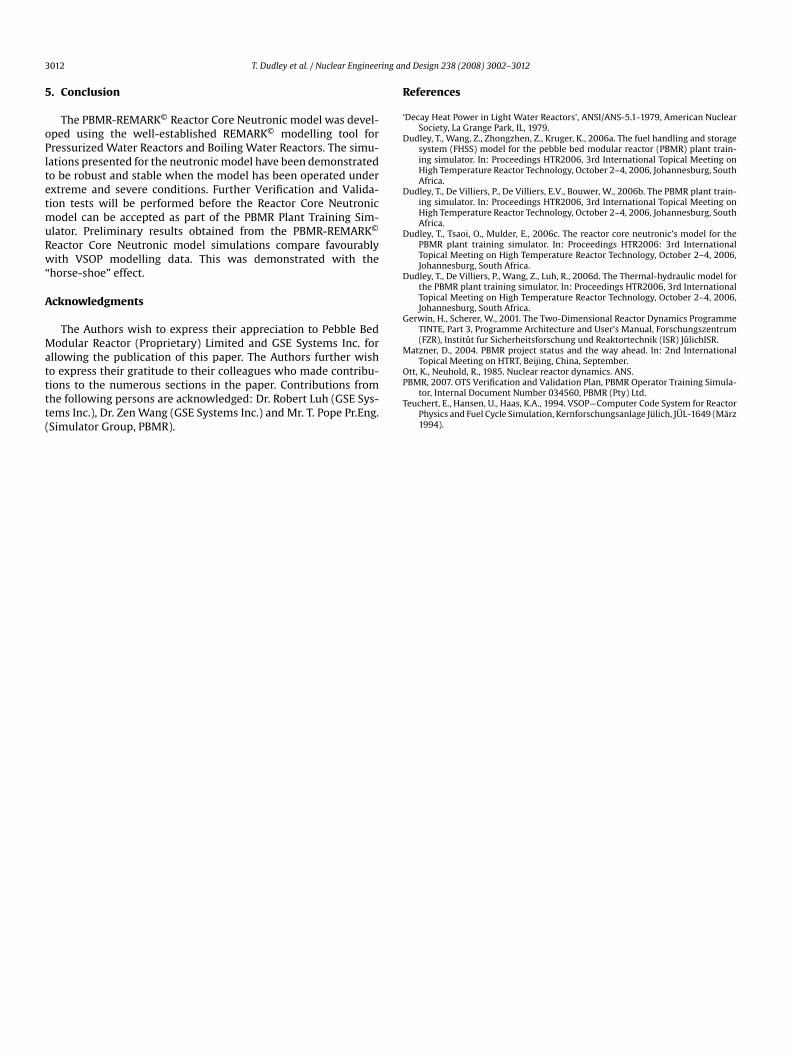
ig. 10. Reactivity Control System characteristics with equilibrium temperature dis-ribution using the New PBMR-REMARK© Reactor Core Neutronic model.
T. Dudley et al. / Nuclear Engineering and Design 238 (2008) 3002–3012 3011
contr
mc
4
4
nsWdst
4
wrf
ttSoa
rroroii
G
ttfttotr
4In this simulation, using the PBMR-REMARK© neutronic model,
Small Absorber Spheres are inserted into the Reserve ShutdownSystem tubes. The identical simulation is performed as in studycase 4.3. A similar behaviour is observed as in the case of the VSOPresult shown in Fig. 12.
Fig. 11. JTopMeret representation of
odel and is comparable with other nuclear codes under the sameonditions.
.4. Simulation results discussion
.4.1. Simulation case study comparable to 4.2In this simulation, a comparable test is performed utilizing the
ew PBMR-REMARK© neutronic model, and performed under theame conditions as the VSOP model simulation for case study 4.2.
hen all the control rods have reached the maximum insertionepth, an effect can be observed with keff. The PBMR-REMARK©
imulation result is shown in Fig. 10. This is a characteristic signa-ure print for the pebble bed type of reactor.
.4.2. Explanation of the effect on keffWhen both banks of control rods are inserted, the first bank
ill stop at a point where its top has reached the bottom of the topeflector. Control rods in Group 2, however, have the ability to travelurther into the core (downwards) to a prescribed depth.
When observing the region of control rod overlap (Fig. 8)owards the centre of the core height, as control rods in Group 2ravel deeper into the core, this overlap region becomes shorter.ince the flux/power distribution has its highest value in the regionf the overlap (cosine distribution), the decreasing overlap will haven effect later on.
As the control rods in Group 2 reach a specific depth, the controlod ‘bite’ indeed becomes less significant than the loss of controlod ‘bite’ in the overlapping region. The flux then gets pushed intother regions of the core, leading to an increase in the overall coreeactivity, which is the phenomenon known as the effect which is
bserved. This is a theoretical result (the effect), since technicallyt is not possible to insert the second group below its maximumnsertion level. Otherwise the reactor would have a problem.This is the reason why the insertion depth limit of control rods inroup 2 is 920 cm below the top rim of the reactor (refer to Fig. 2).
FfR
ol depth penetration and the effect.
The simulation of the maximum control rod insertion is aest performed on the neutronic model, which would indicatehe maximum reactivity worth (Fig. 11). This simulation is per-ormed on the neutronic model in stand-alone mode to calculatehe insertion limit based on a fixed thermal–hydraulic condi-ion. When the insertion limit test is performed, the two groupsf control rods are inserted until the slope of keff turns. Athis point of inflection of keff, the maximum reactivity worth iseached.
.4.3. Simulation case study comparable to 4.3
ig. 12. Reserve Shutdown System characteristics with Reactivity Control Systemully withdrawn at 100 ◦C and Xe decay activated, simulation in the PBMR-REMARK©
eactor Core Neutronic model.
3 ing an
5
oPltetmuRw“
A
Matttt(
R
‘
D
D
D
D
G
M
012 T. Dudley et al. / Nuclear Engineer
. Conclusion
The PBMR-REMARK© Reactor Core Neutronic model was devel-ped using the well-established REMARK© modelling tool forressurized Water Reactors and Boiling Water Reactors. The simu-ations presented for the neutronic model have been demonstratedo be robust and stable when the model has been operated underxtreme and severe conditions. Further Verification and Valida-ion tests will be performed before the Reactor Core Neutronic
odel can be accepted as part of the PBMR Plant Training Sim-lator. Preliminary results obtained from the PBMR-REMARK©
eactor Core Neutronic model simulations compare favourablyith VSOP modelling data. This was demonstrated with the
horse-shoe” effect.
cknowledgments
The Authors wish to express their appreciation to Pebble Bedodular Reactor (Proprietary) Limited and GSE Systems Inc. for
llowing the publication of this paper. The Authors further wish
o express their gratitude to their colleagues who made contribu-ions to the numerous sections in the paper. Contributions fromhe following persons are acknowledged: Dr. Robert Luh (GSE Sys-ems Inc.), Dr. Zen Wang (GSE Systems Inc.) and Mr. T. Pope Pr.Eng.Simulator Group, PBMR).OP
T
d Design 238 (2008) 3002–3012
eferences
Decay Heat Power in Light Water Reactors’, ANSI/ANS-5.1-1979, American NuclearSociety, La Grange Park, IL, 1979.
udley, T., Wang, Z., Zhongzhen, Z., Kruger, K., 2006a. The fuel handling and storagesystem (FHSS) model for the pebble bed modular reactor (PBMR) plant train-ing simulator. In: Proceedings HTR2006, 3rd International Topical Meeting onHigh Temperature Reactor Technology, October 2–4, 2006, Johannesburg, SouthAfrica.
udley, T., De Villiers, P., De Villiers, E.V., Bouwer, W., 2006b. The PBMR plant train-ing simulator. In: Proceedings HTR2006, 3rd International Topical Meeting onHigh Temperature Reactor Technology, October 2–4, 2006, Johannesburg, SouthAfrica.
udley, T., Tsaoi, O., Mulder, E., 2006c. The reactor core neutronic’s model for thePBMR plant training simulator. In: Proceedings HTR2006: 3rd InternationalTopical Meeting on High Temperature Reactor Technology, October 2–4, 2006,Johannesburg, South Africa.
udley, T., De Villiers, P., Wang, Z., Luh, R., 2006d. The Thermal-hydraulic model forthe PBMR plant training simulator. In: Proceedings HTR2006, 3rd InternationalTopical Meeting on High Temperature Reactor Technology, October 2–4, 2006,Johannesburg, South Africa.
erwin, H., Scherer, W., 2001. The Two-Dimensional Reactor Dynamics ProgrammeTINTE, Part 3, Programme Architecture and User’s Manual, Forschungszentrum(FZR), Institut fur Sicherheitsforschung und Reaktortechnik (ISR) JulichISR.
atzner, D., 2004. PBMR project status and the way ahead. In: 2nd InternationalTopical Meeting on HTRT, Beijing, China, September.
tt, K., Neuhold, R., 1985. Nuclear reactor dynamics. ANS.BMR, 2007. OTS Verification and Validation Plan, PBMR Operator Training Simula-
tor, Internal Document Number 034560, PBMR (Pty) Ltd.euchert, E., Hansen, U., Haas, K.A., 1994. VSOP—Computer Code System for Reactor
Physics and Fuel Cycle Simulation, Kernforschungsanlage Julich, JUL-1649 (Marz1994).