null models and observed patterns of native and exotic diversity: does native richness repel...
Post on 19-Dec-2015
217 views
TRANSCRIPT
Null models and observed patterns of native and exotic diversity: Does native
richness repel invasion?
Rebecca L. Brown,Rebecca L. Brown,1,21,2 Jason D. Fridley, Jason D. Fridley,11
and John F. Brunoand John F. Bruno11
11University of North Carolina-Chapel HillUniversity of North Carolina-Chapel Hill22Patrick Center for Environmental Research Patrick Center for Environmental Research

Diversity
Inva
sio
n
Prieur-Richard et al. 2000 Stachowitz et al. 2002 Dukes 2002 Tilman 1997 Hector et al. 2001 Knops et al. 1999
(mostly experimental)
Stohlgren and Chong 2002 Wiser et al. 1998 Bruno et al. 2002 Burger et al. 2001 Sax 2002Lonsdale 1999
(mostly observational)
Levine 2001Lavorel et al. 1999. Brown and Fridley 2003 Duncan 1996Stohlgren et al. 1998Brown and Peet 2003
Does diversity control invasion?
Diversity
Inva
sio
n+ -
Confounded or neutral relationship
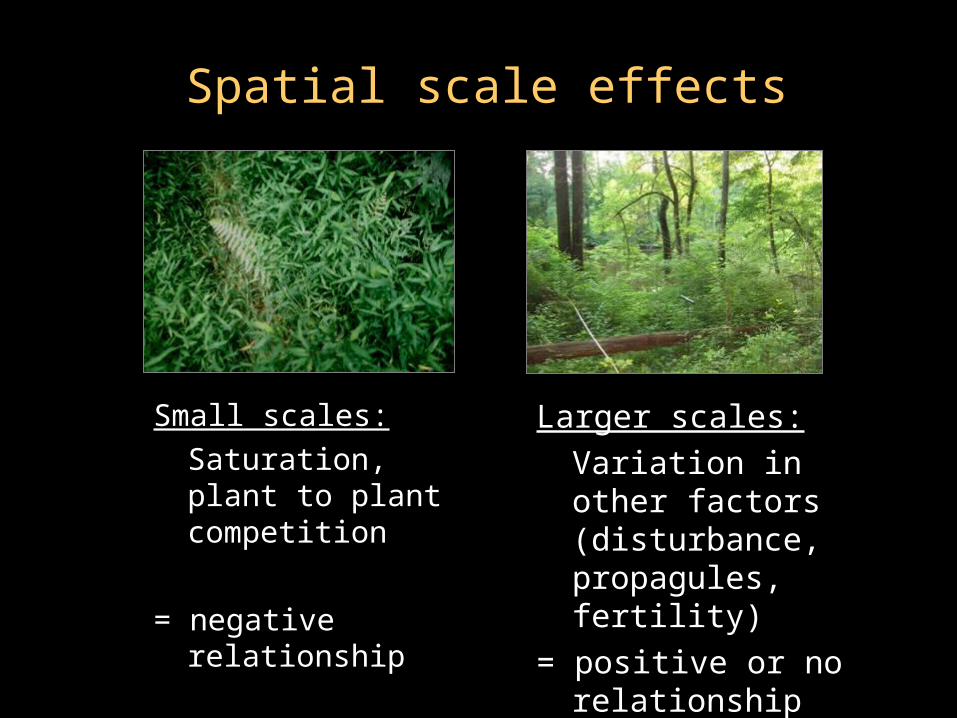
Small scales:
Saturation, plant to plant competition
= negative relationship
Spatial scale effects
Larger scales:
Variation in other factors (disturbance, propagules, fertility)
= positive or no relationship
0 2 4 6 8 100
12
30 5 10 15 20
01
23
4
0 1 2 3 4 5
01
23
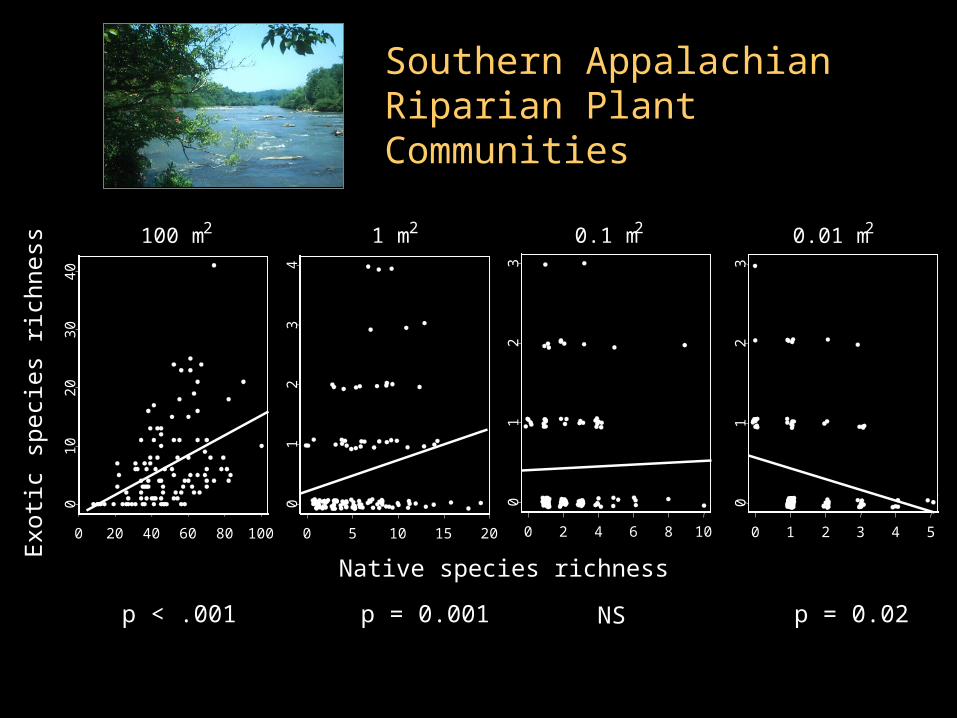
Native species richness
Exo
tic s
peci
es r
ichn
ess
100 m2 1 m2 0.1 m2 0.01 m2
0 20 40 60 80 100
010
2030
40Southern Appalachian Riparian Plant Communities
NS p = 0.02p < .001 p = 0.001
What is the scale-dependence of the native-exotic richness relationship in a randomly assembled community?
BUT – do these relationships imply biological mechanisms or could they be observed in randomly assembled
communities?
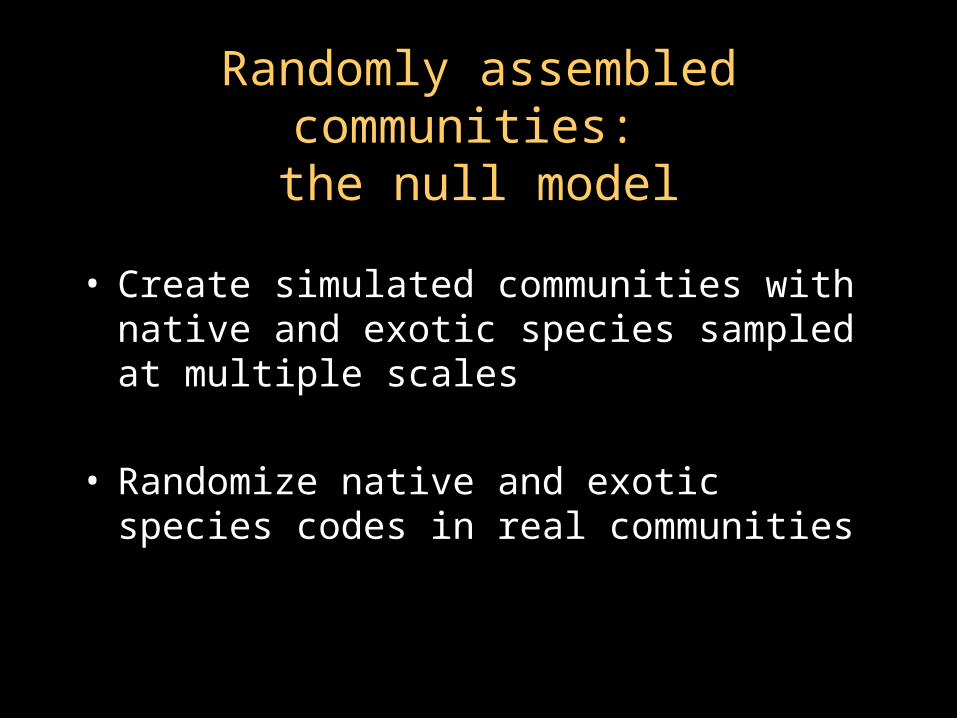
Randomly assembled communities: the null model
• Create simulated communities with native and exotic species sampled at multiple scales
• Randomize native and exotic species codes in real communities
5
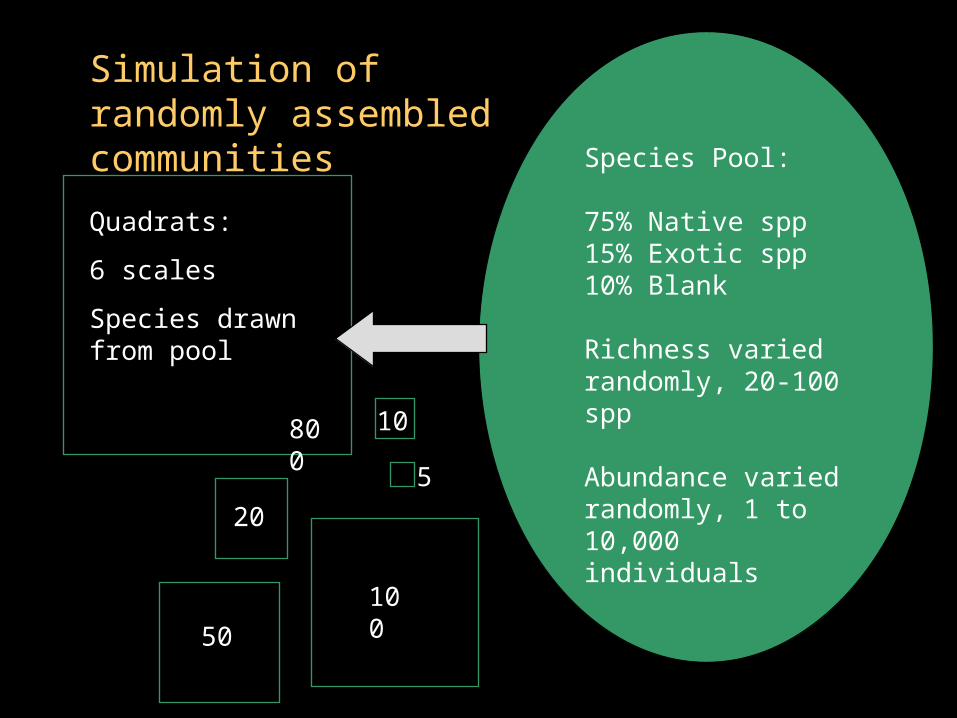
Species Pool:
75% Native spp15% Exotic spp10% Blank
Richness varied randomly, 20-100 spp
Abundance varied randomly, 1 to 10,000 individuals
Quadrats:
6 scales
Species drawn from pool
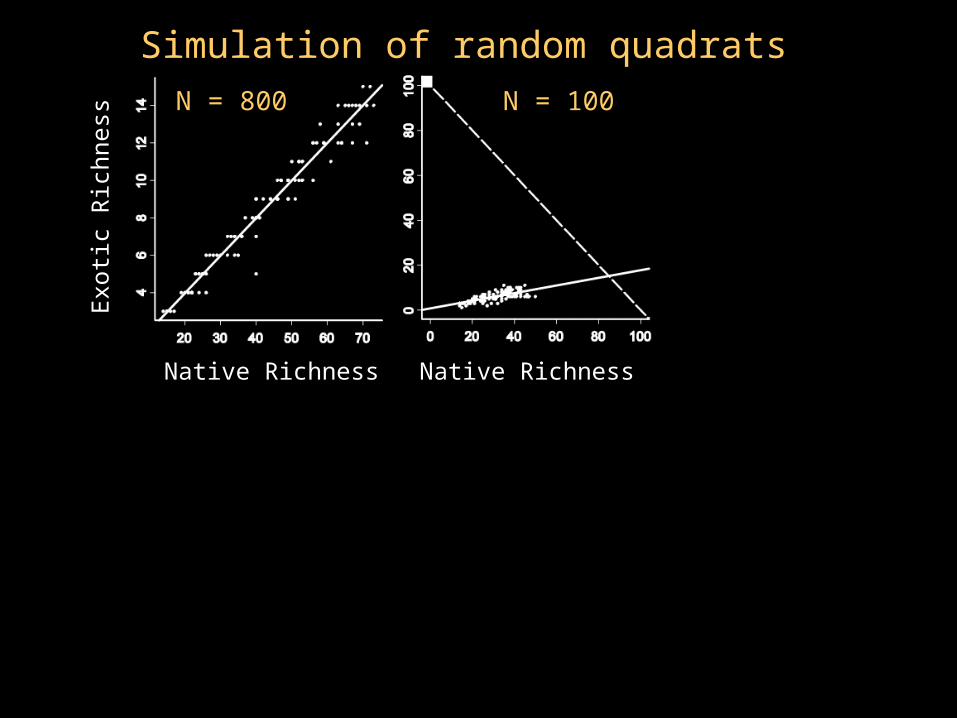
Simulation of randomly assembled communities
800
100
50
20
10
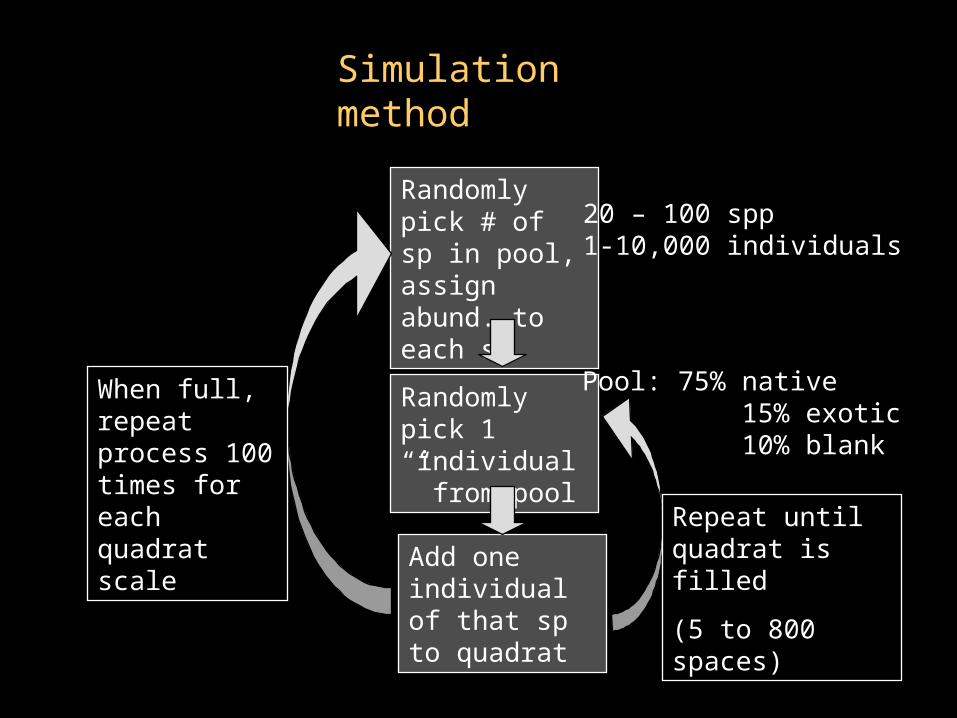
Simulation method
Randomly pick # of sp in pool, assign abund. to each sp
Randomly pick 1 “individual” from pool
Add one individual of that sp to quadrat
Repeat until quadrat is filled
(5 to 800 spaces)
When full, repeat process 100 times for each quadrat scale
20 – 100 spp1-10,000 individuals
Pool: 75% native 15% exotic 10% blank
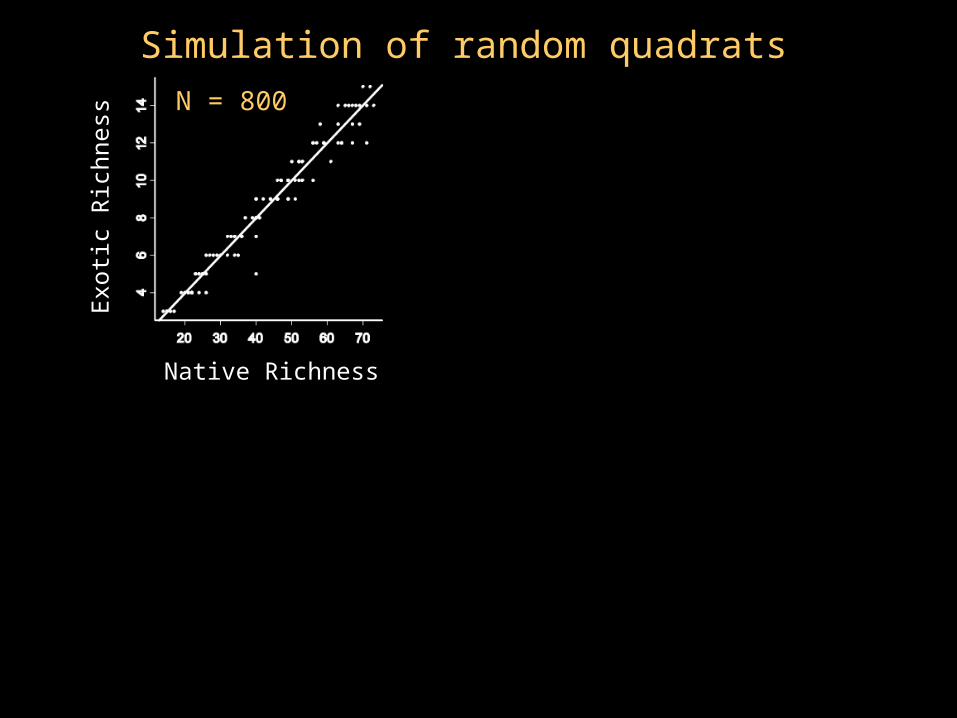
Exo
tic R
ichn
ess
Native Richness
N = 800
Simulation of random quadrats
Exo
tic R
ichn
ess
Native Richness Native Richness
N = 800 N = 100
Simulation of random quadrats

Exo
tic R
ichn
ess
Native RichnessNative Richness Native Richness
N = 800 N = 100 N = 50
Simulation of random quadrats
Exo
tic R
ichn
ess
Native RichnessNative Richness
Native Richness
Exo
tic R
ichn
ess
N = 800 N = 100 N = 50
N = 20
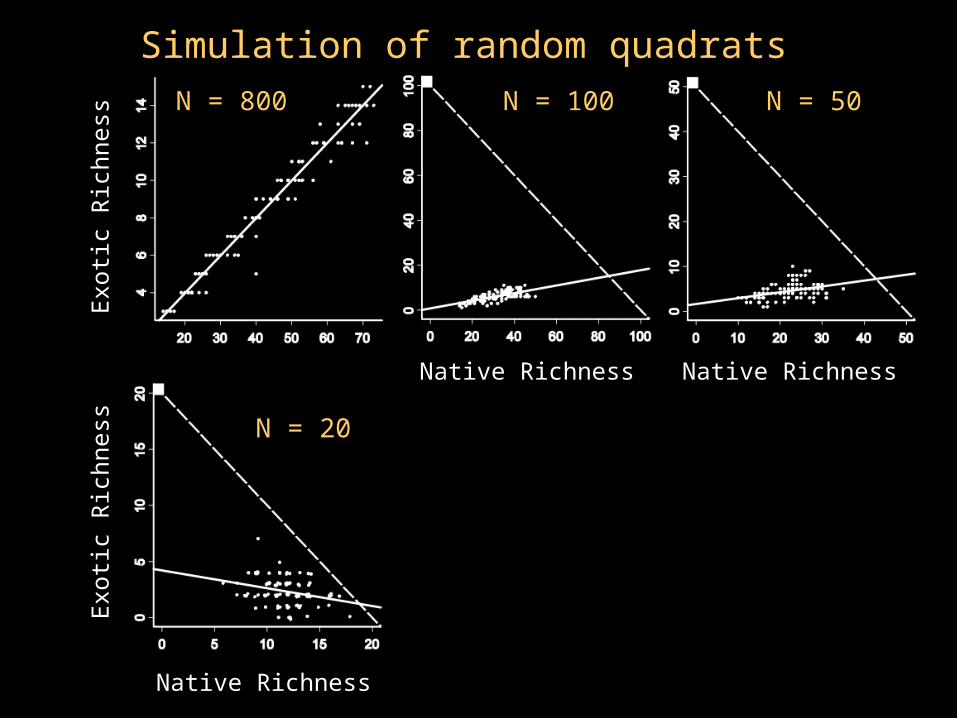
Simulation of random quadrats

Exo
tic R
ichn
ess
Native Richness Native Richness
Exo
tic R
ichn
ess
Native Richness
N = 800 N = 100 N = 50N = 50
N = 20 N = 10
Simulation of random quadrats
Exo
tic R
ichn
ess
Native Richness Native Richness Native Richness
Exo
tic R
ichn
ess
N = 800 N = 100 N = 50
N = 20 N = 5N = 10
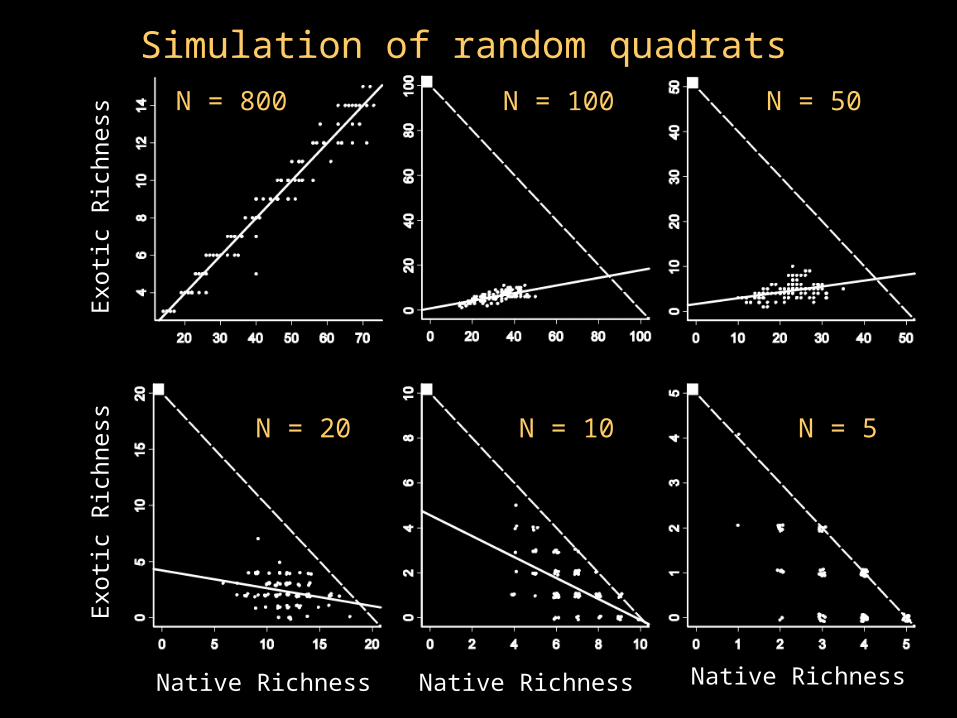
Simulation of random quadrats

0 50 100
Native species richness
05
01
00
Ex
oti
c s
pe
cie
s r
ich
ne
ss
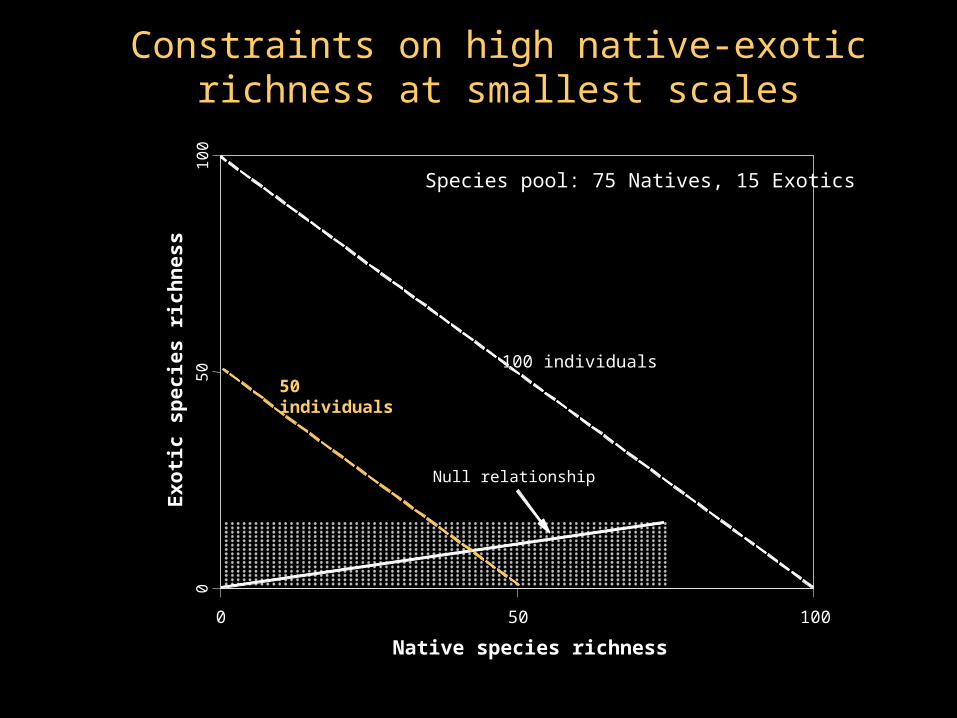
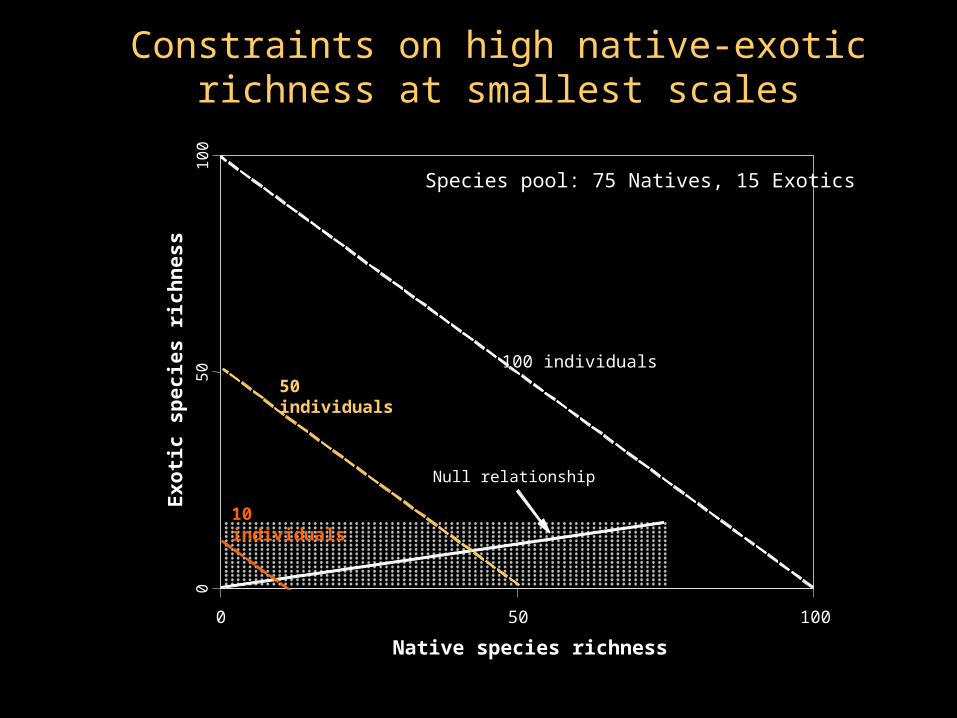
Constraints on high native-exotic richness at smallest scales
100 individuals
Null relationship
Species pool: 75 Natives, 15 Exotics
0 50 100
Native species richness
05
01
00
Ex
oti
c s
pe
cie
s r
ich
ne
ss
Constraints on high native-exotic richness at smallest scales
100 individuals
50 individuals
Null relationship
Species pool: 75 Natives, 15 Exotics
0 50 100
Native species richness
05
01
00
Ex
oti
c s
pe
cie
s r
ich
ne
ss
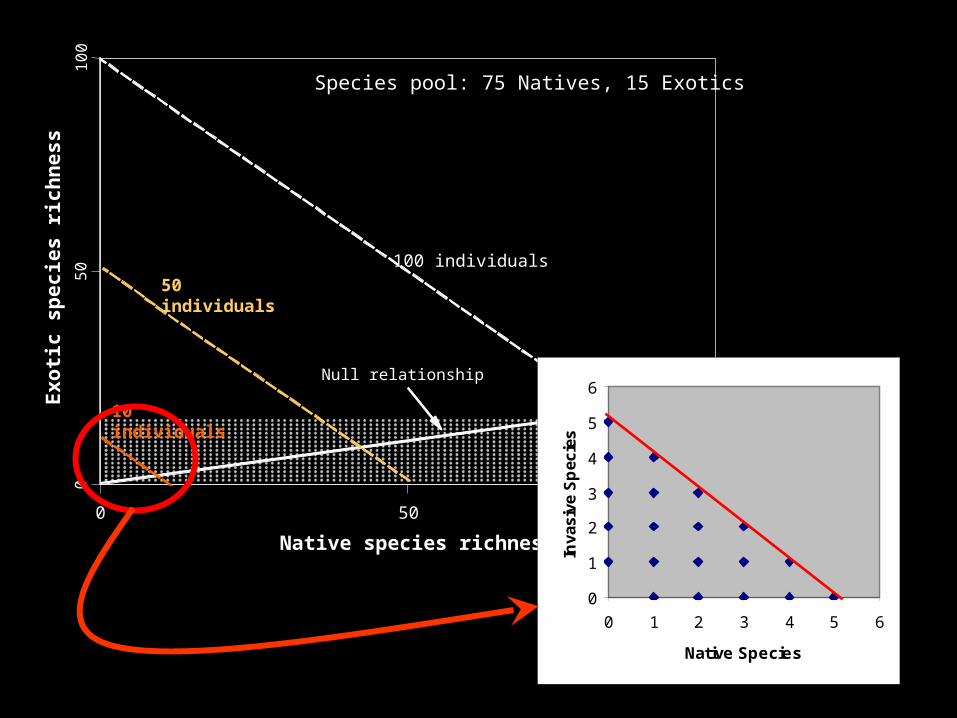
Constraints on high native-exotic richness at smallest scales
100 individuals
50 individuals
Null relationship
Species pool: 75 Natives, 15 Exotics
10 individuals
0 50 100
Native species richness
05
01
00
Ex
oti
c s
pe
cie
s r
ich
ne
ss
100 individuals
50 individuals
Null relationship
Species pool: 75 Natives, 15 Exotics
10 individuals
0
1
2
3
4
5
6
0 1 2 3 4 5 6
Native Species
Inva
sive
Sp
ecie
s

Summary – Simulated Data
• In simulated randomly assembled communities, the relationship between native and exotic richness is positive at large scales, and negative at small scales
• Positive: because plots differ in total richness; slope is simply ratio of natives to exotics in the species pool
• Negative: due to constraints on total richness at very small scales
Next: real data
To test whether observed patterns of native and exotic species richness are different from pattern generated by random assembly (the null expectation):
– Randomize native and exotic species labels in the species pool

Permutation tests for observational data
Species pool
Sp A
Sp B
Sp C
Sp D
Nativity Label
Native
Exotic
Native
Native
Permuted Label
Exotic
Native
Native
Native
• Calculate correlation coefficient (r) or slope (s)Calculate correlation coefficient (r) or slope (s)
• Repeat 500x, compare null distribution to real valueRepeat 500x, compare null distribution to real value

0 2 4 6 8 100
12
30 5 10 15 20
01
23
4
0 1 2 3 4 5
01
23
Native species richness
Exo
tic s
peci
es r
ichn
ess
100 m2 1 m2 0.1 m2 0.01 m2
0 20 40 60 80 100
010
2030
40Actual results: Riparian plant communities
NS p = 0.02p < .001 p = 0.001
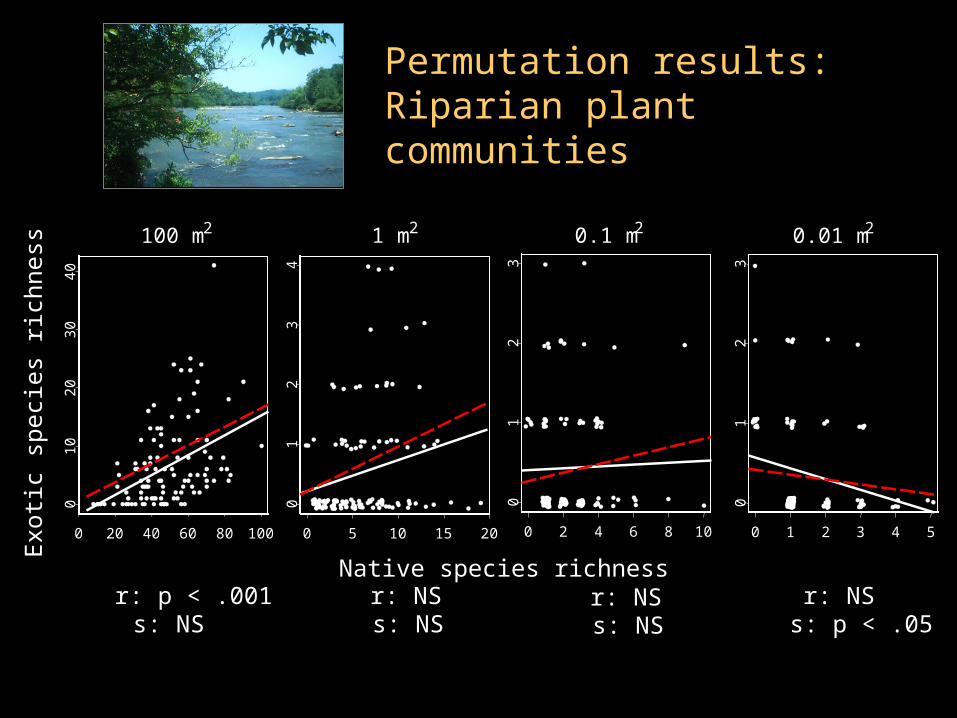
Permutation results: Riparian plant communities
0 2 4 6 8 100
12
30 5 10 15 20
01
23
4
0 1 2 3 4 5
01
23
r: NSs: NS
r: NSs: p < .05
r: p < .001s: NS
Native species richness
Exo
tic s
peci
es r
ichn
ess
100 m2 1 m2 0.1 m2 0.01 m2
0 20 40 60 80 100
010
2030
40
r: NSs: NS
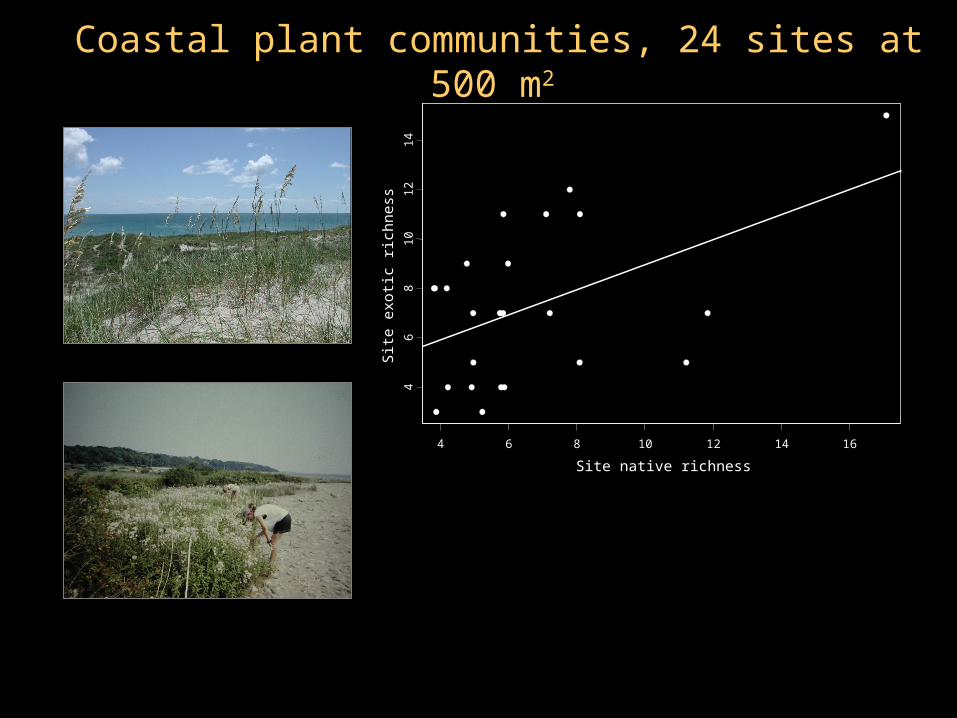
Coastal plant communities, 24 sites at 500 m2
4 6 8 10 12 14 16
Site native richness
46
81
01
21
4
Site
exo
tic r
ichn
ess

Coastal plant communities, 24 sites at 500 m2
4 6 8 10 12 14 16
Site native richness
46
81
01
21
4
Site
exo
tic r
ichn
ess
0.0 0.2 0.4 0.6 0.8
Correlation coefficient (r)
Prob
ability
Observed r
Conclusions
• The native-exotic richness relationship is scale-dependent, BUT, this is the null expectation– With our null model – “competition” for space
among individuals, not species
• It is important to consider the null expectation when evaluating mechanistic explanations for patterns in data
Acknowledgements
Advising and DiscussionAdvising and Discussion: Bob Peet, Peter White, : Bob Peet, Peter White, Jim McNair, UNC Plant Ecology LabJim McNair, UNC Plant Ecology Lab
FundingFunding: National Science Foundation, UNC : National Science Foundation, UNC Graduate School, UNC Department of Biology, Graduate School, UNC Department of Biology, UNC Ecology Curriculum, Sigma Xi, The Nature UNC Ecology Curriculum, Sigma Xi, The Nature Conservancy, USDA National Forest Service, Conservancy, USDA National Forest Service, Patrick Center for Environmental ResearchPatrick Center for Environmental Research
Field crewsField crews