number 172 0 august 24, 1989 adva-nce data
TRANSCRIPT

Number 172 0 August 24, 1989
Adva-nceDataFrom Vital and Health Statistics of the National Center for Health Statistics
Characteristics of Persons Dying of Diseases of Heart Preliminary Data From the 1986 National Mortality Followback Survey
by Gloria Kapantais, M.A., and Eve Powell-Griner, Ph. D., Office of Vital and Health Statistics Systems
Introduction
More people in the United States die from Diseases of heart than from any other cause. In 1986, a total of 765,490 deaths were assigned to this cause, representing 36 percent of all deaths in the United States (1). Although the death rates for Diseases of heart have steadily declined in recent years, it has remained the leading cause of death for both women and men. Heart disease occurs primarily in people of middle and advanced age. Age-specific death rates from Diseases of heart reflect this in 19S6, rates ranged from 144.6 per 100,000 persons 45-54 years of age to 7,17S.7 per 100,000 persons aged S5 or older (2). Data on the sociodemographic and economic characterististics, health care and costs, and health status of persons who died from Diseases of heart in 19S6 are presented in this report. These national estimates are from the 19S6 National Mortality Followback Survey (NMFS). Characteristics of all decedents included in the 19S6 NMFS are presented in a separate Advance Data report,
The 19S6 NMFS was a l-percent stratified random sample of 1986 deaths of adults 25 years of age and over. It was the fifth of the periodic followback surveys on decedents conducted by the National Center for Health Statistics. The four earlier surveys, all conducted in the 1960’s, were less eomprehensive than the 19S6 survey (3-10).
The purpose of the mortality followback surveys is to collect information not typically available from death certificates, thus enabling analysts to explore in much greater detail the characteristics of decedents and circumstances of death. The 19S6 NMFS collected detailed information on a nationally representative sample of adult deaths, and provides an opportunity to examine many characteristics thought to be related to heart disease.
According to the Ninth Revision of the International Classification of Diseases, Diseases of heart include the following Rheumatic fever and rheumatic heart disease (ICD-9 Nos. 390–39S), Hypertensive heart disease (ICD-9 No. 402), Hypertensive heart and renal disease (ICD-9 No. 404),
Ischemic heart disease (ICD-9 Nos. 410414), Other diseases of endocardium (ICD–9 No. 424), and All other forms of heart disease (ICD–9 Nos. 415-423, 425429).
The 19S6 NMFS included 3,143 women who died of heart disease and 5,352 women who died from other causes. Weighted, these sample deaths represent 365,42S and 591,692 women decedents, respectively. The survey also included 3,522 men who died of heart disease and 6,716 men who died from other causes, representing 394,003 and 635,745 male decedents, respectively. Information on the weighting of the 1986 NMFS and the sampling variability is presented in the technical notes.
Ischemic heart disease accounts for over two-thirds of all deaths from Diseases of heart. For this reason, in this report this categoxy is shown separately in the tables and is also divided into the two major components of Ischemic heart diseasw “Acute myocardial infarction” and “Old myocardial infarction and other forms of chronic ischemic heart disease.” However, only the general category consisting of all forms of Diseases of heart is discussed in this t~xt.
U.S. DEPARTMENT OF HEALTH AND HUMAN SERVICES National Center for Health Statistics
Public Health Service Manning Feinleib, M. D., Dr. P,H., Director
Centers for Disease Control

2 AdvanceData
Only substantive responses to the questionnaire items were included in these tables; blank items, a reply of “don’t know” or “not applicable,” etc. were not included. Nor were items imputed for nonresponse. Thus, the total number of responses varies by questionnaire item and is reflected in the totals for the tables in this report. Not all of the tables include all the estimated 759,431 decedents who died from heart disease.
Sociodemographic and economic characteristics
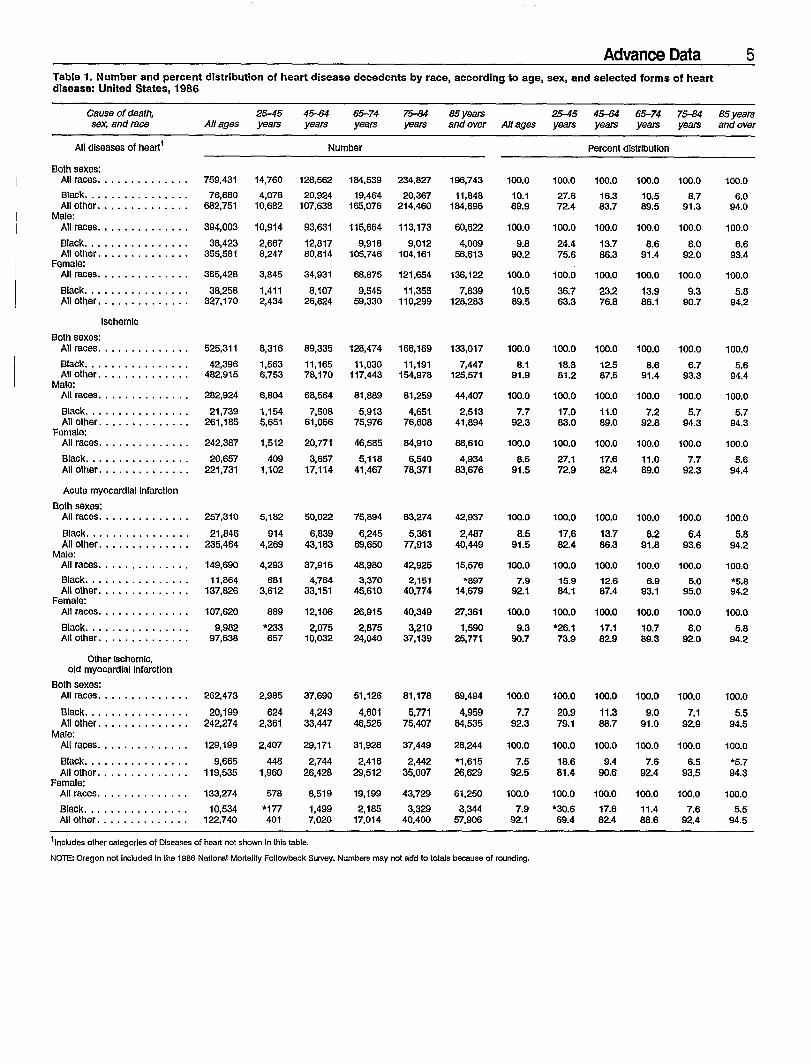
The largest number of heart disease deaths were to elderly persons. Only 14,760, or 2 percent, of heart disease deaths involved persons under 45 years of age, compared with 431,570 deaths (57 percent) to people 75 years of age and over (table 1). For males, the largest number of heart disease deaths were to men 65-74 years of age, with the number of deaths from this cause declining in the two oldest age groups. This pattern holds for males who were other than black, but not for males who were black. Among black males, the largest number of heart disease deaths occurred in the 45–64 years age group. “Persons other than black” in the 1986 NMFS included, in addition to persons reported as white, those reported as Asian Pacific Islander, Mexican, Puerto Rican, Cuban, all other Caucasians, and American Indian, Eskimo and Aleut. Among females of all races, the number of heart disease deaths increased with increasing age. This pattern also applied to females who were other than black, but the largest number of heart disease deaths among black females were to women 75–84 years of age.
An estimated 257,776 (70 percent) of the women who died from Diseases of heart were aged 75 and older. A larger number of males died from heart disease at earlier ages. AII estimated 10,914 (27 percent) of all males who died from heart disease were 25–64 years of age. Only 3,845 (11 percent) of women who died from this cause were 25–64 years of age.
Black persons accounted for 76,680 (10 percent) of the deaths from heart disease. There was little difference in the total number of heart disease deaths by sex.
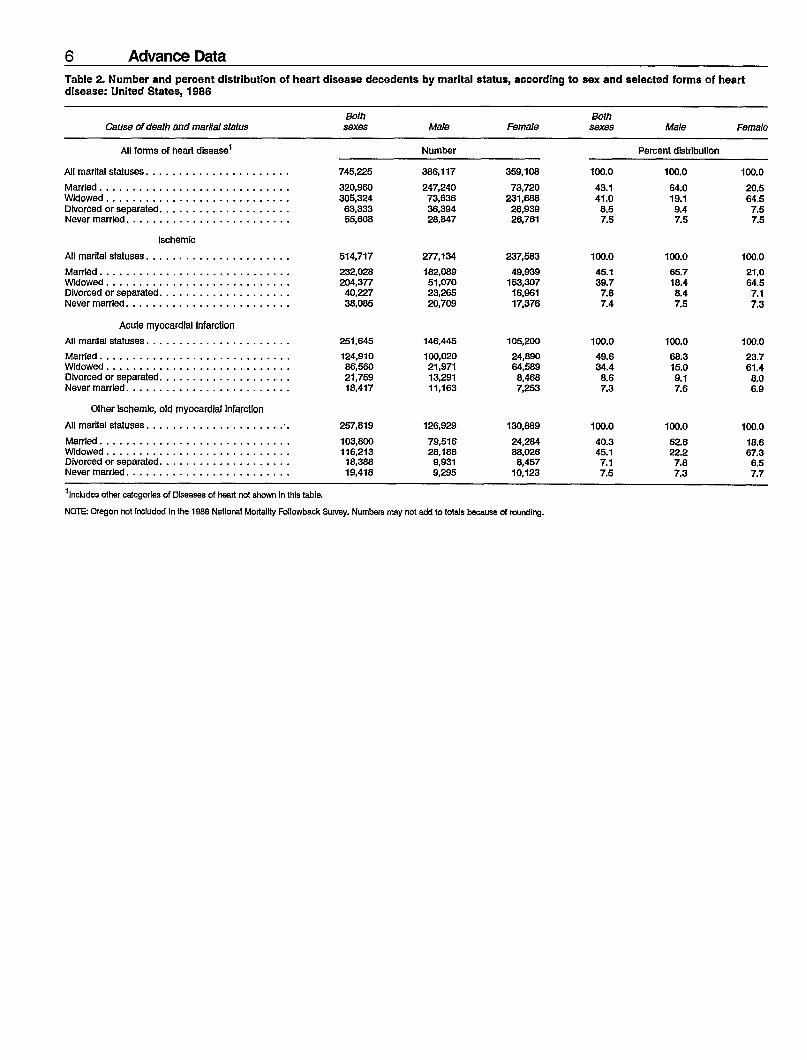
Only about 8 percent of the decedents who died from heart disease had never been married (table 2). Approximately equal proportions of decedents dying from heart disease were either married or widowed at the time of death. Among those who had been married at some time in their life there were large differences, by sex, in the marital status at the time of death. At the time of death, three times more men than women were married (64 percent of the men versus 21 percent of the women), and three times more women than men were widowed. These differences, by sex, in marital status at time of death, maybe due to a combination of factors, including the larger number of heart disease deaths involving younger men compared with women, the shorter life expectancy of men, and the tendency for men to marry younger women.
Over half of all decedents dying from heart disease had less than a high school eduation, more than a fourth had completed high school, and less than a fifth had completed some college (table 3). At educational levelsbelow completion of college, therewere only small differences in educational attainment between males andfemales for either age group.However, for all ages combined, twiceas many males (10 percent) as females(5 percent) had completed 4 years of college or more.
At the time of their death, 67,650, or about 17 percent, of the male decedents dying from heart disease were employed, as were 13,240, or only 4 percent of the female decedents, The 1986 NMPS also asked for the decedent’s longest held occupation. For males dying of heart disease, ‘%lue collar” occupations were the most frequently mentioned. One-fourth (25 percent) of the men had been opera-tors, fabricators, and laborers, and 23 percent had been in precision production, craft, and repair occupations (table 4). The work experience of
females who died of heart disease was somewhat different. One-third (33 percent) had been in technical or sales occupations, about one-fourth (24 percent) had held service occupations, and about one-fifth (21 percent) had been operators, fabricators, and laborers.
Almost one-third (32 percent) of the women who died of heart disease had lived alone or with unrelated persons in 1985, the year prior to their death. Twenty-two percent had lived in a nursing home, other health facility, or institution during this time. Half of the male decedents (51 percent) had lived with one relative (table 5). These living arrangements may reflect the differences in age and marital status of female versus male decedents of heart disease.
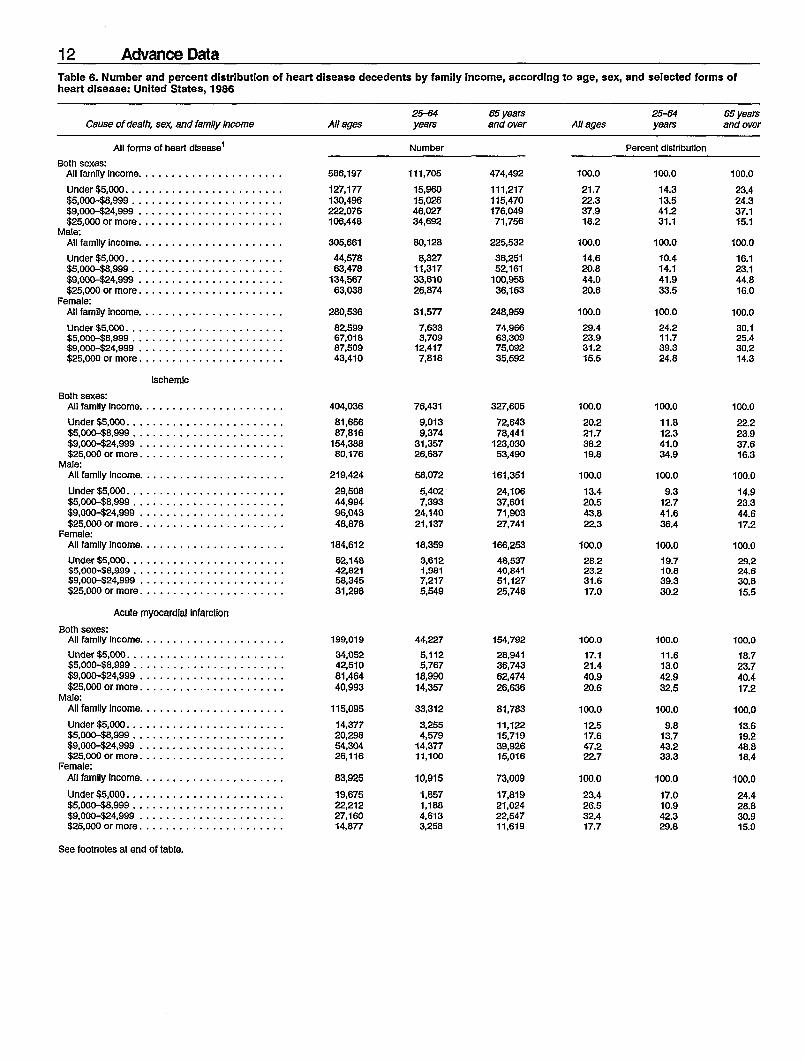
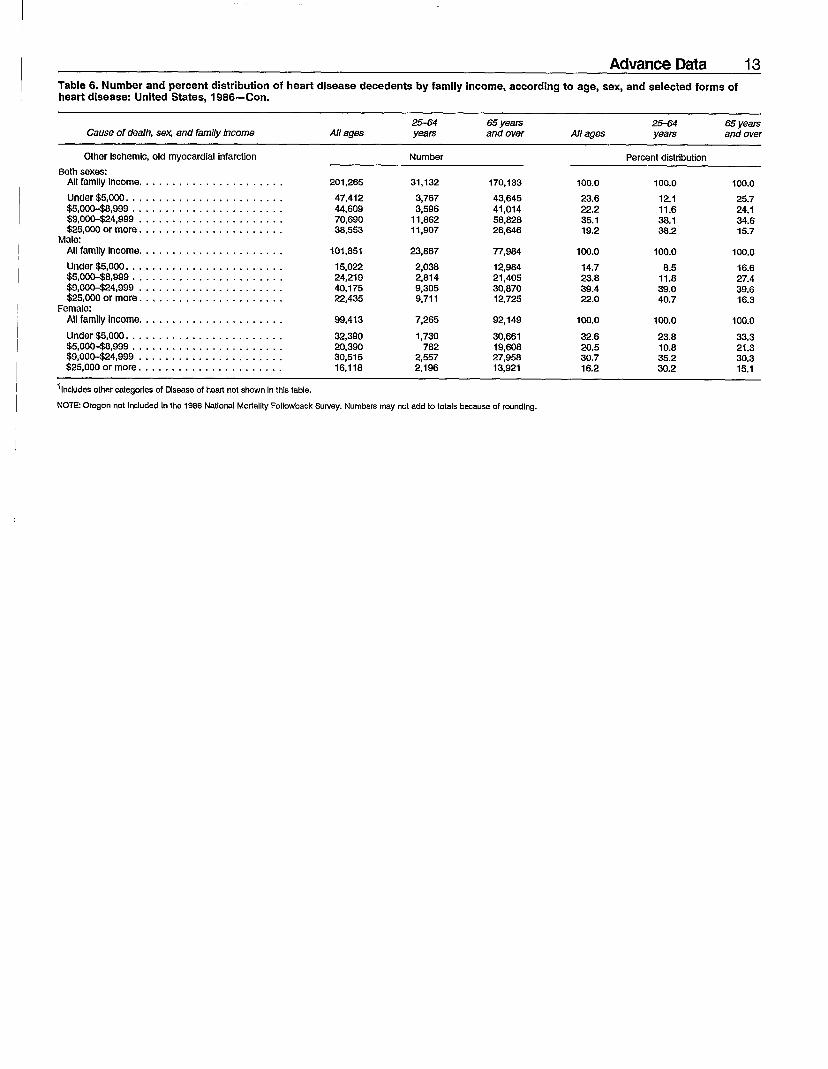
The decedent’s living arrangements had a direct bearing on his or her 1985 family income, since the reported family income reflects only the decedent’s own resources for the 54 percent of women and 27 percent of men who had lived with no relatives. Greater proportions of women who died of heart disease had low incomes compared with men who died of this cause (table 6). Over half (53 percent) of the women had a family income of less than $9,000 in 1985, as had about one-third (35 percent) of the men. At the high end of the income distribution, 16 percent of the women were reported to have had an income of $25,000 or more, compared with 21 percent of the men.
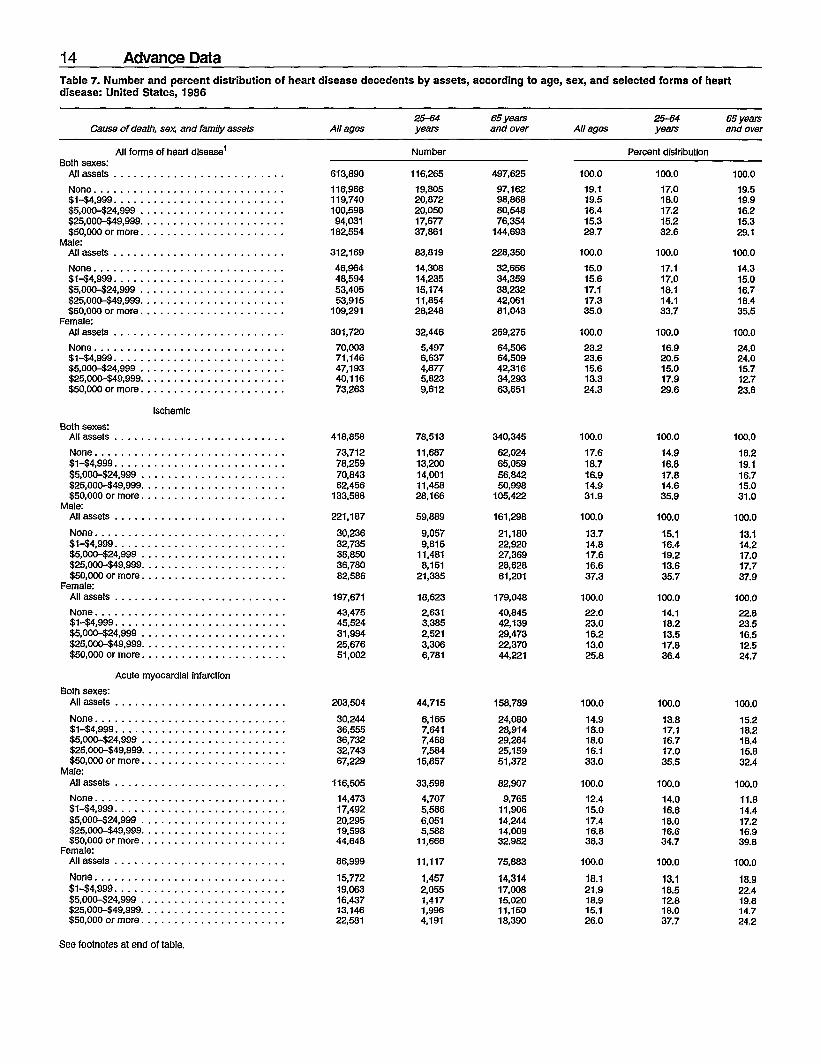
Another measure of the decedents’ financial status obtained in the 1986 NMPS concerned the total value of their assets at the time of death. This figure included their home, cash, stocks, bonds, cars, jewelry, and business interests. Almost half (47 percent) of the women who died of heart disease had assets of less than $5,000 at the time of their death (table 7). This is divided evenly between those with no assets and those with $14,999 in assets. Another one-fourth (24 percent) had assets of $50,000 or more. Fewer male decedents tended to have little or no assets at death; 15 percent had no assets and

Advance Data 3
16 percent had between $1 and $4,999. Over one-third (35 percent) of the male decedents had assets of $50,000 or more at death. In general,
male decedents tended to have more assets than female decedents.
Health care and costs
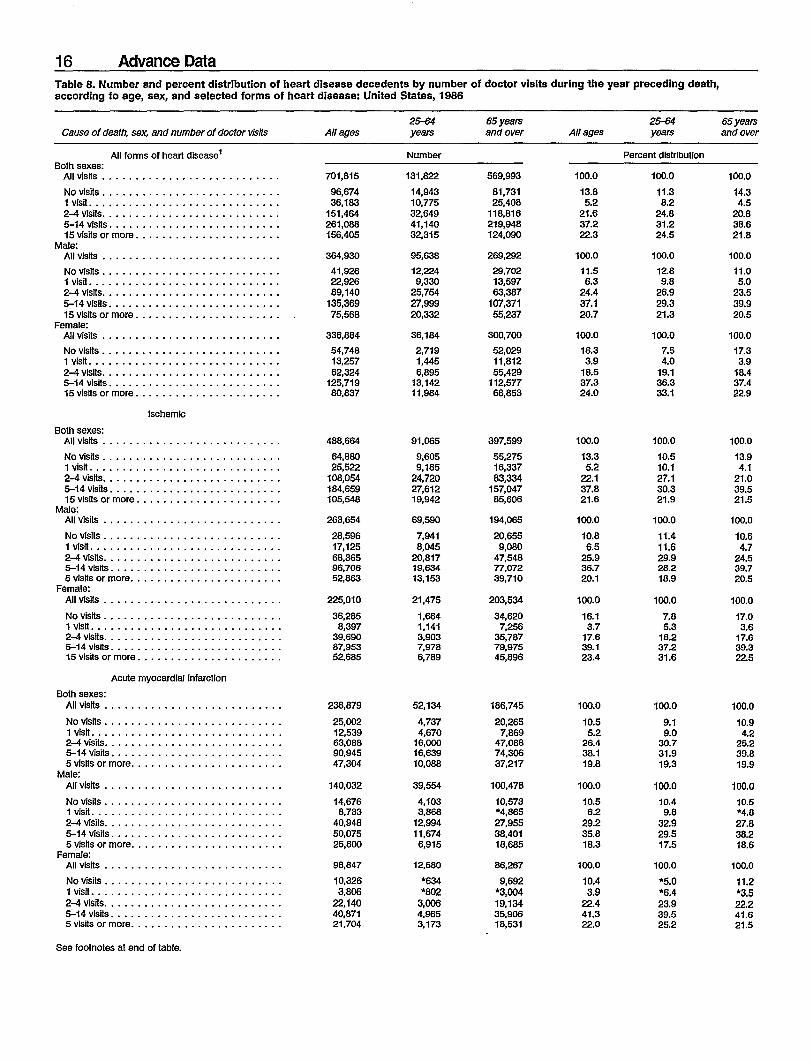
Several health care utilization measures and costs were obtained in the 19S6 NMFS. One of these involved the number of doctor visits the decedent had during the last year of life (table S). This did not include doctors seen while an overnight patient in a hospital or other health facility. Sixteen percent of the female decedents who died from heart disease were reported to have had no visits to a doctor in the last year of their life, as were 12 percent of the male decedents. Four percent of the women and 6 percent of the men had visited a doctor only once during the year. For both sexes and all age groups, 5-14 visits was the most frequently mentioned category, which accounted for 37 percent of the doctor visits.
Greater proportions of female decedents who died of heart disease were overnight patients in health facilities during the last year of life than male decedents (table 9). This includes those decedents who died while overnight patients. This is true for hospitals or nursing homes, other health facilities, and home hospice care. The last catego~, however, was used by only a small percent (4 percent) of heart disease decedents.
Medicare was the major health payment source for 53 percent of the female decedents and 49 percent of the males (table 10). For females, the category self or family and private insurance or Hh10’s were tied at 14 percent as second and third major payment sources, Twenty-three percent of the male decedents used private insurance or HMO’s, and only 12 percent used their own or famiIy funds. For both sexes, the least used source of payment was family members not living with the decedent.
Greater proportions of male than of female decedents spent less of their own money for medical care in the last
year of life (table 11). This included money spent by related persons living in the same household. Forty-two percent of the female decedents who died of heart disease spent less than $500, as did 46 percent of the male decedents. At the other extreme, 1S percent of the women spent $5,000 or more of their own money, compared with 11 percent of the males.
Health status
More female decedents than male were reported to have received help from others or used special equipment in walking, eating, bathing, dressing, or using the toilet (table 12). As would be expected, a larger number of decedents 65 years of age and over of both sexes received such assistance compared with the younger decedents. A slightly larger number of female than of male decedents were reported to have received help at home in taking medicines or pills or receiving injections; having bandages changed; or receiving nursing care. Again, the number of such recipients is larger for the older age categories.
Approximately 65 percent of decedents dying from heart disease received no help in daily activities, and about 62 percent received no assistance in medical care in the home (table 13). Among the decedents who received help, family members were the most frequent providers of care. Male decedents who died from Diseases of heart were less likely to have received assistance in daily activities than were female decedents (73 and 55 percent, respectively) and were also less likely to have received help in medical care (67 compared with 55 percent). Although family members were more likely to provide care than nonrelative for both male and female decedents, nonrelative were more likely to be the sole care providers for female decedents than for male decedents.
In addition to heart disease, many of these decedents had other serious health problems. These other diseases and conditions included high blood pressure, stroke, angina pectoris, diabetes, cancer, asthma, and other
lung conditions (table 14). Female decedents who died of heart disease were reported to have most of these diseases and conditions more often than were males. The exceptions were angina pectoris and other lung conditions.
Information on familial history of heart disease was also collected by means of the 1986 NMFS. An esti
mated 61 percent of the decedents dying from Diseases of heart had at least one family member who had experienced a heart attack (table 15). Approximately 3S percent of the decedents who died of heart disease had only one relative with a history of one or more heart attacks. Another 23 percent of the decedents had two or more relatives who had experienced a heart attack. There was little difference by sex in the proportion of decedents who had a familial history of heart attacks.
References
1. National Center for Health Statistics. Advance report, finaI mortality statistics, 1986. Monthly vital statistics repofi, vol 37 no 6, suppl. Hyattsville, Maxykmd: Public Health Service. 1983.
2. National Center for Health Statistics. Vital statistics of the United States, 1986, vol II, mortality, part A. Washington: Public Health Service. 1988.
3. National Center for Health Statistics. Hospitalization in the last year of life. Department of Health, Education, and Welfare. Vital Health Stat 22(l). 1965.
4. National Center for Health Statistics. Episodes and duration of hospitalization in the last year of life: United States, 1961. Department of Health, Education, and Welfare. Vital Health Stat 22(2). 1966.
5. National Center for Health Statistics. Socioeconomic characteristics of deceased persons: United States, 1962–63. Department of Health, Education, and Welfare. Vital Health Stat 22(9). 1969.
6.National Center for Health Statistics. Health insurance coverage of adults who died in 1964 or 1965: United States. Department of Health, Education, and Welfare. Vital Health Stat 22(10). 1969.

---
4 Advance Data
7. National Center for Health Statistics. 10. Expenses for hospital and institutional care during the last year of life for adults who died in 1964 or 1965: United States. Department of Health, Education, and Welfare. Vital Health 11. Stat 22(11). 1971.
8. Enstrom E, Godley FH. Cancer mortality among a representative sample of nonsmokem in the United States during 1966–68. J Natl Cancer Inst 65(5). 1980.
9. Kobrin FE, Hendemhot GE. Do family ties reduce mortality? Evidence from the United States, 1966-68. J Marriage Family. 1977.
. .
0.0
z
*
#
National Center for Health Statistics. Births, marriages, divorces, and deaths for January 1986. Monthly vital statistics report; vol 35 no 1. Hyattsville, Maryland: Public Health Semite. 1986. National Center for Health Statistics. Multiple causes of death in the United States. Monthly vital statistics reporq vol 32 no 10, suppl 2. Hyattsville, Maryland: Public Health Service. 1984.
Symbols
Data not available
. Category not applicable
Quantity zero
Quantity more than zero but less than 0,05
Quantity more than zero but less than 500 where numbers are rounded to thousands
Estimate based on fewer than 30 sample deaths and does not meet standards of reliability or precision
Figure suppressed to comply with confidentiality requirements
12. McCarthy PJ. Replication: an approach to the analysis of data from complex surveys. National Center for Health Statistics. Vital Health Stat 2(14). 1966.
13. McCarthy PJ: Pseudoreplication: further evaluation and application of the balanced half-sample technique. National Center for Health Statistics. Vital Health Stat 2(31). 1969.
AdvanceData 5 Table 1. Number and percent distribution of heart disease decedents by race, according to age, sex, and selected forms of heart disease: United States, 1986
Cause of death, 25-45 45-84 65-74 75-84 85 years 25-45 45-84 85-74 7=4 85 years sex, and race All ages yeats years years yeets and over All ages yS3rs years years years and over
All diseases of heart’ Number Percent distribution
Both sexes All races . . . . . . . . . . . . . . 759,431 14,760 128,562 164,539 234,827 188,743 100.0 100.0 100.0 100.0 100.0 100.0
Black . . . . . . . . . . . . . . . . 76,680 4,078 20,924 19,464 20,367 11,848 10.1 27.6 16.3 10.5 a.7 6.0 Another. . . . . . . . . . . . . . 682,751 10,682 107,636 185,076 214,460 164,896 89.9 72.4 83.7 89.5 91.3 94.0
Male Allraces . . . . . . . . . . . . . . 394,003 10,914 115,664 113,173 100.0 100.0 100.0 100.0 100.0 100.0
Black. . . . . . . . . . . . . . . . 38,423 2,667 12,817 9,918 9,012 4,009 9.8 24.4 13.7 8.6 8.0 6.6 Another. . . . . . . . . . . . . . 355,581 6,247 80,814 105,746 104,161 56,613 80.2 75.6 86.3 91.4 92.0 93.4
Female All races . . . . . . . . . . . . . . 365,42a 3,845 34,931 88,a75 121,654 136,122 100.0 100.0 100.0 100.0 100.0 100.0
Black . . . . . . . . . . . . . . . . 38,258 1,411 8,107 9,545 11,355 7,839 10.5 36.7 23.2 13.9 9.3 5.8 Another. . . . . . . . . . . . . . 327,170 2,434 26,824 58,330 110,299 128,283 88.5 63.3 76.6 86.1 90.7 94.2
Ischemlc
Both sexes All races . . . . . . . . . . . . . . 625,311 8,316 89,335 128,474 166,169 133,017 100.0 100.0 100.0 100.0 100.0 100.0
Black . . . . . . . . . . . . . . . . 42,396 1,563 11,165 11,030 11,191 7,447 8.1 18.8 12.5 8.6 6.7 5.6 Another . . . . . . . . . . . . . . 482,915 6,753 78,170 117,443 154,976 125,571 el.9 al.2 87.5 91.4 93.3 94.4
Male: Allraces . . . . . . . . . . . . . . 282,924 6,eo4 66,564 81,669 81,259 44,407 100.0 100.0 100.0 100.0 100.0 100.0
Black . . . . . . . . . . . . . . . . 21,739 1,154 7,508 5,913 4,651 2,513 7.7 17.0 11.0 7.2 5.7 5.7 Another. . . . . . . . . . . . . . 261,185 5,651 61,056 75,976 76,608 41,894 92.3 83.0 89.0 92.8 94.3 94.3
Female All races. . . . . . . . . . . . . . 242,387 1,512 20,771 48,565 84,910 88,610 100.0 100.0 100.0 100.0 100.0 100.0
Black, . . . . . . . . . . . . . . . 20,657 409 3,657 5,116 6,540 4,e34 6.5 27.1 17.6 11.0 7.7 5.6 Another. . . . . . . . . . . . . . 221,731 1,102 17,114 41,467 78,371 83,676 91.5 72.9 62.4 89.0 92.3 94.4
Acute myocardial Infarction
Bothsexex All races . . . . . . . . . . . . . . 257,310 5,182 50,022 75,694 83,274 42,937 100.0 100.0 100.0 100.0 100.0 100.0
Black . . . . . . . . . . . . . . . . 21,646 914 6,839 6,245 5,361 2,487 6.5 17.6 13.7 6.2 6.4 5.8 Allolher . . . . . . . . . . . . . . 235,464 4,269 43,183 69,650 77,913 40,449 91.5 82.4 66.3 ,91.8 93.6 94.2
Male: All races. . . . . . . . . . . . . . 149,690 4,293 37,916 46,960 42,925 15,576 100.0 100.0 11X3.O 100.0 100.0 100.0
Black . . . . . . . . . . . . . . . . 11,664 661 4,764 3,370 2,151 *a97 i 5.9 12.6 6.9 *5.8 Another. . . . . . . . . . . . . . 137,826 3,612 33,151 45,610 40,774 14,679 9Z 84.1 87.4 93.1 9% 94.2
Female: Allraces. . . . . . . . . . . . . . 107,820 889 12,108 26,915 40,349 27,361 100.0 100.0 100.0 100.0 100.0 100.0
Black, . . . . . . . . . . . . . . . 9,982 *233 2,075 2,675 3,210 1,580 9.3 *26.1 17.1 10.7 8.0 5.8 Another., . . . . . . . . . . . . 97,638 657 10,032 24,040 37,139 %,771 80.7 73.9 82.9 89.3 92.0 94.2
Olher Ischemlc, old myocardial infarction
Both sexes: All races . . . . . . . . . . . . . . 262,473 2,965 37,690 51,126 81,17e 68,494 100.0 100.0 100.0 100.0 100.0 100.0
Black . . . . . . . . . . . . . . . . 20,199 624 4,243 4,601 5,771 4,959 7.7 20.9 11.3 9.0 7.1 5.5 All olher, . . . . . . . . . . . . . 242,274 2,361 33,447 46,525 75,407 84,535 92.3 79.1 86.7 91.0 92.9 94.5
Male: All races. . . . . . . . . . . . . . 129,199 2,407 29,171 31,926 37,449 26,244 100.0 100.0 100.0 100.0 100.0 100.0
Black. .,, . . . . . . . . . . . . 9,665 448 2,744 2,416 2,442 *1,615 18.6 7.6 *5.7 Another., . . . . . . . . . . . . 119,535 1,960 26,428 29,512 35,007 26,629 9E 81.4 8% 92.4 9E 94.3
Female: Allraces . . . . . . . . . . . . . . 133,274 57e 8,519 19,199 43,729 61,250 100.0 100.0 100.0 100.0 100.0 100.0
Black. . . . . . . . . . . . . . . . 10,534 *177 1,499 2,185 3,329 3,344 7.9 *30.6 17.6 11.4 7.6 5.5 Another . . . . . . . . . . . . . . 122,740 401 7,020 17,014 40,400 57,906 92.1 69.4 82.4 68.6 92.4 94.5
1,nclud~~~th~~ ~~egoriesof Diseases of heart not shown in this table.
NOTE Oregon not kduded In the 1986 National Morlallty Followback Survey. Numbers may not add to Iotals bscsuse of rcundlng.
6 Advance Data
Table 2. Number and percent distribution of heart diseaae decedents by marital status, according to sex and selected forms of heart disease: United Statea, 1986
Both Both Cause cfdeath and marital status sexes Male Femate sexes Male Female
All forms of heart disease’ Number Percent distribution
All marital statuses . . . . . . . . . . . . . . . . . . . . . . 745,225 386,117 359,108 100.0 100.0 100.0
Married . . . . . . . . . . . . . . . . . . . . . . . . . . . . . 320,980 247,240 73,720 43.1 84.0 20.5 Widowed . . . . . . . . . . . . . . . . . . . . . . . . . . . . 305,324 73,636 231 ,68S 41.0 19.1 64.5 Divorcedorseparated . . . . . . . . . . . . . . . . . . . . 63,333 38,394 26,939 8.5 9.4 7.5 Nevermarrbd . . . . . . . . . . . . . . . . . . . . . . . . . 55,608 28,647 26,761 7.5 7.5 7.5
Ischemlc
Allmaritalstatuses . . . . . . . . . . . . . . . . . . . . . . 514,717 277,134 237,683 100.0 100.0 100.0
Married . . . . . . . . . . . . . . . . . . . . . . . . . . . . . 232,026 182,089 49,939 45.1 65.7 Widowed . . . . . . . . . . . . . . . . . . . . . . . . . . . . 204,377 51,070 153,307 3s.7 18.4 Dhforcedorseparated . . . . . . . . . . . . . . . . . . . . 40,227 23,265 16,881 7.8 8.4 Nevermarriad . . . . . . . . . . . . . . . . . . . . . . . . . 38,085 20,709 17,376 7.4 7.5
Acute myocardlal infarction
Alimaritalslatuses . . . . . . . . . . . . . . . . . . . . . . 251,645 146,445 105,200 100.0 100.0
Married . . . . . . . . . . . . . . . . . . . . . . . . . . . . . 124,910 100,020 24,890 49.6 68.3 Widowed . . . . . . . . . . . . . . . . . . . . . . . . . . . . 86,560 21,971 64,589 34.4 15.0 Dtvorcedorseparated . . . . . . . . . . . . . . . . . . . . 21,759 13,281 8,488 8.6 9.1 Nevermarried . . . . . . . . . . . . . . . . . . . . . . . . . 16,417 11,163 7,253 7.3 7.6
Other Ischemlc, old myocardial Infarction
Allmaritalstatuses . . . . . . . . . . . . . . . . . . . . . . 257,619 126,929 130,889 100.0 100.0
Married . . . . . . . . . . . . . . . . . . . . . . . . . . . . . 103,800 79,516 24,284 40.3 62.6
9,931 8,457 7.1 7.8 Widowed . . . . . . . . . . . . . . . . . . . . . . . . . . . . 116,213 2a,186 88,026 45.1 22.2 Divorcedorseparated . . . . . . . . . . . . . . . . . . . . 18,388 Nevermarrted . . . . . . . . . . . . . . . . . . . . . . . . . 19,418 9,295 10,123 7.5 7.3 ::
llnc~de~ OIbr categories of Dlseeses of Iwart not SIWV?I h this table.
NOTE OregonrmtIncludedIn the 1986 NationalMortalityFollcwbackSurvey.Numbersmay notadd to totalsbe.xuse of rourxiing.
21.0 64.5
7.1 7.3
100.0 23.7 61.4
8.0 6.9
100.0
18.6 67.3

Advance Data 7 Table 3. Number and percent distribution of heart diseaae decedents by level of education, according to age, sex, and selected forma of heart disease: United Statea, 1986
25-64 65 years 25-64 65 years Cause ofdmth, sex, and level of aducetkvr All ages w and over All ages yeare and over
All forms of heart disease’ Percent distribution
Both sexex Alllevels ofeciucation . . . . . . . . . . . . . . . . . . 699,778 134,839 564,939 100.0 100.0 100.0 Lessthan highsctrool, . . . . . . . . . . . . . . . . . 386,295 59,427 326,888 55.2 44.1 57.9 Hlghschool . . . . . . . . . . . . . . . . . . . . . . . . . 190,518 47,357 143,161 27.2 35.1 25.3 R3yearso fcollege . . . . . . . . . . . . . . . . . . . . 68,667 14,486 54,181 9.8 10.7 9.6 4yeareofcollege ormore . .. . . . . . . . . . . . . . 54,2e8 13,589 40,72e 7.8 10.1 7.2
Male Alllevels ofeducatlon . . . . . . . . . . . . . . . . . . 98,649 268,251 100.0 100.0 100.0 Lesslhan hlghschool . . . . . . . . . . . . . . . . . . 19e,443 44,a43 153,601 54.1 45.5 57.3 Highschool . . . . . . . . . . . . . . . . . . . . . . . . . 95,248 31,497 63,751 26.0 31.9 23.8 l-3yeare of college . . . . . . . . . . . . . . . . . . . . 35,783 10,712 25,071 10.9 9.3 4yearsofcollege ormore, . . . . . . . . . . . . . . . 37,427 11,598 26,829 lr2 11.8 9.6
Female Alllevels ofeducatlon . . . . . . . . . . . . . . . . . . 332,878 36,190 298,668 100.0 100.0 100.0
Lessthian hlghschool . . . . . . . . . . . . . . . . . . 187,852 14,585 173,268 56.4 40.3 5a.4 Hlghschool . . . . . . . . . . . . . . . . . . . . . . . . . 95,270 15,861 79,410 28.6 43.8 26.8 l-3years of college. . . . . . . . . . . . . . . . . . . . 32,684 3,774 29,110 9.9 10.4 9.8 4yearsofcollege ormore . . . . . . . . . . . . . . . . 16,872 1,971 14,s03 5.1 5.4 5.0
Ischemlc
Both sexes: Allleveis ofeducatlon . . . . . . . . . . . . . . . . . . 91,705 391,991 100.0 100.0 100.0
Lessthan hlghschool . . . . . . . . . . . . . . . . . . 262,094 3s,303 223,791 54.2 41.8 57.1 Hlghschool . . . . . . . . . . . . . . . . . . . . . . . . . 137,061 33,050 104,011 28.3 36.0 26.5 l-3years of college . . . . . . . . . . . . . . . . . . . . 46,172 e,989 36,163 9.5 10.9 9.2 4yearsofcollege ormore . . . . . . . . . . . . . . . . 38,388 10,383 28,008 7.9 11.3 7.1
Ma18: Alllevels ofeducatlon . . . . . . . . . . . . . . . . . . 264,260 70,776 193,502 100.0 100.0 100.0 Lessthan hlghschool . . . . . . . . . . . . . . . . . . 138,717 30,304 106,413 52.5 42.8 56.0 Hlghschool . . . . . . . . . . . . . . . . . . . . . . . . . 71,384 24,053 47,331 27.0 34.0 24.5 W3yearso fcollege . . . . . . . . . . . . . . . . . . . . 25,904 7,406 18,497 9.8 10.5 9.6 4yearsofcollege ormore. o........ . . . . . . 26,275 9,014 19,261 10.7 12.7 10.0
Female: Alllevels of education . . . . . . . . . . . . . . . . . . 219,416 20,927 198,489 ICQ.O 100.0 100.0
Lessthan hlghschool . . . . . . . . . . . . . . . . . . 123,377 7,e99 I 15,37a 56.2 3s.2 56.1 Hlghschool, . . . . . . . . . . . . . . . . . . . . . . . . 65,677 6,997 68,680 29.9 43.0 28.6 W3yearso fcollege . . . . . . . . . . . . . . . . . . . . 20,268 2,5s2 17,6a6 12.3 4yeafsofcollege ormore . . . . . . . . . . . . . . . . 10,094 ‘1,346 6,745 % *6.4 E
Acute myocardisl Infarction
Both sexes Alllevels ofeducaUon . . . . . . . . . . . . . . . . . . 238,458 52,201 186,255 100.0 100.0 100.0
Lessthan hlghschool . . . . . . . . . . . . . . . . . . 127,557 22,565 104,992 53.5 43.2 56.4 Hlahschool . . . . . . . . . . . . . . . . . . . . . . . . . 68,602 16,269 50,533 28.9 35.0 27.1 l~years of college . . . . . . . . . . . . . . . . . . . . 23,684 6,048 17,638 9.9 11.6 9.5 4yearsofcollege ormore . . . . . . . . . . . . . . . . 18,413 5,319 13,094 7.7 10.2 7.0
Male: Alllevelsof education . . . . . . . . . . . . . . . . . . 140,499 40,041 1W,459 100.0 100.0 100.0
Lessthan hlghschool . . . . . . . . . . . . . . . . . . 72,525 18,142 54,382 51.6 45.3 54.1 High $chool . . . . . . . . . . . . . . . . . . . . . . . . . 40,063 13,515 26,546 28.5 33.8 26.4 W3yearso fcollege . . . . . . . . . . . . . . . . . . . . 14,000 4,027 e,973 10.0 10.1 4yearsofcollege ormore . . . . . . . . . . . . . . . . 13,912 4,356 9,555 9.9 10.9 U
Female: Alllevels ofeduca!ion . . . . . . . . . . . . . . . . . . 97,956 12,160 85,796 100.0 100.0 100.0
Lessthan hlghschool . . . . . . . . . . . . . . . . . . 55,032 4,422 50,610 58.2 36.4 59.0 High school . . . . . . . . . . . . . . . . . . . . . . . . . 28,739 4,754 23,e85 29.3 3e.1 2a.o l-3years of college . . . . . . . . . . . . . . . . . . . . 9,684 2,021 7,663 9.9 16.6 8.9 4yearsofcollage ormore . . . . . . . . . . . . . . . . 4,502 3,539 4.6 *7.e 4.1
See footnotes at end of table.

8 Advance Data Table 3. Number and percent distribution of heart disease decedents by level of education, according to age, sex, and selected forms of heart disease: United States, 1986-Con.
25-64 65 years 25-64 65 yeats Cause of death, sex, and level of educdon All ages years and over All agas yeats and over
Ofher Iechemlo, old myocardial infarction Percent d!siribukm
Both sexes Alllevels of education . . . . . . . . . . . . . . . . . . 240,343 37,960 202,393 100.0 100.0
Lessthan hlghschool . . . . . . . . . . . . . . . . . . 132,344 14,952 117,392 55.1 39.4 68.0 Highschool . . . . . . . . . . . . . . . . . . . . . . . . . 65,826 14,070 51,758 27.4 37.1 25.6 W3yearsofc ollege . . . . . . . . . . . . . . . . . . . . 22,252 3,918 18,334 9.3 10.3 9.1 4yearsofcollege ormore . . . . . . . . . . . . . . . . 19,921 5,010 14,911 8.3 13.2 7.4
Male Alllevels of education . . . . . . . . . . . . . . . . . . 120,377 29,374 91,003 100.0 100.0 100.0
Lessthan high school . . . . . . . . . . . . . . . . . . 84,612 11 ,s07 53,304 53.6 39.2 58.6 Hlghschool . . . . . . . . . . . . . . . . . . . . . . . . . 29,558 9,875 19,683 24.6 33.6 21.6 l-3years of college . . . . . . . . . . . . . . . . . . . . 11,667 3,357 6,311 9.7 11.4 4yeareofcollege ormore . . . . . . . . . . . . . . . . 14,340 4,635 9,705 11.9 15.8 1:;
Female Alllevels ofeducatlon . . . . . . . . . . . . . . . . . . 119,966 8,576 111,390 100.0 100.0 100.0 Lessthan hlghsohool . . . . . . . . . . . . . . . . . . 67,533 3,445 64,088 56.3 40.2 57.5 High school . . . . . . . . . . . . . . . . . . . . . . . . . 38,286 4,196 32,073 30.2 46.9 28.8 l-3years of college . . . . . . . . . . . . . . . . . . . . 10,584 581 10,023 8.8 6.5 9.0 4yearsof college ormore . . . . . . . . . . . . . . . . 5,561 *375 5,208 4.7 *4.4 4.7
1lm~d~~ ot~r ~~egoriesof Dlseaeesof heartnotShOWIIInthistable.
NOTE Oregonnot includedIn the 198e NatlorwiMortalityFollowbackSurvey.Numbersmay rat add to totalsbeause of rounding.

Advance Data 9 Table 4. Number and percent distribution of heart disease decedents by occupation, according to sex and selected forms of heart disease: United States, 1986
Bo:h Both Cause of death and occupailon sexes Male Female sexes Male Female
All forms of heart disease’ Percent distribution
Alloccupatlons . . . . . . . . . . . . . . . . . . . . . . . . 631,002 366,600 264,403 100.0 100.0 100.0
Managerial or professional. ., . . . . . . . . . . . . , . 96,371 61,376 38,995 15.6 16.7 14.0 Technical orsalas . . . . . . . . . . . . . . . . . . . . . . 144,755 57,896 86,859 229 15.8 32.9 Services . . . . . . . . . . . . . . . . . . . . . . . . . . . . 86,652 22,286 64,566 13.a 24.4 Preclson producOon . . . . . . . . . . . . . . . . . . . . . 92,512 82,340 10,171 14.7 2X 3.8 Operator . . . . . . . . . . . . . . . . . . . . . . . . . . . . 148,492 92,413 56,079 23.5 25.2 21.2 Farm . . . . . . . . . . . . . . . . . . . . . . . . . . . . . . 51,631 42,175 9,456 8.2 11.5 3.6 Armedforces . . . . . . . . . . . . . . . . . . . . . . . . . 6,380 8,113 +277 1.3 2.2 �o. 1
Ischemlc
Alloccupatlons . . . . . . . . . . . . . . . . . . . . . . . . 440,033 265,577 174,456 100.0 100.0 100.0
Managerial orprofesslonal. . . . . . . . . . . . . . . . . 70,127 46,932 23,195 15.9 17.7 13.3 Technlcalorsales, . . . . . . . . . . . . . . . . . . . . . 102,536 42,164 60,372 23.3 15.9 34.6 Services . . . . . . . . . . . . . . . . . . . . . . . . . . . . 54,742 15,574 39,169 12.4 22.5 Preclsonproductlon . . . . . . . . . . . . . . . . . . . . . 67,610 60,753 6,857 15.4 2% 3.9 Operator, . . . . . . . . . . . . . . . . . . . . . . . . . . . 104,404 67,089 37,315 23.7 25.3 21.4 Farm . . . . . . . . . . . . . . . . . . . . . . . . . . . . . . 35,022 27,692 7,330 8.0 10.4 4.2 Armedforces, . . . . . . . . . . . . . . . . . . . . . . . . 5,592 5,373 �2I 9 1.3 2.0 �0.1
Acute myocardial infarction
Alloccupatlons . . . . . . . . . . . . . . . . . . . . . . . . 222,164 140,330 81,834 100.0 100.0 i 00.0
Managerial orprofesslonal. . . . . . . . . . . . . . . . . 35,274 25,366 9,907 15.9 16.1 12.1 Technlcalorsales . . . . . . . . . . . . . . . . . . . . . . 49.750 21,679 27,671 22.4 15.6 34.1 Sarvlces . . . . . . . . . . . . . . . . . . . . . . . . . . . . 7,006 16,623 10.6 20.3 Preclson production . . . . . . . . . . . . . . . . . . . . . 33;230 30,851 *2,379 16.0 2:: *2.9 Operator . . . . . . . . . . . . . . . . . . . . . . . . . . . . 59,644 38,171 21,474 26.8 27.2 26.2 Farm . . . . . . . . . . . . . . . . . . . . . . . . . . . . . . 17,919 14,546 3,373 8.1 10.4 4.1 Armedforces . . . . . . . . . . . . . . . . . . . . . . . . . *2,716 *2,51 1 �1.2 ‘1.8 *0.3
Othar Ischemlc, old myocardial Infarcilon
Alloccupatlons . . . . . . . . . . . . . . . . . . . . . . . . 213,338 121,758 91,578 Iwo 100.0 100.0
Managerlalorprofesslonal. . . . . . . . . . . . . . . . . 34,180 21,122 13,068 16.0 17.3 14.3 Technlcalorsales . . . . . . . . . . . . . . . . . . . . . . 51,864 19,796 31,867 24.2 16.3 34.8 Services . . . . . . . . . . . . . . . . . . . . . . . . . . . . 30,765 8,314 22,452 14.4 6.8 24.5 Preclson production . . . . . . . . . . . . . . . . . . . . . 33,719 29,242 4,477 15.8 24.0 4.9 Operator . . . . . . . . . . . . . . . . . . . . . . . . . . . . 28,109 15,755 20.6 23.1 17.2 Farm . . . . . . . . . . . . . . . . . . . . . . . . . . . . . . 16.477 12,530 �3,946 7.7 10.3 �4.3 Armedforces . . . . . . . . . . . . . . . . . . . . . . . . . *2,645 *13 *1.2 *2.2 �0.O
ll~~de~~thsrcp,tegories ofolseaaesofhaart notshwnln~hktable.
I NOTE Oregon not Includsd In tlw 1986 National Morlslity Followback SuNsy. Numbers may not add to totals be-causeof rounding.

10 Advance Data Table 5. Number and percent distribution of heart disease decedents by living arrangement, according to age, sex, and selected forms of heart disease: United States, 1986
25-64 85ysars 25-M 65 years Cause of death, sex, and Iivlrrgarrangement All ages years and over All ages years and over
All forms of heart disease’ Number Percent distribution
Bo!h sexex Alllivl ngarrangemen a s . . . . . . . . . . . . . . . . 727,488 137,750 689,736 IOQ.O 100.0 100.0 lnstllulionalized . . . . . . . . . . . . . . . . . . . . . . . 103,987 2,438 101,549 14.3 1.8 17.2 Lived alone . . . . . . . . . . . . . . . . . . . . . . . . . 184,845 26,126 156,718 25.4 19.0 26.9 Llvedwith l relative . . . . . . . . . . . . . . . . . . . . 283,82e 55,298 228,530 39.0 40.1 38.8 Uvedwith 20rmore relatives . . . . . . . . . . . . . . 154,829 53,868 100,942 21.3 39.1 17.1
Male: Allltving arrangements . . . . . . . . . . . . . . . . . . 379,413 100,339 279,074 100.0 100.0 100.0
Institullonalized . . . . . . . . . . . . . . . . . . . . . . . 28,623 �1,298 27,325 *I .3 Lived alone . . . . . . . . . . . . . . . . . . . . . . . . . 73,664 19,147 !54,737 Iu 19.1 1~6 Lived wifhlrelalive . . . . . . . . . . . . . . . . . . . . 192,486 41,251 151,246 50.7 41.1 54,2 Lived wifh20rmore relatives . . . . . . . . . . . . . . 84,408 36,643 45,765 22.2 36.5 16.4
Female Alllivlng arrangemerk . . . . . . . . . . . . . . . . . . 34e,075 37,411 310,664 100.0 100.0 100.0
Institutionalized . . . . . . . . . . . . . . . . . . . . . . . 75,364 *1,140 74,224 21.7 *3.O 23.9 Lived alone . . . . . . . . . . . . . . . . . . . . . . . . . 110,960 6,979 103,981 31.9 18.7 33.5 Lived wlthlrelalive . . . . . . . . . . . . . . . . . . . . 91,330 14,047 77,282 26.2 37.5 24.9 Lived with 20rmore relatives . . . . . . . . . . . . . . 70,421 15,244 55,177 20.2 40.7 17.8
Iscnemlc
Both sexes Alilivl ngarrangemen t o . . . . . . . . . . . . . . . . 502,000 93,949 408,051 100.0 100.0 100.0
Institutionalized . . . . . . . . . . . . . . . . . . . . . . . 67,357 1,214 66,143 13.4 1.3 16.2 Lived alone . . . . . . . . . . . . . . . . . . . . . . . . . 123,255 17,350 105,895 24.6 18.5 26.0 Lived wtthlrelafFFe . . . . . . . . . . . . . . . . . . . . 206,217 39,827 166,391 41.1 42.4 40.8 Lived with20rmore relatives. . . . . . . . . . . . . . 105,170 35,548 68,622 21.0 37.8 17.1
Male Allliving arrangements . . . . . . . . . . . . . . . . . . 272,244 72,344 199,901 100.0 100.0 100.0
Institutionalized . . . . . . . . . . . . . . . . . . . . . . . 76,869 *976 17,893 6.9 *1.3 9.0 LMedalone . . . . . . . . . . . . . . . . . . . . . . . . . 50,219 13,680 36,539 18.4 18.9 16.3 Lwedwith l relative . . . . . . . . . . . . . . . . . . . . 143,043 30,224 112,819 52.5 41.8 56.4 Livedwith20rmorerelatives.... . . . . . . . . . . 60,114 27,464 32,650 221 36.0 16.3
Female Alllivingarrangements . . . . . . . . . . . . . . . . . . 229,755 21,608 2c!a,160 100.0 100.0 100.0
Institutionalized . . . . . . . . . . . . . . . . . . . . . . . 4S,489 *238 48,251 21.1 *1.1 23.2 Livedalone . . . . . . . . . . . . . . . . . . . . . . . . . 73,035 3,680 69,356 31.6 17.0 33.3 LNedwith l relative . . . . . . . . . . . . . . . . . . . . 63,175 9,503 53,572 27.5 44.4 25.7 Llvedwlth20rmorerelatlves.... . . . . . . . . . . 45,066 8,084 36,972 19.6 37.4 17.6
Acute myocardial Infarction
Both sexes All llvingarrangemenk+ . . . . . . . . . . . . . . . . . . 248,726 53,638 195,088 100.0 100.0 100.0
institutionalized . . . . . . . . . . . . . . . . . . . . . . . 21,443 *177 21,266 8.6 *0.3 10.9 Llvedalone . . . . . . . . . . . . . . . . . . . . . . . . . 61,718 9,665 52,053 24.8 18.0 26.7 Livedwith l relative . . . . . . . . . . . . . . . . . . . . 110,642 21,585 89,057 44.5 40.2 45.6 Llvedwith 20rmorerelatives. . . . . . . . . . . . . . 54,923 22,211 32,712 22.1 47.4 16.8
Male All livingarrangements . . . . . . . . . . . . . . . . . . 144,489 40,810 103,679 100.0 100.0 10CLO
Insfttutlonalized . . . . . . . . . . . . . . . . . . . . . . . 5,454 *94 5,360 3,8 �0,2 5.2 Livedalone . . . . . . . . . . . . . . . . . . . . . . . . . 25,686 8,091 17,795 17.9 19.e 17.2 Livedwith lrelaWe . . . . . . . . . . . . . . . . . . . . 7S,325 16,671 62,654 54.2 38.4 60.4 Livedwifh20rmorerela!ives. . . . . . . . . . . . . . 34,824 16,954 17,869 24.1 41.5 17.2
Female: AlllMngarrangements . . . . . . . . . . . . . . . . . . 104,237 12,826 91,409 100.0 100.0 100.0 Institutionalized . . . . . . . . . . . . . . . . . . . . . . . 15,989 15,906 15.3 �0.6 17.4 Livedalone . . . . . . . . . . . . . . . . . . . . . . . . . 35,632 1,% 34,256 34.4 12.3 37.5 Livedwit hlrelative . . . . . . . . . . . . . . . . . . . 32,317 5,915 26,402 31.0 46.1 26.9 Livedwith20rmorerelatives.... . . . . . . . . . . 20,099 14,843 19.3 41.0 16.2
See footnotes at end of table.

Advance Data 11 Table 5. Number and percent distribution of heart disease decedents by iiving arrangement according to age, sex, and selected forms of heart diseaae: United States, 1986-Con.
25-6# 65 years 25-# 65 years (M.&e of death, sex and Ilving arrangement All ages years and over All ages years and over
Other Ischemlc, old myocardial [nfarction Number Percent distribution
Bothsexes:, , .,, . . . . . . . . . . . . . . . . . . . . . Allllvlng arrangements . . . . . . . . . . . . . . . . . . 247,963 38,757 209,207 100.0 1CS3.O 100.0
Inslilullonalized . . . . . . . . . . . . . . . . . . . . . . . 45,650 *1 ,037 44,613 18.4 �2.7 21.3 Livedalone . . . . . . . . . . . . . . . . . . . . . . . . . 5e,944 6,965 52,e59 24.2 18.0 25.3 Ltvedwith l relative . . . . . . . . . . . . . . . . . . . . 93,066 17,726 75,340 37.5 45.7 36.0 Llvedwlth20rmorerelaUves . . . . . . . . . . . . . . 49,303 i3,00e 36,295 19.9 33.6 17.3
Male Alillvlngarrangements . . . . . . . . . . . . . . . . . . 123,936 30,16e e3,76e 100.0 lCO.O 100.0
Instltutlonallzed . . . . . . . . . . . . . . . . . . . . . . . 13,208 *662 12,326 10.7 *2.9 13.1 Livedalone . . . . . . . . . . . . . . . . . . . . . . . . . 23,367 4,902 16,485 16.9 16.2 19.7 Livedwtlh lrelatlve . . . . . . . . . . . . . . . . . . . . 62,e79 14,068 48,793 50.7 46.7 52.0 LNedwtth 20rmorerelatlves. . . . . . . . . . . . . . 24,464 10,299 14,165 19.7 34.1 15.1
Female: Alllivlngarrangements . . . . . . . . . . . . . . . . . . . 124,026 8,566 115,436 100.0 100.0 100.0
Instllutionalized . . . . . . . . . . . . . . . . . . . . . . . 32,442 *155 32,287 26.2 *1.6 28.0 Livedalone . . . . . . . . . . . . . . . . . . . . . . . . . 36,557 2,083 34,474 29.5 24.3 29.9 Livedwlth l relative . . . . . . . . . . . . . . . . . . . . 30,187 3,640 26,548 24.3 42.4 23.0 Lbfedwith 20rmore relatives. . . . . . . . . . . . . . 24,839 2,710 22,129 20.0 31.6 19.2
ilm~de~ ~t~r ~~egOrI~Sof ~seases of heart not shov.m In ~hls table.
NOTE Oregonnotlnduded In the 19Se National Mortality Followback Survey. Numbers may@ add to totals be.xuse of rounding.
12 Advance Data Table 6. Number and percent distribution of heart disease decedents by family income, according to age, sex, and seiected forms of heart disease: United Statea, 1966
25-64 65 years 25-64 65 years Cause of death, sex, and family income All agtx years and over All ages year3 and over
All forms of heart disease’ Number Percent dlstrlbutlon
Both sexes All family income . . . . . . . . . . . . . . . . . . . . . . 586,197 111,705 474,492 100.0 100.0 100.0
Under$5,000 . . . . . . . . . . . . . . . . . . . . . . . . 127,177 15,960 111,217 21.7 14.3 23.4 $5,000-$8,999. . . . . . . . . . . . . . . . . . . . . . . 130,498 15,026 115,470 22.3 13.5 24.3 $9,000-$24,999 . . . . . . . . . . . . . . . . . . . . . . 222,076 46,027 176,049 37.9 41.2 37.1 $25,0000rmore . . . . . . . . . . . . . . . . . . . . . . 106,446 34,692 71,756 18.2 31.1 15.1
Male Allfamllyincome . . . . . . . . . . . . . . . . . . . . . . 305,881 80,126 225,532 100.0 100.0 100.0 lJnder$5,000 . . . . . . . . . . . . . . . . . . . . . . . . 44,578 6,327 38,251 14.6 10.4 16.1 $5,00G$8,999 . . . . . . . . . . . . . . . . . . . . . . . 63,478 11,317 52,181 20.6 14.1 23.1 $9,00Ck$24,999 . . . . . . . . . . . . . . . . . . . . . . 134,567 33,610 100,958 44.0 41.9 44.8 $25,0000rmore . . . . . . . . . . . . . . . . . . . . . . 63,038 26,674 36,163 20.6 33,5 16.0
Female: Allfamilylncome . . . . . . . . . . . . . . . . . . . . . . 280,536 31,577 248,959 100.0 100.0 100.0
Under$5,000 . . . . . . . . . . . . . . . . . . . . . . . . 82,599 7,633 74,968 29.4 24.2 30.1 $5,00-$8,999 . . . . . . . . . . . . . . . . . . . . . . . 67,018 3,709 63,309 23.9 11.7 25.4 $9,000-$24,999 . . . . . . . . . . . . . . . . . . . . . . 87,509 12,417 75,092 31.2 39.3 30.2 $25,0000rmore . . . . . . . . . . . . . . . . . . . . . . 43,410 7,816 35,592 15.5 24.8 14.3
Ischemlc
Bothsexe% Allfamllyincome . . . . . . . . . . . . . . . . . . . . . . 404,038 76,431 327,605 100.0 100.0 100.0
Under$5,000 . . . . . . . . . . . . . . . . . . . . . . . . 81,656 9,013 72,643 20.2 11.8 22.2 $5,000-$8,999 . . . . . . . . . . . . . . . . . . . . . . . 87,816 9,374 76,441 21.7 12.3 23.9 $9,000-$24,999 . . . . . . . . . . . . . . . . . . . . . . 154,388 31,357 123,030 38.2 41.0 37.6 $25,0000rmore . . . . . . . . . . . . . . . . . . . . . . 80,176 26,687 53,480 19.6 34.9 16.3
Male Alifamllyincome . . . . . . . . . . . . . . . . . . . . . . 219,424 56,072 161,351 100.0 100.0 100.0 Under$5,000 . . . . . . . . . . . . . . . . . . . . . . . . 29,506 5,402 24,108 13.4 9.3 14.9 $5,00C-$8,999 . . . . . . . . . . . . . . . . . . . . . . . 44,994 7,393 37,601 20.5 12.7 23.3 $9,000-$24,999 . . . . . . . . . . . . . . . . . . . . . . 96,043 24,140 71,903 43.8 41.6 44.6 $25,0000rmore . . . . . . . . . . . . . . . . . . . . . . 46,878 21,137 27,741 22.3 36.4 17.2
Female: Allfamllylncome . . . . . . . . . . . . . . . . . . . . . . 164,612 18,359 166,253 100.0 100.0 100.0 Under$5,0!X1 . . . . . . . . . . . . . . . . . . . . . . . . 52,148 3,612 46,537 28.2 19.7 29.2 $5,000-$8,999 . . . . . . . . . . . . . . . . . . . . . . . 42,821 1,981 40,841 23.2 10.8 24.6 $9,00(H24,999 . . . . . . . . . . . . . . . . . . . . . . 58,345 7,217 51,127 31.6 39.3 30.8 $25,0000rmore . . . . . . . . . . . . . . . . . . . . . . 31,298 5,549 25,748 17.0 30.2 15.5
Acute myocardial infarction
Both sexes: Allfamllyincome . . . . . . . . . . . . . . . . . . . . . . 199,019 44,227 154,792 100.0 100.0 100.0 Under$5,000 . . . . . . . . . . . . . . . . . . . . . . . . 34,052 5,112 28,941 17.1 11.6 18.7 $5,000-$8,999 . . . . . . . . . . . . . . . . . . . . . . . 42,510 5,767 36,743 21.4 13.0 23.7 $9,000-$24,999 . . . . . . . . . . . . . . . . . . . . . . 81,464 18,990 62,474 40.9 42.9 40.4 $25,0000rmore . . . . . . . . . . . . . . . . . . . . . . 40,993 14,357 26,636 20.6 32.5 17.2
Male Allfamilyincome . . . . . . . . . . . . . . . . . . . . . . 115,095 33,312 81,783 100.0 100.0 100.0 Under$5,000 . . . . . . . . . . . . . . . . . . . . . . . . 14,377 3,255 11,122 12.5 13.6 $5,000-$8,999 . . . . . . . . . . . . . . . . . . . . . . . 20,298 4,579 15,719 17.6 1:; 19.2 $9,000-$24,999 . . . . . . . . . . . . . . . . . . . . . . 54,304 14,377 39,926 47.2 43.2 48.8 $25,0000rmore . . . . . . . . . . . . . . . . . . . . . . 26,116 11,100 15,016 22.7 33.3 16.4
Female Allfamilylrrcome . . . . . . . . . . . . . . . . . . . . . . 83,925 10,915 73,009 100.0 100.0 100.0 Und8r$5,000 . . . . . . . . . . . . . . . . . . . . . . . . 19,675 1,857 17,819 23.4 17.0 24.4 $5,000-$8,999 . . . . . . . . . . . . . . . . . . . . . . . 22,212 1,188 21,024 26.5 10.9 28.8 $9,000-$24,999 . . . . . . . . . . . . . . . . . . . . . . 27,160 4,613 22,547 32.4 42.3 30.9 $25,0000rmore . . . . . . . . . . . . . . . . . . . . . . 14,877 3,256 11,619 17.7 29.6 15.9
See footnotes at end of table.
Advance Data 13
Table 6. Number and percent distribution of heart disease decedents by family income, according to age, sex, and selected forms of heart diseaae: United States, 1986-Con.
26-64 &5 years 25-64 65 years Cause of death, sex, and family Income Ail ages years and over All ages years and over
Olher Ischemic, old myocardial infarction Percent distribution
Both sexes: All famllylnccme, . . . . . . . . . . . . . . . . . . . . . 201,265 31,132 170,133 100.0 100.0 100.0
Under$5,000. ., . . . . . . . . . . . . . . . . . . . . . 47,412 3,767 43,645 23.6 12.1 25.7 $5,00~$8,999 . . . . . . . . . . . . . . . . . . . . . . . 44,609 3,596 41,014 22.2 11.6 24.1 $9,000-$24,999 . . . . . . . . . . . . . . . . . . . . . . 70,690 11,662 58,826 35.1 S&l 34.6 $25,0000rmore . . . . . . . . . . . . . . . . . . . . . . 36,553 11,907 26,646 19.2 38.2 15.7
Malw Allfamllyincome, . . . . . . . . . . . . . . . . . . . . . 101,851 23,867 77,964 100.0 100.0 100.0
Under$5,000 . . . . . . . . . . . . . . . . . . . . . . . . 15,022 2,038 12,984 14.7 8.5 16.6 $5,000-$8,999 . . . . . . . . . . . . . . . . . . . . . . . 24,219 2,814 21,405 23.8 11.8 27.4 $9,000-$24,999 . . . . . . . . . . . . . . . . . . . . . . 40,175 9,305 30,670 39.4 39.0 39.6 $25,000crmcre . . . . . . . . . . . . . . . . . . . . . . 22,435 9,711 12,725 22.0 40.7 16.3
Female: Allfamllylncome . . . . . . . . . . . . . . . . . . . . . . 99,413 7,265 92,149 100.0 100.0 100.0
Under$5,000 . . . . . . . . . . . . . . . . . . . . . . . . 32,390 1,730 30,661 32.6 23.8 33.3 $5,000-$8,999 . . . . . . . . . . . . . . . . . . . . . . . 20,390 762 19,608 20.5 10.8 21.3 $9,000-$24,999 . . . . . . . . . . . . . . . . . . . . . . 30,515 2,557 27,e56 30.7 35.2 30.3 $25,0000rmcre . . . . . . . . . . . . . . . . . . . . . . 16,118 2,196 13,921 16.2 30.2 15.1
i Includes ~ther cakgcrles of Disease of heart not ShWn in this table.
NOTE Oregon not Included In the 198L3 National Modality Followback Survey. Numbers may not add to totals because of rounding.
14 Advance Data Table 7. Number and percent distribution of heart disease decedents by assets, according to age, sex, and selected forms of heart diseas= United States, 1986
26-64 65 years 26-64 65 years Cause of death, sex, and familyassets
All forms of heart disease’ Both sexes:
A116sseIs . . . . . . . . . . . . . . . . . . . . . . . . . .
None . . . . . . . . . . . . . . . . . . . . . . . . . . . . . $1-$4,999 . . . . . . . . . . . . . . . . . . . . . . . . . . $5,000-$24,999 . . . . . . . . . . . . . . . . . . . . . . $25,00LY$49,999 . . . . . . . . . . . . . . . . . . . . . $50,0000rmore . . . . . . . . . . . . . . . . . . . . . .
Male: Allessets . . . . . . . . . . . . . . . . . . . . . . . . . .
None . . . . . . . . . . . . . . . . . . . . . . . . . . . . . $1-$4,999 . . . . . . . . . . . . . . . . . . . . . . . . . . $5,000-$24,999 . . . . . . . . . . . . . . . . . . . . . . $25,00&$49,999 . . . . . . . . . . . . . . . . . . . . . . $50,0000rmore . . . . . . . . . . . . . . . . . . . . . .
Female AllasseIs . . . . . . . . . . . . . . . . . . . . . . . . . .
None . . . . . . . . . . . . . . . . . . . . . . . . . . . . . $1-$4,999 . . . . . . . . . . . . . . . . . . . . . . . . . . $5,00&$24,999 . . . . . . . . . . . . . . . . . . . . . . $25,00&$49,999 . . . . . . . . . . . . . . . . . . . . . . $50,0000rmore . . . . . . . . . . . . . . . . . . . . . .
Ischemlc
BothSexes Allassets . . . . . . . . . . . . . . . . . . . . . . . . . .
None . . . . . . . . . . . . . . . . . . . . . . . . . . . . . $1-$4,999 . . . . . . . . . . . . . . . . . . . . . . . . . . $5,000-$24,999 . . . . . . . . . . . . . . . . . . . . . . $25,000-$49,999 . . . . . . . . . . . . . . . . . . . . . . $50,0000rmore . . . . . . . . . . . . . . . . . . . . . .
Ma18 Allassek . . . . . . . . . . . . . . . . . . . . . . . . . .
None . . . . . . . . . . . . . . . . . . . . . . . . . . . . . $1-$4,999 . . . . . . . . . . . . . . . . . . . . . . . . . . $5,00*$24,999 . . . . . . . . . . . . . . . . . . . . . . $25,00&$49,999 . . . . . . . . . . . . . . . . . . . . . . $50,0000rmore . . . . . . . . . . . . . . . . . . . . . .
Female Allassels . . . . . . . . . . . . . . . . . . . . . . . . . .
None . . . . . . . . . . . . . . . . . . . . . . . . . . . . . $1-$4,999 . . . . . . . . . . . . . . . . . . . . . . . . . . $5,000-$24,999 . . . . . . . . . . . . . . . . . . . . . . $25,000-$49,999 . . . . . . . . . . . . . . . . . . . . . . $50,0000rmore. . . . . . . . . . . . . . . . . . . . . .
Acutemyocardlal infarction
Both sexes Allassets . . . . . . . . . . . . . . . . . . . . . . . . . .
None . . . . . . . . . . . . . . . . . . . . . . . . . . . . . $1-$4,999 . . . . . . . . . . . . . . . . . . . . . . . . . . $5,000-$24,999 . . . . . . . . . . . . . . . . . . . . . . $25,00G$49,999 . . . . . . . . . . . . . . . . . . . . . . $50,0000rmore . . . . . . . . . . . . . . . . . . . . . .
Male: Allassets . . . . . . . . . . . . . . . . . . . . . . . . . .
None . . . . . . . . . . . . . . . . . . . . . . . . . . . . . $1-$4,999 . . . . . . . . . . . . . . . . . . . . . . . . . . $5,000-$24,999 . . . . . . . . . . . . . . . . . . . . . . $25,00G$49,999 . . . . . . . . . . . . . . . . . . . . . . $50,0000rmore . . . . . . . . . . . . . . . . . . . . . .
Female Allassek . . . . . . . . . . . . . . . . . . . . . . . . . .
None . . . . . . . . . . . . . . . . . . . . . . . . . . . . . $1-$4,999. . $5,00G$24,999 :::::::::::::: :::::::: $25,000-$49,999 . . . . . . . . . . . . . . . . . . . . . . $50,0000rmore . . . . . . . . . . . . . . . . . . . . . .
See footnotes at end of table.
All ages years and over All ages years and over
Percent distribution
613,890 116,265 497,625 100.0 100,0 100,0 116,966 19,805 97,162 19.1 17.0 19.5 119,740 20,872 98,668 19.5 16.0 19.9 100,598 20,050 80,546 76.4 17.2 16,2 94,031 17,677 76,354 15.3 15.2 15,3
182,554 37,681 144,693 29.7 32.6 29.1
312,169 83,819 228,350 100.0 100.0 100.0
46,964 14,308 32,65J3 15.0 17.1 14.3 46,594 14,235 34,359 15.6 17.0 15.0 53,405 15,174 36,232 17.1 18.1 18.7 53,915 71,654 42,061 17.3 14.1 16.4
109,291 28,248 81,043 35.0 33.7 35.5
301,720 32,446 269,275 100.0 100.0 100.0 70,003 5,497 64,508 23.2 16.9 24.0 71,146 8,637 64,509 23.6 20.5 24.0 47,i 93 4,877 42,316 15,6 15.0 15.7 40,116 5,823 34,293 13.3 17.9 12.7 73,263 9,612 63,651 24.3 29.6 23.6
41e,85a 76,513 340,345 100.0 100.0 100.0
73,712 11,687 62,024 17.6 14.9 18.2 78,259 13,200 65,059 18.7 16,8 19.1 70,843 14,001 56,842 16.9 17.8 16.7 62,456 11,458 50,998 14.9 14.6 15.0
133,588 28,166 105,422 31.9 35.9 31.0
221,187 59,e89 161,298 100.0 100.0 100.0
30,236 9,057 21,180 13.7 15.1 13.1 32,735 9,615 22,920 14.8 ~6.4 14.2 38,e50 11,461 27,369 17.6 19.2 17.0 36,780 8,151 28,628 16.6 13.6 17.7 82,566 21,365 61,201 37.3 35.7 37.9
197,671 18,623 179,046 100.0 100.0 100.0 43,475 2,631 40,845 22.0 14.1 22.8 45,524 3,365 42,139 23.0 18.2 23.5 31,994 2,521 29,473 16.2 13.5 16.5 25,676 3,308 22,370 13.0 17.6 12.5 51,002 6,781 44,221 25.6 38.4 24.7
203,504 44,715 156,769 100.0 100.0 100.0 30,244 6,165 24,080 14.9 13.8 15.2 38,555 7,641 28,914 18.0 17.1 16,2 36,732 7,468 29,264 16.0 16.7 18.4 32,743 7,564 25,159 16.1 17.0 15.8 67,229 15,657 51,372 33.0 35,5 32.4
116,505 33,598 82,907 100.0 100.0 100.0 14,473 4,707 9,765 12.4 14.0 11.8 17,492 5,586 11,906 15.0 16.6 14.4 20,295 6,051 14,244 17.4 18,0 17.2 19,598 5,588 14,009 16.6 16.6 16.9 44,648 11,666 32,982 38.3 34.7 39.6
86,999 11,117 75,e83 100.0 100.0 100.0 15,772 1,457 14,314 18.1 13.1 18.9 19,063 2,055 17,006 21.9 18.5 22,4 16,437 1,417 15,020 18.9 12.8 19.e 13,146 1,996 11,150 15.1 18.0 14.7 22,581 4,191 18,390 26.0 37.7 24.2

AdvanceData 15 Table 7. Number and percent distribution of heart disease decedents by assets, according to age, sex, and selected forms of heart disease: United States, 1986-Con.
Cause of death, sex, and family assets
Olher Ischemic, old myocardial infarction
Bolh sexes: Allassels . . . . . . . . . . . . . . . . . . . . . . . . . .
None . . . . . . . . . . . . . . . . . . . . . . . . . . . . . $1-$4,999 . . . . . . . . . . . . . . . . . . . . . . . . . . $5,000-$24,999 . . . . . . . . . . . . . . . . . . . . . . $25,000-$49,999 . . . . . . . . . . . . . . . . . . . . . . $50,0000rmore . . . . . . . . . . . . . . . . . . . . . .
Male: Allassels . . . . . . . . . . . . . . . . . . . . . . . . . .
Non . . . . . . . . . . . . . . . . . . . . . . . . . . . . . $1-$4,999 . . . . . . . . . . . . . . . . . . . . . . . . . . $5,000-$24,999 . . . . . . . . . . . . . . . . . . . . . . $25)000-$49,999 . . . . . . . . . . . . . . . . . . . . . . $50,0000rmore. . . . . . . . . . . . . . . . . . . . . .
Female: Allassats . . . . . . . . . . . . . . . . . . . . . . . . . .
None . . . . . . . . . . . . . . . . . . . . . . . . . . . . . $1-$4,999 . . . . . . . . . . . . . . . . . . . . . . . . . . $5,000-$24,999 . . . . . . . . . . . . . . . . . . . . . . $25,000-$4e)e99 . . . . . . . . . . . . . . . . . . . . . . $50,0000rmore . . . . . . . . . . . . . . . . . . . . . .
25-64 65 yeats All ages yeats and over
Number
211,154 32,473 179,681
43,076 5,402 37,673 40,953 5,223 35,730 33,177 6,065 27,112 28,950 3,596 25,354 65,000 12,187 52,812
101,768 25,156 76,611
15,441 4,240 11,201 14,784 3,977 10,807 17,838 4,972 12,866 16,969 2,349 14,342 37,017 9,621 27,386
109,386 7,316 102,070
27,635 1,162 26,473 29,169 1,246 24,923 15,338 1,092 14,249 12,282 *I ,24e 11,012 27,993 2,566 25,416
25-64 65 years All ages yeare and over
Percent distribution
100.0 100.0 100.0
20.4 16.9 21.1 19.4 ie.i 20.0 15.7 18.7 15.2 13.7 11.1 14.2 30.8 37.5 29.6
100.0 100.0 100.0
15.2 16.9 14.6 14.5 15.8 14.1 17.5 19.8 16.8 16.4 9.3 le.7 39.4 38.2 35.8
100.0 100.0 lcir.o
25.3 15.9 25.9 23.9 17.0 24.4 14.0 14.9 14.0 11.2 *17.1 10.9 25.6 35.1 24.9
‘Includes other categories of Diseases of heart not shown in this table.
NOTE Oregon not Ircluded In the 1999 Natlorwl Mortality Followback Survey. Numbers may not add to totals because of rcundlrrg.
16 Advance Data Table 8. Number and percent distribution of heart disease decedents by number of doctor visits during the year preceding death, according to age, sex, and selected forms of heart disease: United States, 1986
25-64 86 years 25-64 65 years Cause of death, sex, and number of doctor VMS All ages years and over All ages years and over
All forms of heart disease’ Number Percent distribution Both sexes:
Allvisits . . . . . . . . . . . . . . . . . . . . . . . . . . . 701,815 131,622 569,993 100.0 100.0
Novisifs . . . . . . . . . . . . . . . . . . . . . . . . . . . 96,674 14,943 81,731 13.8 11.3 14.3 I visit . . . . . . . . . . . . . . . . . . . . . . . . . . . . . 36,183 10,775 25,408 5.2 8.2 4.5 2-4VISIIS . . . . . . . . . . . . . . . . . . . . . . . . . . . 151,464 32,649 118,616 21.6 24.8 20.6 6-14VISIW. . . . . . . . . . . . . . . . . . . . . . . . . . 261,088 41,140 219,948 37.2 31.2 38.6 15visltsormore . . . . . . . . . . . . . . . . . . . . . . 166,405 32,315 124,090 22.3 24.5 21.8
Male: Allvisits . . . . . . . . . . . . . . . . . . . . . . . . . . . 364,930 95,638 269,292 100.0 100.0 100.0
Novisifs . . . . . . . . . . . . . . . . . . . . . . . . . . . 41,926 12,224 29,702 11.5 12.6 11.0 I visit.. . . . . . . . . . . . . . . . . . . . . . . . . . . . 22,926 9,330 13,597 8.3 9.8 2-4VISRS. . . . . . . . . . . . . . . . . . . . . . . . . . . 89,140 25,754 83,367 24.4 26.9 2~5 5-14visits . . . . . . . . . . . . . . . . . . . . . . . . . . 135,369 27,999 107,371 37.1 29.3 39.9 15visitsormore . . . . . . . . . . . . . . . . . . . . . . 75,566 20,332 20.7 21.3 20.5
Female: Allvlsifs . . . . . . . . . . . . . . . . . . . . . . . . . . . 336,884 36,184 300,700 100.0 100.0 100.0
Novisits . . . . . . . . . . . . . . . . . . . . . . . . . . . 54,746 2,719 52,029 16.3 7.5 i7.3 I visit . . . . . . . . . . . . . . . . . . . . . . . . . . . . . 13,257 1,445 11,612 3.9 4.0 2-4visifs . . . . . . . . . . . . . . . . . . . . . . . . . . . 62,324 6,895 55,429 16.5 19.1 4?4 5-i4visirs . . . . . . . . . . . . . . . . . . . . . . . . . . 125,719 13,142 112,577 37.3 36.3 37.4 15vlsifsormore . . . . . . . . . . . . . . . . . . . . . . 60,837 11,984 66,853 24.0 33.1 22.9
lschem!c
Both sexes Allvisits . . . . . . . . . . . . . . . . . . . . . . . . . . . 466,664 91,085 397,532 100.0 100.0 100.0
Novisits . . . . . . . . . . . . . . . . . . . . . . . . . . . 64,880 9,605 55,275 13.3 10.5 13.9 I visit . . . . . . . . . . . . . . . . . . . . . . . . . . . . . 25,522 9,165 16,337 5,2 10.1 2-4visk3 . . . . . . . . . . . . . . . . . . . . . . . . . . . 108,054 24,720 83,334 22.1 27.1 2:: 5-14VISHS . . . . . . . . . . . . . . . . . . . . . . . . . . 184,659 27,612 157,047 37.8 30.3 39.5 15visifsormore . . . . . . . . . . . . . . . . . . . . . . 105,546 19,942 85,606 21.6 21.9 21.5
Male: Allvlsits . . . . . . . . . . . . . . . . . . . . . . . . . . . 263,654 69,590 194,085 100.0 100.0 100.0
Novlsits . . . . . . . . . . . . . . . . . . . . . . . . . . . 26,596 7,941 20,655 10.6 11.4 10.6 lvkit . . . . . . . . . . . . . . . . . . . . . . . . . . . . . 17,125 8,045 9,060 6.5 11.6 4.7 2-4VISHS. . . . . . . . . . . . . . . . . . . . . . . . . . . 66,365 20,817 47,548 25.9 29.9 24.5 5-14vKts . . . . . . . . . . . . . . . . . . . . . . . . . . 96,706 19,634 77,072 36.7 28.2 39.7 5vislfsormore . . . . . . . . . . . . . . . . . . . . . . . 52,663 13,153 39,710 20.1 18.9 20.5
Female: Allvks.ifs . . . . . . . . . . . . . . . . . . . . . . . . . . . 225,010 21,475 203,534 100.0 100.0 100.0 Novisits . . . . . . . . . . . . . . . . . . . . . . . . . . . 36,265 1,664 34,620 16.1 7.6 17.0 I visit . . . . . . . . . . . . . . . . . . . . . . . . . . . . . 6,397 1,141 7,256 3.7 5.3 3.6 2-4visits . . . . . . . . . . . . . . . . . . . . . . . . . . . 39,690 3,903 35,787 17.6 18.2 17.6 E-14visirs . . . . . . . . . . . . . . . . . . . . . . . . . . 87,953 7,978 79,975 39.1 37.2 39.3 15visifsormore . . . . . . . . . . . . . . . . . . . . . . 52,685 6,789 45,696 23.4 31.6 22.5
Acute myocardia[ Infarction
Bothsexe% Allvisits . . . . . . . . . . . . . . . . . . . . . . . . . . . 238,879 52,134 166,745 100.0 100.0 100.0
Novisits . . . . . . . . . . . . . . . . . . . . . . . . . . . 25,002 4,737 20,265 10.5 9.1 10.9 Ivlsif . . . . . . . . . . . . . . . . . . . . . . . . . . . . . 12,539 4,670 7,669 5.2 9.0 4.2 2-4vistts . . . . . . . . . . . . . . . . . . . . . . . . . . . 63,088 16,000 47,068 26.4 30.7 25,2 s14visRs . . . . . . . . . . . . . . . . . . . . . . . . . . 90,945 16,639 74,306 38.1 31.9 39.8 5visitsormore. . . . . . . . . . . . . . . . . . . . . . . 47,304 10,088 37,217 19.8 19.3 19.9
Male: Allvieiis . . . . . . . . . . . . . . . . . . . . . . . . . . . 140,032 39,554 100,478 10Q.O 100.0 100.0 Novlsits . . . . . . . . . . . . . . . . . . . . . . . . . . . 14,678 4,103 10,573 10.5 10.4 10.5 Ivisir . . . . . . . . . . . . . . . . . . . . . . . . . . . . . 8,733 3,668 *4,665 6.2 9.8 *4.8 2-4VISHS . . . . . . . . . . . . . . . . . . . . . . . . . . . 40,948 12,994 27,955 29.2 32.9 27.8 5-14visits . . . . .. #........ . . . . . . . . . . . 50,075 11,674 38,40i 35.6 29.5 38.2 5vkifsormore . . . . . . . . . . . . . . . . . . . . . . . 25,600 6,915 16,665 18.3 17.5 18.6
Female: Allvlsifs . . . . . . . . . . . . . . . . . . . . . . . . . . . 98,647 12,560 S6,267 100.0 100.0 100.0
Novlsits . . . . . . . . . . . . . . . . . . . . . . . . . . . 10,326 %34 9,692 10.4 *5.O 11.2 l visit . . . . . . . . . . . . . . . . . . . . . . . . . . . . . 3,806 *802 *3,004 3.9 *6.4 *3.5 2-4VISHS . . . . . . . . . . . . . . . . . . . . . . . . . . . 22,140 3,006 19,134 22.4 23.9 22.2 6-14visits . . . . . . . . . . . . . . . . . . . . . . . . . . 40,671 4,e65 35,906 41.3 39.5 41.6 5vis~s0rmOre . . . . . . . . . . . . . . . . . . . . . . . 3,173 16.531 22.0 25.2 21.5
See footnotes at end of table.

Advance Data 17 Table 8. Number and percent distribution of heart disease decedents by number of doctor visits during the year preceding death, according to age, sex, and selected forms of heart disease: United States, 1986-Con.
25-64 65 years 25-64 65 years Cause of death, sex, and number of doctor visits All ages years and over All agas years and over
Other Ischemlc, old myocardial infarction Number Percent distribution
Both saxes AIIvIsNs . . . . . . . . . . . . . . . . . . . . . . . . . . . 244,522 37,171 207,351 Icm.o 1COO 100.0 Novislls . . . . . . . . . . . . . . . . . . . . . . . . . . . 39,337 4,798 34,538 16.1 12.9 16.7 Ivlsn, . . . . . . . . . . . . . . . . . . . . . . . . . . . . 12,024 3,970 8,054 4.9 10.7 3.9 2-4VISHS. . . . . . . . . . . . . . . . . . . . . . . . . . . 43,842 8,151 35,892 17.9 21.9 17.2 5-14vlsits. . . . . . . . . . . . . . . . . . . . . . . . . . 91,793 10,699 81,093 37.5 28.8 39.1 15vlsitsormore . . . . . . . . . . . . . . . . . . . . . . 57,528 9,553 47,975 23.5 25.7 23.1
Male Allvlslls . . . . . . . . . . . . . . . . . . . . . . . . . . . 119,642 28,455 91,387 100.0 100.0 100.0
Novlslts . . . . . . . . . . . . . . . . . . . . . . . . . . . 13,691 3,815 9,675 11.4 13.4 10.8 lvislt . . . . . . . . . . . . . . . . . . . . . . . . . . . . . 7,640 3,631 ‘4,008 6.4 12.8 *4.4 2-4VISUS., . . . . . . . . . . . . . . . . . . . . . . . . . 26,316 7,277 19,039 22.0 25.6 20.8 5-14vislts. . . . . . . . . . . . . . . . . . . . . . . . . . 45,356 7,710 37,646 37.6 27.1 41.2 15visltsormore, . . . . . . . . . . . . . . . . . . . . . 26,639 6,021 20,818 22.4 21.2 22.8
F6male Allvlslts, . . . . . . . . . . . . . . . . . . . . . . . . . . 124,661 8,716 115,965 100.0 100.0 100.0 Novlsits . . . . . . . . . . . . . . . . . . . . . . . . . . . 25,646 �983 24,663 20.6 *11.3 21.3 Ivlsll. . . . . . . . . . . . . . . . . . . . . . . . . . . . . 4,3a4 *339 *4,045 3.5 *3.9 *3.5 2-4VMS... . . . . . . . . . . . . . . . . . . . . . . . . 17,526 874 16,653 14.1 10.0 14.4 6-14vlsits, . . . . . . . . . . . . . . . . . . . . . . . . . 46,436 2,969 43,447 37.2 34.3 37.5 5vlsltsormore . . . . . . . . . . . . . . . . . . . . . . . 30,688 3,532 27,157 24.6 40.5 23.4
i ln~bd~~ot~r ,@egorles of Diseases of heart not s~wn In this ‘able.
NOTE Oregon not Included In tha 19Sf3 Natlomil Mortality Followback Survey. Numbers may not add to totals beause of rourdlng.

18 Advance Data Table 9. Number and percent distribution of heart disease decedents by sex, according to age, type of health facility, and selected forms of heart disease: United Sates, 1986
25-64 65 years 25-64 65 years Cause of death, type of health facilitg and sex All ages years and over All ages years and over
All forms of heart disease’ Number Percent distribution
Hospital or nursing horn= Bothsexes . . . . . . . . . . . . . . . . . . . . . . . . . 564,694 82,494 462,200 100.0 100.0 100.0
Male . . . . . . . . . . . . . . . . . . . . . . . . . . . . . 270,910 57,126 213,764 48.0 69.2 44.3 Female . . . . . . . . . . . . . . . . . . . . . . . . . . . . 293,784 25,368 26e,416 52.0 30.6 55.7
Other health facility Both sexes . . . . . . . . . . . . . . . . . . . . . . . . . ie,i54 3,031 15,123 100.0 100.0 100.0
Male . . . . . . . . . . . . . . . . . . . . . . . . . . . . . 7,104 1,956 5,149 39.1 64.5 34.0 Female . . . . . . . . . . . . . . . . . . . . . . . . . . . . 11,050 *1,075 9,975 60.9 *35.5 66.0
Hospice: Bothsexes . . . . . . . . . . . . . . . . . . . . . . . . . 30,977 3,392 27,585 100.0 100.0 100.0
Male, . . . . . . . . . . . . . . . . . . . . . . . . . . . . 14,735 *2,116 12,619 47.6 *62.4 45.7 Female . . . . . . . . . . . . . . . . . . . . . . . . . . . . 16,242 *1,276 14,966 52.4 *37.6 54,3
lschemlc
Hospftal or nursing home Bothsexes . . . . . . . . . . . . . . . . . . . . . . . . . 385,218 52,434 332,785 100.0 100.0 100.0
Male . . . . . . . . . . . . . . . . . . . . . . . . . . . . . 190,830 38,892 151,937 49.5 74.2 45.7 Female . . . . . . . . . . . . . . . . . . . . . . . . . . . . 194,389 13,542 180,846 50.5 25.8 54.3
Other health facility Bothsexes . . . . . . . . . . . . . . . . . . . . . . . . . 12,691 1,720 10,971 100.0 100.0 100.0
Male . . . . . . . . . . . . . . . . . . . . . . . . . . . . . 5,162 *1,055 *4, 107 40.7 *61.3 *37.4 Female . . . . . . . . . . . . . . . . . . . . . . . . . . . . 7,529 *665 6,864 59.3 *38.7 62.6
Hospice: Bothsexes . . . . . . . . . . . . . . . . . . . . . . . . . 20,964 2,053 16,911 100.0 100.0 100.0
Male . . . . . . . . . . . . . . . . . . . . . . . . . . . . . 10,270 1,198 9,072 49.0 58.3 46.0 Female . . . . . . . . . . . . . . . . . . . . . . . . . . . . 10,694 *855 9,839 51.0 *41.7 52.0
Acute myocardlal infarction
Hosplfai or nursing home Bothsexes . . . . . . . . . . . . . . . . . . . . . . . . . 176,428 29,487 146,941 100.0 100.0 100.0
Male . . . . . . . . . . . . . . . . . . . . . . . . . . . . . 97,376 22,608 74,770 55.2 76.7 50.9 Female . . . . . . . . . . . . . . . . . . . . . . . . . . . . 79,053 6,881 72,172 44.8 23.3 49.1
Other health facllify: Bothsexes . . . . . . . . . . . . . . . . . . . . . . . . . 4,308 1,020 3,2S8 100.0 100.0 100.0
Male . . . . . . . . . . . . . . . . . . . . . . . . . . . . . �1,719 *644 *1 ,075 *39.9 *63.2 *32.7 Female . . . . . . . . . . . . . . . . . . . . . . . . . . . . *2,589 �376 *2,213 *W. 1 *36.8 *67.3
HosPice Bothsexes . . . . . . . . . . . . . . . . . . . . . . . . . 7,795 1,044 6,751 100.0 100.0 100.0
Male . . . . . . . . . . . . . . . . . . . . . . . . . . . . . 4,679 *635 *4,044 60.0 *60.6 *59.9 Female . . . . . . . . . . . . . . . . . . . . . . . . . . . . 3,116 *409 *2,707 40.0 *39.2 *40. I
Other Ischemic, old myocardial infarction
Hospital or nursing home: Bothsexes . . . . . . . . . . . . . . . . . . . . . . . . . 206,379 22,368 164,011 100.0 100.0 100.0
Male . . . . . . . . . . . . . . . . . . . . . . . . . . . . . 91,953 15,730 76,223 44.6 70.3 41.4 Female . . . . . . . . . . . . . . . . . . . . . . . . . . . . 114,425 6,638 107,767 55.4 29.7 58.6
Other health facilii: Bothsexes . . . . . . . . . . . . . . . . . . . . . . . . . e,384 701 7,683 100.0 100.0 100.0
Male . . . . . . . . . . . . . . . . . . . . . . . . . . . . . *3,443 *4I 1 *3,032 *41.1 *58.7 *39.5 Female . . . . . . . . . . . . . . . . . . . . . . . . . . . . 4,941 *290 *4,651 56.9 *41.3 *60.5
HosPice Bothsexes . . . . . . . . . . . . . . . . . . . . . . . . . 12,733 781 11,952 100.0 100.0 100.0
Male . . . . . . . . . . . . . . . . . . . . . . . . . . . . . 5,374 *346 5,026 42.2 *44.3 42.1 Female . . . . . . . . . . . . . . . . . . . . . . . . . . . . 7,359 �435 6,924 57.8 *55.7 57.9
‘Inchdes other categories of Oiseeses of heart not shown In this table.
NOTE: Oregon not hwluded In the 19&3 Natlonel Mo!tality Followback Survey. Numbers may not add to totals because of rounding.

Advance Data 19 Table 10. Number and percent distribution of heart disease decedente by major payment source, according to age, sex, and selected forms of heart disease: United States, 1986
25-64 66 years 25-64 65 years Cause of death, sex, and meJorpayment source All ages yeaf3 and over All ages years and over
All forms of heart disease’ Number Percent distribution
Bolh sexes Allsources of payment . . . . . . . . . . . . . . . . . . 608,926 114,664 494,243 100.0 100.0 100.0
Selforfamily . . . . . . . . . . . . . . . . . . . . . . . . 78,906 15,352 63,554 13.0 13.4 12.9 Olherfamlly members . . . . . . . . . . . . . . . . . . 5,341 *I ,040 *4,301 0.9 +’0.9 ‘0.9 Medicare . . . . . . . . . . . . . . . . . . . . . . . . . . 308,793 16,322 292,471 50.7 14.2 59.2 Medlcald . . . . . . . . . . . . . . . . . . . . . . . . . . . 54,935 6,102 46,834 9.0 7.1 9.5 HMO . . . . . . . . . . . . . . . . . . . . . . . . . . . . . 112,409 56,883 55,526 16.5 49.6 11.2 Othersources . . . . . . . . . . . . . . . . . . . . . . . 48,543 16,985 31,558 8.0 14.8 6.4
Makx Allsourcesofpayment . . . . . . . . . . . . . . . . . . 312,438 82,613 100.0 100.0 100.0
Selforfamlly . . . . . . . . . . . . . . . . . . . . . . . . 36,495 11,267 25,208 11.7 13.7 11.0 Olherfamilymembera . . . . . . . . . . . . . . . . . . *1 ,798 *525 *1 ,274 *0.6 *0.6 ‘0.6 Medicare . . . . . . . . . . . . . . . . . . . . . . . . . . 151,585 10,824 140,761 48.5 13.1 61.2 Medicaid . . . . . . . . . . . . . . . . . . . . . . . . . . . 16,722 4,707 14,015 6.0 5.7 6.1 HMO . . . . . . . . . . . . . . . . . . . . . . . . . . . . . 71,023 41,775 29,248 22.7 50.6 12.7 Olhersources . . . . . . . . . . . . . . . . . . . . . . . 32,814 13,495 19,319 10.5 16.3 8.4
Femakv Allsourcesofpayment . . . . . . . . . . . . . . . . . . 296,489 32,071 264,418 100.0 100.0 100.0
Selforfamlly . . . . . . . . . . . . . . . . . . . . . . . . 42,411 4,085 38,346 14.3 12.7 14.5 Olherfamllymembers . . . . . . . . . . . . . . . . . . 3,542 *51 6 *3,027 1.2 �1.6 *1.1 Madlcare . . . . . . . . . . . . . . . . . . . . . . . . . . 157,208 5,498 151,710 53.0 17.1 57.4 Medicaid . . . . . . . . . . . . . . . . . . . . . . . . . . . 36,214 3,394 32,819 12.2 10.6 12.4 HMO . . . . . . . . . . . . . . . . . . . . . . . . . . . . . 41,386 15,108 26,278 14.0 47.1 9.9 Othersources . . . . . . . . . . . . . . . . . . . . . . . 15,729 3,490 12,239 5.3 10.9 4.6
Ischemic
Bo!hsexe% Allsourcesofpayment . . . . . . . . . . . . . . . . . . 421,722 77,802 344.+20 100.0 100.0 100.0
Seiforfamlly, . . . . . . . . . . . . . . . . . . . . . . . 55,407 10,728 44,680 13.1 13.8 13.0 Olherfamllymembers . . . . . . . . . . . . . . . . . . 3,352 *539 *2,813 *0.7 *0.8 Medicare . . . . . . . . . . . . . . . . . . . . . . . . . . 219,632 11,351 208,281 5:: 14.6 60.5 Medlcald. .. i . . . . . . . . . . . . . . . . . . . . . . . 33,881 4,363 29,518 8.0 5.6 8.6 HMO . . . . . . . . . . . . . . . . . . . . . . . . . . . . . 80,E168 40,809 40,059 19.2 52.6 11.6 O[hersources . . . . . . . . . . . . . . . . . . . . . . . 28,5a3 9,813 16,770 6.8 12.6 5.5
Makx Allsourcesofpaymcmt, ..,.... . . . . . . . . . . 224,515 59,eol 164,614 100.0 100.0 100.0
Selforfamlly . . . . . . . . . . . . . . . . . . . . . . . . 28,086 8,269 19,817 12.5 13.8 12.0 Otherfamllymembem . . . . . . . . . . . . . . . . . . *1,085 *420 *665 �0.5 *0.7 *0.4 Medicare . . . . . . . . . . . . . . . . . . . . . . . . . . 110,161 7,ee5 102,126 49.1 13.3 62.1 Medlcald . . . . . . . . . . . . . . . . . . . . . . . . . . . 12,253 2,872 9,381 5.5 4.8 5.7 HMO . . . . . . . . . . . . . . . . . . . . . . . . . . . . . 52,650 31,767 20,883 23.5 53.0 12.7 01tv3rsources . . . . . . . . . . . . . . . . . . . . . . . 11,673 9.0 14.4 7.1
Female Allsourcesofpayment . . . . . . . . . . . . . . . . . . 197,207 17,701 179,506 100.0 100.0 100.0
Selforfamlly . . . . . . . . . . . . . . . . . . . . . . . . 27,322 2,459 24,863 13.9 13.9 13.9 Olherfamilymembers . . . . . . . . . . . . . . . . . . *2,267 *118 *2,149 �1.1 *0.7 *1.2 Medicare . . . . . . . . . . . . . . . . . . . . . . . . . . 109,471 3,386 106,085 55.5 19.1 59.1 Medicaid. . . . . . . . . . . . . . . . . . . . . . . . . . . 21,628 1,490 20,137 11.0 8.4 11.2 HMO . . . . . . . . . . . . . . . . . . . . . . . . . . . . . 28,218 9,042 19,176 14.3 51.1 10.7 Olhersources, . . . . . . . . . . . . . . . . . . . . . . 8,302 1,206 7,097 4.2 6.8 4.0
See footnoles at end of table,

20 Advance Data Table 10. Number and percent distribution of heart disease deoedents by major payment source, according to age, sex, and selected forms of heart diseaae: United Statea, 1986–Con.
25-64 65 years 25-64 65 years Cause of death, sex, and major payment source All ages years and over All ages years and over
Acute myocardlal infarction Number Percent distribution
Both sexex Allsources of payment . . . . . . . . . . . . . . . . . . 206,914 44,137 162,777 100.0 100.0 100.0
Selforfamlly . . . . . . . . . . . . . . . . . . . . . . . . 26,254 6,618 19,636 12.7 15.0 12.1 Ofherfamily members . . . . . . . . . . . . . . . . . . *986 *254 *732 *0.5 *0.6 *0.4 Medicare . . . . . . . . . . . . . . . . . . . . . . . . . . 105,791 5,501 100,280 51.1 12.5 61.6 Medicaid . . . . . . . . . . . . . . . . . . . . . . . . . . . 14,391 2,633 11,758 7.0 6.0 7.2 HMO . . . . . . . . . . . . . . . . . . . . . . . . . . . . . 47,073 24,190 22,884 22.8 54.6 14.1 Othsrsources . . . . . . . . . . . . . . . . . . . . . . . 12,419 4,943 7,476 6.0 11.2 4.6
Male Allsourcesofpayment . . . . . . . . . . . . . . . . . 119,169 33,673 85,496 100.0 100.0 100.0
Selforfamily . . . . . . . . . . . . . . . . . . . . . . . . 14,705 4,924 9,781 12.3 14.6 11.4 Ofherfamilymembers . . . . . . . . . . . . . . . . . . *560 *170 *409 *0.5 �0.5 *0.5 Medicare . . . . . . . . . . . . . . . . . . . . . . . . . . 56,779 4,523 52,256 47.6 13.4 61.1 Medicaid . . . . . . . . . . . . . . . . . . . . . . . . . . . 6,321 1,620 *4,500 5.3 5.4 *5.3 HMO . . . . . . . . . . . . . . . . . . . . . . . . . . . . . 31,173 18,113 13,060 26.2 53.8 15.3 Othersources . . . . . . . . . . . . . . . . . . . . . . . 9,612 4,122 5,490 6.1 12.2 6.4
Female Allsourcesofpayment . . . . . . . . . . . . . . . . . . 87,745 10,464 77,2s0 100.0 100.0 100.0
Selforfamlly . . . . . . . . . . . . . . . . . . . . . . . . 11,549 1,693 9,855 13.2 16.2 12.8 Otherfamilymembers . . . . . . . . . . . . . . . . . . *407 *83 *323 *0.5 *0.6 *0.4 Medicare . . . . . . . . . . . . . . . . . . . . . . . . . . 49,011 977 48,034 55.9 9.3 62.2 Medicaid . . . . . . . . . . . . . . . . . . . . . . . . . . . 8,070 812 7,256 9.2 9.4 HMO . . . . . . . . . . . . . . . . . . . . . . . . . . . . . 15,900 6,077 9,823 18.1 2.; 12.7 Ofhersources . . . . . . . . . . . . . . . . . . . . . . . 2,807 821 *1,966 3.2 7.8 *2.6
Other ischemlc, old myocardial infarction
Both sexes: Allsourcesofpayment . . . . . . . . . . . . . . . . . . 210,426 31,750 178,676 100.0 100.0 100.0
Selforfamliy . . . . . . . . . . . . . . . . . . . . . . . . 26,172 3,745 24,428 13.4 11.8 13.7 Otherfamilymembers . . . . . . . . . . . . . . . . . . *2,353 *272 �2,0S1 *1.1 *0.9 *1.2 Medicare . . . . . . . . . . . . . . . . . . . . . . . . . . 112,511 5,816 106,696 53.5 16.3 59.7 Medicaid . . . . . . . . . . . . . . . . . . . . . . . . . . . 19,219 1,730 17,488 9.1 5.4 9.8 HMO . . . . . . . . . . . . . . . . . . . . . . . . . . . . . 32,527 15,774 16,754 15.5 49.7 9.4 Othersources . . . . . . . . . . . . . . . . . . . . . . . 15,644 4,414 11,230 7.4 13.9 6.3
Male: Allsourcesofpayment . . . . . . . . . . . . . . . . . . 102,007 24,669 77,339 100.0 100.0 100.0
Seiforfamliy . . . . . . . . . . . . . . . . . . . . . . . . 12,425 3,004 9,420 12.2 12.2 12.2 Otherfamliymembere . . . . . . . . . . . . . . . . . . *506 *250 *255 *0.5 *1.O *0.3 Medicare . . . . . . . . . . . . . . . . . . . . . . . . . . 62,696 3,431 49,267 51.7 13.9 63.7 Medicaid . . . . . . . . . . . . . . . . . . . . . . . . . . . 5,719 *1,052 *4,667 5,6 *4.3 *6.O HMO . . . . . . . . . . . . . . . . . . . . . . . . . . . . . 20,469 12,680 7,609 20.1 52.2 9.6 Othersources . . . . . . . . . . . . . . . . . . . . . . . 10,171 4,051 6,119 10.0 16.4 7.9
Female Allsourcesofpayment . . . . . . . . . . . . . . . . . . 108,419 7,082 101,337 100.0 ICMJ.O 100.0
Seiforfamlly . . . . . . . . . . . . . . . . . . . . . . . . 15,748 *741 15,007 14.5 *10.5 14.8 Otherfamiiymembers . . . . . . . . . . . . . . . . . . *I ,848 *22 *1 ,825 *1.7 *0.3 *1.8 Medicare . . . . . . . . . . . . . . . . . . . . . . . . . . 59,813 2,365 57,426 55.2 33.7 56.7 Medicaid . . . . . . . . . . . . . . . . . . . . . . . . . . . 13,500 678 12,622 12,5 9.6 12.7 HMO . . . . . . . . . . . . . . . . . . . . . . . . . . . . . 12,038 2,894 9,144 11.1 40.9 9.0 Othersources . . . . . . . . . . . . . . . . . . . . . . . 5,473 %362 5,111 5.0 *5. 1 5.0
f Irxhdes other csfegorles of Dlsesses of twsrt not shown In this teble.
NOTE Oregon n-at Irxiuded in the 19&S National Mortality Followback Survey. Numbers may not add to totels kuse of raundlng. HMO Is health maltienence orgsnlzatlon.

Advance Data 21
Table 11. Number and percent distribution of heart disease decedents by amount of own money spent for heaith care, according to age, sex, and selected forms of heart disease: United States, 1986
25-64 65 years 25-64 65 years~ Cause of death, sex, amount of own money spent All ages years and over All agas years and over
All forms of heart disease’ Number Percent distribution
Both sexe% Allamounts . . . . . . . . . . . . . . . . . . . . . . . . . 616,813 116,439 500,374 100.0 100.0 100.0 Lessthan $500, . . . . . . . . . . . . . . . . . . . . . . 271,814 61,041 210,774 44.1 52.4 42.1 $500-$999 . . . . . . . . . . . . . . . . . . . . . . . . . 94,963 19,167 75,797 15.4 16.5 15.1 $1,000-$1,999 . . . . . . . . . . . . . . . . . . . . . . . 72,352 13,549 58,803 11.7 11.6 11.8 $2,000-$4,999 . . . . . . . . . . . . . . . . . . . . . . . 91,018 14,801 76,217 14.8 12.7 15.2 $5,0000rmore, . . . . . . . . . . . . . . . . . . . . . . 86,665 7,881 76,784 14.1 6.8 15.7
Male: Allamounts . . . . . . . . . . . . . . . . . . . . . . . . . 316,984 83,336 235,848 100.0 100.0 100.0
Lessthan $500 . . . . . . . . . . . . . . . . . . . . . . . 146,293 45,447 100,846 45.9 54.5 42.8 $50C%$999 . . . . . . . . . . . . . . . . . . . . . . . . . 54,509 13,216 41,292 17.1 15.9 17.5 $1,000-$1,999 . . . . . . . . . . . . . . . . . . . . . . . 40,109 9,707 30,401 12.6 11.6 12.9 $2,000-$4,999 . . . . . . . . . . . . . . . . . . . . . . . 43,705 10,062 33,644 13.7 12.1 14.3 $5,0000rmore . . . . . . . . . . . . . . . . . . . . . . . 34,366 4,903 29,465 10.8 5.9 12.5
Female: Allamounts . . . . . . . . . . . . . . . . . . . . . . . . . 297,828 33,103 264,725 100.0 100.0 100.0
Less!han$500 . . . . . . . . . . . . . . . . . . . . . . . 125,521 15,594 109,927 42.1 47.1 41.5 $500-$999 . . . . . . . . . . . . . . . . . . . . . . . . . 40,455 5,950 34,504 13.6 18.0 13.0 $1,000-$1,999 . . . . . . . . . . . . . . . . . . . . . . . 32,243 3,641 28,402 10.8 11.6 10.7 $2,000-$4,999 . . . . . . . . . . . . . . . . . . . . . . . 47,313 4,740 42,573 15.9 14.3 16.1 $5,0000rmore . . . . . . . . . . . . . . . . . . . . . . . 52,297 2,978 49,319 17.6 9.0 16.6
Ischemic
Both sexes: Allamounls . . . . . . . . . . . . . . . . . . . . . . . . . 427,302 80,138 347,163 100.0 100.0 100.0
Lessthan$500 . . . . . . . . . . . . . . . . . . . . . . . 192,271 44,255 148,015 45.0 55.2 42.6 $500-$999 . . . . . . . . . . . . . . . . . . . . . . . . . 66,193 11,696 54,494 15.5 14.6 i 5.7 $1,000-$1,999 . . . . . . . . . . . . . . . . . . . . . . . 51,436 9,139 42,297 12.0 11.4 12.2 $2,000-$4,999, . . . . . . . . . . . . . . . . . . . . . . 58,871 9,591 49,280 13.8 12.0 14.2
J~OOOormorf3.. . . . . . . . . . . . . . . . . . . . . . 58,532 5,454 53,077 13.7 6,8 15.3
Allamounts . . . . . . . . . . . . . . . . . . . . . . . . . 229,203 80,604 168,599 Ico.o 100.0 100.0
Lessthan$500 . . . . . . . . . . . . . . . . . . . . . . . 106,945 34,656 74,289 47.5 57.2 44.1 $500-$999 38,794 8,658 30,136 16.9 14.3 17.9 $1,00W$1,999 :::::::::::::::::: ::::: 29,276 6,908 22,38a 12.8 11.4 13.3 $2,000-$4,999 . . . . . . . . . . . . . . . . . . . . . . . 28,388 6,775 21,591 12.4 11.2 12.8 $5,0000rmore . . . . . . . . . . . . . . . . . . . . . . . 23,822 3,806 20,216 10.4 6.0 12.0
Female: Allamounts. . . . . . . . . . . . . . . . . . . . . . . . . 198,099 19,534 178,565 100.0 100.0 100.0
Lc+ssthan$500 . . . . . . . . . . . . . . . . . . . . . . . 83,326 9,599 73,727 42.1 49.1 41.3 $500-$999 . . . . . . . . . . . . . . . . . . . . . . . . . 27,399 3,040 24,359 13.8 15.6 13.6 $1,00W$I,999 . . . . . . . . . . . . . . . . . . . . . . . 22,160 2,231 19,929 11.2 11.4 11.2 $2,000-$4,999 . . . . . . . . . . . . . . . . . . . . . . . 30,506 2,816 27,689 15.4 14.4 15.5 $5,0000rmore . . . . . . . . . . . . . . . . . . . . . . . 34,710 1,846 32,861 17.5 9.5 18.4
Acule myocardlal infarction
Both sexes Allamounk . . . . . . . . . . . . . . . . . . . . . . . . . 210,407 46,628 163,779 100.0 100.0
Lessthan$500 . . . . . . . . . . . . . . . . . . . . . . . 99,166 26,171 72,997 47.1 56.1 44.6 $500-$999 . . . . . . . . . . . . . . . . . . . . . . . . . 34,164 6,052 26,112 16,2 13.0 17.2 $1,000-$1,999 . . . . . . . . . . . . . . . . . . . . . . . 29,046 5,545 23,501 13.8 11.9 14.3 $2,000-$4,999 . . . . . . . . . . . . . . . . . . . . . . . 27,610 5,723 21,887 13.1 12.3 13.4
JEJOOOormore.. . . . . . . . . . . . . . . . . . . . . . 20,419 3,137 i 17,282 9.7 6.7 10.6
All:amounts . . . . . . . . . . . . . . . . . . . . . . . . . 122,575 35,344 87,230 100.0 100.0 100.0
Lessthan$500, . . . . . . . . . . . . . . . . . . . . . . 62,007 20,126 41,880 50.6 56.9 48.0 $500-$999 . . . . . . . . . . . . . . . . . . . . . . . . . 21,191 4,509 16,682 17.3 12.8 19.1 $1,000-$1)999 . . . . . . . . . . . . . . . . . . . . . . . 17,109 4,635 12,475 14.0 13.1 14.3 $2,000-$4,999 . . . . . . . . . . . . . . . . . . . . . . . 12,996 4,024 8,974 10.6 11.4 10.3 $5,0000rmore . . . . . . . . . . . . . . . . . . . . . . . 9,269 2,050 7,219 7.6 5.8 8.3
Female: Allamounts . . . . . . . . . . . . . . . . . . . . . . . . . 87,832 11,284 76,548 100.0 100.0 100.0
Lessthan$500 . . . . . . . . . . . . . . . . . . . . . . . 37,161 6,045 31,116 42.3 53.6 40.6 $500-$999 . . . . . . . . . . . . . . . . . . . . . . . . . 12,973 1,543 11,430 14.6 13.7 14.9
$1,000-$1,999 . . . . . . . . . . . . . . . . . . . . . . . 11,937 910 11,027 13.6 8.1 14.4
$2,000-$4,999. . . . . . . . . . . . . . . . . . . . . . . 14,612 1,700 12,912 16.6 15.1 16.9 $5,0000rmore. . . . . . . . . . . . . . . . . . . . . . . 11,150 *I ,087 10,063 12.7 �9.6 13.1
See foo!notes al end of table.

22 AdvanceData Table 11. Number and percent distribution of heart diseaae decedents by amount of own money spent for health care, according to age, sex, and selected forms of heart disease: United States, 1986-Con.
&use of death, sex 25-64 66 years 25-64 65 yeats end amount of own money spent All ages w and over All ages years and over
Other ischemlc, old myocardial Infarction Number Peroent distribution
Both sexes All amounts . . . . . . . . . . . . . . . . . . . . . . . . . 212,883 31,782 181,121 100.0 100.0 -i00.0
Lessthan $500 . . . . . . . . . . . . . . . . . . . . . . . 60,413 16,780 73,652 42.5 52.8 40.7 $500-$999 . . . . . . . . . . . . . . . . . . . . . . . . . 31,557 5,453 26,105 14.8 17.2 14.4 $1,000-$1,999 . . . . . . . . . . . . . . . . . . . . . . . 22,390 3,594 18,795 10.5 11.3 10.4
30,631 3,851 26,980 14.4 11.5$2,00G$4,999 . . . . . . . . . . . . . . . . . . . . . . . 14.9 $5,0000rmore . . . . . . . . . . . . . . . . . . . . . . . 37,893 2,305 35,588 17.8 7.3 19.8
Male All amounts . . . . . . . . . . . . . . . . . . . . . . . . . 103,474 23,660 79,785 Icm.o 100.0 100.0
Lessthan$500 . . . . . . . . . . . . . . . . . . . . . . . 44,802 13,287 31,515 43.3 56.1 $500-$999 . . . . . . . . . . . . . . . . . . . . . . . . . 17,216 4,040 13,176 16.6 17.1 $I,00C-$1,999 . . . . . . . . . . . . . . . . . . . . . . . 12,167 *2,274 9,893 11.8 *9.6 $2,00C$4,999 . . . . . . . . . . . . . . . . . . . . . . . 14,944 *2,534 12,410 14.4 *10.7 $5,0000rmore . . . . . . . . . . . . . . . . . . . . . . . 14,346 *I ,558 12,790 13.9 *6.6
Female Allamounts . . . . . . . . . . . . . . . . . . . . . . . . . 109,409 8,073 101,336 100.0 100.0 100.0
Lessth6n$500 . . . . . . . . . . . . . . . . . . . . . . . 45,611 3,474 42,i37 41.7 43.0 $500-$999 . . . . . . . . . . . . . . . . . . . . . . . . . 14,342 *1,413 12,928 13.1 *1 7.5
10,223 *1 ,320 8,602 9.3 *1 6.4$I,00G$I,999 . . . . . . . . . . . . . . . . . . . . . . . $2,00&$4,999 . . . . . . . . . . . . . . . . . . . . . . . $5,0000rmore . . . . . . . . . . . . . . . . . . . . . . .
15,686 *1,116 14,570 14.3 W 3.8 1:: 23,547 *749 22,798 21.5 *9.3
1,m~de~ ~t~r C~egOrIeS of Diseases of heart ~t SfWM in this table.
NOTE Oregon not lnduded in ths 1986 National Mortality FoIlowback Wvsy. Numbsrs may not add to totals bscause of rounding.
39.5 16.5 12.4 15.6 16.0
41.6 12.8
22.5

Advance Data 23
Table 12. Number and percent distribution of heart diseaae decedents by sex, according to age, type of assistance received, and aeiected forme of heart diaeaaw United States, 1986
25-64 66 years 25-64 65 years Cause of death, type of assistance melted, and sex All ages years and over All age-s years and over
All forms of heart disease’ Number Percent distributkm
Assistance received in activities of dally lMng: Bolhsexes . . . . . . . . . . . . . . . . . . . . . . . . . 214,009 23,436 190,574 100.0 100.0 100.0
Male . . . . . . . . . . . . . . . . . . . . . . . . . . . . . 93,968 13,052 80,916 43.9 55.7 42.5 Female . . . . . . . . . . . . . . . . . . . . . . . . . . . . 120,041 10,383 109,658 68.1 44.3 57.5
Medical help recelvech Bolh sexes . . . . . . . . . . . . . . . . . . . . . . . . . 235,945 29,536 206,409 100.0 100.0 100.0
Male . . . . . . . . . . . . . . . . . . . . . . . . . . . . . 115,513 17,s04 97,609 49.0 60.6 47.3 Female. . . . . . . . . . . . . . . . . . . . . . . . . . . . 120,432 11,632 108.800 51.0 39.4 52.7
Ischemlc
Assistance received [n activities of daily lMng: Bolhsexes . . . . . . . . . . . . . . . . . . . . . . . . . 140,409 12,883 127,526 100.0 100.0 100.0
Male . . . . . . . . . . . . . . . . . . . . . . . . . . . . . 63,994 7,649 56,344 45.6 59.4 44.2 Female . . . . . . . . . . . . . . . . . . . . . . . . . . . . 76,415 5,233 71,182 54.4 40.6 55,8
Medical help received: Both Sexes . . . . . . . . . . . . . . . . . . . . . . . . . 158,304 16,775 141,530 100.0 100.0 100.0
Male . . . . . . . . . . . . . . . . . . . . . . . . . . . . . 81,212 10,586 70,625 51.3 63.1 49.9 Female . . . . . . . . . . . . . . . . . . . . . . . . . . . . 77,092 6,187 70,905 48.7 36.9 50.1
Acute myocardlal Infarction
Assistance received In activities of daily Iiing: Bothsexes, , . . . . . . . . . . . . . . . . . . . . . . . 55,310 5,996 49,314 100.0 100.0 100.0
Male . . . . . . . . . . . . . . . . . . . . . . . . . . . . . 27,341 3,507 23,834 49.4 58.5 48.3 Female . . . . . . . . . . . . . . . . . . . . . . . . . . . . 27,970 2,469 25,481 50.6 41.5 51.7
Medical help received: Bothsexee . . . . . . . . . . . . . . . . . . . . . . . . . 64,619 7,677 56,942 100.0 Ilx).o 100.0
Male . . . . . . . . . . . . . . . . . . . . . . . . . . . . . 36,269 5,326 30.941 56.1 69.4 54.3 Female . . . . . . . . . . . . . . . . . . . . . . . . . . . . 28,3S3 2,349 43.9 30.6 45.7
Other Ischemlc, old myocardisl infarction
Assistance received in activities of dally lMng: Bolhsexes . . . . . . . . . . . . . . . . . . . . . . . . . 84,360 6,598 77,763 100.0 100.0 100.0
Male . . . . . . . . . . . . . . . . . . . . . . . . . . . . . 35,987 3,925 32,061 42.7 59.5 41.2 Female . . . . . . . . . . . . . . . . . . . . . . . . . . . . 46,374 2,672 45,701 57.3 40.5 56.6
Medical help received: Bolhsexes . . . . . . . . . . . . . . . . . . . . . . . . . 92,795 6,617 64,176 100.0 100.0 100.0
Male . . . . . . . . . . . . . . . . . . . . . . . . . . . . . 44,064 4,790 39,274 47.5 55.6 46.7 Female. . . . . . . . . . . . . . . . . . . . . . . . . . . . 48,731 3,e28 44,s04 52.5 44.4 53.3
1,nc,~d~~o~h~~ ~~egorles d Diseases of hwt ~t inch@d Inthistable.
NOTE Oregon not included In the 1986 National Mortality Followback Survey. Numbere may not add to totals besause of rounding.

24 Advance Data Table 13. Number and percent distribution of heart disease decedents by type of assistance received, according to age, sex, and selected forms of heart diaaaae: United States, 1986
Type of assistance received, sex, 25-64 65 years 25-64 65 years and cause of death All ages years and over All ages years and over
Ass[stance In activttles of daily living Number Percent distribution
All forms of heart disease:’ Both sexes—
All fypesof esskdance . . . . . . . . . . . . . . . 610,436 134,654 475,782 100.0 100.0 Ico.o Noaesiskncer eceived. . . . . . . . . . . . . . . . 39a,692 111,446 287,246 65.3 62.8 80.4 Family only . . . . . . . . . . . . . . . . . . . . . . . . 111,129 14,932 96,186 18.2 11.1 20.2 Nonrelattves only . . . . . . . . . . . . . . . . . . . . 21,665 1,567 20,098 3.5 1.2 4.2 Family and nonrelatives . . . . . . . . . . . . . . . . 78,9S) 6,708 72,242 12.9 5.0 15.2
Male— Alltypes of assistance . . . . . . . . . . . . . . . . . 343,651 98,344 245,308 100.0 100.0 100.0 Noassistance received . . . . . . . . . . . . . . . . 251,062 85,52I3 165,542 73.1 87.0 67.5 Famllyonly . . . . . . . . . . . . . . . . . . . . . . . . 55,381 8,948 46,413 16.1 9.1 18.9 Nonrelattves only . . . . . . . . . . . . . . . . . . . . 6,101 *606 5,494 1.6 *0.6 2.2 Family and nonrelative. . . . . . . . . . . . . . . . 31,127 3,270 27,857 9.1 3.3 11.4
Female— Alltypes ofessistance . . . . . . . . . . . . . . . . . 266,785 36,309 230,476 100.0 100.0 100.0 Nosesistance received . . . . . . . . . . . . . . . . 147,630 25,926 121,704 55.3 71.4 52.8 Famiiyonly . . . . . . . . . . . . . . . . . . . . . . . . 55,767 5,984 49,783 20.9 16.5 21.6 Nonrelatives only . . . . . . . . . . . . . . . . . . . . 15,564 *960 14,604 5.6 *2.6 6.3 Famliyand nonrelatives . . . . . . . . . . . . . . . . 47,823 3,436 44,385 17.9 9.5 19.3
. .
Ischemic Both sexes—
Alitypes of assistance . . . . . . . . . . . . . . . . . 424,514 91,899 332,615 100.0 100.0 100.0 Noaeslstance received . . . . . . . . . . . . . . . . 285,951 79,244 206,706 67.4 86.2 62.1 Famliyonly . . . . . . . . . . . . . . . . . . . . . . . . 73,406 a,506 64,900 17.3 9.3 19.5 NonrelaUvesonay. . . . . . . . . . . . . . . . . . . . 14,716 *386 14,330 3.5 *0.4 Family and nonrelatives. . . . . . . . . . . . . . . . 50,442 3,762 46,680 11.9 4.1 1::
Male– All fypesofsssistance . . . . . . . . . . . . . . . . . 246,650 70,612 207,837 100.0 100.0 100.0 Nossslstance received . . . . . . . . . . . . . . . . 183,615 63,390 120,224 74.4 89.5 57.6 Family only . . . . . . . . . . . . . . . . . . . . . . . . 36,631 5,239 33,392 15.7 7.4 18.1 Nonrelatives only . . . . . . . . . . . . . . . . . . . . *3,71 4 *157 *35,557 *1.5 *0.2 *17.1 Famllyand nonrelatives. . . . . . . . . . . . . . . . 20,6a9 18,665 8.4 2.9 9.0
Female– Alltypes of assistance . . . . . . . . . . . . . . . . . 177,865 21,087 158,777 100.0 100.0 100.0 Nosssistance received . . . . . . . . . . . . . . . . 102,336 15,854 86,482 57.5 75.2 55.2 Family only . . . . . . . . . . . . . . . . . . . . . . . . 34,774 3,267 31,508 19.6 15.5 20.1 Nonrelafiies only . . . . . . . . . . . . . . . . . . . . 11,001 *229 10,773 6.2 *1.1 6.9 Family and nonrelatives . . . . . . . . . . . . . . . . 29,753 1,738 28,015 16.7 a.2 17.9
Acute myocardlal Infarction: Both sexes—
All fypesofasslstance . . . . . . . . . . . . . . . . . 223,446 53,667 169,778 100.0 100.0 100.0 Noessis!ance received . . . . . . . . . . . . . . . . 169,106 47,900 121,206 75.7 89.3 71.4 Family only . . . . . . . . . . . . . . . . . . . . . . . . 32,039 4,136 27,901 14,3 7.7 16.4 Nonrelafiies only . . . . . . . . . . . . . . . . . . . . *3,849 *98 *3,753 *1.7 *0.2 *2.2 Family andnonreiatives . . . . . . . . . . . . . . . . 18,452 *1,534 16,918 8.3 *2.9 10.0
Male– All fypesofassistance . . . . . . . . . . . . . . . . . 135,928 41,142 94,786 100.0 100.0 100.0 Nosesistance received . . . . . . . . . . . . . . . . 109,350 37,863 71,487 80.4 92.0 75.4 Family only . . . . . . . . . . . . . . . . . . . . . . . . 17,349 2,405 14,944 12.8 5.8 15.8 Nonrelattves only . . . . . . . . . . . . . . . . . . . . �1,428 *85 *1 ,343 �1.1 *0.2 *1.4 Famiiyand nonrelatives . . . . . . . . . . . . . . . . 7,801 *789 7,011 5.7 *1.9 7.4
Female– All fypesofssslstance . . . . . . . . . . . . . . . . . 67,518 12,525 74,993 100.0 100.0 100.0 Noassistance received . . . . . . . . . . . . . . . . 59,756 10,036 49,719 68.3 60.1 66.3 Famllyonly . . . . . . . . . . . . . . . . . . . . . . . . 14,690 1,733 12,957 16.8 13.8 17.3 Nonrelafives only . . . . . . . . . . . . . . . . . . . . *2,421 *11 *2,41O *2,6 *o. 1 *3.2 Family and nonrelatives . . . . . . . . . . . . . . . . 10,652 *745 9,207 12.2 *5.9 13.2
Other ischemic, old myocardlal infarction: Bothsexes—
Alltypes ofasslstance . . . . . . . . . . . . . . . . . 195,915 36,571 159,344 100.0 100.0 Noassistance received . . . . . . . . . . . . . . . . 112,430 29,974 82,457 57.4 82,0 51.7 Family only. . . . . . . . . . . . . . . . . . . . . . . . 41,041 4,296 36,745 20.9 11.7 23.1 Nonrelafiies only . . . . . . . . . . . . . . . . . . . . 10,867 *290 10,577 *0.8 Famllyand nonrelatives. . . . . . . . . . . . . . . . 31,577 2,011 29,586 1:: 5,5 IE
Male– Alltypes ofassisIance . . . . . . . . . . . . . . . . . 106,981 26,176 78,805 100.0 100.0 100,0 Nosesistance received . . . . . . . . . . . . . . . . 71,190 24,251 46,940 66,5 66.1 59.6 Famllyonly . . . . . . . . . . . . . . . . . . . . . . . . 21,029 2,835 18,194 19.7 10.1 23.1 Nonrelativesonly . . . . . . . . . . . . . . . . . . . . *2,286 *72 *2,214 *2.1 *0.3 *2.8 Famiiyand nonrelattves. . . . . . . . . . . . . . . . 12,478 *1,016 11,458 11.7 *3.6 14.5
Female— Alltypesofaesistance . . . . . . . . . . . . . . . . . 88,934 8,395 80,539 100.0 100.0 100.0 Noassistancereceived . . . . . . . . . . . . . . . . 41,240 5,723 35,517 46.4 68.2 44.1 Familyonly . . . . . . . . . . . . . . . . . . . . . . . . 20,013 1,462 la,551 22.5 17.4 23.0 Nonrelafiiesonly . . . . . . . . . . . . . . . . . . . . 8,580 *2 I 8 8,362 *9.6 2.6 10.4 Familyand nonrelatives. . . . . . . . . . . . . . . . 19,101 *993 Ia,loa *21 .5 11.8 22,5
See footnoles at 6nd of table,

Advance Data 25 Table 13. Number and percent distribution of heart disease decedents by type of assistance received, according to age, sex, and selected forms of heart disease: United States, 1986—Con.
Type otassktance received, sex, 25-64 65 years 25-64 65 years and cause of death Al\ agas years and over All ages years and over
Help in medical care Numbsr Percent distribution
All forms of heart disease:’ Both sexes-
Alllypes ofasslstance . . . . . . . . . . . . . . . . . 608,841 134,209 474,630 100.0 100.0 100.0 Noasslstance received . . . . . . . . . . . . . . . . 375,179 104,760 270,416 61.6 78.1 57.0 Famllyonly . . . . . . . . . . . . . . . . . . . . . . . . 130,048 19,787 110,261 21.4 14.7 23.2 Nonrelatlves only . . . . . . . . . . . . . . . . . . . . 24,575 2,442 22,133 4.0 1.8 4.7 Family and nonrelatlves. . . . . . . . . . . . . . . . 79,038 7,220 71,819 13.0 5.4 15.1
Male-Alltypes ofasslstance . . . . . . . . . . . . . . . . . 343,626 97,839 245,786 100.0 100.0 100.0 Noeesls!ance received . . . . . . . . . . . . . . . . 229,157 80,023 149,134 88.7 81.8 80.7 Famllyonly . . . . . . . . . . . . . . . . . . . . . . . . 73,337 12,420 60,916 21.3 12.7 24.8 Nonrelatlves only . . . . . . . . . . . . . . . . . . . . 7,61e *1 ,618 6,000 2.2 *1.7 2.4 Family and nonrelallves. . . . . . . . . . . . . . . . 33,514 3,778 29,738 9.6 3.9 12.1
Female-Alltypesof assistance . . . . . . . . . . . . . . . . . 265,215 36,370 228,844 100.0 100.0 100.0 Noasslstance received . . . . . . . . . . . . . . . . 146,022 24,738 121,284 55.1 68.0 53.0 Famllyonly . . . . . . . . . . . . . . . . . . . . . . . . 56,711 7,366 49,345 21.4 20.3 21.6 Nonrelatives only . . . . . . . . . . . . . . . . . . . . 16,957 *824 16,133 6.4 *2.3 7.0 Famllyand nonrelatives. . . . . . . . . . . . . . . . 45,524 3,442 42,062 17.2 9.5 18.4
Ischemlc: Both sexes-
Ailtypes ofasslstance . . . . . . . . . . . . . . . . . 423,486 91,227 332,259 100.0 100.0 100.0 Noasslstance received . . . . . . . . . . . . . . . . 266,766 74,540 192,228 63.0 81.7 57.9 Family only . . . . . . . . . . . . . . . . . . . . . . . . 88,955 11,423 77,532 21.0 12.5 23.3 Nonrelallves only . . . . . . . . . . . . . . . . . . . . 16,207 *I,1OI 15,105 3.8 *1.2 4.5 Famllyand nonrelatives. . . . . . . . . . . . . . . . 51,557 4,163 47,394 12.2 4.6 14.3
Male-Alltypes ofasslstance . . . . . . . . . . . . . . . . . 246,9e7 70,079 176,90e 100.0 100.0 100.0 Noassistance received . . . . . . . . . . . . . . . . 166,122 59,579 106,543 67.3 85.0 60.2 Family only . . . . . . . . . . . . . . . . . . . . . . . . 53,390 7,335 46,054 21.6 10.5 26.0 Nonrelatives only . . . . . . . . . . . . . . . . . . . . 4,679 ’789 *3,890 1.9 *1.1 *2.2 Family and nonrelatives. . . . . . . . . . . . . . . . 22,797 2,376 20,421 9.2 3.4 11.5
Female-Alltypes of assistance . . . . . . . . . . . . . . . . . 176,499 21,148 155,351 100.0 100.0 100.0 Noasslstance received . . . . . . . . . . . . . . . . 100,646 14,961 85,665 57.0 70.7 55.2 Fam[lyonly . . . . . . . . . . . . . . . . . . . . . . . . 35,565 4,068 31,477 20.2 19.3 20.3 Nonrelatives only. . . . . . . . . . . . . . . . . . . . 11,527 *312 11,215 6.5 *1.5 7.2 Family and nonrelatives. . . . . . . . . . . . . . . . 28,760 1,787 26,973 16.3 e.5 17.4
Acute myocardiel infarction: Both sexes-
All types of assistance 53,467 169,884 100.0 100.0 100.0 Noasslstance received . . . . . . . . . . . . . . . . 158,775 45,790 112,985 71.1 85.6 66.5 Famllyonly . . . . . . . . . . . . . . . . . . . . . . . . 40,853 5,305 35,548 18.3 9.9 20.9 Nonrelatives only . . . . . . . . . . . . . . . . . . . . 4,892 *7I 8 *4,174 2.2 *1.3 *2.5 Family andnonrelatlves. . . . . . . . . . . . . . . . 18,811 *1 ,654 17,157 8.4 *3.1 10.1
Male-Alltypes ofasslstance . . . . . . . . . . . . . . . . . 136,044 40,954 95,090 100.0 100.0 100.0 Noasslstance received . . . . . . . . . . . . . . . . 99,638 35,626 64,212 73.4 87.0 67.5 Family only . . . . . . . . . . . . . . . . . . . . . . . . 25,206 3,577 21.630 18.5 8.7 22.7 Nonrelatlves only . . . . . . . . . . . . . . . . . . . . *2,116 �636 �1.6 *1.6 *1.6 Famllyand nonrelatives. . . . . . . . . . . . . . . . e,883 *1,116 7;767 6.5 *2.7 8.2
Female-Alltypesof assistance . . . . . . . . . . . . . . . . . 87,287 12,513 74,774 100.0 100.0 100.0 Noasslstance received . . . . . . . . . . . . . . . . 56,937 10,164 48,773 67.5 81.2 65.2 Famllyonly . . . . . . . . . . . . . . . . . . . . . . . . 15,647 1,728 13,919 17.9 13.8 18.6 Nonrelatives only . . . . . . . . . . . . . . . . . . . . *2,775 *82 *2,693 �3.2 *0.7 ‘3.6 Family and nonrelatives. . . . . . . . . . . . . . . . 9,928 *538 9,390 11.4 �4.3 12.6
Olhcr Ischemlc, old myocardlal infarction: Both sexes-
Alltypes ofasslstance . . . . . . . . . . . . . . . . . 195,003 36,100 156,903 100.0 100.0 100.0 Noasslstance received . . . . . . . . . . . . . . . . 103,730 27,570 76,160 53.2 76.4 47.9 Family only . . . . . . . . . . . . . . . . . . . . . . . . 47,637 5,867 41,770 24.4 16.3 26.3 Nonrelatlves only . . . . . . . . . . . . . . . . . . . . 11,315 *3e3 10,932 5.6 *1.1 6.9 Famllyand nonrelatives. . . . . . . . . . . . . . . . 32,321 2,279 30,041 16.6 6.3 16.9
Male-Alllypes of assistance. . . . . . . . . . . . . . . . . 107,203 27,631 79,572 100.0 100.0 100.0 Noasslstance received . . . . . . . . . . . . . . . . 63,422 22,92e 40,493 59.2 a3.o !33.9 Familyonly . . . . . . . . . . . . . . . . . . . . . . . . 27,730 3,519 24,211 25.9 12.7 30.4 Nonrelativesonly . . . . . . . . . . . . . . . . . . . . *2,563 *153 *2,41 O *2.4 �0.6 �3.O Familyand nonrelallves. . . . . . . . . . . . . . . . 73,466 *1 ,030 12,458 12.6 �3.7 15.7
Alltypesofasslstance . . . . . . . . . . . . . . . . . 87,800 8,469 79,331 100.0 100.0 100.0 Noassistancereceived . . . . . . . . . . . . . . . . 40,306 4,641 35,6e7 45.9 54.8 45.0
Female-
Familyonly . . . . . . . . . . . . . . . . . . . . . . . . 19,907 2,348 17,559 22.7 27.7 22.1 Nonrelatlvesonly . . . . . . . . . . . . . . . . . . . . 8,752 *2343 8,522 10.0 �2.7 10.7
Famllyand nonrelatlves. . . . . . . . . . . . . . . . 18,833 *1,249 17,583 21.4 *1 4.8 22.2
1jnc~de~ o!her categories of Diseases of heart not shown in this table.
NOTE Oregon rat includedin the 1986 National Mortality Followback Survey. Numbers may not add to totals because of rcunding.

26 Advance Data
Table 14. Number and percent of heart disease decedents with other serious health problems, by age, other health problem, and selected forms of heart disease: United States, 1986
25-64 65 yaets 25-64 65 years Cause of death, other health problem, and sex All agee years and over .41 ages years and over
All forms of heart disease’ Number Percent
High blood pressure Bothsexes . . . . . . . . . . . . . . . . . . . . . . . . . 389,128 77,402 311,726 64.3 56.6 53.8
Male . . . . . . . . . . . . . . . . . . . . . . . . . . . . . 188,040 55,348 132,693 50.6 55.7 48.8 Female . . . . . . . . . . . . . . . . . . . . . . . . . . . . 201,088 22,054 179,033 58.3 59.0 58.3
Stroke: Both sexes . . . . . . . . . . . . . . . . . . . . . . . . . 198,520 22,630 175,9eo 27.2 16.4 29.7
Male . . . . . . . . . . . . . . . . . . . . . . . . . . . . . 90,924 14,804 76,120 24.0 14.8 27.3 Female . . . . . . . . . . . . . . . . . . . . . . . . . . . . 107,596 7,727 99,870 30.5 20.5 31.7
Angina Bothsexes . . . . . . . . . . . . . . . . . . . . . . . . . 156,997 29,656 127,341 23.0 23.0 23.1
Male . . . . . . . . . . . . . . . . . . . . . . . . . . . . . 83,436 23,337 60,0W 23.6 24.8 23.2 Female . . . . . . . . . . . . . . . . . . . . . . . . . . . . 73,580 6,316 67,242 22.4 16.0 22.9
DlabeteS Bothsexes . . . . . . . . . . . . . . . . . . . . . . . . . 156,160 31,474 124,666 21.1 22,6 20.8
Male . . . . . . . . . . . . . . . . . . . . . . . . . . . . . 74,019 19,975 64,043 19.4 19.7 19.3 Female . . . . . . . . . . . . . . . . . . . . . . . . . . . . 82,141 11,498 70,642 22.9 30.5 22.1
Cancec Bothsexes . . . . . . . . . . . . . . . . . . . . . . . . . 53,455 5,758 47,697 7.6 4.5 8.6
Male . . . . . . . . . . . . . . . . . . . . . . . . . . . . . 23,850 3,690 20,160 6.8 3.9 7.9 Female . . . . . . . . . . . . . . . . . . . . . . . . . . . . 29,605 2;06a 27,637 8.8 6.0 9.2
Asthma Bothsexes . . . . . . . . . . . . . . . . . . . . . . . . . 44,220 10,442 33,778 6.0 7.5 5.7
Male . . . . . . . . . . . . . . . . . . . . . . . . . . . . . 21,793 5,565 16,227 5.7 5.8 Female . . . . . . . . . . . . . . . . . . . . . . . . . . . . 22,427 4,876 17,551 6.3 l% 5.5
Other lung conditions Bothsexes . . . . . . . . . . . . . . . . . . . . . . . . . 121,538 22,302 99,237 16.6 16.3 16.7
Male . . . . . . . . . . . . . . . . . . . . . . . . . . . . . 77,953 15,984 61,970 20.6 16.0 22.2 Female . . . . . . . . . . . . . . . . . . . . . . . . . . . . 43,585 6,318 37,267 12.3 17.0 11.8
Ischemio
High blood pressure Bolhsexes . . . . . . . . . . . . . . . . . . . . . . . . . 271,290 53,61Y3 217,690 54.9 57.5 54.2
Male . . . . . . . . . . . . . . . . . . . . . . . . . . . . . 137,123 40,646 96,477 51.5 58.8 49.6 Female . . . . . . . . . . . . . . . . . . . . . . . . . . . . 134,168 12,955 121,213 58.8 60.0 58.7
Stroke: Bothsexes . . . . . . . . . . . . . . . . . . . . . . . . . 127,369 13,803 113,566 25.2 14.7 27.6
Male . . . . . . . . . . . . . . . . . . . . . . . . . . . . . 61,100 9,734 51,366 22.5 13.5 25.8 Female . . . . . . . . . . . . . . . . . . . . . . . . . . . . 66,269 4,059 62,200 28.4 18.6 29.4
Angina Bothsexes . . . . . . . . . . . . . . . . . . . . . . . . . 123,788 100,113 26.4 26.4 26.5
Male . . . . . . . . . . . . . . . . . . . . . . . . . . . . . 65,641 19,393 46,248 26.2 26.1 25.4 Female . . . . . . . . . . . . . . . . . . . . . . . . . . . . 68,147 4,282 53,865 26.8 20.6 27.4
Diabetes: Bothsexes . . . . . . . . . . . . . . . . . . . . . . . . . 115,478 21,628 93,651 22.5 22.6 22.5
Male . . . . . . . . . . . . . . . . . . . . . . . . . . . . . 56,008 14,231 41,777 20.4 19.3 20,6 Female . . . . . . . . . . . . . . . . . . . . . . . . . . . . 59,470 7,397 52,073 25.0 33.7 24.1
Cancec Bothsexes . . . . . . . . . . . . . . . . . . . . . . . . . 36,705 3,609 33,096 7.7 4.0 8.6
Male . . . . . . . . . . . . . . . . . . . . . . . . . . . . . 16,444 *2,31 1 14,133 6.5 *3,4 7.7 Female . . . . . . . . . . . . . . . . . . . . . . . . . . . . 20,262 1,298 18,963 9.1 6.2 9.4
Asthma Bothsexes . . . . . . . . . . . . . . . . . . . . . . . . . 29,255 5,956 23,300 5.8 5.6
Male . . . . . . . . . . . . . . . . . . . . . . . . . . . . . 14,893 3,307 11,366 5.4 5.7 Female . . . . . . . . . . . . . . . . . . . . . . . . . . . . 2,649 11,913 6.2 5.6
Other lung conditions Bothsexes . . . . . . . . . . . . . . . . . . . . . . . . . 79,911 13,401 66,510 15.8 14.3 16.1
Male . . . . . . . . . . . . . . . . . . . . . . . . . . . . . 50,922 9,784 41,KW 18.8 13.5 20.6 Female . . . . . . . . . . . . . . . . . . . . . . . . . . . . 28,989 3,617 25,372 12.4 16.9 11.9
Acute myocardial Infarction
High blood pressure Bothsexes . . . . . . . . . . . . . . . . . . . . . . . . . 137,803 31,019 106,784 56.6 57.9 56,3
Male . . . . . . . . . . . . . . . . . . . . . . . . . . . . . 74,103 22,940 51,163 52.2 56.3 50.5 Female . . . . . . . . . . . . . . . . . . . . . . . . . . . . 63,700 8,080 55,621 62.8 63.0 62.6
Stroke Bothsexes . . . . . . . . . . . . . . . . . . . . . . . . . 57,054 8,360 48,674 23.0 15.6 25.1
Male . . . . . . . . . . . . . . . . . . . . . . . . . . . . . 30,093 5,800 24,293 20.9 14.1 23.6 Female . . . . . . . . . . . . . . . . . . . . . . . . . . . . 26,961 2,580 24,381 25.9 20.1 26.8
See footnotes at end of table.

Advance Data 27
Table 14. Number and percent of heart disease decedents with other serious health problems, by age, other health problem, and selected forma of heart disease: United States, 1986-Con.
Cause of death, other health problem, and sex
Acute myocardlal irrfarcUon–Con. Angina
Bothsexes . . . . . . . . . . . . . . . . . . . . . . . . .
Male, . . . . . . . . . . . . . . . . . . . . . . . . . . . . Female. . . . . . . . . . . . . . . . . . . . . . . . . . . .
Diabetes: Bothsexes . . . . . . . . . . . . . . . . . . . . . . . . .
Male . . . . . . . . . . . . . . . . . . . . . . . . . . . . . Female . . . . . . . . . . . . . . . . . . . . . . . . . . . .
Cancec Bolhsexes . . . . . . . . . . . . . . . . . . . . . . . . .
Male . . . . . . . . . . . . . . . . . . . . . . . . . . . . . Female . . . . . . . . . . . . . . . . . . . . . . . . . . . .
Asthma Bothsexes . . . . . . . . . . . . . . . . . . . . . . . . .
Male, . . . . . . . . . . . . . . . . . . . . . . . . . . . . Female . . . . . . . . . . . . . . . . . . . . . . . . . . . .
Olher lung conditions Bothsexes . . . . . . . . . . . . . . . . . . . . . . . . .
Male . . . . . . . . . . . . . . . . . . . . . . . . . . . . . Female . . . . . . . . . . . . . . . . . . . . . . . . . . . .
Other ischemlc, old myocardiei infarction
H[gh blood pressure Bothsexes . . . . . . . . . . . . . . . . . . . . . . . . .
Male . . . . . . . . . . . . . . . . . . . . . . . . . . . . . Female . . . . . . . . . . . . . . . . . . . . . . . . . . . .
Stroke Bolhsexes . . . . . . . . . . . . . . . . . . . . . . . . .
Male . . . . . . . . . . . . . . . . . . . . . . . . . . . . . Female . . . . . . . . . . . . . . . . . . . . . . . . . . . .
Angina Bolhsexes . . . . . . . . . . . . . . . . . . . . . . . . .
Male . . . . . . . . . . . . . . . . . . . . . . . . . . . . . Female . . . . . . . . . . . . . . . . . . . . . . . . . . . .
Diabetes Bothsexes . . . . . . . . . . . . . . . . . . . . . . . . .
Male . . . . . . . . . . . . . . . . . . . . . . . . . . . . . Female . . . . . . . . . . . . . . . . . . . . . . . . . . . .
Cancer Bolhsexes . . . . . . . . . . . . . . . . . . . . . . . . .
Male, . . . . . . . . . . . . . . . . . . . . . . . . . . . . Female . . . . . . . . . . . . . . . . . . . . . . . . . . . .
Asthma Bothsexes . . . . . . . . . . . . . . . . . . . . . . . . .
Male, . . . . . . . . . . . . . . . . . . . . . . . . . . . . Female. . . . . . . . . . . . . . . . . . . . . . . . . . . .
Other lung conditions Bothsexes . . . . . . . . . . . . . . . . . . . . . . . . .
Male . . . . . . . . . . . . . . . . . . . . . . . . . . . . . Female . . . . . . . . . . . . . . . . . . . . . . . . . . . .
25-64 65 yams 25-64 65 years All agas years and over All ages yearn and over
Percent
62,692 12,544 50,148 27.4 24.9 28.1
36,037 10,413 25,624 27.5 27.3 27.7 26,655 2,131 24,524 27.2 17.6 28.6
62,365 12,266 50,119 24.8 22.6 25.5
32,126 8,420 23,705 22.2 20.3 22.9 30,260 3,84e 26,414 28.6 29.9 28.4
16,950 2,041 14,eo9 7.2 4.0 e.i
7,303 *1 ,299 8,004 5.5 *3.4 6.3 9,647 *742 8,905 9.5 �6. 1 10.0
12,348 3,5e6 8,782 4.e 6.6 4.5
7,065 1,910 *5, 155 4.9 4.7 *5.O 5,283 1,656 *3,627 5.0 12.9 *3.9
35,965 6,964 14.5 13.1 14.9
24,584 4,610 19.974 17.1 11.4 19.4 11,380 2,354 10.8 18.6 9.e
131,449 21,899 109,551 53.4 57.5 52.7
61,654 17,072 44,562 51.1 57.8 49.0 69,795 4,826 64,969 55.7 58.4 55.6
69,362 4,976 64,3116 27.5 12.9 30.2
30,111 3,487 26,624 24.4 11.8 28.3 39,251 i ,4e9 37,761 30.6 16.9 31.7
59,731 10,879 48,852 25.5 28.9 24.8
28,655 8,728 19,926 24.6 29.9 22.9 31,076 2,151 28,e26 26.3 25.5 26.4
52,770 9,304 43,466 20.6 23.5 20.1
23,849 5,776 16,072 19.0 18.9 19.1 28,922 3,528 25,394 22.2 39.7 20.9
19,277 *I ,566 17,709 8.2 *4.2 8.9
6,870 *1,012 7,859 7.7 *3.6 9.1 10,407 *556 9,850 8.6 *6.5 8.8
16,823 2,305 14,518 6.7 5.9 6.8
7,617 *1,385 6,231 6.2 *4.6 6.6 9,208 919 8,286 7.2 10.6 6.9
43,026 5,931 37,095 17.1 15.3 17.4
25,697 4,740 20,957 20.7 15.7 22.3 17,329 1,191 16,136 13.6 13.8 13.5
1lm~de~ ~lhr Cdegoriesof Diseasesof hearl notshownh thistable.
NOTE Oregon not Irxluded In the 19e6 National MortalityFollowbackSurvey.Numbersmay notadd to totalsbecauseof rourdhg.

28 AdvanceData Table 1!%Number and percent distribution of heart disease decedents by relative reported to have had heart attack, according to sex and seiected forms of heart disease: United States, 1986
Both Both Cause of death and relative sexes Male Female sexes Male Female
All forms of heart disease’ Number Percentdielribulion
All relatives . . . . . . . . . . . . . . . . . . . . . . . . . . . 568,399 303,742 264,657 100.0 100.0 100.0
Norelathfes . . . . . . . . . . . . . . . . . . . . . . . . . . 223,430 115,436 107,994 39.3 36.0 40.8 Mother only . . . . . . . . . . . . . . . . . . . . . . . . . . 36,808 22,397 14,411 6.5 7.4 5.5 Father only . . . . . . . . . . . . . . . . . . . . . . . . . . . 57,044 36,831 20,213 10.0 12.1 7.6 Sister only . . . . . . . . . . . . . . . . . . . . . . . . . . . 35,490 14,474 21,016 6.2 4.8 Brotheronly . . . . . . . . . . . . . . . . . . . . . . . . . . 88,246 47,985 40,261 15.5 15.8 1;: Bothparentsonly . . . . . . . . . . . . . . . . . . . . . . 11,913 7,630 4,063 2.1 2.5 1.5 Brotherandslsteronly . . . . . . . . . . . . . . . . . . . 21,131 10,160 10,951 3.7 3.4 4.1 Parent(s) andsibling(s) . . . . . . . . . . . . . . . . . . . 94,337 48,610 45,728 16.6 16.0 17.3
Ischemlc
Allrelafiies . . . . . . . . . . . . . . . . . . . . . . . . . . . 397,603 221,557 176,047 100.0 100.0 100.0
Norelatives . . . . . . . . . . . . . . . . . . . . . . . . . . 150,188 80,755 69,433 37.6 36.5 39.4 Motheronly . . . . . . . . . . . . . . . . . . . . . . . . . . 25,802 17,153 8,649 6.5 7.7 4.9 Fatheronly . . . . . . . . . . . . . . . . . . . . . . . . . . . 39,268 26,595 12,674 9.9 12.0 7.2 Sisteronly . . . . . . . . . . . . . . . . . . . . . . . . . . . 24,046 10,030 14,016 6.1 Brotheronly . . . . . . . . . . . . . . . . . . . . . . . . . . 64,778 37,682 27,096 16.3 1% 1:: Bothparentsonly . . . . . . . . . . . . . . . . . . . . . . 7,067 4,626 2,441 1.8 2.1 1.4 Brotherandsisteronly . . . . . . . . . . . . . . . . . . . 15,175 7,445 7,731 3.8 3.4 4.4 Parent(s) andslbling(s) . . . . . . . . . . . . . . . . . . . 71,278 37,271 34,007 17.9 16.8 19.3
Acute myocardkd infarction
All relatives . . . . . . . . . . . . . . . . . . . . . . . . . . . 202,036 120,244 81,794 100.0 100.0 100.0
Norelatives . . . . . . . . . . . . . . . . . . . . . . . . . . 74,077 45,168 28,910 36.7 37.6 35.3 Motheronly . . . . . . . . . . . . . . . . . . . . . . . . . . 11,982 8,646 3,335 5.9 7.2 4. i Fatheronly . . . . . . . . . . . . . . . . . . . . . . . . . . . 21,542 15,103 6,433 10.7 12.6 7.9 SIsteronly . . . . . . . . . . . . . . . . . . . . . . . . . . . 13,091 5,446 7,645 4.5 9.4 Brotheronly . . . . . . . . . . . . . . . . . . . . . . . . . . 32,141 19,509 12,632 1Y9 16.2 15.4 Bothparentsonly . . . . . . . . . . . . . . . . . . . . . . 4,454 3,150 *1,304 2.2 2.6 *1.6 Brotherandslsteronly . . . . . . . . . . . . . . . . . . . 7,337 *3,519 *3,81 8 *2.9 *4.7 Parent(s) andsibling(s) . . . . . . . . . . . . . . . . . . . 37,414 19,702 17,712 1:: 16.4 21.7
Other Ischemic, old myocardlal Infarction
Allrelatives . . . . . . . . . . . . . . . . . . . . . . . . . . . 191,618 98,569 93,060 100.0 100.0 100.0
Norelatives . . . . . . . . . . . . . . . . . . . . . . . . . . 75,317 35,047 40,270 39.3 35.6 43.3 Motheronly . . . . . . . . . . . . . . . . . . . . . . . . . . 13,525 8,211 5,314 7.1 8.3 5.7 Fatheronly . . . . . . . . . . . . . . . . . . . . . . . . . . . 17,255 11,240 6,015 9.0 11.4 6.5 SIsteronly . . . . . . . . . . . . . . . . . . . . . . . . . . . 10,760 *4,389 6,371 5.6 *4. 5 6.9 Brotheronly . . . . . . . . . . . . . . . . . . . . . . . . . . 31,328 17,133 14,196 16.4 17.4 15.3 Both parentsonly . . . . . . . . . . . . . . . . . . . . . . 2,614 *1,476 *1,136 1.4 *1.5 *1.2 Brotherandsisteronly . . . . . . . . . . . . . . . . . . . 7,836 *3,925 *3,913 *4.O *4.2 Parent(s) andslbling(s) . . . . . . . . . . . . . . . . . . . 32,982 17,139 15,643 1% 17.4 17.0
1Includes other categories of Oiseeses of heart net shown h the table.
NOTE Oregon not Iniuded In the 19Se Natlonsl Mortality Followback Sutvey. Numbers may not add to totsls beoeuse of rcundl~.

Advance Data 29
Technical notes
Sources of data and sample design
The NMFS sample was selected from the Current Mortality Sample (CMS). This is a systematic 10-percent sample of all deaths in the Nation, received each month by the 50 States, the District of Columbia, and the independent registration area of New York City and transmitted to the National Center for Health Statistics (10), Oregon was not included in the 19S6 NFMS because of respondent consent requirements. Thus, these data are representative of deaths in the United States excluding Oregon. Oregon accounts for 1.1 percent of all deaths in the United Statex There is little variation in this percent by age among Oregon deaths.
Oversampling by race and age was done to permit the study of race differentials in mortality and the char-act cristics of persons who die at a younger age. Approximately 2,500 dcuth certificates were selected with cwtainty. These included all women in the CMS 25-54 years of age and all mm 35–64 years of age who died from ischemic heart disease, all deaths from asthma, rare cancer deaths, and all deaths of American Indians, Akwts, and Eskimos. In addition, deaths for persons under 55 years of agc were oversampled 3.1 times and deaths for black persons were over-sampled 2.9 times. Death certificates in the CMS that were eligible for the 19S6 NMFS were sequentially assigned to one of 18 sampling strata. The strata formation was based on the thwdent’s age, sex, race, and cause of death, For the 1986 NMFS, questionnaires were mailed by the U.S. Bureau of the Census about 6 months after thu death to the next-of-kin or person list cd on the death certificate as providing the personal information on the decedent’s death certificate. A reminder letter was mailed 10 days after the first mailing, followed by a second mailing 1 month after the first mailing, Telephone or personal visits wore made by Census interviewers to nonrespondents 1 month after the second mailing.
Eighty-two percent of the respondents who completed the NMFS questionnaire were a close relative— either the spouse, parent, sibling, or adult child—of the decedent. Only 6 percent of the respondents were nonrelatives. The response rate was 89 percent, yielding 16,598 completed questionnaires.
Information on age, race, sex, underlying and multiple cause-of-death data for each decedent was obtained from the Mortality Vital Statistics Multiple Cause-of-Death Statistical File compiled by NCHS. Multiple cause-of-deati data provide information on diseases that are a factor in death whether or not they are the underlying cause of death (11). Records from the 1986 multiple cause-of-death file were matched to the data from the NMFS informant questionnaire for each decedent in the survey. The overall match rate was 99.9 percent.
Comparisons of numbers of deaths from the vital statistics registration system and the 1986 NMFS suggest that the counts of deaths are similar. For example, the NMFS weighted data for heart disease deaths yield a total of 759,431 d&ths, compared with 765,490 for the vital statistics system file. Although the final weights applied to the NMFS adjust for differential sampling by race, sex, and age, no adjustment was made for cause of death. Hence, NMFS counts of death by cause will not necessarily equal counts obtained from the vital statistics file.
Estimation procedures
Probability sampling allows the NMFS data to be weighted to produce national estimates for the United States except for Oregon. It also allows approximation of the sampling. error.
The NMFS sampling weights are prepared by a poststratified ratio estimation procedure. The sampling weight for each sample decedent is based on a product of the following three component weights.
1, Probability of selection. The basic weight for each sample decedent is the reciprocal of its probability of sample selection.
2. Adjustment for nonresponse. In an attempt to reduce nonresponse bias, the NMFS sampling weights are adjusted for nonresponse (with the exception of Oregon). This adjustment was implemented within subsets of the sampling strata and was the reciprocal of the response rate within the subset. This adjustment reduces nonresponse bias to the extent that data for a nonrespondent are similar to data for respondents in these adjustment classes. No adjustment was made for the exclusion of Oregon from the survey.
3. Poststratification by age, sex, and race. Within 18 postst;ata defined by decedent age, sex, and race (see table I), the NMFS estimates were ratio adjusted to counts for the number of deaths reported to the National Vital Registration System for the United States, excluding Oregon. This adjustment makes the sample more representative of the target population by age, sex, and race.
Sampling errors and rounding of percents
Because the statistics presented in this report are based on a sample, they may differ from figures that would have been obtained if a complete census of all death certificates for decedents aged 25 and over had been taken using the same questionnaire, instructions, and procedures. The standard error of an estimate is primarily a measure of the variability that occurs when only a sample of population, rather than the total population, is surveyed, The standard error also reflects part of the measurement error, but it does not measure any systematic biases in the data. The chances are about 95 in 100 that an estimate from the sample differs from the value that would be obtained from

30 Advance Data Table L Parameters used to approximate the relative standard errors for estimates based on the 1986 National Mortality Followback Survey, by domain of study
Domain of study
Alldecedents . . . . . . . . . . . . . . . . . . . . . . .
Decedents 26-34 yeare of age. . . . . . . . . . . . Decedents 36-54 years of age. . . . . . . . . . . . Decedents 55-69 years of age. . . . . . . . . . . . Decedents 70-64 yeare of age. . . . . . . . . . . . Decedents 85 years of age and over . . . . . . . .
All black decederde . . . . . . . . . . . . . . . . . . .
Black decedents 26-34 years of age . . . . . . . . Black decedents 35-54 years of age . . . . . . . . Black decedents 5%69 yeare of age . . . . . . . . Black decedents 70-84 yeare of age . . . . . . . . Black decedents 85 yeare of age and over. . . . .
Allotherdecedents . . . . . . . . . . . . . . . . . . .
Other decedents 25-34 yeare of age . . . . . . . . Other decedents 35-54 yeare of age . . . . . . . . Other decedents 56-69 yeare of age . . . . . . . . Other decedents 70-64 years of age . . . . . . . . Other decedents 85 yeare of age and over . . . .
a complete census by less than twice the standard error.
Standard error for aggregate estinzates-The approximate standard error of an estimated number of decedents with a particular characteristic, x, is calculated by
RSE(X) = ~A~j and
SE (x)=x � RSE(X)
Patanretets
A B
-.000088 173.472799
-.000725 40.250787 -.000306 57.187500 -.000325 189.139047 -.000219 200.749692 -.000430 181.208646
-.000250 57.315899
-.002721 36.923295 -.001278 48.883512 -.000863 64.860422 -.000688 59.620841 -.001911 64.630073
-.000106 184.663690
-.000948 39.640659 -.000419 62.024668 -<000411 214.015461 -.000253 211.433967 -.000484 190.261795
where x = estimated number of decedents
A,B = parameters from table I
RSE(X) = relative standard error of x, and
SE(x) = standard error of x
The parameters shown in table I were estimated by a bakmcedrepeated-replication procedure using
20 replicate half samples. This method estimates the standard errors for survey estimates through observation of variability of estimates based on replicate half samples of the total sample. A description of the development and evaluation of the replication technique for error estimation has been published (12,13).
Samples of 100 NMFS a~egate estimates were selected from domains defined by the decedents’ age and race. Each sample was used to calculate parameters for a generalized variance function.
Numbers and percents within the tables and text were rounded to the nearest whole number or tenth of a percent. Therefore, the estimates may not add to the totals,
NOTFX Nke other Federal agencies signed interagency agreements with NCHS to cosponsor the 1986 survey. These agencies are the National Heart, Lung and Blood Institute; the National Institute of Child Health and Human Developmen~ the National Cancer Institute; the National Institute of Aging the National Institute of Mental Healt@ the Health Care and Financing Administration, the U.S. Depmtment of Veterans Affai~, the Indian Health Servicq and the Office of the Assistant Secretary for Planning and Evaluation in the Department of Health and Human Semites.

32 Advance Data
Recent Issues
No. 166. AIDS Knowledge and Attitudes of Hispanic Americans (Issued April 11, 1989)
No. 167. AIDS Knowledge and Attitudes for October and November 1988 (Issued April 19, 1989)
Suggested citation
Kapantais G, Powell-Griner E. Characteristics of persons dying of Diseases of heart Preliminary data from the 1986 National Mohality Followback Survey. Advance data from vital and health statistics; no 172. Hyattsville, Maryland: National Center for Health Statistics. 1989.
U.S. DEPARTMENT OF HEALTH AND HUMAN SERVICES
Public Health Service Centers for Disease Control National Center for Health Statistics 37OOEast-West Highway Hyattsville, Matyland 20782
OFFICIAL BUSINESSPENALTY FOR PRIVATEUSE, $3OO
To receive this publication regularly, contactthe National Center for Health Statistics bycalling 301-436-8500
DHHS Publication No. (PHS) 89-1250
of Advance Data From Vital and Health Statistics
No. 168. Health Characteristics of Workers by Occupation and Sex United States, 1983–85 (Issued April 25, 1989)
No. 169. Hospital Inpatient Surgery United States, 1983–87 (Issued May 23, 1987)
No. 170. Aging in the Eightiex The Prevalence of Comorbidity and its Association With Disability (Issued May 26, 1989)
No. 171. Office Visits to Cardiovascukm Disease Specialists, 1985 (Issued June 23, 1989)
Copyright information
This report may be reprinted without further permission.
BULK RATE POSTAGE & FEES PAID
PHS/NCHS PERMIT No. G-281
I
*.
I