numbers, facts and trends shaping the world january 15,...
TRANSCRIPT

JANUARY 15, 2015
FOR FURTHER INFORMATION
ON THIS REPORT:
Keith N. Hampton, Associate Professor, Rutgers University
Lee Rainie, Director, Internet, Science and Technology
Research, Pew Research Center
Weixu Lu, PhD Student, Rutgers University
Inyoung Shin, PhD Student, Rutgers University
Kristen Purcell Research Consultant, Pew Research Center
202.419.4372 www.pewresearch.org
RECOMMENDED CITATION: Hampton, K.N., Rainie, L., Lu, W., Shin, I., & Purcell, K. (2014). “Social Media and the Cost of Caring.” Pew
Research Center, Washington, DC.
Available at: http://www.pewinternet.org/2015/01/15/social-media-and-stress/
NUMBERS, FACTS AND TRENDS SHAPING THE WORLD

1
PEW RESEARCH CENTER
www.pewresearch.org
About this report
The widespread use of the internet and related digital technologies has raised concerns that
technology use may be responsible for higher levels of psychological stress. This report explores
that possibility as well as the possibility that these technologies increases people’s awareness of
stressful experiences in the lives of friends and family which in turn affect users’ own stress.
This report is a collaborative effort based on the input and analysis of the following individuals:1
Keith N. Hampton, Associate Professor, Rutgers University
Lee Rainie, Director, Internet, Science, and Technology Research, Pew Research Center
Weixu Lu, PhD student, Rutgers University
Inyoung Shin, PhD student, Rutgers University
Kristen Purcell, Associate Director, Research, Pew Research Center
About the Pew Research Center
Pew Research Center is a nonpartisan fact tank that informs the public about the issues, attitudes
and trends shaping America and the world. It does not take policy positions. It conducts public
opinion polling, demographic research, media content analysis and other empirical social science
research. The center studies U.S. politics and policy views; media and journalism; internet and
technology; religion and public life; Hispanic trends; global attitudes and U.S. social and demo-
graphic trends. All of the center’s reports are available at www.pewresearch.org. Pew Research
Center is a subsidiary of The Pew Charitable Trusts.
© Pew Research Center 2015
1 We are grateful to the advice we received at various stages in this project from Maria Dwyer (Rutgers University), Donald Lloyd (University of
Southern California), and Blair Wheaton (University of Toronto).
2
PEW RESEARCH CENTER
www.pewresearch.org
Summary of Findings
For generations, commentators have worried about the impact of technology on people’s stress.
Trains and industrial machinery were seen as noisy disruptors of pastoral village life that put
people on edge. Telephones interrupted quiet times in homes. Watches and clocks added to the
de-humanizing time pressures on factory workers to be productive. Radio and television were
organized around the advertising that enabled modern consumer culture and heightened people’s
status anxieties.
Inevitably, the critics have shifted their focus onto digital technology. There has been considerable
commentary about whether internet use in general and social media use in particular are related
to higher levels of stress.2 Such analysts often suggest that it is the heaviest users of these
technologies that are most at risk. Critics fear that these technologies take over people’s lives,
creating time pressures that put people at risk for the negative physical and psychological health
effects that can result from stress.
This research explores whether the use of social media, mobile phones and the internet is
associated with higher levels of stress. In a Pew Research Center survey of 1,801 adults,3 we asked
participants about the extent to which they felt their lives were stressful, using an established scale
of stress called the Perceived Stress Scale (PSS).4 This scale is based on people’s answers to 10
questions that assess whether they feel that their life is overloaded, unpredictable and
uncontrollable. Perceived stress, as measured through the PSS, can be viewed as an assessment of
the risk that people face for psychological disorders related to stress, such as anxiety and
depression, as well as physical illnesses, such as cardiovascular disease and susceptibility to
infectious diseases.
There are a number of well-known factors that tend to make people feel more stress, including
things like the economic uncertainty of unemployment, and the absence of a spouse or a partner
with whom to confide. Previous studies have even found that awareness of stressful events in
others’ lives is a major contributor to people’s appraisal of their own stress levels. The relationship
of frequent use of digital technologies to stress has been an unknown. We also explored the
possibility that the social component of some digital technologies makes people more aware of
stressful events in the lives of their close friends and family, as well as in the lives of more socially
distant acquaintances, and that this in turn is related to higher levels of stress.
2 See for instance: Dick, John (2013). Why Do Social Networks Increase Stress? Huffington Post; Maldonado, Marissa (accessed November
2014). The Anxiety of Facebook. PsychCentral.
3 The survey was conducted between August 7-September 16, 2013 and has a margin of error of plus or minus 2.6 percentage points for the
full sample.
4 Cohen, S., et al. (1983). "A global measure of perceived stress." Journal of health and social behavior: 385-396.

3
PEW RESEARCH CENTER
www.pewresearch.org
The survey analysis produced two major findings that illustrate the complex interplay of digital
technology and stress:
Overall, frequent internet and social media users do not have higher levels of
stress. In fact, for women, the opposite is true for at least some digital technologies.
Holding other factors constant, women who use Twitter, email and cellphone picture
sharing report lower levels of stress.
At the same time, the data show there are circumstances under which the social
use of digital technology increases awareness of stressful events in the lives of
others. Especially for women, this greater awareness is tied to higher levels of stress and
it has been called “the cost of caring.” Stress is not associated with the frequency of people’s
technology use, or even how many friends users have on social media platforms. But there
is one way that people’s use of digital technology can be linked to stress: Those users who
feel more stress are those whose use of digital tech is tied to higher levels of awareness of
stressful events in others’ lives. This finding about “the cost of caring” adds to the evidence
that stress is contagious. 5
How can it be that social media use is not directly associated with stress, but for some, social
media use can still lead to higher levels of stress?
The answer: The relationship between stress and social media use is indirect. It is the social uses
of digital technologies, and the way they increase awareness of distressing events in others’ lives,
that explains how the use of social media can result in users feeling more stress.
Imagine a typical Facebook user. He or she is also likely to use other digital technologies, such as
email and text messaging. All these technologies allow him or her to share information with
friends and family in the form of photos, short textual messages and other contacts. As a result of
this communication, he or she is aware and reminded of more activities in the lives of friends and
family.
On the one hand, there are benefits from this contact. According to previous research by the Pew
Research Center, compared with non-social media users and those who are not as active on
Facebook, this person likely: has more close friends; has more trust in people; feels more
supported; and is more politically involved. While some might assume that this typical user of
Facebook and other digital technologies experiences peer pressure to participate or keep up, and a
fear of missing out, if such pressures exist, our typical user does not feel more stress than what he
or she would otherwise have experienced, or the social benefit of using these technologies cancels
5 Kessler, R. C. and J. D. McLeod (1984). "Sex Difference in Vulnerability to Undesirable Life Events." American Sociological Review 49: 620-
631.

4
PEW RESEARCH CENTER
www.pewresearch.org
out those additional costs. He or she is unlikely to feel more stress than those who are not using or
are less active on social media.
On the other hand, there is the common exception to this relatively positive situation. Sometimes,
a social media user’s awareness of events in others’ lives includes knowledge about undesirable
events, a friend or family member getting fired or losing someone close to them. Learning of such
events in the life of a friend or family member can result in higher feelings of stress.
In sum, social media users are not any more likely to feel stress than others, but there is a
subgroup of social media users who are more aware of stressful events in their friends’ lives and
this subgroup of social media users does feel more stress.
Gender differences are a major part of this story. Women and men have different levels of stress;
their use of digital technologies varies; and the impact of their technology use is different.
The broad patterns are:
Overall, women tend to report more stress than men. But, those women who use a
number of digital technologies to communicate with others tend to report less stress
than women who do not use these technologies.
Women are more aware of stressful events in the lives of their closest friends and family.
Social media use is related to even higher levels of awareness of the stressful events that
unfold in the lives of people they know.
Awareness of stressful events in others’ lives is a significant contributor to people’s own
stress. It is the only factor that we found that is common to both social media use and
psychological stress. The number of undesirable events associated with stress is greater
for women than for men.
Overall, women tend to report more stress than men. But, women who use a number of
digital technologies to communicate with others report less stress than women who are
non-users.
In this survey, women report an average score of 10.5 out of 30 on the Perceived Stress Scale
(PSS). Men reported an average score of 9.8 — a figure that is 7% lower than women.
Because men and women tend to experience stress differently, we ran each of our analyses
separately for men and for women. We did statistical modeling allowing us to more fully
understand the relationship between stress and the use of different technologies. The use of
regression analysis allowed us to control for such things as age, unemployment, education levels

5
PEW RESEARCH CENTER
www.pewresearch.org
and marital status — all of which are related to how much stress people tend to report in their lives
independent of whether they use technologies or not.6
When it comes to stress, there was no statistical difference in stress levels between men who use
social media, cellphones, or the internet and men who do not use these technologies. However,
some tech activities were linked to less stress among women — Twitter use, email use and photo
sharing via cellphones. Compared with a woman who does not use these technologies, a women
who uses Twitter several times per day, sends or receives 25 emails per day, and shares two digital
pictures through her mobile phone per day, scores 21% lower on our stress measure than a woman
who does not use these technologies at all.
We do not know what it is about these specific technology uses that are associated with lower
stress. However, existing studies have found that social sharing of both positive and negative
events can be associated with emotional well-being and that women tend to share their emotional
experiences with a wider range of people than do men.7 Sharing through email, sending text
messages of pictures of events shortly after they happen and expressing oneself through the small
snippets of activity allowed by Twitter may provide women with a low-demand and easily
accessible coping mechanism that is not experienced or taken advantage of by men. It is also
possible that the use of these media replaces activities or allows women to reorganize activities
that would otherwise be more stressful.
Women are more aware of stressful events in the lives of their closest friends and family.
In the survey we asked people if they were aware of whether any of a list of 12 stressful events had
happened to someone close to them, an acquaintance, or both in the past year. The events were
selected from a list of major life events that are known social stressors.8 Our list ranged from
relatively common to less common events: hospitalization, death in the family, divorce or
marriage, being fired/laid off, being accused of a crime, starting a job, demotion/pay cut, being a
victim of a crime, having a child move away or return home, pregnancy or child birth, and moving
to a new house.
6 For our analysis we used linear regression with stepwise forward selection. As part of our survey, participants could report on their use of a
large number of different technologies related to social media, cellphones, and the internet more broadly. We did not have a specific
expectation as to which of these uses might be related to stress or awareness of stressful events. Stepwise forward regression is a procedure
that allows you to test the possible relationships between a large number of measures and an outcome such as stress. We entered a series of
demographic variables into our regression equation (age, education, race, marital status, employment status) and then used stepwise
forward regression to test each of the reported measures of technology use. For each analysis, we removed independent variables for
technology use at each step that were not statistically significant.
7 Pennebaker, J. W., et al. (2001). Disclosing and sharing emotion: Psychological, social, and health consequences. Handbook of
bereavement research: Consequences, coping, and care. M. S. Stroebe, R. O. Hansson, W. Stroebe and H. Schut. Washington, DC, American
Psychological Association: 517-543.
8 Turner, R. J., et al. (1995). "The Epidemiology of Social Stress." American Sociological Review 60(1): 104-125.

6
PEW RESEARCH CENTER
www.pewresearch.org
5.6
6.3
6.3
6.5
6.0
5.8
5.3
3.8
4.6
4.6
4.5
4.6
3.9
3.4
Photo
Sharing
Text
message
User of this technology
Non-user
Of the 12 stressful events that we studied, on average, women were aware of a larger number of
events that had occurred among people they knew. On average, men were aware of 7% fewer
stressful events among their closest social ties.
Social media users tend to be more aware of stressful events in the lives of people they
know.
Different technologies are associated with
varying levels of awareness of stressful events
that have occurred to others — and there is
also variation depending on whether the
events have occurred to those who are close
ties, compared with more-distant
acquaintances.
Facebook was the one technology that for both
men and women provides higher levels of
awareness of stressful events taking place in
the lives of both close and more distant
acquaintances. Other technologies are more
specialized: some provide awareness of major
events in the lives of close relationships, while
others provide an awareness of activities in the
lives of acquaintances who are less socially
close. It is not a new finding that people tend
to use different technologies to communicate
with social ties of different strengths. For
example, other studies have found that
cellphones and instant messaging are more
likely to be used with family and close friends.9
To add to this complexity, we found that men
and women used digital technologies
differently, and this is important for
understanding how people are exposed to
information about stressful events in others’
lives.
9 Kim, H., et al. (2007). "Configurations of Relationships in Different Media." Journal of Computer-Mediated Communication 12(4): URL
(consulted Oct. 2010): http://jcmc.indiana.edu/vol2012/issue2014/kim.html.
Ling, R. S. (2008). New Tech, New Ties. Cambridge, MA, MIT Press.
Technology use and awareness of
stressful events in others’ lives
The average number of stressful events (out of a total of
12 possible) that people knew occurred in the lives of
their friends/acquaintances in the past 12 months
Note: Based on responses to Q4: “… Please tell me if you know
someone—other than yourself—who has experienced any of the
following in the past 12 months. Do you know someone who has …”
followed by a list of 12 different stressful events.
Source: August 2013 survey. N=1,801 adults.
PEW RESEARCH CENTER

7
PEW RESEARCH CENTER
www.pewresearch.org
Among Facebook users:
A woman with an average size network of Facebook friends is aware of 13% more stressful
events in the lives of her closest social ties, compared with an equivalent woman who does
not use Facebook. And that average woman user is aware of 14% more stressful events in
the lives of her more-distant acquaintances.
A typical male Facebook user who comments regularly on others’ posts is aware of 8%
more stressful events amongst his closest social ties. A man with an average size network of
Facebook friends is aware of 6% more major events in the lives of his acquaintances,
compared with an equivalent male who does not use Facebook.
For women, awareness about stressful events in others’ lives was also likely to be related to
sharing pictures online, use of Pinterest and Twitter. For men, awareness was particularly likely to
be related to email, LinkedIn and text messaging on their cellphone. These patterns are a result of
both the tendency for men and women to use different technologies, and for them to use different
technologies to keep in touch with different types of people — friends, family, workmates and
acquaintances.
Awareness of stressful events in others’ lives is a significant contributor to people’s own
stress. The number of undesirable events associated with stress is greater for women than
for men.
The cost of caring is particularly felt by women. This is a result of two facts about women and
stress: first, women report higher levels of stress to begin with, and second, women are aware of
more stressful events in the lives of their friends and family.
Holding other factors constant, women who were aware that …
Someone close to them experienced the death of a child, partner or spouse scored 14%
higher on our measure of stress.
Someone close has been hospitalized or experienced a serious accident or injury reported
5% higher stress.
An acquaintance had been accused of or arrested for a crime scored 11% higher on the
stress measure.
An acquaintance experienced a demotion or cut in pay reported 9% higher stress in their
own lives.
For men, of the events we explored, only two predicted stress. Holding other factors constant, men
who were aware that …
Someone close to them had been accused of or arrested for a crime scored 15% higher on
our measure of stress.
An acquaintance had experienced a demotion or pay cut at work report 12% higher stress.

8
PEW RESEARCH CENTER
www.pewresearch.org
While the little sips of information sent through social media may not seem like much, they can
add up to a big gulp. This study suggests that the information transferred through social media
translates into awareness of all kinds of extra things, including an awareness of undesirable events
in the lives of family, friends and acquaintances. Whether as a result of social media, or more
traditional forms of interaction, awareness of undesirable events in others’ lives generates a cost in
terms of increasing psychological stress, and with it, higher risk for the physical and psychological
problems that often accompany stress.
The analysis in this report is based on findings from a nationally representative survey of 1,801
American adults (ages 18+) by the Pew Research Center fielded August 7-September 16, 2013. The
survey was conducted in English and Spanish on landline and cellphones (N=900). The margin of
error for the full sample is plus or minus 2.6 percentage points. Some 1,076 respondents are users
of social networking sites and the margin of error for that subgroup is plus or minus 3.3
percentage points.

9
PEW RESEARCH CENTER
www.pewresearch.org
Table of Contents
Summary of Findings ........................................................................................... 2
Elaborating on the Major Findings ................................................................................................... 4
About this Survey ............................................................................................................................... 8
Psychological Stress and Social Media Use ................................................... 10
Awareness of Other People’s Stressful Life Events and Social Media Use ................................ 13
Social Media Users Are More Aware of Major Events in the Lives of People Close to Them .... 15
The Cost of Caring ............................................................................................. 20
Appendix A: Regressions .................................................................................. 22
Appendix B: Method ......................................................................................... 25
Survey Questions ............................................................................................... 29

10
PEW RESEARCH CENTER
www.pewresearch.org
Psychological Stress and Social Media Use
It makes sense to wonder if the use of digital technology creates stress. There is more information
flowing into people’s lives now than ever — much of it distressing and challenging. There are more
possibilities for interruptions and distractions. It is easier now to track what friends, frenemies,
and foes are doing and to monitor raises and falls in status on a near-constant basis. There is more
social pressure to disclose personal information. These technologies are said to takeover people’s
lives, creating time and social pressures that put people at risk for the negative physical and
psychological health effects that can result from stress.
Stress might come from maintaining a large network of Facebook friends, feeling jealous of their
well-documented and well-appointed lives, the demands of replying to text messages, the
addictive allure of photos of fantastic crafts on Pinterest, having to keep up with status updates on
Twitter, and the “fear of missing out” on activities in the lives of friends and family.10
We add to this debate with a large, representative study of American adults and explore an
alternative explanation for the relationship between technology use and stress. We test the
possibility that a specific activity, common to many of these technologies, might be linked to
stress. It is possible that technology users — especially those who use social media — are more
aware of stressful events in the lives of their friends and family. This increased awareness of
stressful events in other people’s lives may contribute to the stress people have in their own lives.
This study explores the digital-age realities of a phenomenon that is well documented: Knowledge
of undesirable events in other’s lives carries a cost — the cost of caring.11
This study explores the relationship between a variety of digital technology uses and psychological
stress. We asked people an established measure of stress that is known as the Perceived Stress
Scale (PSS).12 The PSS consists of ten questions and measures the degree to which individuals feel
that their lives are overloaded, unpredictable and uncontrollable. Participants were asked:
10 Thomee, S. (2012). ICT use and mental health in young adults. Gothenburg, Sweden, University of Gothenburg
Williams, R. (2013). Can more friends on facebook induce stress and anxiety? Psychology Today.
http://www.psychologytoday.com/blog/wired-success/201307/can-more-friends-facebook-induce-stress-and-anxiety.
Dick, J. (2013). Why Do Social Networks Increase Stress? Huffington Post. http://www.huffingtonpost.com/john-dick/social-networks-and-
stress_b_3534170.html.
Kotenko, J. (2013). Ladies, your love-hate relationship with the internet is stressing you out. Digital Trends.
http://www.digitaltrends.com/social-media/can-too-much-social-media-exposure-cause-stress-in-women/.
11 Lyons, R. F., et al. (1998). "Coping as a Communial Process." Journal of Social and Personal Relationships 15(5): 579-605.
Smith, R. L. and A. J. Rose (2011). "The “cost of caring” in youths' friendships: Considering associations among social perspective taking, co-
rumination, and empathetic distress." Developmental psychology 47(6): 1792.
12 Cohen, S., et al. (1983). "A global measure of perceived stress." Journal of health and social behavior: 385-396.
11
PEW RESEARCH CENTER
www.pewresearch.org
In the last 30 days, how often have you:
1. Been upset because of something that happened unexpectedly
2. Felt that you were unable to control the important things in your life
3. Felt nervous and “stressed”
4. Felt confident about your ability to handle any personal problems
5. Felt that things were going your way
6. Found that you could not cope with all the things that you had to do
7. Been able to control irritations in your life
8. Felt that you were on top of things
9. Been angered because of things that were outside of your control
10. Felt difficulties were piling up so high that you could not overcome them
Participants responded on a 4-point scale from “frequently” to “never.” The ten items were
combined so that a higher score indicates higher psychological stress (the scale ranges from 0-30
with zero representing no stress and 30 representing the highest level).13
Overall, women experience more stress than men.
The average American adult scored 10.2 out of 30 on the PSS. One of the starkest contrasts in our
survey was between the level of reported stress experienced by men and women. On average,
women report experiencing significantly higher levels of stress than men. The average women
scores 10.5 on the PSS while the average man scores 9.8.14 On average, men reported stress levels
that were 7% lower than for women.
There are other demographic characteristics that are related to stress. On average, older adults,
and those who are employed tend to have less stress.
How we studied psychological stress and technology use
In the survey, respondents were asked about their use of social networking sites: We asked people
about the frequency with which they use different social media platforms, such as Facebook (used
by 71% of internet users in this sample), Twitter (used by 18% of internet users), Instagram (17%),
Pinterest (21%), and LinkedIn (22%).
Given the popularity of Facebook, we also asked very specific questions about users’ networks and
what people do on that platform: number of friends (the average was 329), frequency of status
updates (the average was 8 times per month), frequency of “Liking” other people’s content (the
average was 34 times per month), frequency of commenting (the average was 22 times per
month), and how often they send private messages (the average was 15 times per month). 15
13 The PSS10 was modified for use in our telephone survey; the response categories were changed from a five item scale that ranged from
“never” to “very often,” to a four item scale that ranged from “never” to “frequently”. 14 ANOVA, p<.01 15 In this survey, 80% of adults say they are internet users and 89% said they have cellphones. A detailed demographic breakdown of the
demographics of users of various social media platforms in this survey can be found here.

12
PEW RESEARCH CENTER
www.pewresearch.org
We asked people how many digital pictures they share online (the average was 4 times per week),
how many people they email (9 people/day), and how many emails they send and receive (an
average of 25 per day). We also asked about their use of their mobile phone; the number of
messages they text (an average of 32 messages per day), pictures sharing via text (an average of 2
pictures per day), and the number of people that they text with (an average of 4 people per day).
Given the important differences in stress levels based on age, education, marital status, and
employment status, we used regression analysis to control for these factors. By using regression
analysis we are able determine the degree to which technology use is specifically associated with
stress by holding demographic characteristics constant. Since men and women tend to experience
stress differently, we ran separate analyses for each sex.
Those who are more educated and those who are married or living with a partner report
lower levels of stress.
We found that women, and those with fewer years of education, tend to report higher levels of
stress, while those who are married or living with a partner report less psychological stress (see
Table 1 in Appendix A). For women (but not men), those who are younger, and those who are
employed in paid work outside of the home also tend to experience less stress.
The frequency of internet and social media use has no direct relationship to stress in men.
For women, the use of some technologies is tied to lower stress.
For men, there is no relationship between psychological stress and frequent use of social media,
mobile phones, or the internet more broadly. Men who use these technologies report similar levels
of stress when compared with non-users.
For women, there is evidence that tech use is tied to modestly lower levels of stress. Specifically,
the more pictures women share through their mobile phones, the more emails they send and
receive, and the more frequently they use Twitter, the lower their reported stress. However, with
the exception of Twitter, for the average person, the relationship between stress and these
technologies is relatively small. Women who are heavier participants in these activities report less
stress. Compared with a woman who does not use these technologies, a women who uses Twitter
several times per day, sends or receives 25 emails per day, and shares two digital pictures through
her mobile phone per day, scores 21% lower on our stress measure than a woman who does not
use these technologies at all.
From this survey we are not able to definitively determine why frequent uses of some technologies
are related to lower levels of reported stress for women. Existing studies have found that social
sharing of both positive and negative events can be associated with emotional well-being and that
women tend to share their emotional experiences with a wider range of people than do men.16
16 Pennebaker, J. W., et al. (2001). Disclosing and sharing emotion: Psychological, social, and health consequences. Handbook of
bereavement research: Consequences, coping, and care. M. S. Stroebe, R. O. Hansson, W. Stroebe and H. Schut. Washington, DC, American
Psychological Association: 517-543.
13
PEW RESEARCH CENTER
www.pewresearch.org
Sharing through email, sending text messages of pictures of events shortly after they happen, and
expressing oneself through the small snippets of activity allowed by Twitter, may provide women
with a low-demand and easily accessible coping mechanism that is not experienced or taken
advantage of by men. It is also possible that the use of these media replaces activities or allows
women to reorganize activities that would otherwise be more stressful. Previous Pew Research
reports have also documented that social media users also tend to report higher levels of perceived
social support. It could be that technology use leads to higher levels of perceived social support,
which in turn moderates, or reduces stress, and subsequently reduces people’s risk for the physical
diseases and psychological problems that often accompany stress.17
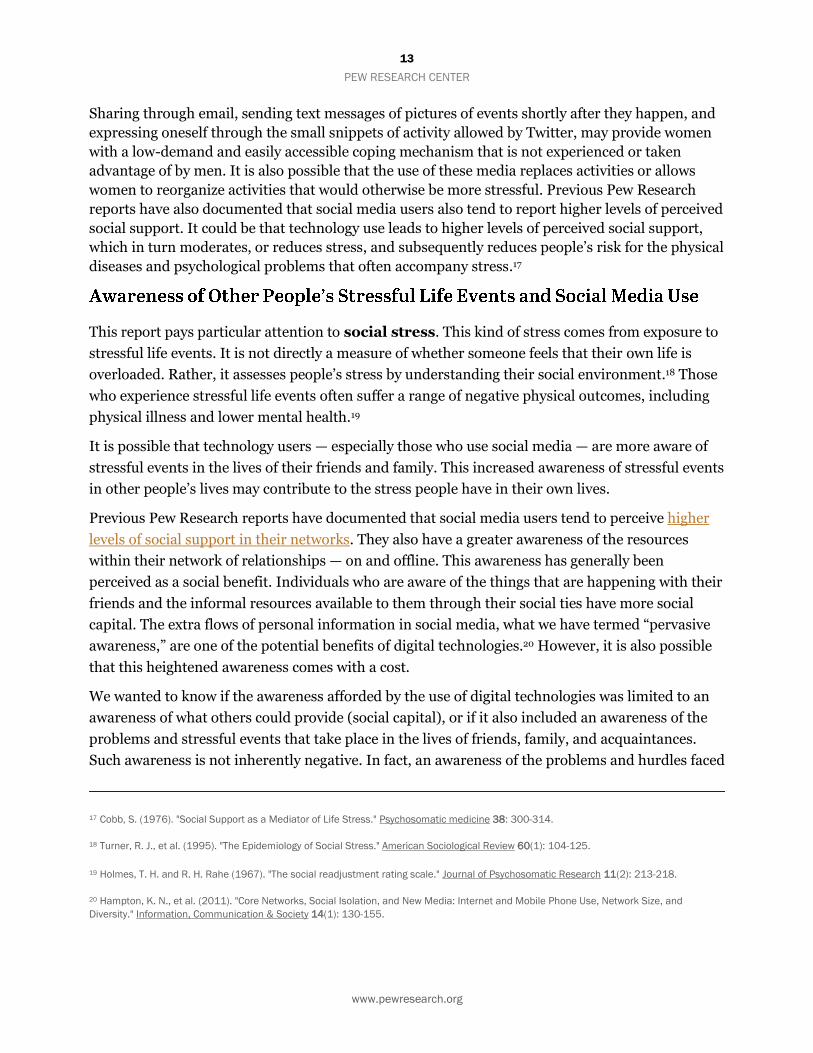
This report pays particular attention to social stress. This kind of stress comes from exposure to
stressful life events. It is not directly a measure of whether someone feels that their own life is
overloaded. Rather, it assesses people’s stress by understanding their social environment.18 Those
who experience stressful life events often suffer a range of negative physical outcomes, including
physical illness and lower mental health.19
It is possible that technology users — especially those who use social media — are more aware of
stressful events in the lives of their friends and family. This increased awareness of stressful events
in other people’s lives may contribute to the stress people have in their own lives.
Previous Pew Research reports have documented that social media users tend to perceive higher
levels of social support in their networks. They also have a greater awareness of the resources
within their network of relationships — on and offline. This awareness has generally been
perceived as a social benefit. Individuals who are aware of the things that are happening with their
friends and the informal resources available to them through their social ties have more social
capital. The extra flows of personal information in social media, what we have termed “pervasive
awareness,” are one of the potential benefits of digital technologies.20 However, it is also possible
that this heightened awareness comes with a cost.
We wanted to know if the awareness afforded by the use of digital technologies was limited to an
awareness of what others could provide (social capital), or if it also included an awareness of the
problems and stressful events that take place in the lives of friends, family, and acquaintances.
Such awareness is not inherently negative. In fact, an awareness of the problems and hurdles faced
17 Cobb, S. (1976). "Social Support as a Mediator of Life Stress." Psychosomatic medicine 38: 300-314.
18 Turner, R. J., et al. (1995). "The Epidemiology of Social Stress." American Sociological Review 60(1): 104-125.
19 Holmes, T. H. and R. H. Rahe (1967). "The social readjustment rating scale." Journal of Psychosomatic Research 11(2): 213-218.
20 Hampton, K. N., et al. (2011). "Core Networks, Social Isolation, and New Media: Internet and Mobile Phone Use, Network Size, and
Diversity." Information, Communication & Society 14(1): 130-155.

14
PEW RESEARCH CENTER
www.pewresearch.org
by others is a precondition of empathy,21 a dimension of social intelligence (social interest),22 and
facilitates the provision of social support. However, awareness can also have an emotional impact
– a “cost of caring.”23
To measure awareness of other people’s stress we asked participants if they knew someone – other
than themselves – who experienced any of a dozen major life events in the past 12 months. We
additionally asked if the person(s) the event happened to was someone close to them (a strong tie),
or an acquaintance whom they were not very close with (a weak tie), or both. Our list was
composed of major life events that are known sources of stress in people’s lives.24 The battery of
questions covered events that were likely to be relatively common and those that are rare.
The survey findings were that in the previous 12 months:
57% of adults said they know someone who had started a new job
56% know someone who had moved or changed homes
54% know someone who had become pregnant, given birth, or adopted a child
50% knew someone who had been hospitalized or experienced a serious accident or injury
50% knew someone who had become engaged or married
42% knew someone who had been fired or laid off
36% knew someone who had experienced the death of a child, partner, or spouse
36% knew someone who had a child move out of the house or move back into the house
31% knew someone who had gone through a marital separation or divorce
26% knew someone who had experienced a demotion or pay cut at work
22% knew someone who had been accused of or arrested for a crime
22% knew someone who had been the victim of a robbery or physical assault
Unsurprisingly, given that most people have few close social ties compared with the number of
acquaintances they have, for all of the events we queried, people were more likely to know a weak
tie (an acquaintance) than a strong tie who had experienced one of these stressful events.
The average adult in our sample knew people who had experienced 5 of the 12 events that we
asked about.
21 Davis, M. H. (1983). "Measuring individual differences in empathy: Evidence for a multidimensional approach." Journal of Personality and
Social Psychology 44(1): 113.
22 Adler, A., et al. (1964). Social interest: A challenge to mankind, Capricorn Books New York.
23 Kessler, R. C. and J. D. McLeod (1984). "Sex Difference in Vulnerability to Undesirable Life Events." American Sociological Review 49: 620-
631.
24 Turner, R. J., et al. (1995). "The epidemiology of social stress." American Sociological Review 60: 104-125.

15
PEW RESEARCH CENTER
www.pewresearch.org
How we studied awareness of stressful events in other people’s lives
As with our analysis of psychological stress, regression analysis was used to test if the use of
different digital technologies was related to higher or lower levels of awareness of stressful events
in other people’s lives. This allows us to determine the role of different technologies in helping
different users be aware of stressful events in others’ lives, controlling for likely differences in
awareness that are related to demographic factors such as age, education, race, marital and
employment status.
Knowing that the sexes tend to be very different in their awareness of stressful event in the lives of
those around them, we further divided our analysis into a comparison of women and men. We also
anticipated that some technologies might be more commonly used for communication with close
social ties, and primarily provide for an awareness of major events in the lives of close friends and
family, while others may be more suited for awareness of events in the lives of looser
acquaintances (Appendix A: Table 2).
Women are more aware than men of major events in the lives of people who are close to
them.
Previous research has found that women tend to be more aware of the life events of people in their
social network than are men.25 When we compared men and women based on the average number
of life events that someone in their social network had experienced in the past year, women were
consistently more aware than men, although the average was only statistically significant for close
relationships.
More educated and younger people are more aware of events in other people’s lives.
A number of demographic factors were consistently related to a higher level of awareness of major
events within people’s social networks. For both men and women, those who were younger and
those with more years of education tended to know of more major events in the lives of people
around them.
In addition, we found that women who were married or living with a partner, and women
employed in paid work outside the home, were more aware of events in the lives of their
acquaintances (weak ties), but that this was not related to awareness of events in the lives of close
friends and family.
25 Kessler, R. C. and J. D. McLeod (1984). "Sex Difference in Vulnerability to Undesirable Life Events." American Sociological Review 49: 620-
631.

16
PEW RESEARCH CENTER
www.pewresearch.org
Social media use is clearly linked to awareness of major events in other people’s lives. However,
the specific technologies that are associated with awareness vary for men and women.
Technology users are aware of more stressful events in the lives of their close
friends and more distant acquaintances
The average number of stressful events (out of a total of 12 possible) that people knew occurred in the lives of
their close friends and more distant acquaintances in the past 12 months
Note: Based on responses to Q4: “… Please tell me if you know someone—other than yourself—who has experienced any of the following in the
past 12 months. Do you know someone who has …” followed by a list of 12 different stressful events.
Source: August 2013 survey. N=1,801 adults.
PEW RESEARCH CENTER

17
PEW RESEARCH CENTER
www.pewresearch.org
5.4
5.7
6.4
6.3
6.4
6.0
5.9
5.4
3.1
3.7
4.6
4.6
4.3
4.7
3.9
3.6
Internet
Photo
Sharing
Text
message
User of this technology
Non-user
Among both men and women, Pinterest users
have a higher level of awareness of events in
the lives of close friends and family. The more
frequently someone used Pinterest, the more
events they were aware of:
Compared with a woman who does not
use Pinterest, a woman who visits
Pinterest 18 days per month (average
for a female Pinterest user) is typically
aware of 8% more major life events
from the 12 events we studied amongst
her closest social ties.
Compared with a man who does not
use Pinterest, a man who used
Pinterest at a similar rate (18 days per
month) would tend to be aware of 29%
more major life events amongst their
closest ties.
Men who used LinkedIn, men who send text
messages to a larger number of people, and
men who comment on other people’s posts
more frequently on Facebook also tend to be
more aware of major events in the lives of
people close to them. These same technologies
had no impact on woman’s awareness of
events in the lives of people close to them.
Compared with a man with similar
demographic characteristics that does not use
the following technologies:
Those who send text messages to four
different people through their mobile phones on an average day (the average for a male
cellphone user) tend to be aware of 16% more events amongst those who are close to them.
A male user of LinkedIn visits the site fifteen times per month and is typically aware of 14%
more events in the lives of their closest social ties.
Women who use technology are aware
of more stressful events in the lives of
their close friends and acquaintances
The average number of stressful events (out of a total of
12 possible) that women knew occurred in the lives of
their close friends and acquaintances in the past 12
months
Note: Based on responses to Q4: “… Please tell me if you know
someone—other than yourself—who has experienced any of the
following in the past 12 months. Do you know someone who has …”
followed by a list of 12 different stressful events.
Source: August 2013 survey. N=1,801 adults.
PEW RESEARCH CENTER

18
PEW RESEARCH CENTER
www.pewresearch.org
5.1
5.5
6.1
6.3
6.6
6.1
5.7
5.2
3.0
3.8
4.5
4.5
4.6
4.4
3.9
3.2
Internet
Photo
Sharing
Text
message
User of this technology
Non-user
A male Facebook user, who comments
on other Facebook users content 19
times per month, is, on average, aware
of 8% more events in the lives of their
closest friends and family.
For women, the more friends on their
Facebook network and the more pictures they
shared online per week, the more aware of
major life events in the lives of close friends
and family. Compared with demographically
similar women who do not use these
technologies:
A woman who shares 4 photos online
per week tends to be aware of 7%
additional major events in the lives of
those who are close to her.
A female Facebook user with 320
Facebook friends (the average for
women in our sample) is, on average,
aware of 13% more events in the lives
of her closest social ties.
Similarly, men experienced higher levels of
awareness as a result of a larger number of
different technologies.
Facebook use is associated with more
awareness of major events in the lives of
acquaintances.
Looking beyond people’s close relationships to
include a looser set of their acquaintances, we find that Facebook use is a consistent predictor of
awareness of stressful events in others’ lives for both men and women. Specifically, the more
Facebook friends people have, and the more frequently they “Like” other people’s content, the
more major events they are aware of within their network of contacts.
Compared with a non-Facebook user, a male Facebook user with 320 Facebook friends is,
on average, aware of 6% more major events in the lives of their extended acquaintances. A
female Facebook user with the same number of friends is aware of 14% more events in the
lives of their weak ties.
Men who use technology are aware of
more stressful events in the lives of
their close friends and acquaintances
The average number of stressful events (out of a total of
12 possible) that men knew occurred in the lives of their
friends and acquaintances in the past 12 months
Note: Based on responses to Q4: “… Please tell me if you know
someone—other than yourself—who has experienced any of the
following in the past 12 months. Do you know someone who has …”
followed by a list of 12 different stressful events.
Source: August 2013 survey. N=1,801 adults.
PEW RESEARCH CENTER
19
PEW RESEARCH CENTER
www.pewresearch.org
A male or female Facebook user who “Likes” other people’s content about once per day, is
typically aware of 10% more major events in the lives of their extended acquaintances.
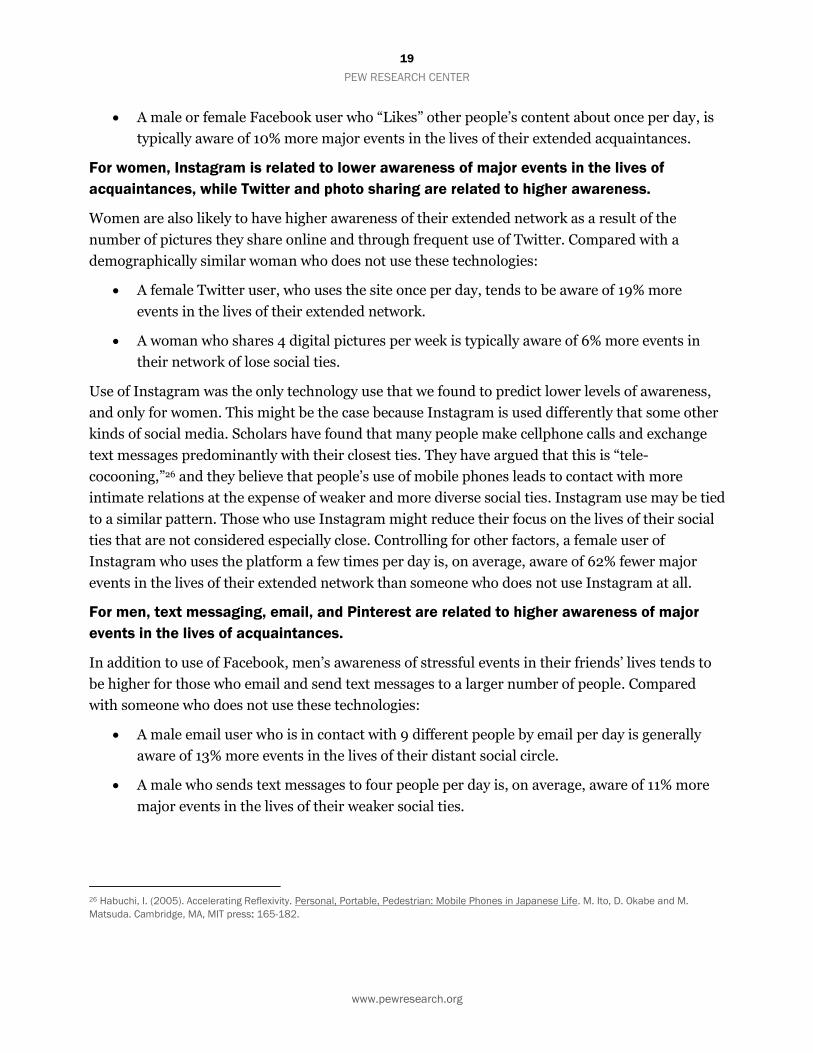
For women, Instagram is related to lower awareness of major events in the lives of
acquaintances, while Twitter and photo sharing are related to higher awareness.
Women are also likely to have higher awareness of their extended network as a result of the
number of pictures they share online and through frequent use of Twitter. Compared with a
demographically similar woman who does not use these technologies:
A female Twitter user, who uses the site once per day, tends to be aware of 19% more
events in the lives of their extended network.
A woman who shares 4 digital pictures per week is typically aware of 6% more events in
their network of lose social ties.
Use of Instagram was the only technology use that we found to predict lower levels of awareness,
and only for women. This might be the case because Instagram is used differently that some other
kinds of social media. Scholars have found that many people make cellphone calls and exchange
text messages predominantly with their closest ties. They have argued that this is “tele-
cocooning,”26 and they believe that people’s use of mobile phones leads to contact with more
intimate relations at the expense of weaker and more diverse social ties. Instagram use may be tied
to a similar pattern. Those who use Instagram might reduce their focus on the lives of their social
ties that are not considered especially close. Controlling for other factors, a female user of
Instagram who uses the platform a few times per day is, on average, aware of 62% fewer major
events in the lives of their extended network than someone who does not use Instagram at all.
For men, text messaging, email, and Pinterest are related to higher awareness of major
events in the lives of acquaintances.
In addition to use of Facebook, men’s awareness of stressful events in their friends’ lives tends to
be higher for those who email and send text messages to a larger number of people. Compared
with someone who does not use these technologies:
A male email user who is in contact with 9 different people by email per day is generally
aware of 13% more events in the lives of their distant social circle.
A male who sends text messages to four people per day is, on average, aware of 11% more
major events in the lives of their weaker social ties.
26 Habuchi, I. (2005). Accelerating Reflexivity. Personal, Portable, Pedestrian: Mobile Phones in Japanese Life. M. Ito, D. Okabe and M.
Matsuda. Cambridge, MA, MIT press: 165-182.

20
PEW RESEARCH CENTER
www.pewresearch.org
The Cost of Caring
People undergoing major life events can be at higher risk of physical and psychological distress,
including depressive symptoms.27 Even awareness of others’ difficulties might add to stress –
while at the same time offering people a chance to give support and comfort to those in the
networks.
A number of recent studies have pointed out that emotions may be contagious through social
networks.28-29 Stress may be one such contagion. Indeed, awareness of other people’s problems is
associated with a range of negative outcomes, such as depression.30 The “cost of caring” associated
with awareness of other people’s stressful events may be a negative consequence of social media
use because social media may make users more aware of the struggles of those in their network.
To test whether social stress is contagious — that the heightened awareness of stressful events in
other people’s lives is related to higher psychological stress in people’s own lives — we use
regression analysis to explore the relationship between the use of digital technologies, awareness
of major events in other people’s life, and psychological stress. By doing this, we are able to
determine if awareness of any specific type of life events is associated with higher or lower levels of
psychological stress (Appendix A: Table 1).
Stress is contagious
Awareness of some of the major events happening to their friends was related to stress in people’s
own lives. But not all the events were tied to stress. Of course, because our list of twelve events is a
sample from a lengthy potential list of stressful major life events, the true effect of the “cost of
caring” is possibly much larger than we document here.31
The number of events related to higher stress was greater for women than it was for men.
Unsurprisingly, all the events associated with higher levels of stress were events that were likely to
negatively impact the lives of friends and family. On average, a woman who is aware that:
Someone close to them experienced the death of a child, partner, or spouse scored 14%
higher on their own measure of stress, holding other things constant.
27 Turner, R. J., et al. (1995). "The Epidemiology of Social Stress." American Sociological Review 60(1): 104-125.
28 Kramer, A. D. I., et al. (2014). "Experimental evidence of massive-scale emotional contagion through social networks." Proceedings of the
National Academy of Sciences 111(24): 8788-8790.
29 Coviello, L., et al. (2014). "Detecting Emotional Contagion in Massive Social Networks." PloS one 9(3): e90315.
30 Schieman, S. and H. A. Turner (2001). "When Feeling Other People's Pain Hurts: The Influence of Psychosocial Resources on the
Association between Self-Reported Empathy and Depressive Symptoms." Social Psychology Quarterly: 376-389.
31 Aneshensel, C. (1992). Social Stress. Annual Review of Sociology. 18: 15-38.
21
PEW RESEARCH CENTER
www.pewresearch.org
Someone close has been hospitalized or experienced a serious accident or injury reported
5% higher psychological stress.
An acquaintance had been accused of or arrested for a crime scored 11% higher on the
stress measure.
An acquaintance experienced a demotion or cut in pay reported 9% higher levels of
psychological stress.
For men, of the events we explored, only two predicted stress. On average, men who were aware
that:
Someone close to them had been accused of or arrested or a crime reported 15% higher on
our measure of psychological stress.
An acquaintance had experienced a demotion or pay cut at work report 12% higher stress.
For both men and women, we found no relationship between their own stress (higher or lower
levels) and awareness of more positive (but generally still stressful) events in their friends’ lives,
such as an engagement or marriage.
People can become aware of undesirable events in the lives of friends and family through a variety
of means. Digital technologies are only one new way that people become aware of these events.
It is clear from this analysis that the cost of caring is particularly felt by women. This is a result of
both the larger number of events related to women’s stress, and the higher level of awareness that
women tend to have of major events in the lives of people around them. Controlling for other
factors, in the unlikely example that a women is aware of all of the events we covered in the survey,
she would typically score 32% higher than the average woman on our measure of perceived stress.
A man would score 27% higher than the average man.
The joy of missing out
There is one other factor to note in our findings. We found that women who were aware that an
acquaintance — someone not very close to them – had experienced the death of a child, partner or
spouse, reported lower levels of psychological stress. This is the opposite of how women feel when
aware that someone close to them suffered the same experience. At first glance, this finding might
be interpreted as somewhat uncaring — perhaps a sign of “schadenfreude,” or the pleasure derived
from the misfortune of others. In fact, this finding is more likely to be an extension of the cost of
caring. It could be seen as “the joy of missing out.” When women see more-distant acquaintances
struggling with stressful events, it might have the effect of inducing relief that this particular event
has not happened to someone closer to them. It is a reminder that the lives of close friends/family
could, after all, be much worse. Controlling for other factors, the joy of missing out was typically
associated with a score that was about 6% lower on our scale of perceived stress.

22
PEW RESEARCH CENTER
www.pewresearch.org
Appendix A: Regressions
Table 1. OLS regression on Perceived Stress Scale (PSS).
Independent Variables Women (N=889) Men (N=882)
Constant 17.242 *** 15.056 ***
Demographics
Age -0.034 ** 0.000
Years of education (7-18) -0.344 *** -0.372 ***
Black/African-American 0.452 0.705
Living with spouse or partner -0.914 ** -0.858 *
Employed -1.750 *** -0.763
Mobile Phone Use
Number of text messages sent per day - -
Number of pictures texted per day -0.041 ** -
Number of people text der day - -
Internet Use
Internet user - -
Number of pictures shared online per week - -
Number of emails sent/received per day -0.010 ** -
Number of people email per day - -
Social Media Use
Twitter visits per month (0-90) -0.036 *** -
Instagram visits per month (0-90) - -
Pinterest visits per month (0-90) - -
LinkedIn visits per month (0-90) - -
Facebook Use
Facebook visits per month (0-90) - -
Number of Facebook friends - -
Status update per month (0-90) - -
‘Like’ per month (0-90) - -
Comment per month (0-90) - -
Sending private message per month (0-90) - -
Awareness of major life events among close ties
Started a new job - -
Moved or changed homes - -
Pregnant, given birth, or adopted a child - -
Hospitalized or a serious accident or injury 0.794 * -
Engaged or married - -
Fired or laid off - -
Death of a child, partner, or spouse 2.477 *** -
Continues on next page
23
PEW RESEARCH CENTER
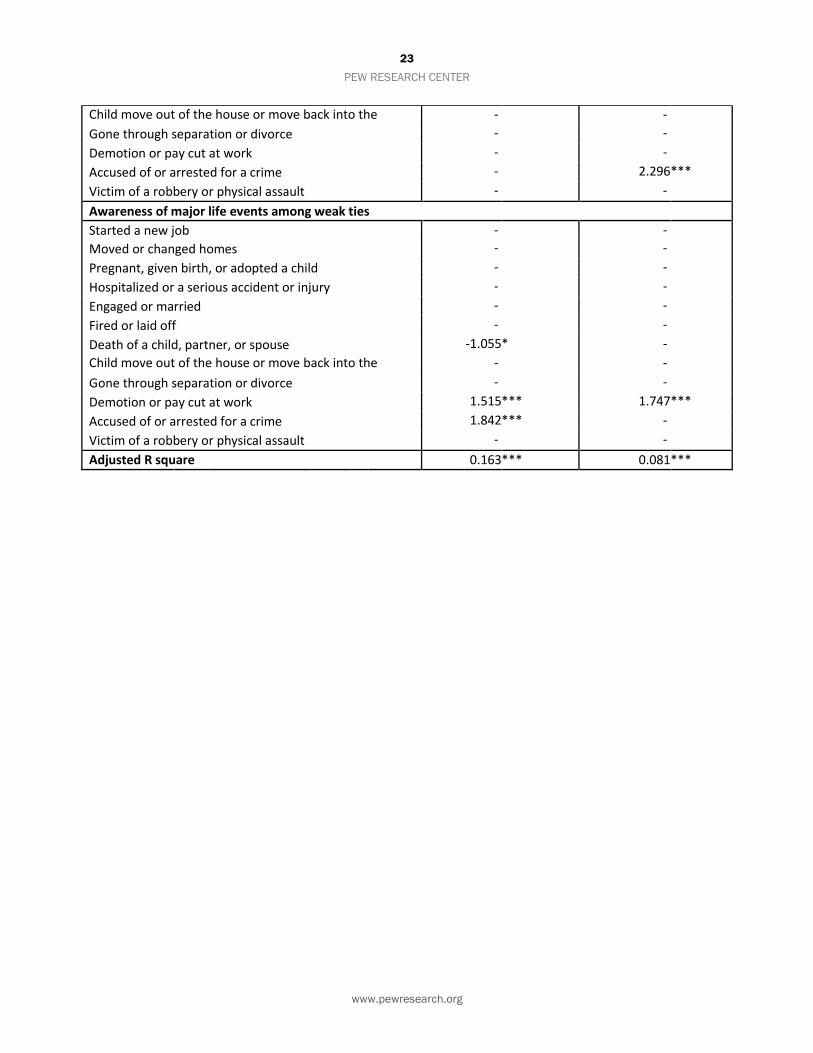
www.pewresearch.org
Child move out of the house or move back into the house
- -
Gone through separation or divorce - -
Demotion or pay cut at work - -
Accused of or arrested for a crime - 2.296 ***
Victim of a robbery or physical assault - -
Awareness of major life events among weak ties
Started a new job - -
Moved or changed homes - -
Pregnant, given birth, or adopted a child - -
Hospitalized or a serious accident or injury - -
Engaged or married - -
Fired or laid off - -
Death of a child, partner, or spouse -1.055 * -
Child move out of the house or move back into the house
- -
Gone through separation or divorce - -
Demotion or pay cut at work 1.515 *** 1.747 ***
Accused of or arrested for a crime 1.842 *** -
Victim of a robbery or physical assault - -
Adjusted R square 0.163 *** 0.081 ***
24
PEW RESEARCH CENTER
www.pewresearch.org
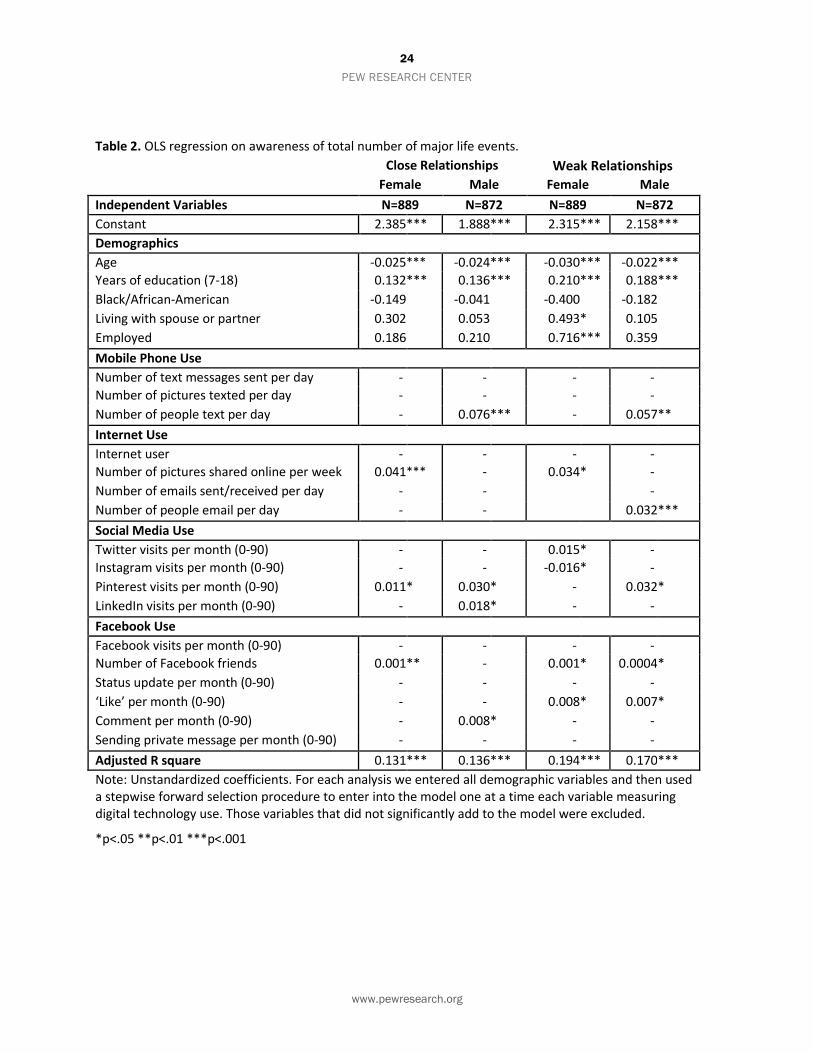
Table 2. OLS regression on awareness of total number of major life events.
Close Relationships
relationships
Weak Relationships
Female Male Female Male
Independent Variables N=889 N=872 N=889 N=872
Constant 2.385 *** 1.888 *** 2.315 *** 2.158 ***
Demographics
Age -0.025 *** -0.024 *** -0.030 *** -0.022 ***
Years of education (7-18) 0.132 *** 0.136 *** 0.210 *** 0.188 ***
Black/African-American -0.149
-0.041 -0.400 -0.182
Living with spouse or partner 0.302
0.053 0.493 * 0.105
Employed 0.186 0.210 0.716 *** 0.359
Mobile Phone Use
Number of text messages sent per day - - - -
Number of pictures texted per day - - - -
Number of people text per day - 0.076 *** - 0.057 **
Internet Use
Internet user - - - -
Number of pictures shared online per week 0.041 *** - 0.034 * -
Number of emails sent/received per day - - -
Number of people email per day - - 0.032 ***
Social Media Use
Twitter visits per month (0-90) - - 0.015 * -
Instagram visits per month (0-90) - - -0.016 * -
Pinterest visits per month (0-90) 0.011 * 0.030 * - 0.032 *
LinkedIn visits per month (0-90) - 0.018 * - -
Facebook Use
Facebook visits per month (0-90) - - - -
Number of Facebook friends 0.001 ** - 0.001 * 0.0004 *
Status update per month (0-90) - - - -
‘Like’ per month (0-90) - - 0.008 * 0.007 *
Comment per month (0-90) - 0.008 * - -
Sending private message per month (0-90) - - - -
Adjusted R square 0.131 *** 0.136 *** 0.194 *** 0.170 ***
Note: Unstandardized coefficients. For each analysis we entered all demographic variables and then used a stepwise forward selection procedure to enter into the model one at a time each variable measuring digital technology use. Those variables that did not significantly add to the model were excluded.
*p<.05 **p<.01 ***p<.001

25
PEW RESEARCH CENTER
www.pewresearch.org
Appendix B: Method
This report is based on the findings of a survey on Americans' use of the Internet. The results in
this report are based on data from telephone interviews conducted by Princeton Survey Research
Associates International from August 7 to September 16, 2013, among a sample of 1,801 adults,
age 18 and older. Telephone interviews were conducted in English and Spanish by landline (901)
and cellphone (900, including 482 without a landline phone). For results based on the total
sample, one can say with 95% confidence that the error attributable to sampling is plus or minus
2.6 percentage points. For results based on Internet users32 (n=1,445), the margin of sampling
error is plus or minus 2.9 percentage points. In addition to sampling error, question wording and
practical difficulties in conducting telephone surveys may introduce some error or bias into the
findings of opinion polls.
A combination of landline and cellular random digit dial (RDD) samples was used to represent all
adults in the United States who have access to either a landline or cellular telephone. Both samples
were provided by Survey Sampling International, LLC (SSI) according to PSRAI specifications.
Numbers for the landline sample were drawn with equal probabilities from active blocks (area
code + exchange + two-digit block number) that contained three or more residential directory
listings. The cellular sample was not list-assisted, but was drawn through a systematic sampling
from dedicated wireless 100-blocks and shared service 100-blocks with no directory-listed
landline numbers.
New sample was released daily and was kept in the field for at least seven days. The sample was
released in replicates, which are representative subsamples of the larger population. This ensures
that complete call procedures were followed for the entire sample. At least 7 attempts were made
to complete an interview at a sampled telephone number. The calls were staggered over times of
day and days of the week to maximize the chances of making contact with a potential respondent.
Each number received at least one daytime call in an attempt to find someone available. For the
landline sample, interviewers asked to speak with the youngest adult male or female currently at
home based on a random rotation. If no male/female was available, interviewers asked to speak
with the youngest adult of the other gender. For the cellular sample, interviews were conducted
with the person who answered the phone. Interviewers verified that the person was an adult and
in a safe place before administering the survey. Cellular sample respondents were offered a post-
paid cash incentive for their participation. All interviews completed on any given day were
considered to be the final sample for that day.
Weighting is generally used in survey analysis to compensate for sample designs and patterns of
non-response that might bias results. A two-stage weighting procedure was used to weight this
32 Internet user definition includes those who use the internet or email at least occasionally or access the internet on a mobile handheld
device at least occasionally.
26
PEW RESEARCH CENTER
www.pewresearch.org
dual-frame sample. The first-stage corrected for different probabilities of selection associated with
the number of adults in each household and each respondent’s telephone usage patterns.33 This
weighting also adjusts for the overlapping landline and cell sample frames and the relative sizes of
each frame and each sample.
The second stage of weighting balances sample demographics to population parameters. The
sample is balanced to match national population parameters for sex, age, education, race,
Hispanic origin, region (U.S. Census definitions), population density, and telephone usage. The
Hispanic origin was split out based on nativity; U.S born and non-U.S. born. The White, non-
Hispanic subgroup was also balanced on age, education and region. The basic weighting
parameters came from the US Census Bureau’s 2011 American Community Survey data.34 The
population density parameter was derived from Census 2010 data. The telephone usage parameter
came from an analysis of the July-December 2012 National Health Interview Survey.35
Following is the full disposition of all sampled telephone numbers:
33 i.e., whether respondents have only a landline telephone, only a cellphone, or both kinds of telephone.
34 ACS analysis was based on all adults excluding those living in institutional group quarters (GCs). 35Blumberg SJ, Luke JV. Wireless substitution: Early release of estimates from the National Health Interview Survey, July-December, 2012.
National Center for Health Statistics. June 2013.
27
PEW RESEARCH CENTER
www.pewresearch.org
Sample Disposition
Landline Cell
40,985 27,000 Total Numbers Dialed
1,669 346 Non-residential
1,458 94 Computer/Fax
15 ---- Cellphone
24,589 10,375 Other not working
1,994 427 Additional projected not
working 11,260 15,758 Working numbers
27.5% 58.4% Working Rate
665 142 No Answer / Busy
3,332 5,501 Voice Mail
27 16 Other Non-Contact
7,236 10,099 Contacted numbers
64.3% 64.1% Contact Rate
328 1,793 Callback
5,898 6,776 Refusal
1,010 1,530 Cooperating numbers
14.0% 15.2% Cooperation Rate
53 67 Language Barrier
---- 540 Child's cellphone
957 923 Eligible numbers
94.8% 60.3% Eligibility Rate
56 22 Break-off
901 901 Completes
94.1% 97.6% Completion Rate
8.4% 9.5% Response Rate
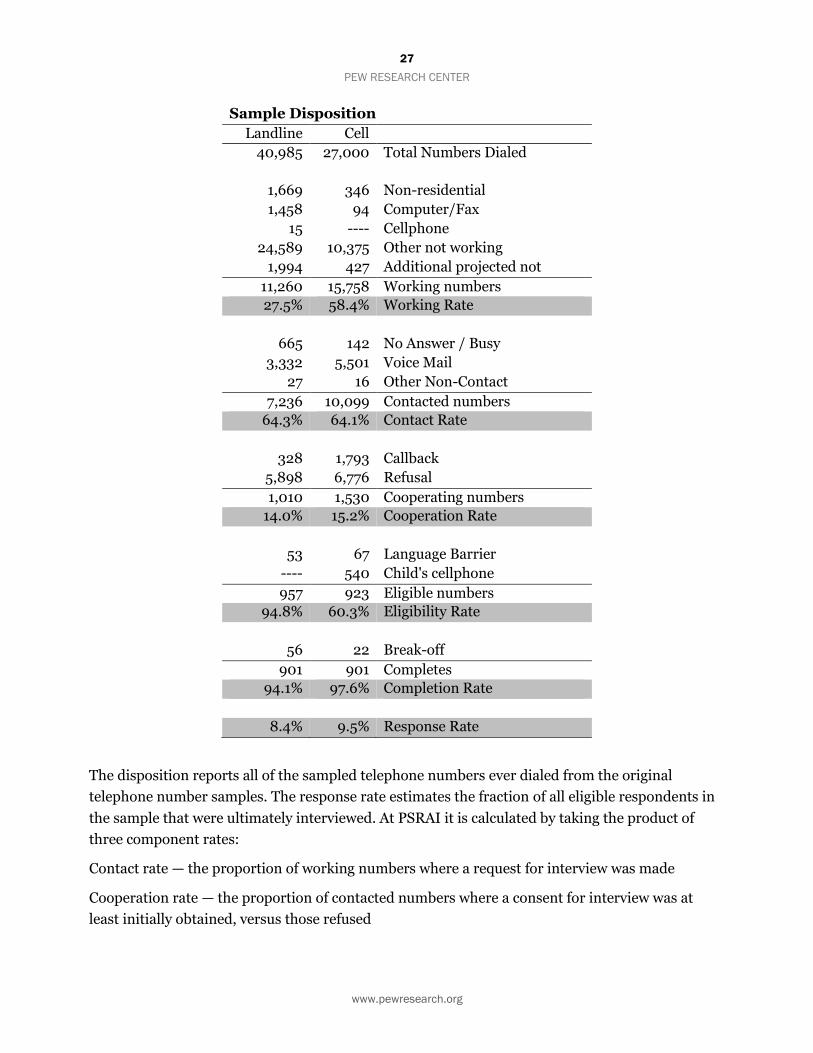
The disposition reports all of the sampled telephone numbers ever dialed from the original
telephone number samples. The response rate estimates the fraction of all eligible respondents in
the sample that were ultimately interviewed. At PSRAI it is calculated by taking the product of
three component rates:
Contact rate — the proportion of working numbers where a request for interview was made
Cooperation rate — the proportion of contacted numbers where a consent for interview was at
least initially obtained, versus those refused
28
PEW RESEARCH CENTER
www.pewresearch.org
Completion rate — the proportion of initially cooperating and eligible interviews that were
completed
Thus the response rate for the landline sample was 8 percent. The response rate for the cellular
sample was 10 percent.

29
PEW RESEARCH CENTER
www.pewresearch.org
Survey questions
Pew Research Center August Tracking 2013 Final Topline 9/18/2013
Data for August 7-September 16, 2013
Survey by the Pew Research Center’s Internet & American Life Project
Fieldwork conducted by Princeton Survey Research Associates International
Sample: n=1,801 national adults, age 18 and older, including 900 cellphone interviews Interviewing dates: 08.07.2013 – 09.16.2013
Margin of error is plus or minus 2.6 percentage points for results based on Total [n=1,801]
Margin of error is plus or minus 2.9 percentage points for results based on all internet users [n=1,445]
Margin of error is plus or minus 2.7 percentage points for results based on all cellphone owners [n=1,636] Margin of error is plus or minus 3.3 percentage points for results based on all SNS or Twitter users [n=1,076]
Margin of error is plus or minus 3.5 percentage points for results based on Facebook users [n=960] Margin of error is plus or minus 7.2 percentage points for results based on Twitter users [n=223]
Q2 Now thinking only about the last 30 days... In the last 30 days, how often have you [INSERT ITEMS; RANDOMIZE] – frequently, sometimes, hardly ever, or never?
FRE-
QUENTLY
SOME-
TIMES
HARDLY
EVER NEVER
DON’T
KNOW REFUSED
a. Been upset because of something that happened unexpectedly 12 33 37 17 * *
b. Felt that you were unable to control the important things in your life 15 25 31 28 1 1
c. Felt nervous and “stressed” 23 36 26 14 * *
d. Felt confident about your ability to handle any personal problems 68 20 6 4 1 1
e. Felt that things were going your way 47 37 11 5 1 *
f. Found that you could not cope with all the things that you had to do 10 23 33 33 1 1
g. Been able to control irritations in your life 57 27 9 6 1 1
h. Felt that you were on top of things 56 30 8 5 1 *
i. Been angered because of things that were outside of your control 14 33 31 22 0 *
j. Felt difficulties were piling up so high that you could not overcome them 9 21 31 39 * *

30
PEW RESEARCH CENTER
www.pewresearch.org
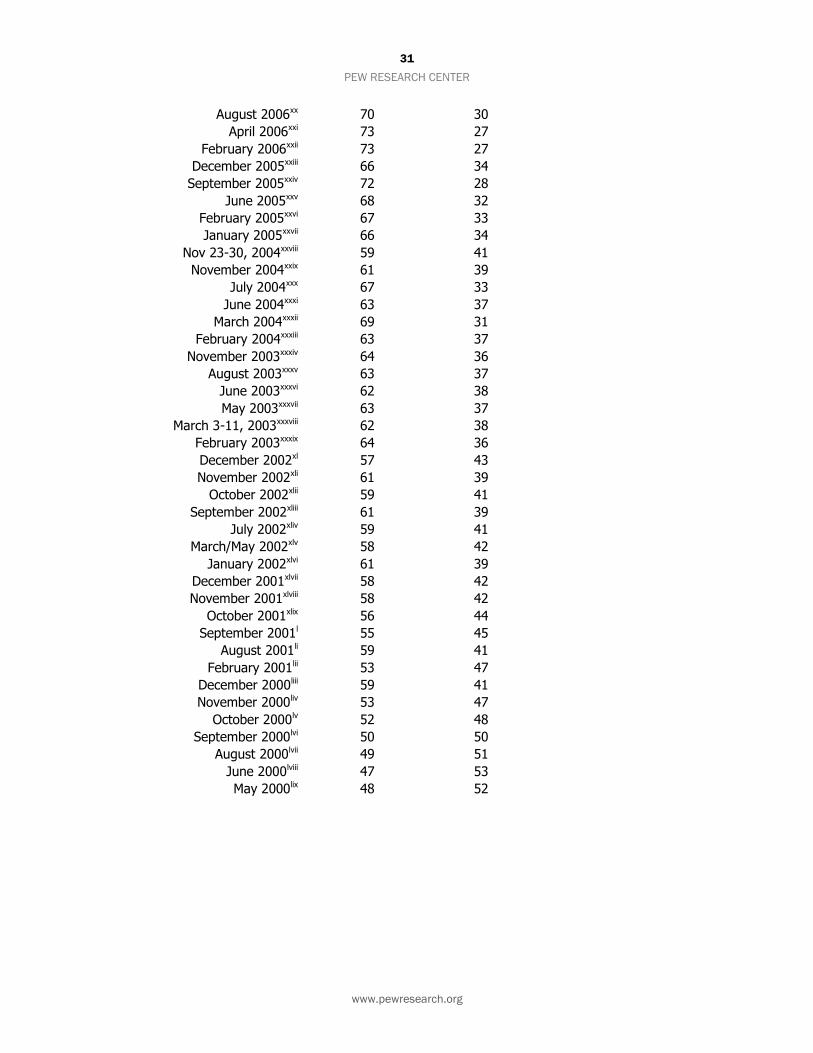
[READ TO ALL:] On a different subject... EMINUSE Do you use the internet or email, at least occasionally?
INTMOB Do you access the internet on a cellphone, tablet or other mobile handheld device, at least occasionally?36
Use internet Do not use internet
Current 80 20
May 2013 85 15
December 2012i 81 19
November 2012ii 85 15
September 2012 81 19
August 2012iii 85 15
April 2012 82 18
February 2012 80 20
December 2011 82 18
August 2011 78 22
May 2011 78 22
January 2011iv 79 21
December 2010v 77 23
November 2010vi 74 26
September 2010 74 26
May 2010 79 21
January 2010vii 75 25
December 2009viii 74 26
September 2009 77 23
April 2009 79 21
December 2008 74 26
November 2008ix 74 26
August 2008x 75 25
July 2008xi 77 23
May 2008xii 73 27
April 2008xiii 73 27
January 2008xiv 70 30
December 2007xv 75 25
September 2007xvi 73 27
February 2007xvii 71 29
December 2006xviii 70 30
November 2006xix 68 32
36 The definition of an internet user varies from survey to survey. Prior to January 2005, internet users were defined as those who said yes to “Do you ever go online to access the Internet or World Wide Web or to send and receive email?” From January 2005 thru February 2012, an internet user is someone said yes to either “Do you use the internet, at least occasionally?” (INTUSE) OR “Do you send or receive email, at least occasionally?” (EMLOCC). From April 2012 thru December 2012, an internet user is someone said yes to any of three questions: INTUSE, EMLOCC or “Do you access the internet on a cellphone, tablet or other mobile handheld device, at least occasionally?” (INTMOB). In May 2013, half the sample was asked INTUSE/EMLOCC/INTMOB and half was asked EMINUSE/INTMOB. Those May 2013 trend results are for both forms combined.
31
PEW RESEARCH CENTER
www.pewresearch.org
August 2006xx 70 30
April 2006xxi 73 27
February 2006xxii 73 27
December 2005xxiii 66 34
September 2005xxiv 72 28
June 2005xxv 68 32
February 2005xxvi 67 33
January 2005xxvii 66 34
Nov 23-30, 2004xxviii 59 41
November 2004xxix 61 39
July 2004xxx 67 33
June 2004xxxi 63 37
March 2004xxxii 69 31
February 2004xxxiii 63 37
November 2003xxxiv 64 36
August 2003xxxv 63 37
June 2003xxxvi 62 38
May 2003xxxvii 63 37
March 3-11, 2003xxxviii 62 38
February 2003xxxix 64 36
December 2002xl 57 43
November 2002xli 61 39
October 2002xlii 59 41
September 2002xliii 61 39
July 2002xliv 59 41
March/May 2002xlv 58 42
January 2002xlvi 61 39
December 2001xlvii 58 42
November 2001xlviii 58 42
October 2001xlix 56 44
September 2001l 55 45
August 2001li 59 41
February 2001lii 53 47
December 2000liii 59 41
November 2000liv 53 47
October 2000lv 52 48
September 2000lvi 50 50
August 2000lvii 49 51
June 2000lviii 47 53
May 2000lix 48 52
32
PEW RESEARCH CENTER
www.pewresearch.org
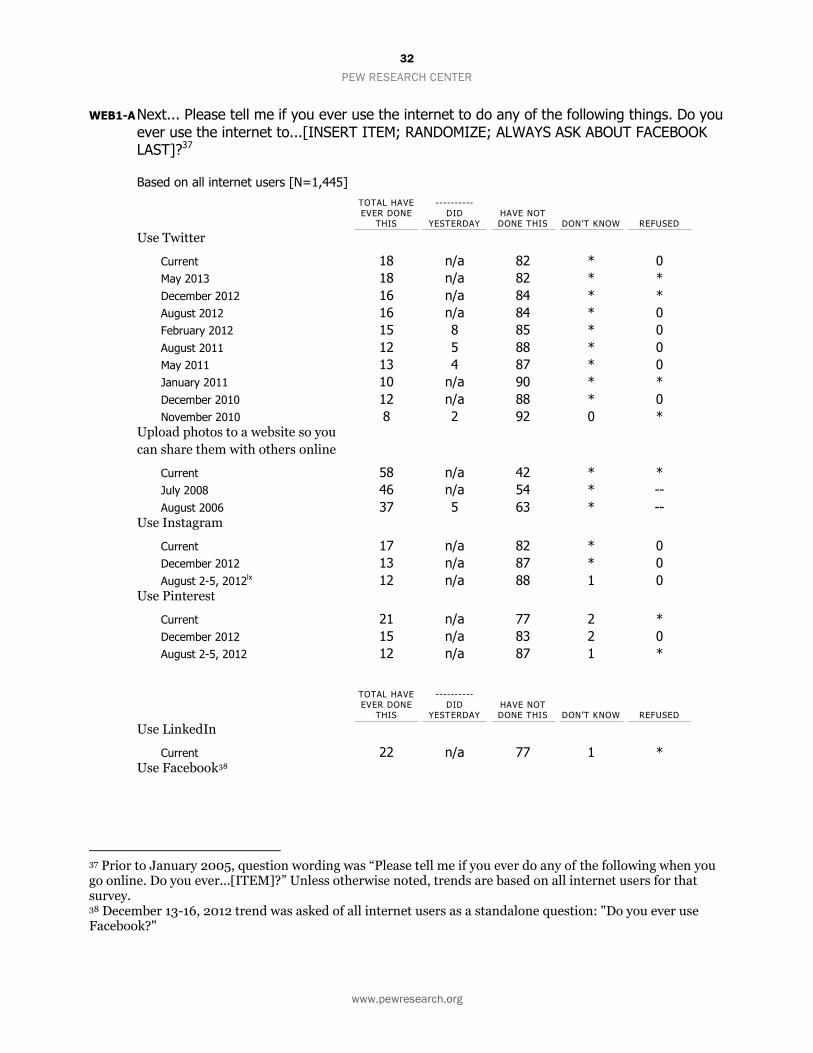
WEB1-A Next... Please tell me if you ever use the internet to do any of the following things. Do you ever use the internet to...[INSERT ITEM; RANDOMIZE; ALWAYS ASK ABOUT FACEBOOK LAST]?37
Based on all internet users [N=1,445]
TOTAL HAVE
EVER DONE THIS
----------
DID YESTERDAY
HAVE NOT DONE THIS DON’T KNOW REFUSED
Use Twitter
Current 18 n/a 82 * 0
May 2013 18 n/a 82 * *
December 2012 16 n/a 84 * *
August 2012 16 n/a 84 * 0
February 2012 15 8 85 * 0
August 2011 12 5 88 * 0
May 2011 13 4 87 * 0
January 2011 10 n/a 90 * *
December 2010 12 n/a 88 * 0
November 2010 8 2 92 0 * Upload photos to a website so you
can share them with others online
Current 58 n/a 42 * *
July 2008 46 n/a 54 * --
August 2006 37 5 63 * -- Use Instagram
Current 17 n/a 82 * 0
December 2012 13 n/a 87 * 0
August 2-5, 2012lx 12 n/a 88 1 0 Use Pinterest
Current 21 n/a 77 2 *
December 2012 15 n/a 83 2 0
August 2-5, 2012 12 n/a 87 1 *
TOTAL HAVE EVER DONE
THIS
---------- DID
YESTERDAY HAVE NOT DONE THIS DON’T KNOW REFUSED
Use LinkedIn
Current 22 n/a 77 1 * Use Facebook38
37 Prior to January 2005, question wording was “Please tell me if you ever do any of the following when you go online. Do you ever...[ITEM]?” Unless otherwise noted, trends are based on all internet users for that survey. 38 December 13-16, 2012 trend was asked of all internet users as a standalone question: "Do you ever use Facebook?"

33
PEW RESEARCH CENTER
www.pewresearch.org
Current 71 n/a 29 0 0
December 13-16, 2012lxi 67 n/a 33 0 *
QL1 Next... Do you have a cellphone, or not?39
yes no Don’t know Refused Current 89 11 0 0
May 2013 91 9 0 *
December 2012 87 13 * 0
November 2012 85 15 0 *
Sept 2012 85 15 * 0
August 2012 89 10 0 *
April 2012 88 12 * *
February 2012 88 12 0 *
December 2011 87 13 0 *
August 2011 84 15 * *
May 2011 83 17 * 0
January 2011 84 16 * *
December 2010 81 19 * *
November 2010 82 18 0 *
September 2010 85 15 * *
May 2010 82 18 * 0
January 2010 80 20 0 *
December 2009 83 17 0 *
September 2009 84 15 * *
April 2009 85 15 * *
Dec 2008 84 16 * *
July 2008 82 18 * --
May 2008 78 22 * 0
April 2008 78 22 * --
January 2008 77 22 * --
Dec 2007 75 25 * --
Sept 2007 78 22 * --
April 2006 73 27 * --
January 2005 66 34 * --
Nov. 23-30, 2004 65 35 * --
39 Question was asked of landline sample only. Results shown here have been recalculated to include cellphone sample in the "Yes" percentage. Beginning September 2007, question/item was not asked of the cellphone sample, but trend results shown here reflect Total combined Landline and cellphone sample. In past polls, question was sometimes asked as an independent question and sometimes as an item in a series. Wording may vary from survey to survey. Wording variations include: “Do you have a cellphone or a Blackberry or iPhone or other device that is also a cellphone?”; “Do you have...a cellphone or a Blackberry or iPhone or other handheld device that is also a cellphone?”; Do you have a cellphone, or a Blackberry or other device that is also a cellphone?"; "Do you happen to have a cellphone?"; " “Do you have a cellphone?”
34
PEW RESEARCH CENTER
www.pewresearch.org
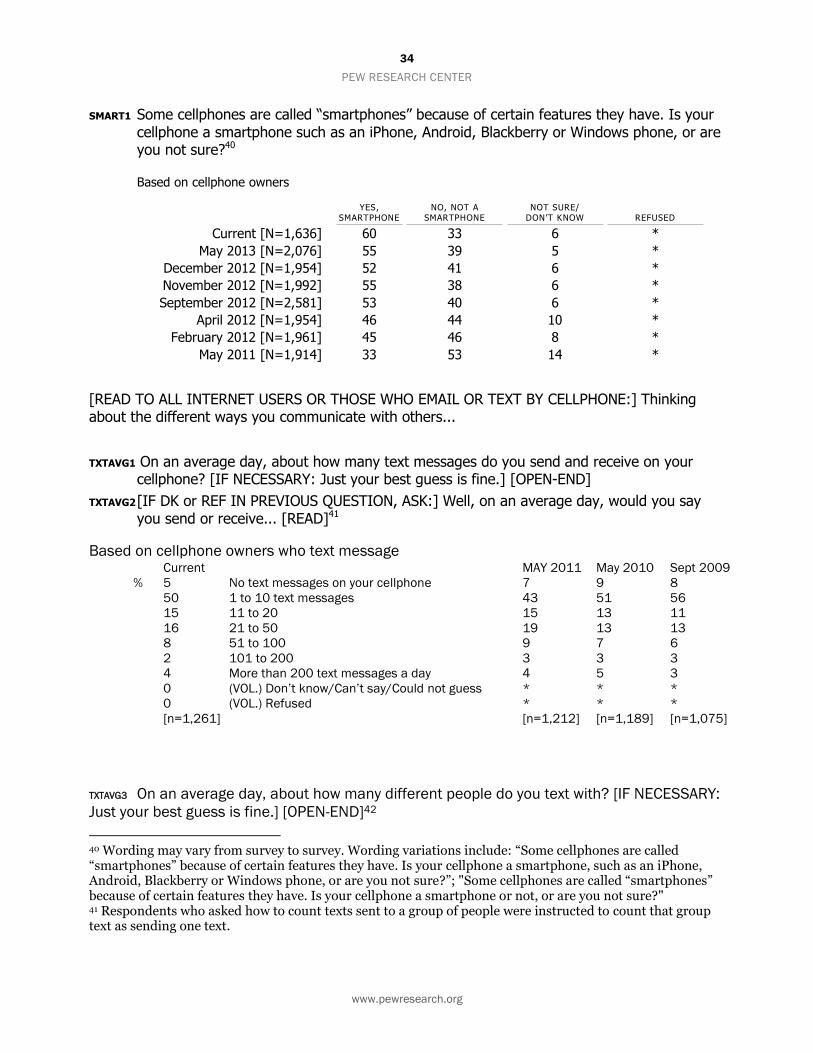
SMART1 Some cellphones are called “smartphones” because of certain features they have. Is your cellphone a smartphone such as an iPhone, Android, Blackberry or Windows phone, or are you not sure?40
Based on cellphone owners
YES, SMARTPHONE
NO, NOT A SMARTPHONE
NOT SURE/ DON’T KNOW REFUSED
Current [N=1,636] 60 33 6 *
May 2013 [N=2,076] 55 39 5 *
December 2012 [N=1,954] 52 41 6 *
November 2012 [N=1,992] 55 38 6 *
September 2012 [N=2,581] 53 40 6 *
April 2012 [N=1,954] 46 44 10 *
February 2012 [N=1,961] 45 46 8 *
May 2011 [N=1,914] 33 53 14 *
[READ TO ALL INTERNET USERS OR THOSE WHO EMAIL OR TEXT BY CELLPHONE:] Thinking about the different ways you communicate with others...
TXTAVG1 On an average day, about how many text messages do you send and receive on your cellphone? [IF NECESSARY: Just your best guess is fine.] [OPEN-END]
TXTAVG2 [IF DK or REF IN PREVIOUS QUESTION, ASK:] Well, on an average day, would you say you send or receive... [READ]41
Based on cellphone owners who text message Current MAY 2011 May 2010 Sept 2009
% 5 No text messages on your cellphone 7 9 8
50 1 to 10 text messages 43 51 56
15 11 to 20 15 13 11
16 21 to 50 19 13 13
8 51 to 100 9 7 6
2 101 to 200 3 3 3
4 More than 200 text messages a day 4 5 3
0 (VOL.) Don’t know/Can’t say/Could not guess * * *
0 (VOL.) Refused * * *
[n=1,261] [n=1,212] [n=1,189] [n=1,075]
TXTAVG3 On an average day, about how many different people do you text with? [IF NECESSARY:
Just your best guess is fine.] [OPEN-END]42
40 Wording may vary from survey to survey. Wording variations include: “Some cellphones are called “smartphones” because of certain features they have. Is your cellphone a smartphone, such as an iPhone, Android, Blackberry or Windows phone, or are you not sure?”; "Some cellphones are called “smartphones” because of certain features they have. Is your cellphone a smartphone or not, or are you not sure?" 41 Respondents who asked how to count texts sent to a group of people were instructed to count that group text as sending one text.
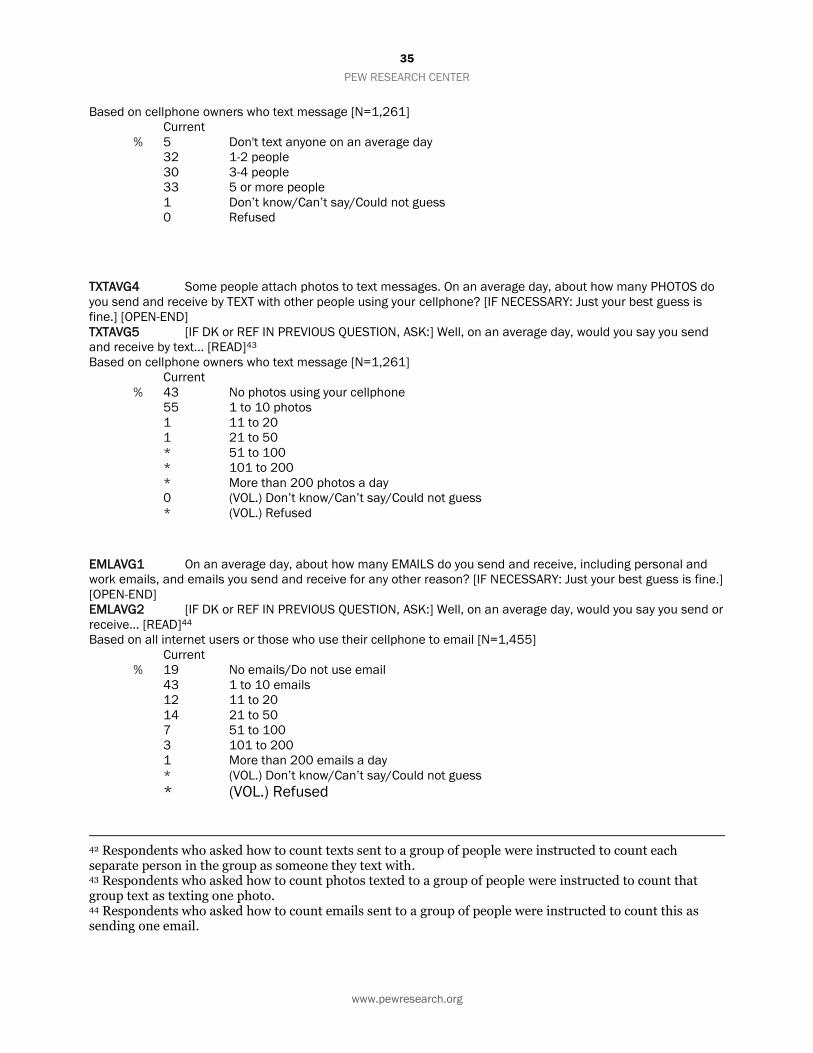
35
PEW RESEARCH CENTER
www.pewresearch.org
Based on cellphone owners who text message [N=1,261]
Current
% 5 Don't text anyone on an average day
32 1-2 people
30 3-4 people
33 5 or more people
1 Don’t know/Can’t say/Could not guess
0 Refused
TXTAVG4 Some people attach photos to text messages. On an average day, about how many PHOTOS do
you send and receive by TEXT with other people using your cellphone? [IF NECESSARY: Just your best guess is
fine.] [OPEN-END]
TXTAVG5 [IF DK or REF IN PREVIOUS QUESTION, ASK:] Well, on an average day, would you say you send
and receive by text... [READ]43
Based on cellphone owners who text message [N=1,261]
Current
% 43 No photos using your cellphone
55 1 to 10 photos
1 11 to 20
1 21 to 50
* 51 to 100
* 101 to 200
* More than 200 photos a day
0 (VOL.) Don’t know/Can’t say/Could not guess
* (VOL.) Refused
EMLAVG1 On an average day, about how many EMAILS do you send and receive, including personal and
work emails, and emails you send and receive for any other reason? [IF NECESSARY: Just your best guess is fine.]
[OPEN-END]
EMLAVG2 [IF DK or REF IN PREVIOUS QUESTION, ASK:] Well, on an average day, would you say you send or
receive... [READ]44
Based on all internet users or those who use their cellphone to email [N=1,455]
Current
% 19 No emails/Do not use email
43 1 to 10 emails
12 11 to 20
14 21 to 50
7 51 to 100
3 101 to 200
1 More than 200 emails a day
* (VOL.) Don’t know/Can’t say/Could not guess
* (VOL.) Refused
42 Respondents who asked how to count texts sent to a group of people were instructed to count each separate person in the group as someone they text with. 43 Respondents who asked how to count photos texted to a group of people were instructed to count that group text as texting one photo. 44 Respondents who asked how to count emails sent to a group of people were instructed to count this as sending one email.
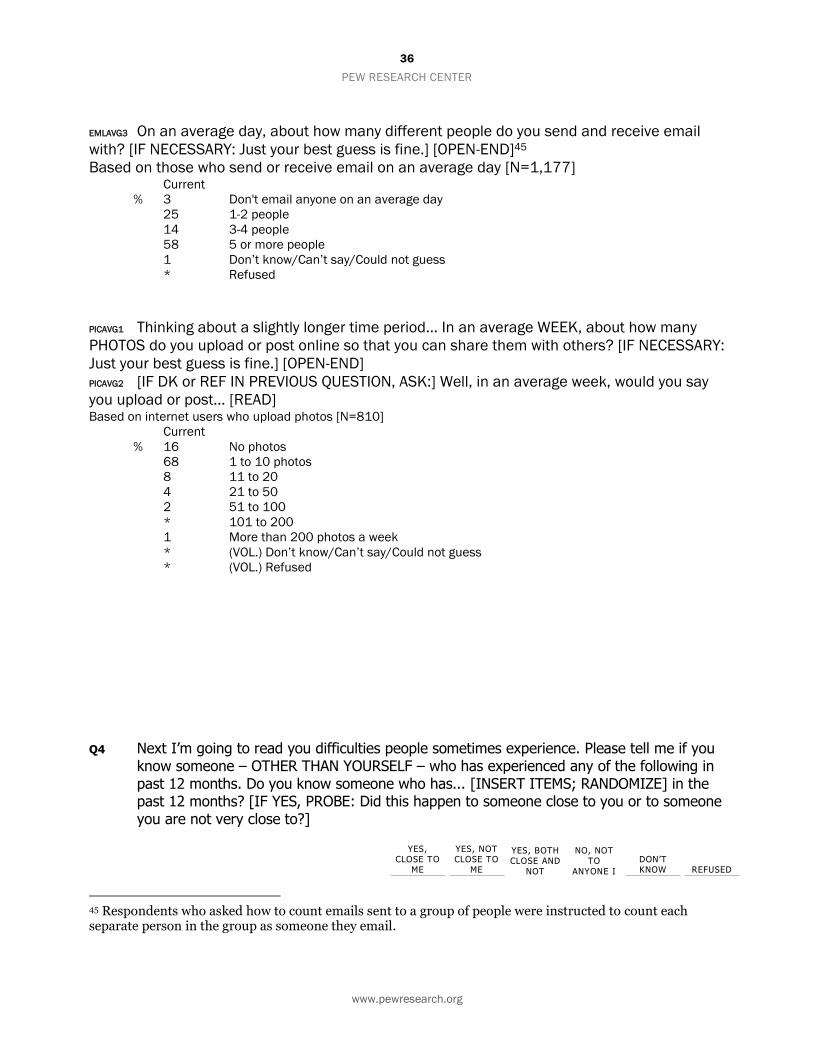
36
PEW RESEARCH CENTER
www.pewresearch.org
EMLAVG3 On an average day, about how many different people do you send and receive email
with? [IF NECESSARY: Just your best guess is fine.] [OPEN-END]45
Based on those who send or receive email on an average day [N=1,177] Current
% 3 Don't email anyone on an average day
25 1-2 people
14 3-4 people
58 5 or more people
1 Don’t know/Can’t say/Could not guess
* Refused
PICAVG1 Thinking about a slightly longer time period... In an average WEEK, about how many
PHOTOS do you upload or post online so that you can share them with others? [IF NECESSARY:
Just your best guess is fine.] [OPEN-END]
PICAVG2 [IF DK or REF IN PREVIOUS QUESTION, ASK:] Well, in an average week, would you say
you upload or post... [READ] Based on internet users who upload photos [N=810]
Current
% 16 No photos
68 1 to 10 photos
8 11 to 20
4 21 to 50
2 51 to 100
* 101 to 200
1 More than 200 photos a week
* (VOL.) Don’t know/Can’t say/Could not guess
* (VOL.) Refused
Q4 Next I’m going to read you difficulties people sometimes experience. Please tell me if you know someone – OTHER THAN YOURSELF – who has experienced any of the following in past 12 months. Do you know someone who has... [INSERT ITEMS; RANDOMIZE] in the past 12 months? [IF YES, PROBE: Did this happen to someone close to you or to someone you are not very close to?]
YES,
CLOSE TO ME
YES, NOT CLOSE TO
ME
YES, BOTH CLOSE AND
NOT
NO, NOT TO
ANYONE I
DON’T KNOW REFUSED
45 Respondents who asked how to count emails sent to a group of people were instructed to count each separate person in the group as someone they email.

37
PEW RESEARCH CENTER
www.pewresearch.org
CLOSE KNOW
a. Been hospitalized or experienced a serious accident or injury 36 12 2 50 0 *
b. Experienced the death of a child, partner, or spouse 22 13 1 63 * *
c. Gone through a marital separation or divorce 18 12 1 69 * *
d. Been fired or laid off 25 15 2 58 0 *
e. Been accused of or arrested for a crime 10 12 1 78 0 *
f. Started a new job 43 11 2 43 * *
g. Experienced a demotion or pay cut at work 17 8 1 74 * *
h. Been the victim of a robbery or physical assault 13 8 1 78 * 0
i. Had a child move out of the house or move back into the house 27 7 1 64 * *
j. Become engaged or married 31 17 1 50 * *
k. Become pregnant, given birth, or adopted a child 35 17 2 46 * *
l. Moved or changed homes 41 13 2 44 * *
SNS2 Thinking about the social networking sites you use... About how often do you visit or use [INSERT ITEMS; RANDOMIZE]? Several times a day, about once a day, 3-5 days a week, 1-2 days a week, every few weeks or less often?
SEVERAL TIMES A
DAY
ABOUT ONCE A
DAY
3-5 DAYS A
WEEK
1-2 DAYS A
WEEK
EVERY FEW
WEEKS
LESS
OFTEN
DON’T
KNOW REFUSED
Item A: Based on
Twitter users [N=223]
a. Twitter 29 17 10 11 12 20 1 0
Item B: Based on
Instagram users
[N=196]
b. Instagram 35 22 11 10 6 15 1 0
Item C: Based on
Pinterest users [N=272]
c. Pinterest 11 13 10 20 21 24 1 1
Item D: Based on
LinkedIn users [N=341]
d. LinkedIn 5 8 15 19 27 25 * *
Item E: Based on
Facebook users
[N=960]

38
PEW RESEARCH CENTER
www.pewresearch.org
e. Facebook 40 24 10 13 6 8 * 0
FB4 Thinking just about your Facebook profile... How many friends do you currently have in
your network? [IF NECESSARY: Just your best guess is fine.]
Based on Facebook users [N=960] Current
% 1 No friends
39 1-100 friends
23 101-250 friends
20 251-500 friends
15 More than 500 friends
2 Don’t know
1 Refused
FB8 How often, if ever, do you [INSERT ITEMS IN ORDER]? Several times a day, about once a day, 3-5 days a week, 1-2 days a week, every few weeks, less often, or never?
How often do you [INSERT NEXT ITEM]? [READ AS NECESSARY: Several times a day, about once a day, 3-5 days a week, 1-2 days a week, every few weeks, less often, or never?]
Based on Facebook users [N=960]
SEVERAL TIMES A
DAY
ABOUT ONCE A
DAY
3-5 DAYS
A WEEK
1-2 DAYS
A WEEK
EVERY FEW
WEEKS
LESS
OFTEN NEVER
DON’T
KNOW REFUSED
a. Change or update your status on Facebook 4 6 6 15 16 27 25 * *
b. Click the “like” button next to other people's status, photos, links or other posts on Facebook 29 15 12 13 9 12 10 1 *
c. Comment on other people's photos on Facebook 15 16 10 15 11 17 15 * *
d. Comment on other people’s status, photos, links or other posts on Facebook 16 15 12 15 10 18 15 * *
e. Send private Facebook messages 10 9 9 14 17 21 20 * *

39
PEW RESEARCH CENTER
www.pewresearch.org
REFERENCES
Adler, A., et al. (1964). Social interest: A challenge to mankind, Capricorn Books New York.
Aneshensel, C. (1992). Social Stress. Annual Review of Sociology. 18: 15-38.
Cobb, S. (1976). "Social Support as a Mediator of Life Stress." Psychosomatic medicine 38: 300-314.
Cohen, S., et al. (1983). "A global measure of perceived stress." Journal of health and social behavior: 385-396.
Coviello, L., et al. (2014). "Detecting Emotional Contagion in Massive Social Networks." PloS one 9(3): e90315.
Davis, M. H. (1983). "Measuring individual differences in empathy: Evidence for a multidimensional approach." Journal of Personality and Social Psychology 44(1): 113.
Dick, J. (2013). Why Do Social Networks Increase Stress? Huffington Post. http://www.huffingtonpost.com/john-dick/social-networks-and-stress_b_3534170.html.
Habuchi, I. (2005). Accelerating Reflexivity. Personal, Portable, Pedestrian: Mobile Phones in Japanese Life. M. Ito, D. Okabe and M. Matsuda. Cambridge, MA, MIT press: 165-182.
Hampton, K. N., et al. (2011). "Core Networks, Social Isolation, and New Media: Internet and Mobile Phone Use, Network Size, and Diversity." Information, Communication & Society 14(1): 130-155.
Holmes, T. H. and R. H. Rahe (1967). "The social readjustment rating scale." Journal of Psychosomatic Research 11(2): 213-218.
Kessler, R. C. and J. D. McLeod (1984). "Sex Difference in Vulnerability to Undesirable Life Events." American Sociological Review 49: 620-631.
Kim, H., et al. (2007). "Configurations of Relationships in Different Media." Journal of Computer-Mediated Communication 12(4): URL (consulted Oct. 2010): http://jcmc.indiana.edu/vol2012/issue2014/kim.html.

40
PEW RESEARCH CENTER
www.pewresearch.org
Kotenko, J. (2013). Ladies, your love-hate relationship with the internet is stressing you out. Digital Trends. http://www.digitaltrends.com/social-media/can-too-much-social-media-exposure-cause-stress-in-women/.
Kramer, A. D. I., et al. (2014). "Experimental evidence of massive-scale emotional contagion through social networks." Proceedings of the National Academy of Sciences 111(24): 8788-8790.
Ling, R. S. (2008). New Tech, New Ties. Cambridge, MA, MIT Press.
Lyons, R. F., et al. (1998). "Coping as a Communial Process." Journal of Social and Personal Relationships 15(5): 579-605.
Pennebaker, J. W., et al. (2001). Disclosing and sharing emotion: Psychological, social, and health consequences. Handbook of bereavement research: Consequences, coping, and care. M. S. Stroebe, R. O. Hansson, W. Stroebe and H. Schut. Washington, DC, American Psychological Association: 517-543.
Schieman, S. and H. A. Turner (2001). "When Feeling Other People's Pain Hurts: The Influence of Psychosocial Resources on the Association between Self-Reported Empathy and Depressive Symptoms." Social Psychology Quarterly: 376-389.
Smith, R. L. and A. J. Rose (2011). "The “cost of caring” in youths' friendships: Considering associations among social perspective taking, co-rumination, and empathetic distress." Developmental psychology 47(6): 1792.
Thomee, S. (2012). ICT use and mental health in young adults. Gothenburg, Sweden, University of Gothenburg
Turner, R. J., et al. (1995). "The Epidemiology of Social Stress." American Sociological Review 60(1): 104-125.
Turner, R. J., et al. (1995). "The epidemiology of social stress." American Sociological Review 60: 104-125.
Williams, R. (2013). Can more friends on facebook induce stress and anxiety? Psychology Today. http://www.psychologytoday.com/blog/wired-success/201307/can-more-friends-facebook-induce-stress-and-anxiety.

41
PEW RESEARCH CENTER
www.pewresearch.org
i December 2012 trends based on the 2012 Post-Election Tracking Survey, conducted November 14–December 9, 2012 [N=2,261, including 908 cellphone interviews].
ii November 2012 trends based on the Gates Library Services Survey, conducted October 15 – November 10, 2012 among those age 16 or older [N=2,252, including 1,125 cellphone interviews].
iii August 2012 trends based on the “Civic Engagement Tracking Survey” conducted July 16–August 7, 2012 [N=2,253, including 900 cellphone interviews].
iv January 2011 trends based on the Pew Internet Project/Project for Excellence in Journalism/Knight Foundation “Local News survey,” conducted January 12-25, 2011 [N=2,251, including 750 cellphone interviews].
v December 2010 trends based on the Social Side of the Internet survey, conducted November 23–December 21, 2010 [N=2,303, including 748 cellphone interviews].
vi November 2010 trends based on the Post-Election Tracking Survey 2010, conducted November 3-24, 2010 [N=2,257, including 755 cellphone interviews].
vii January 2010 trends based on the Online News survey, conducted December 28, 2009 – January 19, 2010 [N=2,259, including 562 cellphone interviews].
viii December 2009 trends based on the Fall Tracking “E-Government” survey, conducted November 30 – December 27, 2009 [N=2,258, including 565 cellphone interviews].
ix November 2008 trends based on the Post-Election 2008 Tracking survey, conducted November 20-December 4, 2008 [N=2,254].
x August 2008 trends based on the August Tracking 2008 survey, conducted August 12-31, 2008 [N=2,251].
xi July 2008 trends based on the Personal Networks and Community survey, conducted July 9-August 10, 2008 [N=2,512, including 505 cellphone interviews]
xii May 2008 trends based on the Spring Tracking 2008 survey, conducted April 8-May 11, 2008 [N=2,251].
xiii April 2008 trends based on the Networked Workers survey, conducted March 27-April 14, 2008. Most questions were asked only of full- or part-time workers [N=1,000], but trend results shown here reflect the total sample [N=2,134].
xiv January 2008 trends based on the Networked Families survey, conducted December 13, 2007-January 13, 2008 [N=2,252].
xv December 2007 trends based on the Annual Gadgets survey, conducted October 24-December 2, 2007 [N=2,054, including 500 cellphone interviews].
xvi September 2007 trends based on the Consumer Choice survey, conducted August 3-September 5, 2007 [N=2,400, oversample of 129 cellphone users].
xvii February 2007 trends based on daily tracking survey conducted February 15-March 7, 2007 [N=2,200].
xviii December 2006 trends based on daily tracking survey, conducted November 30 - December 30, 2006 [N=2,373].
xix November 2006 trends based on Post-Election tracking survey, conducted Nov. 8-Dec. 4, 2006 [N=2,562]. This includes an RDD sample [N=2,362] and a cellphone only sample [N=200]. Results reflect combined samples, where applicable.
xx August 2006 trends based on daily tracking survey, conducted August 1-31, 2006 [N=2,928].
xxi April 2006 trends based on the Annual Gadgets survey, conducted Feb. 15-Apr. 6, 2006 [N=4,001].
xxii February 2006 trends based on the Exploratorium Survey, conducted Jan. 9-Feb. 6, 2006 [N=2,000].
xxiii December 2005 trends based on daily tracking survey conducted Nov. 29-Dec. 31, 2005 [N=3,011].
xxiv September 2005 trends based on daily tracking survey conducted Sept. 14-Oct.13, 2005 [N=2,251].
xxv June 2005 trends based on the Spyware Survey, conducted May 4-June 7, 2005 [N=2,001].
xxvi February 2005 trends based on daily tracking survey conducted Feb. 21-March 21, 2005 [N=2,201].
xxvii January 2005 trends based on daily tracking survey conducted Jan. 13-Feb.9, 2005 [N=2,201].
xxviii November 23-30, 2004 trends based on the November 2004 Activity Tracking Survey, conducted November 23-30, 2004 [N=914].

42
PEW RESEARCH CENTER
www.pewresearch.org
xxix November 2004 trends based on the November Post-Election Tracking Survey, conducted Nov 4-Nov 22, 2004 [N=2,200].
xxx July 2004 trends based on the “Selective Exposure” survey, conducted June 14-July 3, 2004 [N=1,510].
xxxi June 2004 trends based on daily tracking survey conducted May 14-June 17, 2004 [N=2,200].
xxxii March 2004 trends based on “Weak Ties” survey conducted February 17-March 17, 2004 [N=2,200].
xxxiii February 2004 trends based on daily tracking survey conducted February 3-March 1, 2004 [N=2,204].
xxxiv November 2003 trends based on daily tracking survey conducted November 18-December 14, 2003 [N=2,013].
xxxv August 2003 trends based on ‘E-Government’ survey conducted June 25-August 3, 2003 [N=2,925].
xxxvi June 2003 trends based on ‘Internet Spam’ survey conducted June 10-24, 2003 [N=2,200].
xxxvii May 2003 trends based on daily tracking survey conducted April 29-May 20, 2003 [N=1,632].
xxxviii March 3-11, 2003 trends based on daily tracking survey conducted March 3-11, 2003 [N=743].
xxxix February 2003 trends based on daily tracking survey conducted February 12-March 2, 2003 [N=1,611].
xl December 2002 trends based on daily tracking survey conducted Nov. 25–Dec. 22, 2002 [N=2,038].
xli November 2002 trends based on daily tracking survey conducted October 28-November 24, 2002 [N=2,745].
xlii October 2002 trends based on daily tracking survey conducted October 7-27, 2002 [N=1,677].
xliii September 2002 trends based on daily tracking survey conducted September 9-October 6, 2002 [N=2,092].
xliv July 2002 trends based on ‘Sept. 11th-The Impact Online’ survey conducted June 26-July 26, 2002 [N=2,501].
xlv March/May 2002 trends based on daily tracking surveys conducted March 1-31, 2002 and May 2-19, 2002.
xlvi January 2002 trends based on a daily tracking survey conducted January 3-31, 2002.
xlvii December 2001 trends represent a total tracking period of December 1-23, 2001 [N=3,214]. This tracking period based on daily tracking surveys conducted December 17-23, 2001 and November 19-December 16, 2001.
xlviii November 2001 trends represent a total tracking period of November 1-30, 2001 [N=2,119]. This tracking period based on daily tracking surveys conducted October 19 – November 18, 2001 and November 19 – December 16, 2001.
xlix October 2001 trends represent a total tracking period of October 1-31, 2001 [N=1,924]. This tracking period based on daily tracking surveys conducted September 20 – October 1, 2001, October 2-7, 2001, October 8-18, 2001, and October 19 – November 18, 2001.
l September 2001 trends represent a total tracking period of September 1-30, 2001 [N=742]. This tracking period based on daily tracking surveys conducted August 13-September 10, 2001, September 12-19, 2001 and September 20 – October 1, 2001.
li August 2001 trends represent a total tracking period of August 13-31, 2001 [N=1,505]. This tracking period based on a daily tracking survey
conducted August 13-September 10, 2001.
lii February 2001 trends based on a daily tracking survey conducted February 1, 2001-March 1, 2001 [N=2,096].
liii December 2000 trends based on a daily tracking survey conducted December 2-22, 2000 [N=2,383].
liv November 2000 trends based on a daily tracking survey conducted November 2 – December 1, 2000 [N=6,321].
lv October 2000 trends based on a daily tracking survey conducted October 2 – November 1, 2000 [N=3,336].
lvi September 2000 trends based on a daily tracking survey conducted September 15 – October 1, 2000 [N=1,302].
lvii August 2000 trends based on a daily tracking survey conducted July 24 – August 20, 2000 [N=2,109].
lviii June 2000 trends based on a daily tracking survey conducted May 2 – June 30, 2000 [N=4,606].
lix May 2000 trends based on a daily tracking survey conducted March 1 – May 1, 2000 [N=6,036].
lx August 2-5, 2012 trends based on an omnibus survey conducted August 2-5, 2012 [N=1,005, including 405 cellphone interviews]. Omnibus survey not conducted as a tracking survey.

43
PEW RESEARCH CENTER
www.pewresearch.org
lxi December 13-16, 2012 trends based on an omnibus survey conducted December 13-16, 2012 [N=1,006, including 405 cellphone interviews]. Omnibus survey not conducted as a tracking survey.