numerical implementation and …ascjournal.com/down/vol3no1/vol3no1_5.pdftotal number of different...
TRANSCRIPT
Advanced Steel Construction Vol. 3, No. 1, pp. 459-484 (2007) 459
NUMERICAL IMPLEMENTATION AND CALIBRATION OF A HYSTERETIC MODEL WITH PINCHING FOR
THE CYCLIC RESPONSE OF STEEL JOINTS
Pedro Nogueiro1, Luís Simões da Silva2,*, Rita Bento3 and Rui Simões4
1Department of Applied Mechanics, Polytechnic Institute of Bragança, Bragança, Portugal 2Department of Civil Engineering, University of Coimbra – Polo I, Pinhal de Marrocos, 3030 Coimbra, Portugal
*(Corresponding author: E-mail: [email protected] 3Department of Civil Engineering, Instituto Superior Técnico, Av. Rovisco Pais, Lisboa, Portugal
4Department of Civil Engineering, University of Coimbra – Polo II, Pinhal de Marrocos, 3030 Coimbra, Portugal
Received: 2 March 2006; Revised: 20 May 2006; Accepted: 24 May 2006
ABSTRACT: In this paper, a hysteretic model with pinching is presented that is able to reproduce realistically the cyclic response of generic steel joints. Secondly, the computer implementation and adaptation of the model in a spring element within the computer code SeismoStruct is described. The model is subsequently calibrated using a series of experimental test results for steel joints subjected to cyclic loading. Finally, typical parameters for the various joint configurations are proposed.
Keywords: structural engineering, steel structures, buildings, component method, beam-to-column joints, dynamic behaviour, seismic behaviour, joint model
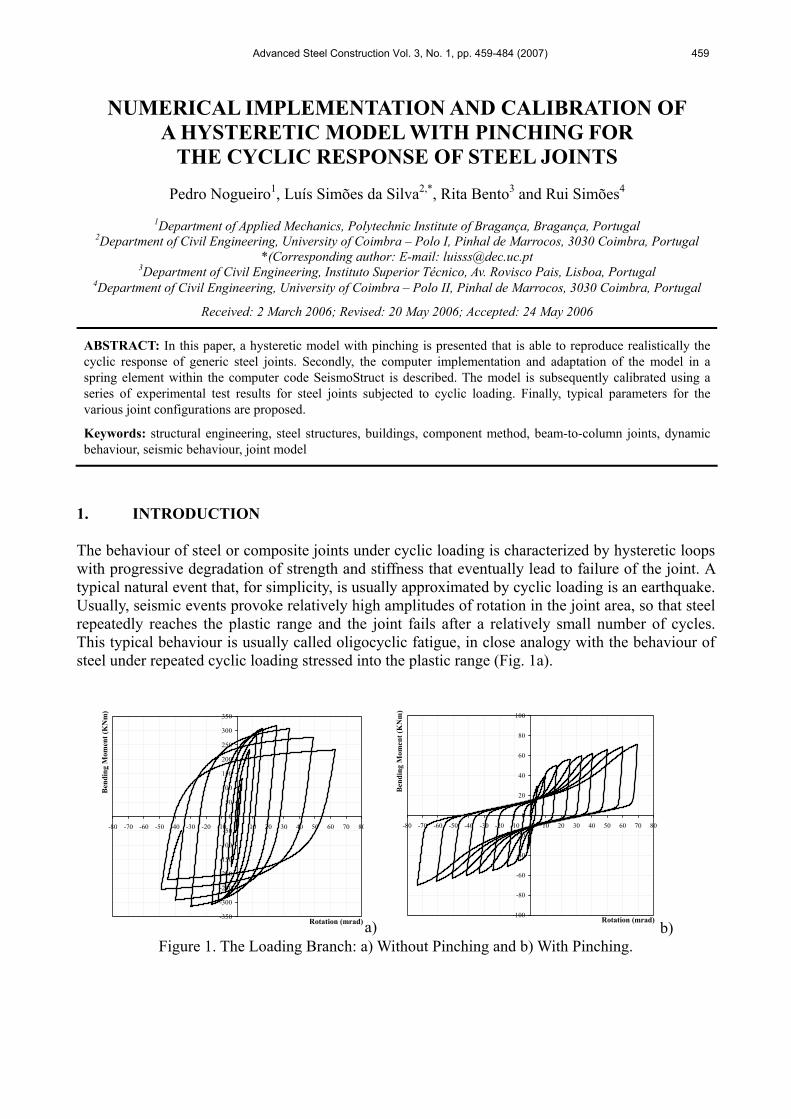
1. INTRODUCTION The behaviour of steel or composite joints under cyclic loading is characterized by hysteretic loops with progressive degradation of strength and stiffness that eventually lead to failure of the joint. A typical natural event that, for simplicity, is usually approximated by cyclic loading is an earthquake. Usually, seismic events provoke relatively high amplitudes of rotation in the joint area, so that steel repeatedly reaches the plastic range and the joint fails after a relatively small number of cycles. This typical behaviour is usually called oligocyclic fatigue, in close analogy with the behaviour of steel under repeated cyclic loading stressed into the plastic range (Fig. 1a).
-350
-300
-250
-200
-150
-100
-50
0
50
100
150
200
250
300
350
-80 -70 -60 -50 -40 -30 -20 -10 0 10 20 30 40 50 60 70 80
Rotation (mrad)
Ben
ding
Mom
ent (
KN
m)
a) -100
-80
-60
-40
-20
0
20
40
60
80
100
-80 -70 -60 -50 -40 -30 -20 -10 0 10 20 30 40 50 60 70 80
Rotation (mrad)
Ben
ding
Mom
ent (
KN
m)
b) Figure 1. The Loading Branch: a) Without Pinching and b) With Pinching.
460 Pedro Nogueiro, Luís Simões da Silva, Rita Bento and Rui Simoes
Predicting the behaviour of steel and composite joints is quite complex, because it combines several phenomena such as material non-linearity (plasticity, strain-hardening), non-linear contact and slip, geometrical non-linearity (local instability), residual stress conditions and complicated geometrical configurations. Under cyclic loading, this behaviour is further complicated by successive static loading and unloading, as illustrated in Fig. 1b, where the characteristic pinching effect in the loading branches is clearly visible. For static monotonic situations it is nowadays possible to accurately predict the moment-rotation response of a fairly wide range of joint configurations by applying the principles of the component method (Eurocode 3 [18]; Jaspart [21]). However, this is not the case for the cyclic situation. In this case, the usual approach is to develop multi-parameter mathematical expressions that are able to reproduce the range of hysteretic behaviours for a given group of steel joint typologies. Subsequently, the values of the parameters are calibrated to satisfactorily correlate to a range of section sizes for a given group of joint typologies. Historically, two mathematical formulas have provided the basis for most of the models that have been proposed in the literature: Ramberg-Osgood type mathematical expressions (Ramberg and Osgood [38]), that usually express strain (generalized displacement) as a non-linear function of stress (generalized force) and Richard-Abbott type mathematical expressions (Richard and Abbott [39]), that usually relate generalized force (stress) with generalized displacement (strain). Ramberg-Osgood based mathematical models were first used by Popov and Pinkey [36] to model hysteresis loops of non-slip specimens and later applied to model the skew symmetric moment-rotation hysteretic behaviour of connections made by direct welding of flanges with or without connection plate (Popov and Bertero [35]). Mazzolani [28] developed a comprehensive model based on the Ramberg-Osgood expressions that was able to simulate the pinching effect, later modified by Simões et al. [43]) to allow for pinching to start in the unloading zone. It is noted that models based on the Ramberg-Osgood expressions present the disadvantage of expressing strain as a function of stress, which clearly complicates its integration in displacement-based finite element codes (that constitute the majority of the available applications) or the direct application for the calibration and evaluation of test results, almost always carried out under displacement-control once they reach the non-linear stage. The Richard-Abbott expression was first applied to the cyclic behaviour of joints by De Martino et al. [10]. Unfortunately, that implementation was not able to simulate the pinching effect (Simões et al. [43]). Subsequently, Della Corte et al. [11] proposed a new model, also based on the Richard-Abbott expressions, that was capable of overcoming this limitation and simulate the pinching effect, as well as strength and stiffness deterioration and the hardening effects. Since the mid 1980’s, several research projects on the cyclic behaviour of steel joints were undertaken in various research centres, comprising a total number of 39 research projects and 216 individual experimental tests. These tests are summarized in tables 1 to 5 and comprise steel joints, ranging from welded configurations to end-plate typologies. In general, the objective of these cyclic tests was the study of the seismic performance of the joints, following the observation of failures resulting from the Kobe and Northridge seismic events.

Numerical Implementation and Calibration of a Hysteretic Model with Pinching for the Cyclic Response of Steel Joints 461
Table 1. Welded Steel Joints
Beam
Column
Total number of research projects: 7 Total number of tests: 28
Total number of different load histories: 5
Authors (date)
N.º of tests
Joint Characterization
Load History
Main parameters investigated
Popov [34] 2
Internal welded joints with beams W460x74 (W18x50) and W610x113(W24x76) column sizes with 13 mm web continuity plates. (1)
Contribution of the panel zones and column web stiffeners (continuity plates) to joint flexibility in the post-elastic range of behaviour.
Elnashai and Elghazouli [16]
2
One half of two storey frame. Columns in H150x150x7x10, beams in H250x130x9x9 and column web stiffener with 9 mm thickness. One cyclic test and one pseudo-dynamic.
(4)
Investigate the effect of the joints rigidity on the member as well as the frame behaviour. Study the hysteretic joint behaviour.
Elnashai et al. [17]
2
Tests on external two-storey steel frames with rigid joints comprising welded beam (H250x130x9x9) to column (H150x150x7x10). (4)
Effect of the joint stiffness and capacity on frame response. In addition, a comparison between the behaviour of frames with bolted semi-rigid and fully welded rigid joint is carried out.
Mele et al. [29] 15
Welded beam-to-column joints with beams section IPE300 and columns section HEB160, HEB200 and HEB240 sections and continuity plates 10 mm thick.
(9)
Assessment of the cyclic behaviour, influence of the column size and panel zone design.
Dubina et al. [13]
2 Welded beam (IPE360) to column (HEB300) internal joints (2)
Initial stiffness, moment capacity and plastic rotation capacity.
Calado [8] 1 Welded steel beam (IPE300) to column
(HEB200) external joint. (2) Cyclic behaviour, modes of failure.
Grecea et al. [20]
4
Beam-to-column internal welded joints, comprising an H or I column to two cantilever beams, without transverse stiffener in column web.
(2)
Evaluation of cyclic rotation capacity.

462 Pedro Nogueiro, Luís Simões da Silva, Rita Bento and Rui Simoes
Table 2. Welded Flange and Bolted Web Steel Joints
Column
Bea
m
Total number of research projects: 8 Total number of tests: 38
Total number of different load histories: 6
Authors (date)
N.º of tests
Joint Characterization
Load History
Main parameters investigated
Popov [34] 5
Internal welded flanges and bolted webs joints. W460x74(W18x50) beams and W610x113(W24x76) columns, with 19 or 13 mm column web continuity plates.
(1)
Contribution of the panel zones and column web stiffeners (continuity plates) to joint flexibility in the post-elastic range of behaviour.
Plumier and Schleich [33]
2
One external joint and one internal joint, combining bare steel elements in section HEB300 and beams in section HEA260.
(2)
Contribution of the shear panel in the energy dissipation. Study the strength and rotation capacity joint.
Tsai et al. [46] 10
External beam to wide flange column joints, using bolted web welded flange. Beams sections W21x50, W21x62, W21x83 and W21x101. All columns W14x159. 8 mm doubler plate welded to the column panel zone in the first test. All specimens have continuity plates of thickness equal to beam flange thickness.
(5)
Quality of beam-flange groove welds, strength of specimens, beam’s plastic rotation capacity and effects of web-joint details.
Leon et al. [24, 25] 1
Interior joints, with beam W27x94 and the column W14x211, the panel zone incorporate four continuity plates and doubler plate on both sides of the column web.
(3)
Investigate the modes of failure in the region of the bottom flange, specially the effect of the composite concrete slab.
Lu et al. [27] 4
External joints with the flange beam (W36x150) welded to column (W14x311) and web beam bolted plate.
- Effect of the weld metal toughness.
Stojadinovic et al.
[44] 10
External joints with the flange beam welded to column and web beam bolted plates. W36x150, W30x99, W24x68 beam sizes and W14x120 to W14x257 column sizes.
(10)
Investigate the parameters beam size, panel zone strength and material properties of beam steel.
Yu and Uang [48]
4 External beam (W30x99) to column (W14x176) joints. (11)
Evaluate the effects of the near-failure loading and extra lateral bracing.
Dubina et al. [13]
2 Welded cover plates and web cleats beam (IPE360) to column (HEB300) internal joints
(2) Initial stiffness, moment capacity and plastic rotation capacity.
Numerical Implementation and Calibration of a Hysteretic Model with Pinching for the Cyclic Response of Steel Joints 463
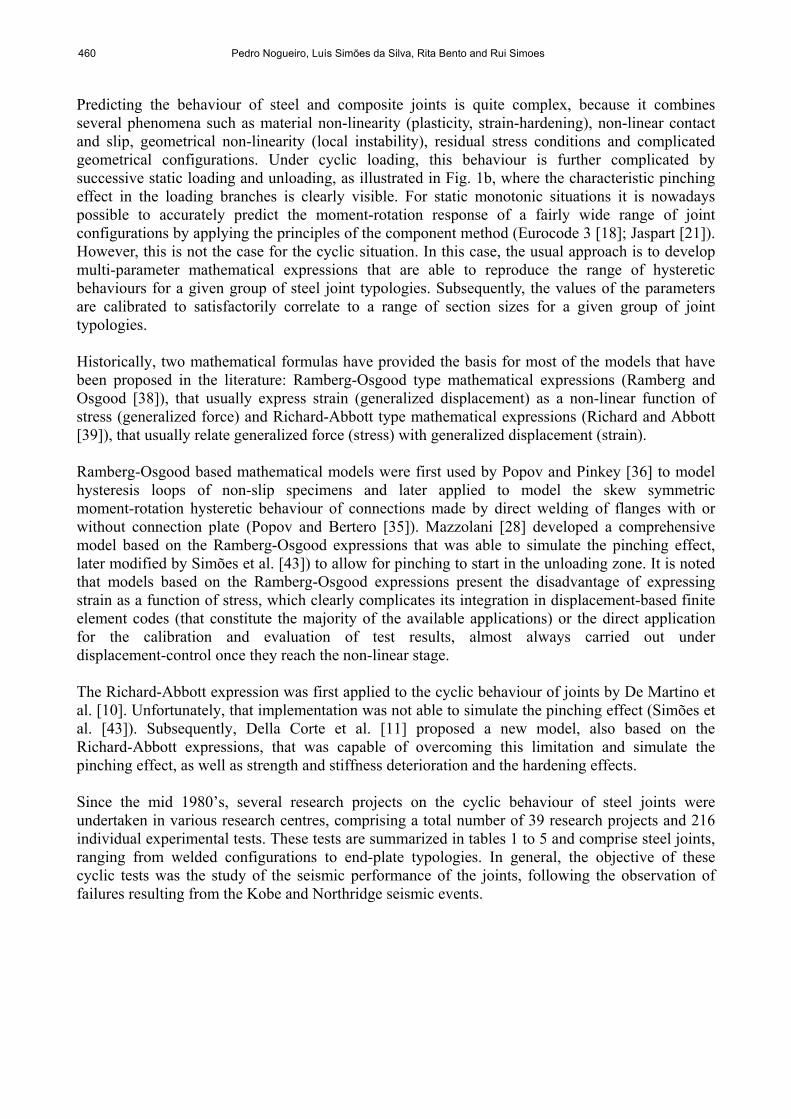
Table 3. Top and Seat Steel Joints
Bea
m
Column
Total number of research projects: 8 Total number of tests: 53
Total number of different load histories: 6
Authors (date)
N.º of
tests
Joint Characterization
Load History
Main parameters investigated
Elnashai and Elghazouli [16]
2
One half of the two storey frame. Columns in H150x150x7x10, beams in H250x130x9x9 and column web stiffener with 9mm thickness. One cyclic test and one pseudo-dynamic.
(4)
Investigate the effect of the semi-rigid joints on the member as well as the frame behaviour. Study the hysteretic joint behaviour.
Bernuzzi et al. [4]
4 + 1
External top and seat angle joints, with beam IPE300 attached to a rigid counterbeam. (2)
In the first series study the influence of load history. The second series study the influence of the key geometrical and mechanical parameters in the cyclic performance.
Elnashai et al. [17]
5
Tests on two-storey steel frames with semi rigid joints comprising of top, seat and web angles. Beams in H250x130x9x9 and UB 254x146x31 sections and columns in H150x150x7x10 and UC 203x203x6 sections.
(4)
Effect of the joint stiffness and capacity on frame response. In addition, a comparison between the behaviour of frames with bolted semi-rigid and fully welded rigid joint is carried out.
Shen and Astaneh-Asl [42]
6 Bolted-angle beam-to-column joints, with W360x179 column size. (7)
Inelastic behaviour under large cyclic deformation, failure modes and energy dissipation capacity.
Kukreti and Abolmaali [23]
12
Bolted top and seat angle steel joints with column W200x100 and beam sizes W360x64 and W410x67. (8)
Approach toward formulating analytical models to predict the moment-rotation hysteresis behaviour, including the initial stiffness, ultimate moment capacity, ultimate rotation.
Abolmaali et al. [1]
20
Double web angle external joints, with the angles bolted in beam and bolted in the column and welded-bolted. W410x67 beam size and W200x100 column size.
(8)
Moment-rotation hysteresis loops and the failure modes.
Calado [8] 1
Bolted top, seat and web angle steel external joint with IPE300 beam size and HEB200 column size.
(2)
Cyclic behaviour, modes of failure.
Leon et al. [26] 2
Top, web and seat angle external joints with W460x60 beam size and W360x216 column size.
(3) Strength, stiffness and rotation capacity.
464 Pedro Nogueiro, Luís Simões da Silva, Rita Bento and Rui Simoes
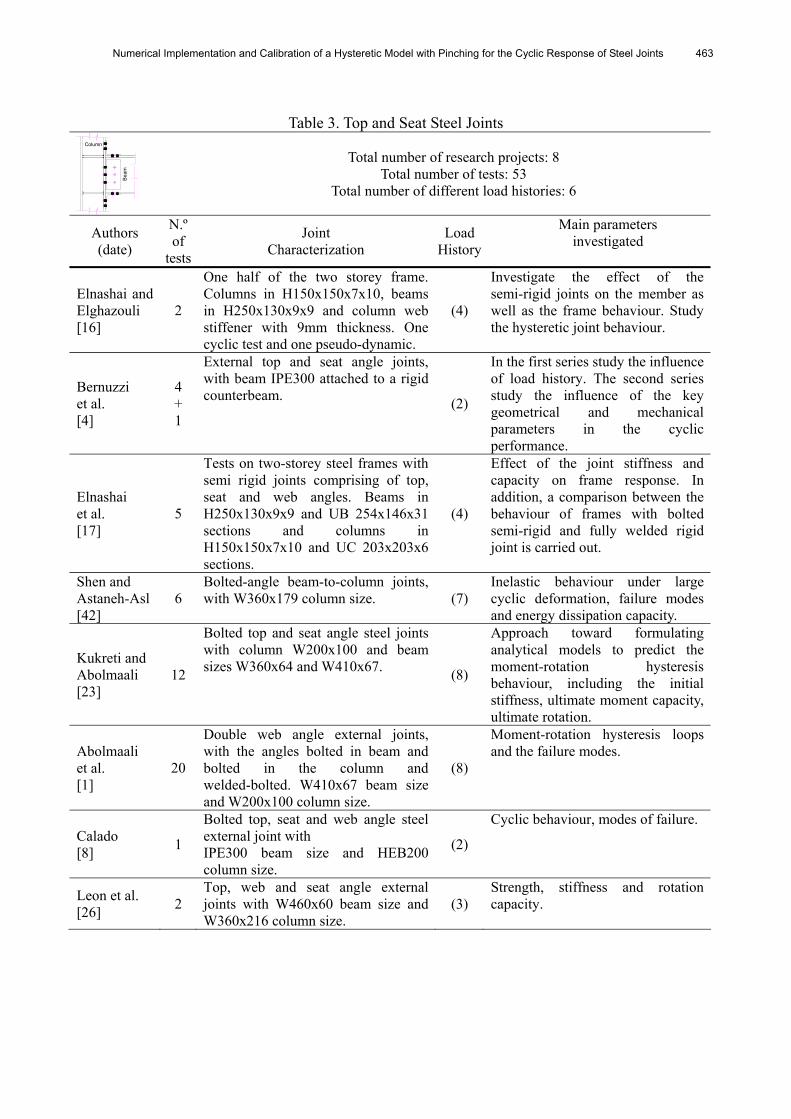
Table 4. Bolted End-plate Steel Joints
Beam
Column
Total number of research projects: 12 Total number of tests: 87
Total number of different load histories: 3
Authors (date)
N.º of tests
Joint Characterization
Load History
Main parameters investigated
Korol et al. [22] 7
External extended end plate joints with beam haunch, and with or without transverse web column stiffeners. Beams in W360x45 and W360x57, and columns in W360x64 and W360x79.
-
Seismic performance in terms of strength, stiffness, energy dissipation, and ductility. Influence of end-plate thickness, bolt pre-tension forces, column flange slenderness and column flange stiffeners.
Plumier and Schleich [33] 4
Two external joints and two internal joints, combining bare steel columns in sections HEB300 and beams in section HEA260.
(2)
Contribution of the shear panel in the energy dissipation. Study the strength and rotation capacity of the joint.
Pradhan and Bouwkamp [31]
-
High-strength bolted joints. Beams in HEA260 and columns in HEB300. Some tests are with beam and column filled-in reinforce concrete.
-
Interactive plastification of the beam-end and column shear web panel zone, shear panel thickness and contribution of the concrete.
Bernuzzi et al. [4]
4 + 5
External flush and extended end plate joints, with beam IPE300 attached to a rigid counter beam. (2)
First series studies the influence of load history. Second series studies the influence of the key geometrical and mechanical parameters in the cyclic performance.
Adey et al. [2] 8
Extended end-plate moment joints with two beam sizes W460x97 and W610x125 and one column size W310x143. End plate with 15.9 and 19.0 mm thick.
(6)
Effect of the beam size, bolt layout, end plate thickness and extension stiffeners.
Yorgun and Bayramoglu [47]
4 Bolted fabricated beam-to-column end-plate joints. (110x195) for beam and (160x135) column sizes.
(2) Effect on cyclic load of the gap between the end plate and the column flange on the performance of the joint.
Dubina et al. [13] 2
Bolted with extended end plate beam (IPE360) to column (HEB300) internal joints
(2) Initial stiffness, moment capacity and plastic rotation capacity.
Dubina et al. [14] 4
Bolted steel double-sided extended end-plate beam to column joints. (2)
Evaluate the performance of the beam-to-column extended end plate, and numerical modelling of joints.
Broderick and Thomson [5]
6
Flush end-plate steel external joints. UC 203x203x86 column sizes, 254x102x22UB and 254x146x37 UB beam sizes.
(2)
Stiffness, moment capacity, rotation capacity and hysteretic behaviour.
Bursi et al. [7] 18
Bolted steel double-sided extended end-plate beam to column external joints. IPE300 beam size, HEA180, HEB180 and HEA280 column sizes.
(2)
Joint geometry and loading history.
Summer and Murray [45]
6
Bare steel double extended end-plate beam-to-column external joints. Four combinations beam/column: W24x68/ W14x120, W30x99/W14/193 W36x150/W14x157, W24x68/W14x257.
(11)
Influence of the extended-end-plate in the strength, stiffness and joint ductility.
Dunai et al. [15] 19
Bolted end-plate joints with or without encased column. Columns in HEA200 or welded (6mm) changing the end plate thick, class and bolt diameters.
(2)
Study and characterise the typical cyclic behaviour failure modes of this type of joints.
Numerical Implementation and Calibration of a Hysteretic Model with Pinching for the Cyclic Response of Steel Joints 465
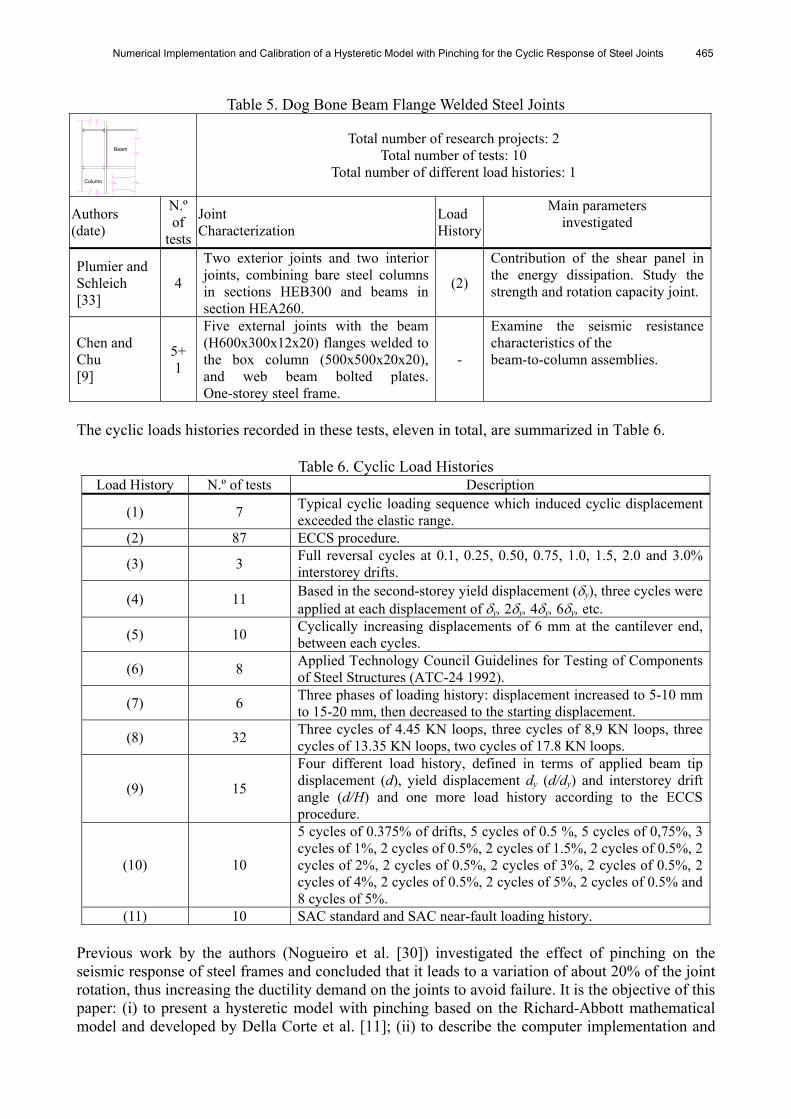
Table 5. Dog Bone Beam Flange Welded Steel Joints
Beam
Column
Total number of research projects: 2 Total number of tests: 10
Total number of different load histories: 1
Authors (date)
N.º of
tests
Joint Characterization
Load History
Main parameters investigated
Plumier and Schleich [33]
4
Two exterior joints and two interior joints, combining bare steel columns in sections HEB300 and beams in section HEA260.
(2)
Contribution of the shear panel in the energy dissipation. Study the strength and rotation capacity joint.
Chen and Chu [9]
5+1
Five external joints with the beam (H600x300x12x20) flanges welded to the box column (500x500x20x20), and web beam bolted plates. One-storey steel frame.
-
Examine the seismic resistance characteristics of the beam-to-column assemblies.
The cyclic loads histories recorded in these tests, eleven in total, are summarized in Table 6.
Table 6. Cyclic Load Histories Load History N.º of tests Description
(1) 7 Typical cyclic loading sequence which induced cyclic displacement exceeded the elastic range.
(2) 87 ECCS procedure.
(3) 3 Full reversal cycles at 0.1, 0.25, 0.50, 0.75, 1.0, 1.5, 2.0 and 3.0% interstorey drifts.
(4) 11 Based in the second-storey yield displacement (δy), three cycles were applied at each displacement of δy, 2δy, 4δy, 6δy, etc.
(5) 10 Cyclically increasing displacements of 6 mm at the cantilever end, between each cycles.
(6) 8 Applied Technology Council Guidelines for Testing of Components of Steel Structures (ATC-24 1992).
(7) 6 Three phases of loading history: displacement increased to 5-10 mm to 15-20 mm, then decreased to the starting displacement.
(8) 32 Three cycles of 4.45 KN loops, three cycles of 8,9 KN loops, three cycles of 13.35 KN loops, two cycles of 17.8 KN loops.
(9) 15
Four different load history, defined in terms of applied beam tip displacement (d), yield displacement dy (d/dy) and interstorey drift angle (d/H) and one more load history according to the ECCS procedure.
(10) 10
5 cycles of 0.375% of drifts, 5 cycles of 0.5 %, 5 cycles of 0,75%, 3 cycles of 1%, 2 cycles of 0.5%, 2 cycles of 1.5%, 2 cycles of 0.5%, 2 cycles of 2%, 2 cycles of 0.5%, 2 cycles of 3%, 2 cycles of 0.5%, 2 cycles of 4%, 2 cycles of 0.5%, 2 cycles of 5%, 2 cycles of 0.5% and 8 cycles of 5%.
(11) 10 SAC standard and SAC near-fault loading history. Previous work by the authors (Nogueiro et al. [30]) investigated the effect of pinching on the seismic response of steel frames and concluded that it leads to a variation of about 20% of the joint rotation, thus increasing the ductility demand on the joints to avoid failure. It is the objective of this paper: (i) to present a hysteretic model with pinching based on the Richard-Abbott mathematical model and developed by Della Corte et al. [11]; (ii) to describe the computer implementation and

466 Pedro Nogueiro, Luís Simões da Silva, Rita Bento and Rui Simoes
adaptation of the model in a spring element within the computer code SeismoStruct (SeismoStruct [41]; (iii) to apply and calibrate the model with a series of experimental test results for steel joints subjected to cyclic loading; and (iv) to compare and propose typical parameters for the chosen joint configurations. 2. MODIFIED RICHARD-ABBOTT MODEL The modified Richard-Abbott model was developed by Della Corte et al. [11], to include pinching. According to this model, the loading curve for a generic branch of the moment-rotation curve of a joint is given by the following equation:
( ) ( )( ) ( )
( )φφφφ
φφ−⋅−
⎥⎥⎦
⎤
⎢⎢⎣
⎡ −⋅−+
−⋅−−= npaNN
a
npaa
npaan k
Mkk
kkMM 1
0
1
(1)
where pna MMM 00 += . The unloading curve is obtained in the same way, replacing (Mn, φn) by (Mp, φp) and the parameters M0a, ka and kpa by the corresponding values evaluated at unloading, M0d, kd and kpd.
Figure 2. Generic Loading and Unloading Branches
To describe the pinching phenomenon, two limit curves are introduced, that represent a lower and an upper bounds to possible M-φ values. Both curves have a Richard-Abbott type law, and are characterised by parameters Kop, Mop, Khp, np (lower bound curve) and Ko, Mo, Kh, n (upper bound curve). Additionally, any generic point (M,φ) along the real path is also considered to belong to a Richard-Abbott type curve, where the relevant parameters are defined as follows:
Kot = Kop + (Ko - Kop) × t (2a) Mot = Mop + (Mo - Mop) × t (2b) Kht = Khp + (Kh – Khp) × t (2c) nt = np + (n - np) × t (2d) The parameter t, ranging in the interval [0,1], defines the transition law from the lower bound to the upper bound curve. It must reproduce, as closely as possible, the shape of the experimental curves and is given by:
Numerical Implementation and Calibration of a Hysteretic Model with Pinching for the Cyclic Response of Steel Joints 467
t = 2
1
1
1)/()/(
lim
lim
t
t
t
⎥⎦
⎤⎢⎣
⎡+φφ
φφ (3)
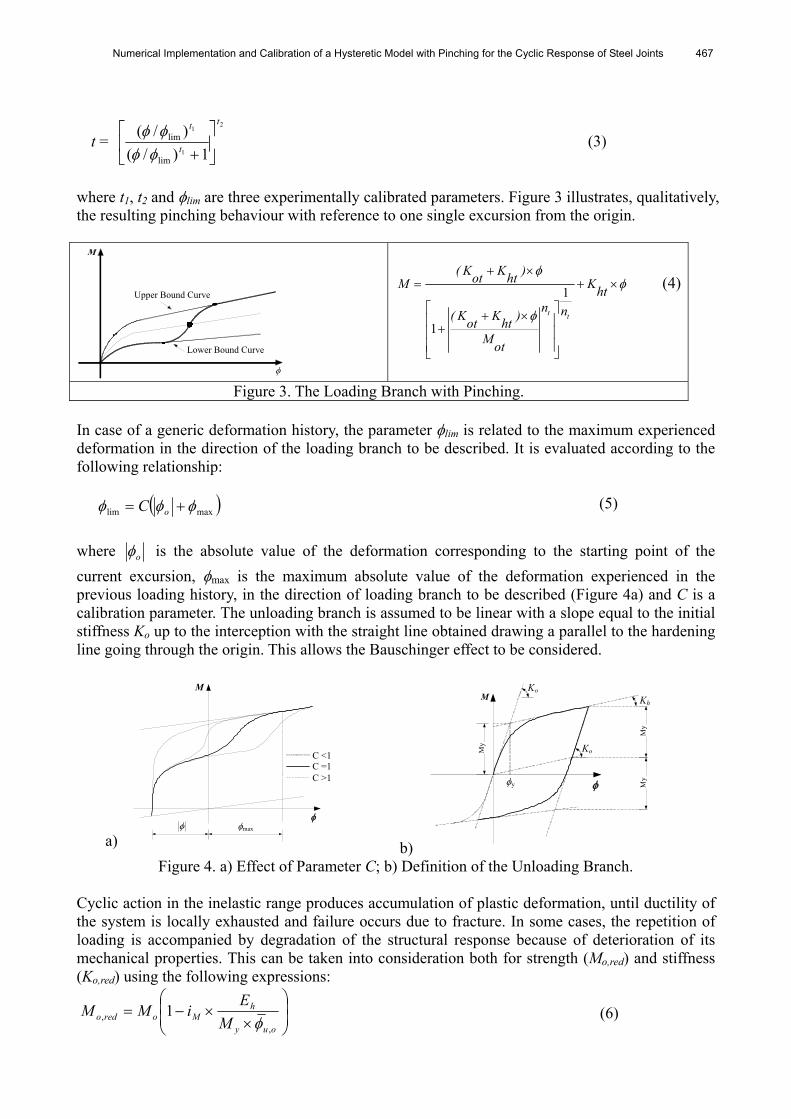
where t1, t2 and φlim are three experimentally calibrated parameters. Figure 3 illustrates, qualitatively, the resulting pinching behaviour with reference to one single excursion from the origin.
Upper Bound Curve
Lower Bound Curve
1
1t t
( K K )ot htM Khtn n( K K )ot ht
Mot
φφ
φ
+ ×= + ×
⎡ ⎤+ ×⎢ ⎥+⎢ ⎥⎢ ⎥⎣ ⎦
(4)
Figure 3. The Loading Branch with Pinching. In case of a generic deformation history, the parameter φlim is related to the maximum experienced deformation in the direction of the loading branch to be described. It is evaluated according to the following relationship:
( )maxlim φφφ += oC (5)
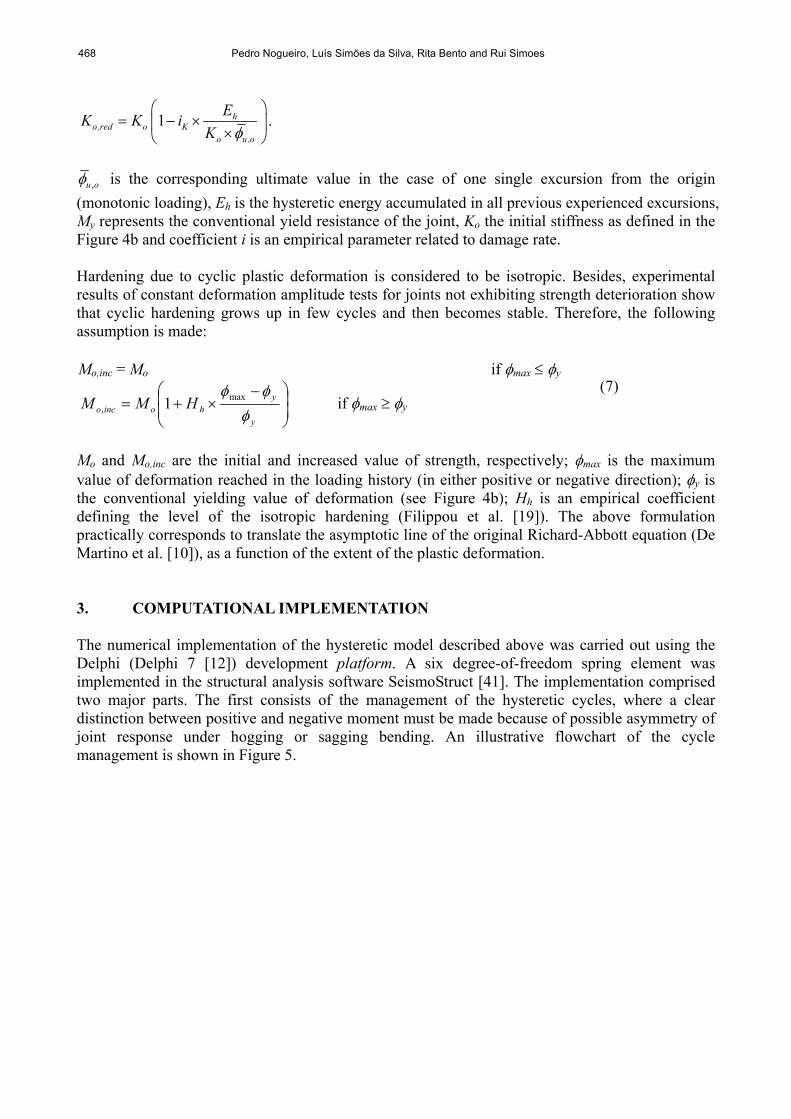
where oφ is the absolute value of the deformation corresponding to the starting point of the current excursion, φmax is the maximum absolute value of the deformation experienced in the previous loading history, in the direction of loading branch to be described (Figure 4a) and C is a calibration parameter. The unloading branch is assumed to be linear with a slope equal to the initial stiffness Ko up to the interception with the straight line obtained drawing a parallel to the hardening line going through the origin. This allows the Bauschinger effect to be considered.
a)
C <1 C =1 C >1
φmax
M
φφ
b)
Ko
Ko
φy
Kh
M
φ
My
My
My
Figure 4. a) Effect of Parameter C; b) Definition of the Unloading Branch.
Cyclic action in the inelastic range produces accumulation of plastic deformation, until ductility of the system is locally exhausted and failure occurs due to fracture. In some cases, the repetition of loading is accompanied by degradation of the structural response because of deterioration of its mechanical properties. This can be taken into consideration both for strength (Mo,red) and stiffness (Ko,red) using the following expressions:
⎟⎟⎠
⎞⎜⎜⎝
⎛
××−=
ouy
hMoredo M
EiMM
,, 1
φ
(6)
468 Pedro Nogueiro, Luís Simões da Silva, Rita Bento and Rui Simoes
1 ho,red o K
o u ,o
EK K iK φ
⎛ ⎞= − ×⎜ ⎟
×⎝ ⎠.
ou ,φ is the corresponding ultimate value in the case of one single excursion from the origin
(monotonic loading), Eh is the hysteretic energy accumulated in all previous experienced excursions, My represents the conventional yield resistance of the joint, Ko the initial stiffness as defined in the Figure 4b and coefficient i is an empirical parameter related to damage rate. Hardening due to cyclic plastic deformation is considered to be isotropic. Besides, experimental results of constant deformation amplitude tests for joints not exhibiting strength deterioration show that cyclic hardening grows up in few cycles and then becomes stable. Therefore, the following assumption is made: Mo,inc = Mo if φmax ≤ φy
⎟⎟⎠
⎞⎜⎜⎝
⎛ −×+=
y
yhoinco HMM
φφφmax
, 1 if φmax ≥ φy
(7)
Mo and Mo,inc are the initial and increased value of strength, respectively; φmax is the maximum value of deformation reached in the loading history (in either positive or negative direction); φy is the conventional yielding value of deformation (see Figure 4b); Hh is an empirical coefficient defining the level of the isotropic hardening (Filippou et al. [19]). The above formulation practically corresponds to translate the asymptotic line of the original Richard-Abbott equation (De Martino et al. [10]), as a function of the extent of the plastic deformation. 3. COMPUTATIONAL IMPLEMENTATION The numerical implementation of the hysteretic model described above was carried out using the Delphi (Delphi 7 [12]) development platform. A six degree-of-freedom spring element was implemented in the structural analysis software SeismoStruct [41]. The implementation comprised two major parts. The first consists of the management of the hysteretic cycles, where a clear distinction between positive and negative moment must be made because of possible asymmetry of joint response under hogging or sagging bending. An illustrative flowchart of the cycle management is shown in Figure 5.

Numerical Implementation and Calibration of a Hysteretic Model with Pinching for the Cyclic Response of Steel Joints 469
If Strn=0 Then Cycle:=1 StrnIncrOld:=0
StrnIncr:= Strn-StrO
If StrnIncr*StrnIncrOld<0 Then Cycle:= Cycle+1
Parameter:=0If initial load negative If initial load positive
If StrnIncr<0 and Cycle=1 Then Parameter:= -1
If StrnIncr>0 and Cycle=1 Then Parameter:=1
If StrnIncr>0 and Cycle=2 Then Parameter:= -2
If StrnIncr<0 and Cycle=2 Then Parameter:=2
If StrnIncr<0 and Cycle>2 and Odd (Cycle+1) Then Parameter:=4
If StrnIncr>0 and Cycle>2 and Odd (Cycle) Then Parameter:=3
If StrnIncr>0 and Cycle>2 and Odd (Cycle+1) Then Parameter:= -4
If StrnIncr<0 and Cycle>2 and Odd (Cycle) Then Parameter:= -3
StrnIncrOld:=StrnIncr
Figure 5. Flowchart for the Management of Hysteretic Cycles. The second part of the implementation relates to the development of the code for each cycle. Several possibilities must be considered, depending on the starting bending moment (positive or negative) and the sign of the strain increment (positive or negative), as can be seen in the figure 6a, b and c.
(a)
σ
ε
parameter 3
parameter 4
StrnO Strn
StrnIncr
StrsOStrs
(b)
σ
εcycle 2parameter 2
cycle 3parameter 3
cycle 4parameter 4
cycle 1parameter 1
(c)
σ
ε
cycle 1parameter -1
cycle 2parameter -2
cycle 3parameter -3
cycle 4parameter -4
(d)
σ
ε
cycle pairparameter pair
odd cycleodd parameter
(e)
σ
ε
odd cycleodd parameter
cycle pairparameter pair
Figure 6. a) Definition of the Increment; b) Hysteretic Curve for Positive Starting; c) Hysteretic Curve for Negative Starting; d) Small Loading for Odd Parameters, e) Pair Parameters.
470 Pedro Nogueiro, Luís Simões da Silva, Rita Bento and Rui Simoes
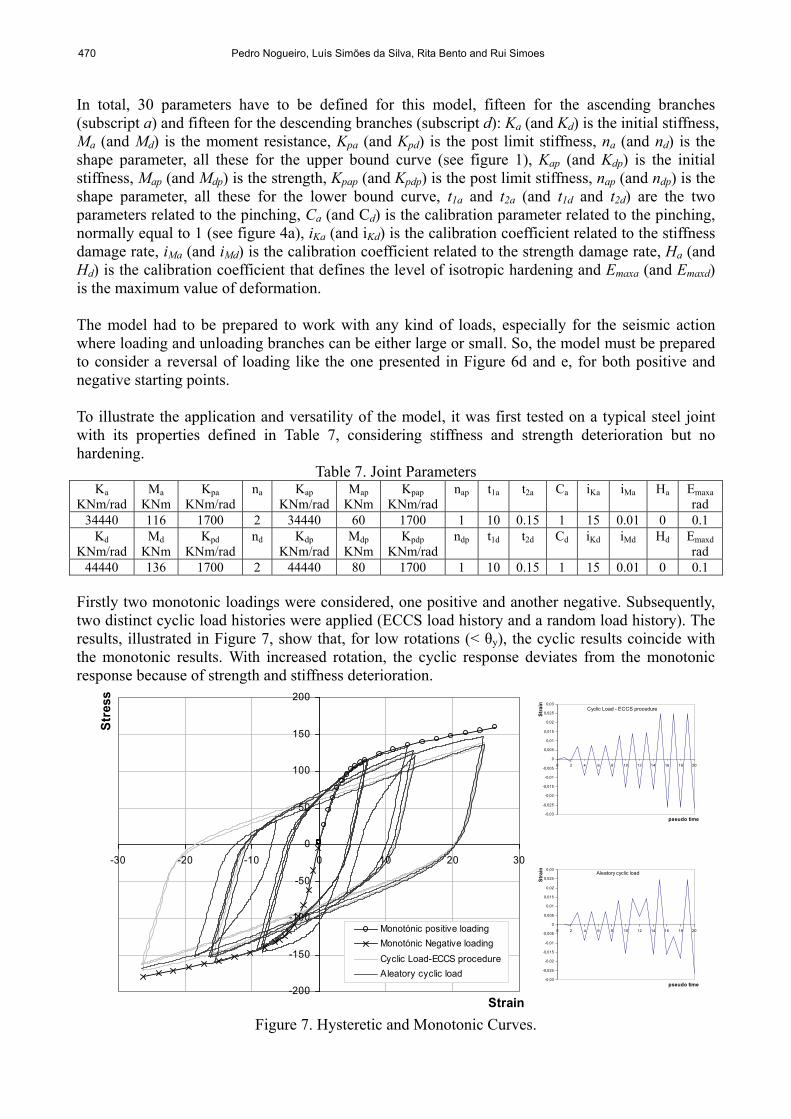
In total, 30 parameters have to be defined for this model, fifteen for the ascending branches (subscript a) and fifteen for the descending branches (subscript d): Ka (and Kd) is the initial stiffness, Ma (and Md) is the moment resistance, Kpa (and Kpd) is the post limit stiffness, na (and nd) is the shape parameter, all these for the upper bound curve (see figure 1), Kap (and Kdp) is the initial stiffness, Map (and Mdp) is the strength, Kpap (and Kpdp) is the post limit stiffness, nap (and ndp) is the shape parameter, all these for the lower bound curve, t1a and t2a (and t1d and t2d) are the two parameters related to the pinching, Ca (and Cd) is the calibration parameter related to the pinching, normally equal to 1 (see figure 4a), iKa (and iKd) is the calibration coefficient related to the stiffness damage rate, iMa (and iMd) is the calibration coefficient related to the strength damage rate, Ha (and Hd) is the calibration coefficient that defines the level of isotropic hardening and Emaxa (and Emaxd) is the maximum value of deformation. The model had to be prepared to work with any kind of loads, especially for the seismic action where loading and unloading branches can be either large or small. So, the model must be prepared to consider a reversal of loading like the one presented in Figure 6d and e, for both positive and negative starting points. To illustrate the application and versatility of the model, it was first tested on a typical steel joint with its properties defined in Table 7, considering stiffness and strength deterioration but no hardening.
Table 7. Joint Parameters Ka
KNm/rad Ma
KNm Kpa
KNm/rad na Kap
KNm/rad Map
KNm Kpap
KNm/rad nap t1a t2a Ca iKa iMa Ha Emaxa
rad 34440 116 1700 2 34440 60 1700 1 10 0.15 1 15 0.01 0 0.1
Kd KNm/rad
Md KNm
Kpd KNm/rad
nd Kdp KNm/rad
Mdp KNm
Kpdp KNm/rad
ndp t1d t2d Cd iKd iMd Hd Emaxd rad
44440 136 1700 2 44440 80 1700 1 10 0.15 1 15 0.01 0 0.1 Firstly two monotonic loadings were considered, one positive and another negative. Subsequently, two distinct cyclic load histories were applied (ECCS load history and a random load history). The results, illustrated in Figure 7, show that, for low rotations (< θy), the cyclic results coincide with the monotonic results. With increased rotation, the cyclic response deviates from the monotonic response because of strength and stiffness deterioration.
Cyclic Load - ECCS procedure
-0,03
-0,025
-0,02
-0,015
-0,01
-0,005
0
0,005
0,01
0,015
0,02
0,025
0,03
0 2 4 6 8 10 12 14 16 18 20
pseudo time
Stra
in
-200
-150
-100
-50
0
50
100
150
200
-30 -20 -10 0 10 20 30
Strain
Stre
ss
Monotónic positive loadingMonotónic Negative loadingCyclic Load-ECCS procedureAleatory cyclic load
Aleatory cyclic load
-0,03
-0,025
-0,02
-0,015
-0,01
-0,005
0
0,005
0,01
0,015
0,02
0,025
0,03
0 2 4 6 8 10 12 14 16 18 20
pseudo time
Stra
in
Figure 7. Hysteretic and Monotonic Curves.
Numerical Implementation and Calibration of a Hysteretic Model with Pinching for the Cyclic Response of Steel Joints 471
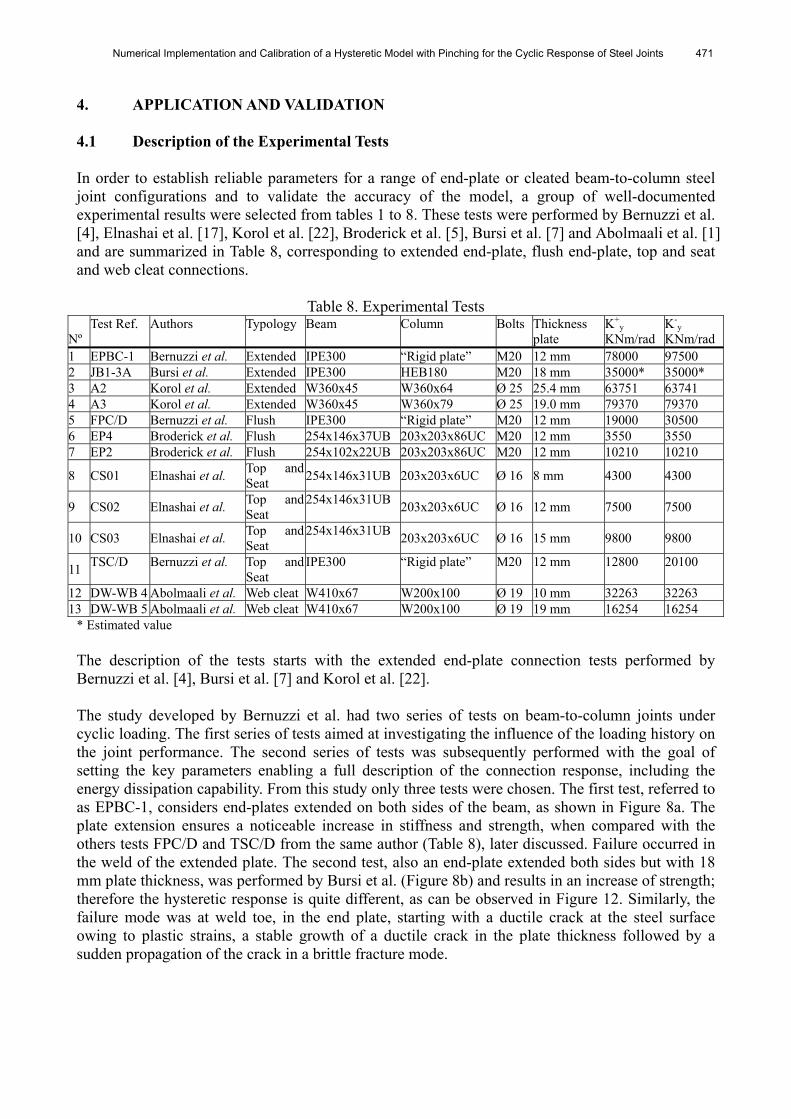
4. APPLICATION AND VALIDATION 4.1 Description of the Experimental Tests In order to establish reliable parameters for a range of end-plate or cleated beam-to-column steel joint configurations and to validate the accuracy of the model, a group of well-documented experimental results were selected from tables 1 to 8. These tests were performed by Bernuzzi et al. [4], Elnashai et al. [17], Korol et al. [22], Broderick et al. [5], Bursi et al. [7] and Abolmaali et al. [1] and are summarized in Table 8, corresponding to extended end-plate, flush end-plate, top and seat and web cleat connections.
Table 8. Experimental Tests Nº
Test Ref. Authors Typology Beam Column Bolts Thickness plate
K+y
KNm/rad K-
y KNm/rad
1 EPBC-1 Bernuzzi et al. Extended IPE300 “Rigid plate” M20 12 mm 78000 97500 2 JB1-3A Bursi et al. Extended IPE300 HEB180 M20 18 mm 35000* 35000* 3 A2 Korol et al. Extended W360x45 W360x64 Ø 25 25.4 mm 63751 63741 4 A3 Korol et al. Extended W360x45 W360x79 Ø 25 19.0 mm 79370 79370 5 FPC/D Bernuzzi et al. Flush IPE300 “Rigid plate” M20 12 mm 19000 30500 6 EP4 Broderick et al. Flush 254x146x37UB 203x203x86UC M20 12 mm 3550 3550 7 EP2 Broderick et al. Flush 254x102x22UB 203x203x86UC M20 12 mm 10210 10210
8 CS01 Elnashai et al. Top and Seat 254x146x31UB 203x203x6UC Ø 16 8 mm 4300 4300
9 CS02 Elnashai et al. Top and Seat
254x146x31UB 203x203x6UC Ø 16 12 mm 7500 7500
10 CS03 Elnashai et al. Top and Seat
254x146x31UB 203x203x6UC Ø 16 15 mm 9800 9800
11 TSC/D Bernuzzi et al. Top and Seat
IPE300 “Rigid plate” M20 12 mm 12800 20100
12 DW-WB 4 Abolmaali et al. Web cleat W410x67 W200x100 Ø 19 10 mm 32263 32263 13 DW-WB 5 Abolmaali et al. Web cleat W410x67 W200x100 Ø 19 19 mm 16254 16254
* Estimated value The description of the tests starts with the extended end-plate connection tests performed by Bernuzzi et al. [4], Bursi et al. [7] and Korol et al. [22]. The study developed by Bernuzzi et al. had two series of tests on beam-to-column joints under cyclic loading. The first series of tests aimed at investigating the influence of the loading history on the joint performance. The second series of tests was subsequently performed with the goal of setting the key parameters enabling a full description of the connection response, including the energy dissipation capability. From this study only three tests were chosen. The first test, referred to as EPBC-1, considers end-plates extended on both sides of the beam, as shown in Figure 8a. The plate extension ensures a noticeable increase in stiffness and strength, when compared with the others tests FPC/D and TSC/D from the same author (Table 8), later discussed. Failure occurred in the weld of the extended plate. The second test, also an end-plate extended both sides but with 18 mm plate thickness, was performed by Bursi et al. (Figure 8b) and results in an increase of strength; therefore the hysteretic response is quite different, as can be observed in Figure 12. Similarly, the failure mode was at weld toe, in the end plate, starting with a ductile crack at the steel surface owing to plastic strains, a stable growth of a ductile crack in the plate thickness followed by a sudden propagation of the crack in a brittle fracture mode.

472 Pedro Nogueiro, Luís Simões da Silva, Rita Bento and Rui Simoes
Tests number 3 and 4 (Table 8), performed by Korol et al., are also extended end-plate connections, but with transverse stiffeners in the column web, as well in the end-plate, as can be seen in Figure 8c. These are stronger joints, without slippage, but much more influenced by stiffness and strength deterioration. Both exhibited failure by beam local buckling, the column flange being the first yielded component for test A2 (test number 3) and the beam web buckling for test A3 (test number 4).
EPBC-1
tp=12mm; Bolts M20
IPE300
tp520
120 180 120
105180
a)
2000
mm
IPE300
HEB
180
105
120
180
120
180t
520
JB1-3A
b)
A2, A3
W360x45
60
540
mm
(Gro
up A
)
60
c)
Figure 8. a) Geometrical Representation of Joints 1, b) Joint 2, c) Joints 3 and 4. The second group of tests corresponds to flush end plate joints (test numbers 5 to 7, Table 8). The first test from this group was performed by Bernuzzi et al., and the other two by Broderick et al. The corresponding geometrical characteristics are presented in Figure 9a and 9b, respectively. In the FPC/D tests, the endplate played the most important role in the deformation, while the bolts exhibited a negligible contribution. The plastic deformation is mainly concentrated in the end plate and the failure mode was finally related to weld fracture in the internal part of the beam flange.
tp
IPE300
tp=12mm; Bolts M20
FPC/D
180
300
105170
a)
EP2, EP4
254x146x37UB
60254x102x22UB 275mm
b)
Figure 9. a) Geometrical Representation of Joints 5, b) Joints 6 and 7. The next four tests were performed by Elghazouli et al. and Bernuzzi et al. and the geometrical representation of joints are shown in Figure 10. For the first three tests (Figure 10a), top, seat and web cleat connections, an axial load of 400 kN was applied to the column, which represents 29% of the column section plastic capacity. The CS01 joint is the most flexible and with lesser resistance and has a relatively low-energy dissipation capacity. The CS02 connection is stronger, with higher

Numerical Implementation and Calibration of a Hysteretic Model with Pinching for the Cyclic Response of Steel Joints 473
stiffness. The CS03 has the strongest and the most stiffened connection. For all cases, the strains on the web of the connection panel zone were measured and the values were well below yield. These connections have no slippage. The TSC/D test is a top and seat connection and the failure mode is governed by the plastic deformation of the flange cleats (including hole ovalisation) and by the fracture of one bolt for large deformations, after 60 mrad, which is not recommended for seismic design.
fe
b a
cd
dc
CS01, CS02, CS03
254x146x31UB
a)
105
TSC/Dtp=12mm; Bolts M20
IPE300tp
180
420
120 300 120
b)
Figure 10. a) Geometrical Representation of Joints 8, 9 and 10, b) Joint 11. Finally, the last two tests, DW-WB4 and DW-WB5, are web cleat connections (Figure 11) and were performed by Abolmaali et al.. This type of joints are very much influenced by slippage, which leads to a low rate of energy dissipated. In his study, Abolmaali et al. presented the cyclic behaviour of two series of tests corresponding to two types of semi-rigid double web cleat connections: bolted-bolted and welded-bolted (cleats welded to the beam web and bolted to the column flange), with pre-tensioned bolts, as can be seen in Figure 11. The first series of tests was rejected because of inappropriate seismic behaviour. In the second series of tests only two tests were chosen from the eight performed, respectively test DW-WB numbers 4 and 5, which exhibited yielding of the angles as the failure mode.
DW-WB 4, DW-WB5
W410x67
Figure 11. Geometrical Representation of Joints 12 and 13.
4.2 Application of the Modified Richard-Abbot model This section presents the results of the application of the modified Richard-Abbott model to the selected tests. It is noted that almost all of the experimental curves presented in this work were rebuilt by means of the curves published in the corresponding papers, a process that can lead to some errors. The accuracy of this process dictated the selection of the tests where, whenever possible, at least one test per typology was chosen, based on the type of the mode failure. Firstly, the figures overlaying, for each experimental hysteretic curve, the numerical curve obtained using the modified Richard-Abbott model are presented. Then, a comparison between both curves in terms of dissipated energy and moment resistance for each cycle is also presented. Finally, Tables 9 and 10 show the parameters chosen in the Richard-Abbott model, for the ascending and descending branches.

474 Pedro Nogueiro, Luís Simões da Silva, Rita Bento and Rui Simoes
For the first two tests, with similar geometrical properties, the corresponding moment-rotation curves are shown in Figure 12. Joint number 1 has more stiffness and pinching, and has also more stiffness and strength deterioration than joint number 2. The latter has more strength, a more stable hysteretic behaviour and, as no pinching occurs, can dissipate much more energy (see also Figure 13).
Figure 12. Hysteretic Curves for Joints 1 and 2.
To assess the accuracy of the model, the dissipated energy and the moment resistance in each cycle from the experimental tests and the Modified Richard-Abbott model were evaluated. These results are graphically presented in Figures 13 and 14. The percentage of error in each cycle was also evaluated and the results obtained are presented in all the graphs. It can be seen that, for large values of rotation, corresponding to higher values of hysteretic energy dissipation, the errors are small. Thus, in this situation, a very good agreement between the experimental and the numerical values was found.
Figure 13. Energy Dissipated in Each Cycle for Joints 1 and 2.
Figure 14. Moment Resistance in Each Cycle for Joints 1 and 2.
Tests number 3 and 4, with more strengthen joints than the previous tests, have no pinching, but are much more influenced by stiffness and strength deterioration, as can be seen in Figure 15. For both tests, the specimen had a good cyclic performance in terms of dissipated energy, as is shown in Figure 16. Moreover, the hysteresis loops were stable up to the onset of beam web buckling, at which beam-moment deterioration developed. The experimental and numerical curves are very close, and the model parameters are presented in Tables 9 and 10. The values of the dissipated
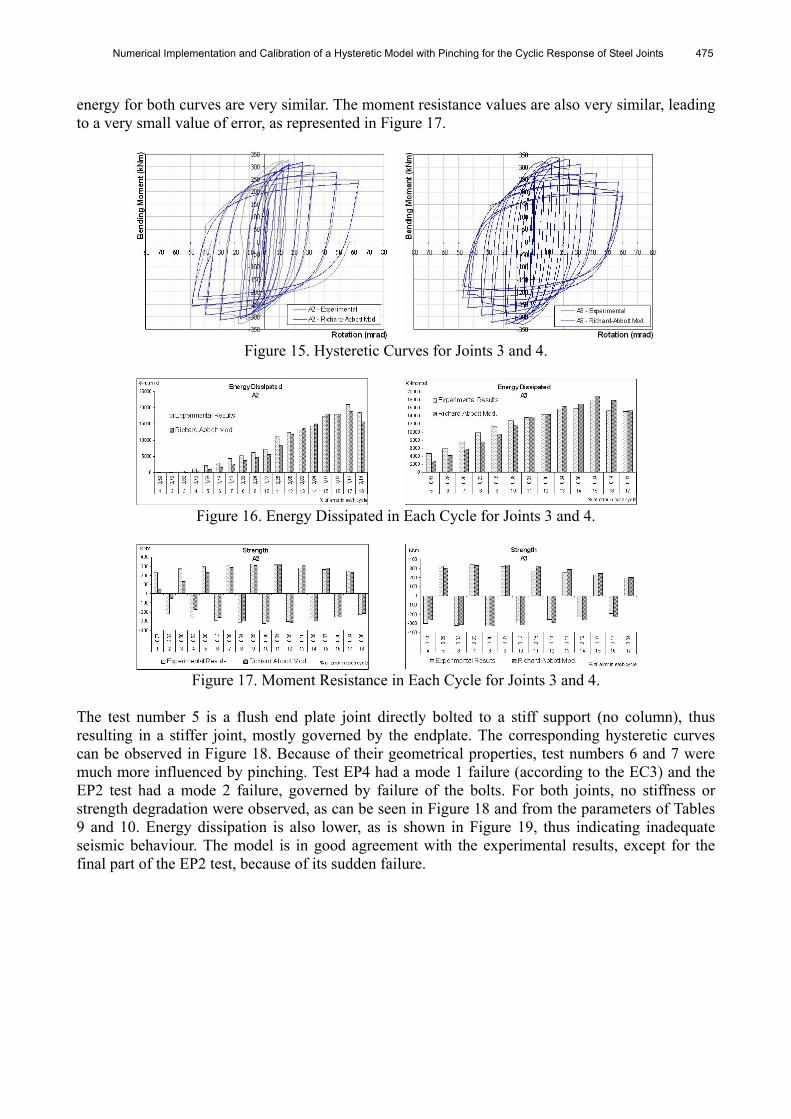
Numerical Implementation and Calibration of a Hysteretic Model with Pinching for the Cyclic Response of Steel Joints 475
energy for both curves are very similar. The moment resistance values are also very similar, leading to a very small value of error, as represented in Figure 17.
Figure 15. Hysteretic Curves for Joints 3 and 4.
Figure 16. Energy Dissipated in Each Cycle for Joints 3 and 4.
Figure 17. Moment Resistance in Each Cycle for Joints 3 and 4.
The test number 5 is a flush end plate joint directly bolted to a stiff support (no column), thus resulting in a stiffer joint, mostly governed by the endplate. The corresponding hysteretic curves can be observed in Figure 18. Because of their geometrical properties, test numbers 6 and 7 were much more influenced by pinching. Test EP4 had a mode 1 failure (according to the EC3) and the EP2 test had a mode 2 failure, governed by failure of the bolts. For both joints, no stiffness or strength degradation were observed, as can be seen in Figure 18 and from the parameters of Tables 9 and 10. Energy dissipation is also lower, as is shown in Figure 19, thus indicating inadequate seismic behaviour. The model is in good agreement with the experimental results, except for the final part of the EP2 test, because of its sudden failure.

476 Pedro Nogueiro, Luís Simões da Silva, Rita Bento and Rui Simoes
Figure 18. Hysteretic Curves for Joints 5, 6 and 7.
Figure 19. Energy Dissipated in Each Cycle for Joints 5, 6 and 7.
Figure 20. Moment Resistance in Each Cycle for Joints 5, 6 and 7.
Numerical Implementation and Calibration of a Hysteretic Model with Pinching for the Cyclic Response of Steel Joints 477
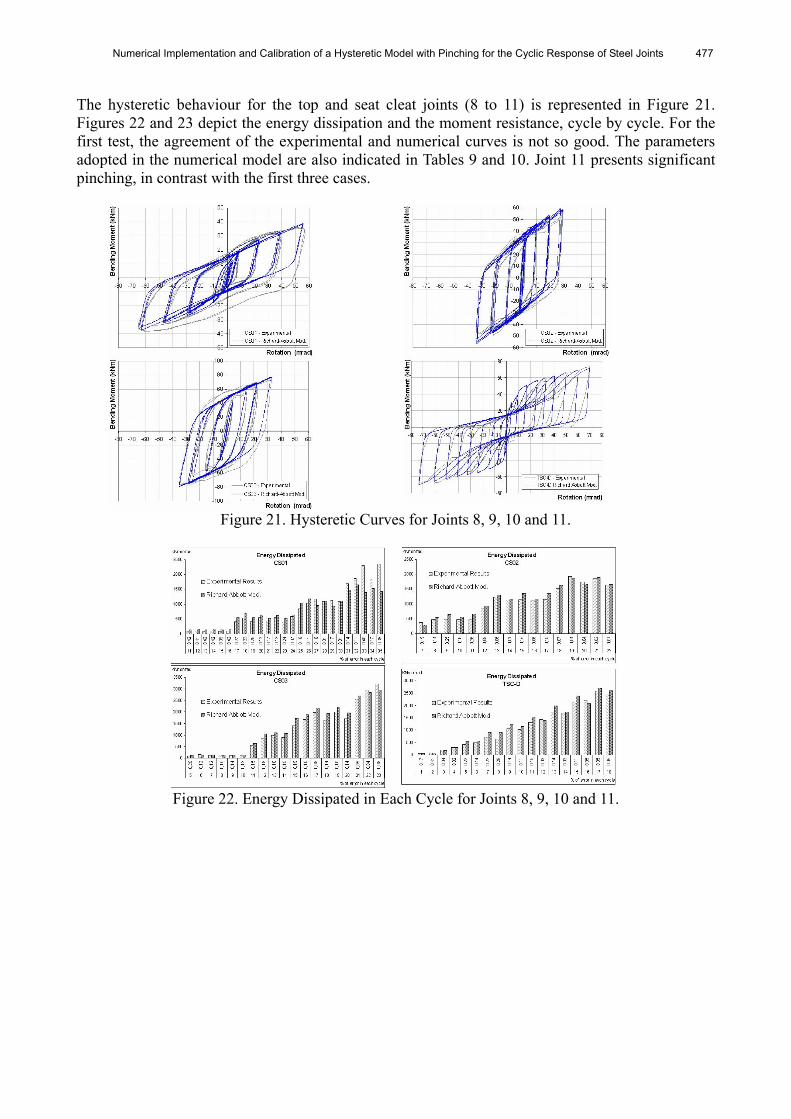
The hysteretic behaviour for the top and seat cleat joints (8 to 11) is represented in Figure 21. Figures 22 and 23 depict the energy dissipation and the moment resistance, cycle by cycle. For the first test, the agreement of the experimental and numerical curves is not so good. The parameters adopted in the numerical model are also indicated in Tables 9 and 10. Joint 11 presents significant pinching, in contrast with the first three cases.
Figure 21. Hysteretic Curves for Joints 8, 9, 10 and 11.
Figure 22. Energy Dissipated in Each Cycle for Joints 8, 9, 10 and 11.
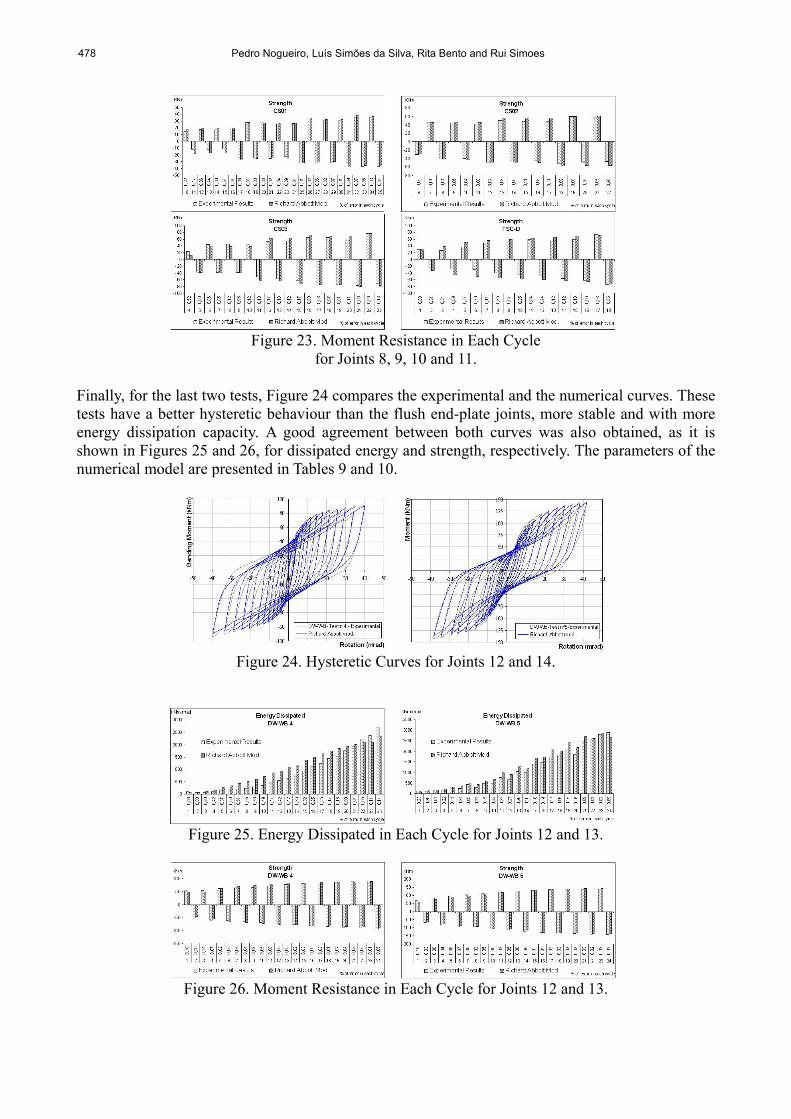
478 Pedro Nogueiro, Luís Simões da Silva, Rita Bento and Rui Simoes
Figure 23. Moment Resistance in Each Cycle
for Joints 8, 9, 10 and 11. Finally, for the last two tests, Figure 24 compares the experimental and the numerical curves. These tests have a better hysteretic behaviour than the flush end-plate joints, more stable and with more energy dissipation capacity. A good agreement between both curves was also obtained, as it is shown in Figures 25 and 26, for dissipated energy and strength, respectively. The parameters of the numerical model are presented in Tables 9 and 10.
Figure 24. Hysteretic Curves for Joints 12 and 14.
Figure 25. Energy Dissipated in Each Cycle for Joints 12 and 13.
Figure 26. Moment Resistance in Each Cycle for Joints 12 and 13.

Numerical Implementation and Calibration of a Hysteretic Model with Pinching for the Cyclic Response of Steel Joints 479
Tables 9 and 10 present the joint parameters for the ascending and descending branches, individually adjusted for each test.
Table 9. Joint Parameters for All Tests for the Ascending Branches Test Nº 1 2 3 4 5 6 7 8 9 10 11 12 13 Ka KNm/rad 78000 35000 63751 79370 19000 10210 4550 4300 20000 9800 12500 32263 16254
Ma KNm 80 120 400 400 50 70 60 25 38 52 55 75 142 Kpa KNm/rad 800 1000 1 1 300 300 100 300 900 900 300 900 1000
na 1 1 1 1 1 1 1 1 2 2 1 1 1 Kap KNm/rad 78000 35000 0 0 19000 10210 4550 0 0 0 12500 32263 16254
Map KNm 55 80 0 0 25 15 5 0 0 0 15 50 50 Kpap KNm/rad 800 1000 0 0 300 200 100 0 0 0 300 900 1000
nap 1 1 0 0 1 1 1 0 0 0 1 1 1 t1a 15 1 0 0 10 15 20 0 0 0 20 15 15 t2a 0.3 0.3 0 0 0.3 0.3 0.3 0 0 0 0.3 0.3 0.3 Ca 1 1 0 0 1 1 1 0 0 0 1 1 1 iKa 60 10 40 40 0 0 0 0 0 0 30 30 10 iMa 0.02 0 0.03 0.05 0.03 0 0 0 0.03 0.04 0 0 0 Ha 0 0.02 0 0 0 0 0 0 0 0 0 0 0 Emaxa rad 0.1 0.1 0.1 0.1 0.1 0.1 0.1 0.1 0.1 0.1 0.1 0.1 0.1
Table 10. Joint Parameters for All Tests for the Ascending Branches
Test Nº 1 2 3 4 5 6 7 8 9 10 11 12 13 Kd KNm/rad 97500 35000 63751 79370 30500 10210 3550 4300 20000 9800 20100 32263 16254
Md KNm 80 130 400 400 50 65 50 21 30 52 50 75 142 Kpd KNm/rad 800 1000 1 1 300 300 150 300 900 900 300 900 1000
nd 1 1 1 1 1 1 1 1 2 2 1 1 1 Kdp KNm/rad 97500 35000 0 0 30500 10210 3550 4300 2000 0 20100 32263 16254
Mdp KNm 50 80 0 0 20 10 5 10 30 0 10 50 50
Kpdp KNm/rad 800 1000 0 0 300 300 100 300 900 0 300 900 1000
ndp 1 1 0 0 1 1 1 1 2 0 1 1 1 t1d 10 1 0 0 10 15 20 0 0 0 20 15 15 t2d 0.3 0.3 0 0 0.3 0.3 0.3 0 0 0 0.3 0.3 0.3 Cd 1 1 0 0 1 1 1 0 0 0 1 1 1 iKd 60 10 30 30 0 0 0 0 0 0 0 30 10 iMd 0.2 0 0.03 0.05 0.03 0 0 0 0.03 0.04 0 0 0 Hd 0 0.2 0 0 0 0 0 0 0 0 0 0 0 Kd KNm/rad 0.1 0.1 0.1 0.1 0.1 0.1 0.1 0.1 0.1 0.1 0.1 0.1 0.1

480 Pedro Nogueiro, Luís Simões da Silva, Rita Bento and Rui Simoes
4.3 Discussion Tables 9 and 10 highlight a significant dispersion of the various parameters for the different joint typologies. Some of these parameters are directly related to the static monotonic response of the joint: Ka and Kd (initial stiffness), Ma and Md (moment resistance), Kpa and Kpd (post limit stiffness), na and nd (shape parameter). They are obtainable from the direct application of the component method (Eurocode 3 [18]), as illustrated in Table 11 for the three selected flush end-plate joints.
Table 11. Monotonic Moment-rotation Parameters for the Flush End-plate Tests EC3 (COP®) EC3 (Broderick) Experimental
Joint Author Kini KNm/rad
Mjrd KNm
Kini KNm/rad
Mjrd KNm
Kini KNm/rad
Mjrd KNm
Failure Mode (T-stub)
FPC-D Bernuzzi 19926 50.5 - - 19000 55 Predicted – 2
EP2 Broderick 11282 49.2 11480 56.4 10210 67.7 Predicted – 2 Observed – 2
EP4 Broderick 11388 54.6 11480 49.2 3550 51.9 Predicted – 2 Observed – 1
Of greater complexity remains the establishment of the values of the remaining model parameters. Table 12 summarizes the ranges of variation for each typology.
Table 12. Variation of the Model Parameters for All Typologies Joint Typ. EEP FEP TS WC EEP FEP TS WC
U S WC - U S WC - na 1 1 1 1-2 1-2 1 nd 1 1 1 1-2 1 1 Ka /Kap
1 ? 1 ? ? 1 Kd/Kdp 1 ? 1 1-∞ 1 1
Ma /Map
1.45-1.5 ? 2-12 ? 3.7 1.5-2.84 Md/Mdp 1.6-1.625? 2.5-10 1-∞ 5 2.84
Kpa /Kpap
1 ? 1-1.5 ? 1 1 Kpd/Kpdp 1 ? 1-1.5 1-14.31 1
na /nap
1 ? 1 ? ? 1 nd/ndp 1 ? 1 ? 1 1
t1a 1-15 0 10-20 0 20 15 t1d 1-10 0 10-20 0 20 15 t2a 0.3 0 0.3 0 0.3 0.3 t2d 0.3 0 0.3 0 0.3 0.3 Ca 1 0 1 0 1 1 Cd 1 0 1 0 1 1 iKa 10-60 40 0 0 30 10-30 iKd 10-60 30 0 0 0 10 iMa 0-0.02 0.03-0.05 0-0.03 0-0.04 0 0 iMd 0-0.2 0.03-0.050-0.03 0-0.040 0 Ha 0-0.02 0 0 0 0 0 Hd 0-0.2 0 0 0 0 0
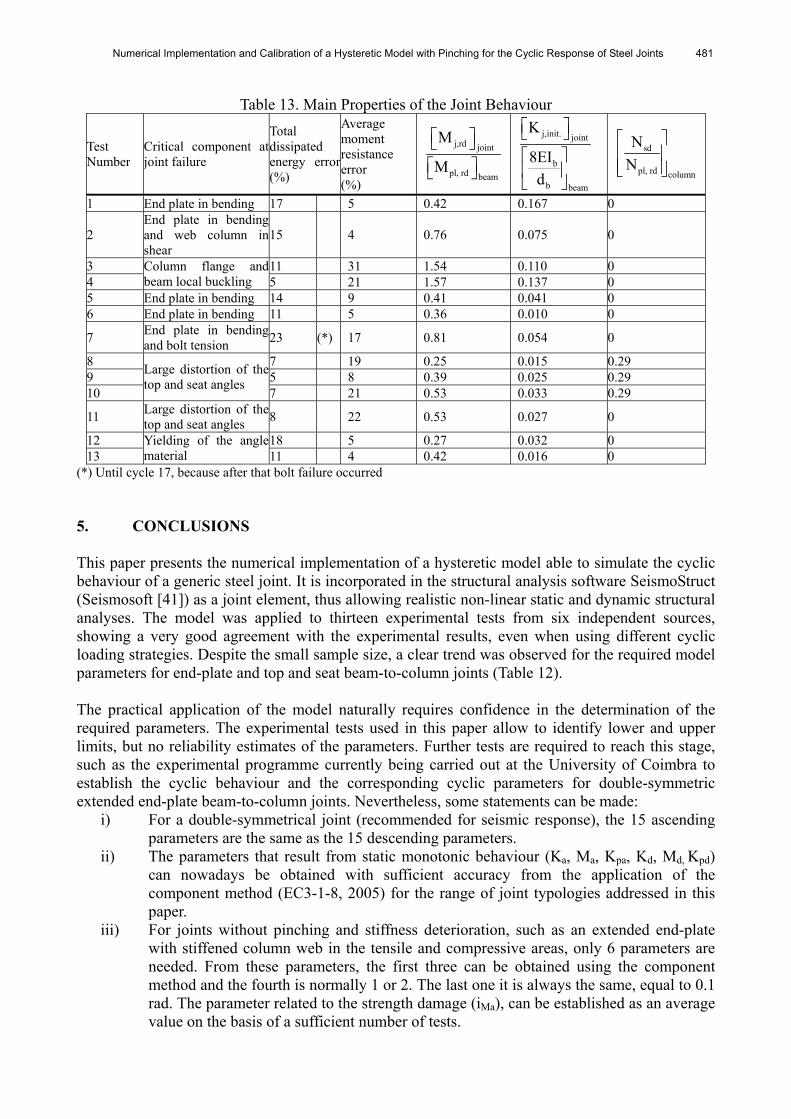
Table 13 illustrates, for each joint, the normalised values of moment resistance and initial stiffness. It is easily recognized that, apart from the two stiffened extended end-plate joints, all other joints are partial strength connections. Furthermore, the accumulated error, both in terms of total dissipated energy or average moment resistance is quite good.
Numerical Implementation and Calibration of a Hysteretic Model with Pinching for the Cyclic Response of Steel Joints 481
Table 13. Main Properties of the Joint Behaviour
Test Number
Critical component atjoint failure
Total dissipated energy error(%)
Average moment resistance error (%)
j,rd joint
pl, rd beam
M
M
⎡ ⎤⎣ ⎦⎡ ⎤⎣ ⎦
j,init. joint
b
b beam
K
8EId
⎡ ⎤⎣ ⎦⎡ ⎤⎢ ⎥⎣ ⎦
sd
pl, rd column
NN⎡ ⎤⎢ ⎥⎢ ⎥⎣ ⎦
1 End plate in bending 17 5 0.42 0.167 0
2 End plate in bendingand web column inshear
15 4 0.76 0.075 0
3 11 31 1.54 0.110 0 4
Column flange andbeam local buckling 5 21 1.57 0.137 0
5 End plate in bending 14 9 0.41 0.041 0 6 End plate in bending 11 5 0.36 0.010 0
7 End plate in bendingand bolt tension 23 (*) 17 0.81 0.054 0
8 7 19 0.25 0.015 0.29 9 5 8 0.39 0.025 0.29 10
Large distortion of thetop and seat angles 7 21 0.53 0.033 0.29
11 Large distortion of thetop and seat angles 8 22 0.53 0.027 0
12 18 5 0.27 0.032 0 13
Yielding of the anglematerial 11 4 0.42 0.016 0
(*) Until cycle 17, because after that bolt failure occurred 5. CONCLUSIONS This paper presents the numerical implementation of a hysteretic model able to simulate the cyclic behaviour of a generic steel joint. It is incorporated in the structural analysis software SeismoStruct (Seismosoft [41]) as a joint element, thus allowing realistic non-linear static and dynamic structural analyses. The model was applied to thirteen experimental tests from six independent sources, showing a very good agreement with the experimental results, even when using different cyclic loading strategies. Despite the small sample size, a clear trend was observed for the required model parameters for end-plate and top and seat beam-to-column joints (Table 12). The practical application of the model naturally requires confidence in the determination of the required parameters. The experimental tests used in this paper allow to identify lower and upper limits, but no reliability estimates of the parameters. Further tests are required to reach this stage, such as the experimental programme currently being carried out at the University of Coimbra to establish the cyclic behaviour and the corresponding cyclic parameters for double-symmetric extended end-plate beam-to-column joints. Nevertheless, some statements can be made:
i) For a double-symmetrical joint (recommended for seismic response), the 15 ascending parameters are the same as the 15 descending parameters.
ii) The parameters that result from static monotonic behaviour (Ka, Ma, Kpa, Kd, Md, Kpd) can nowadays be obtained with sufficient accuracy from the application of the component method (EC3-1-8, 2005) for the range of joint typologies addressed in this paper.
iii) For joints without pinching and stiffness deterioration, such as an extended end-plate with stiffened column web in the tensile and compressive areas, only 6 parameters are needed. From these parameters, the first three can be obtained using the component method and the fourth is normally 1 or 2. The last one it is always the same, equal to 0.1 rad. The parameter related to the strength damage (iMa), can be established as an average value on the basis of a sufficient number of tests.

482 Pedro Nogueiro, Luís Simões da Silva, Rita Bento and Rui Simoes
The influence of pinching is crucial in the establishment of the model parameters. For the end-plate joints, this is clearly noticeable and it is necessary to establish whether pinching is likely to occur. In the near future, a pragmatic way is to choose standardised steel joints, with stable hysteretic behaviour. For this case, good levels of confidence can be assumed for the choice of the model parameters. Finally, parametric studies should be carried out to assess the sensitivity of the joint response to the choice of parameters. ACKNOWLEDGEMENTS Financial support from the Portuguese Ministry of Science, Technology and Higher Education (Ministério da Ciência, Tecnologia e Ensino Superior) under contract grants from PRODEP III (5.3), for Pedro Nogueiro, Foundation of Science and Technology through POCI/ECM/55783/2004 and FEDER through INTERREG-III-A (project RTCT-B-Z-/SP2.P18) is gratefully acknowledged. The assistance provided by Seismosoft, is also most appreciated (http://www.seismosoft.com). The supply of the data files from experimental tests by D. Dubina, A.Y. Elghazouli, and R. Liew is warmly thanked. REFERENCES [1] Abolmaali, A., Kukreti, A.R. and Razavi, H., “Hysteresis Behaviour of Semi-rigid Double
Web Angle Steel Connections”, Journal of Constructional Steel Research, 2003, Vol. 59, pp. 1057-1082.
[2] Adey, B.T., Grondin, G.Y. and Cheng, J.J.R., “Extended End Plate Moment Connections Under Cyclic Loading”, Journal of Constructional Steel Research, 1998, Vol. 46, No. 1-3.
[3] ATC24 procedure – Applied Technology Council (ATC), “Guidelines for Seismic Testing of Components of Steel Structures”, ATC24, Redwood City, CA, 1992.
[4] Bernuzzi, C., Zandonini, R. and Zanon, P., “Experimental Analysis and Modelling of Semi-rigid Steel Joints Under Cyclic Reversal Loading”, Journal of Constructional Steel Research, 1996, Vol. 38, No. 2, pp. 95-123.
[5] Broderick, B.M. and Thomson, A.W., “The Response of Flush Joints Under Earthquake Loading”, Journal of Constructional Steel Research, 2002, Vol. 58, pp. 1161-1175.
[6] Bursi, O.S. and Ferrario, F., “Computational Models for the Low-cycle Fatigue Behaviour of Composite Members and Joints”, In Progress in Civil and Structural Engineering Computing, In Topping B.H.V. (ed.), Saxe_Coburg Publications, 2003, Stirling, Scotland, pp. 119-148.
[7] Bursi, O.S. and Ferrario, F. and Fontanari, V., “Non-linear Analysis of the Low-cycle Fracture Behaviour of Isolated Tee Stub Connections”, Computers & Structures, 2002, Vol. 80, pp. 2333-2360.
[8] Calado, L., “Comportamento Sísmico de Ligações Viga-coluna. Caracterização Baseada na Experimentação”, In IV Congresso de Construção Metálica e Mista, 2003, Cmm Press, Lisboa, pp. 645-656.
[9] Chen, S.J., Yeh, C.H. and Chu, J.M., “Ductile Steel Beam-to-column Connections for Seismic Resistance”, Journal of Structural Engineering, November 1996, Vol. 122, No. 11, pp. 1292-1299.
[10] De Martino, A., Faella, C. and Mazzolani, F.M., “Simulation of Beam-to-column Joint Behaviour Under Cyclic Loads”, Construzioni Metalliche, 1984, Vol. 6, pp. 346-356.
[11] Della Corte, G., De Matteis, G. and Landolfo, R., “Influence of Connection Modelling on Seismic Response of Moment Resisting Steel Frames”, In: Mazzolani FM (ed.). Moment Resistant Connections of Steel Buildings Frames in Seismic Areas, E. & F.N. Spon,

Numerical Implementation and Calibration of a Hysteretic Model with Pinching for the Cyclic Response of Steel Joints 483
London, 2000. [12] Delphi 7, Borland Software Corporation, 2002. [13] Dubina, D., Ciutina, A.L. and Stratan, A., Cyclic Tests of Double-Sided Beam-to Column
Joints”, Journal of Structural Engineering, February 2001, Vol. 127, No. 2, pp. 129-136. [14] Dubina, D., Ciutina, A.L. and Stratan, A., “Cyclic Testes on Bolted Steel and Composite
Double-sided beam-to-column joints”, Steel and Composite Structures, 2002, Vol. 2, No. 2, pp. 147-160.
[15] Dunai, L., Kovács, N. and Calado, L., “Analysis of Bolted End-plate Joints : Cyclic Test and Standard Approach”, In Proceedings of the V International Workshop in Connections in Steel Structures, 2004, Amsterdam, pp. 191-200, June 3-4.
[16] Elnashai, A.S. and Elgazouli, A.Y., “Seismic Behaviour of Semi-rigid Steel Frames”, Journal of Constructional Steel Research, 1994, Vol. 29, pp. 149-174.
[17] Elnashai, A.S., Elgazouli, A.Y. and Denesh-Ashtiani, F.A., “Response of Semirigid Steel Frames to Cyclic and Earthquake Loads, Journal of Structural Engineering, August 1998, Vol. 124, No. 8, pp. 857-867.
[18] EN 1993-1-8, Eurocode 3, “Design of Steel Structures – Part 1.8: Design of Joints”, Commission of the European Communities, Brussels, 2005.
[19] Filippou, F.C., Popov, E.P. and Bertero, V.V., ”Effect of Bond Deterioration on Hysteretic Behaviour of Reinforced Concrete Joints”, Report Nº UCB/EERC-83/19, Earthquake Engineering Research Center, University of California, Berkeley, 1983.
[20] Grecea, D., Stratan, A., Ciutina, A. and Dubina, D., “Rotational Capacity of MR Beam-to-column Joints Under Cyclic Loading”, In Proceedings of the V International Workshop in Connections in Steel Structures, June 3-4 2004, Amsterdam, pp. 141-154.
[21] Jaspart, J.P., “General Report : Session on Connections”, Journal of Constructional Steel Research, 2000, Vol. 55, pp. 69-89.
[22] Korol, R.M., Ghobarah, A. and Osman, A., “Extended End-plate Connections Under Cyclic Loading : Behaviour and Design”, Journal of Constructional Steel Research, 1990, Vol. 16, pp. 253-280.
[23] Kukreti ,A.R., Abolmaali, A.S., “Moment-rotation Hysteresis Behaviour of Top and Seat Angle Steel Frame Connections”, Journal of Structural Engineering, ASCE, August 1999, Vol. 125, No. 8, pp. 810-820.
[24] Leon, R.T., Hajjar, J.F. and Gustafsun, M.A., “Seismic Response of Composite Moment-resisteng Connections. I : Performance”, Journal of Structural Engineering, August 1998, Vol. 124, No. 8, pp. 868-876.
[25] Leon, R.T., Hajjar, J.F. and Gustafsun, M.A., “Seismic Response of Composite Moment-resisting Connections. II: Behaviour”, Journal of Structural Engineering, August 1998, Vol. 124, No. 8, pp. 877-885.
[26] Leon, R.T, Hu, J.W. and Schrauben, C., “Rotational Capacity and Demand in Top-seat Angle Connections Subjected to Seismic Loading”, In Proceedings of the V International Workshop in Connections in Steel Structures, June 3-4 2004, Amsterdam, pp. 201-209.
[27] Lu, L.W., Ricles, J.M., Mao, C. and Fisher, J.W., “Critical Issues in Achieving Ductile Behaviour of Welded Moment Connections”, Journal of Constructional Steel Research, 2000, Vol. 55, pp. 325-341.
[28] Mazzolani, F.M., “Mathematical Model for Semi-rigid Joints under Cyclic Loads”, In R. Bjorhovde et al. (eds) Connections in Steel Structurs: Behaviour, Strength and Design, Elsevier Applied Science Publishers, London, 1988, pp. 112-120.
[29] Mele, E., Calado, L. and De Luca, A., “Cyclic Behaviour of Beam-to-column Welded Connections”, Advanced in Steel Structures - ICASS’99, Vol. I, In Shen ZY et al. (eds.), 1999, pp. 323-330.

484 Pedro Nogueiro, Luís Simões da Silva, Rita Bento and Rui Simoes
[30] Nogueiro, P., Simões da Silva, L. and Bento, R., “Influence of Joint Slippage on the Cyclic Response of Steel Frames”, paper 66, in Topping, B.H.V. (ed.), Proceedings of 9th International Conference on Civil and Structural Engineering Computing, 2003, Civil-Comp Press, Stirling, United Kingdom.
[31] Pradhan, A.M. and Bouwkamp, J.G., “Structural Performance Aspects on Cyclic Behaviour of the Composite Beam-column Joints”, In Behaviour of Steel Structures in Seismic Areas – STESSA’94, 1994, In F.M. Mazzolani and V. Gioncu (eds.), E& FN SPON, London, pp. 221-230.
[32] Plumier, A., “Recommended Testing Procedure for Evaluating Earthquake Resistance of Structural Elements”, European Convention for Constructional Steelwork, Technical Committee 13, 1983, Brussels, Belgium.
[33] Plumier, A. and Schleich, J.B., “Seismic Resistance of Steel and Composite Frame Structures, Journal of Constructional Steel Research, 1993, Vol. 27, pp. 159-176.
[34] Popov, E.P., “Panel Zone Flexibility in Seismic Moment Joints”, Journal of Constructional Steel Research, 1987, Vol. 8, pp. 91-118.
[35] Popov, E.P. and Bertero, V.V., “Cyclic Loading of Steel Beams and Connections”, Journal Struct. Div., ASCE, 1973, Vol. 99, No. 6, pp. 1189-1204.
[36] Popov, E.P. and Pinkey, R.B., “Cyclic Loading of Steel Beams and Connections Subjected to Inelastic Strain Reversals, Bull N.º 3, Nov. 1968, American Iron And Steel Institute, Washington, D.C.
[37] Popov, E.P. and Petersson, H., “Cyclic Metal Plasticity; Experiments and Theory”, J. Engng Mech. Div., ASCE, December 1978, Vol. 104, Nº EM6, Proc. Paper 14257, pp. 1371-87.
[38] Ramberg, W. and Osgood, W.R., “Description of Stress-strain Curves by Three Parameters”, Monograph N.º 4, Publicazione Italsider, Nuova Italsider, Genova, 1943.
[39] Richard, R.M. and Abbott, B.J., “Versatile Elasto-Plastic Stress-Strain Formula:, Journal of the Engineering Mechanics Division, ASCE, 1975, Vol. 101, EM4, pp. 511-515.
[40] SAC Joint Venture, “Protocol for Fabrication, Inspection, Tenting and Documentation of Beam-column Connection Tests and Other Experimental Specimens”, Rep. No. SAC/BD-97/02, Sacramento, Calif., 1997.
[41] SeismoStruct., “Computer Program for Static and Dynamic Nonlinear Analysis of Framed Structures [online], 2004, Available from URL: http://www.seismosoft.com
[42] Shen, J. and Astaneh-Asl, A., “Hysteretic Behaviour of Bolted-angle Connections”, Journal of Constructional Steel Research, 1999, Vol. 51, pp. 201-218.
[43] Simões, R., Simões da Silva, L. and Cruz, P., “Cyclic Behaviour of End-plate Beam-to-column Composite Joints”, International Journal of Steel and Composite Structures, 2001, Vol. 1, No. 3, pp. 355-376.
[44] Stajadinovic, B., Goel, S.C., Lee, K.H., Margarian, A.G. and Choi, J.H., “Parametric Tests on Unreinforced Steel Moment Connections”, Journal of Structural Engineering, 2000, Vol. 126, No. 1, pp. 40-49, January.
[45] Summer, E.A. and Murray, T.M., “Behaviour of Extended End-plate Moment Connections Subjected to Cyclic Loading”, Journal of Structural Engineering, April 2002, Vol. 128, No. 4, pp. 501-508.
[46] Tsai, K.C., Wu, S. and Popov, E.P., “Experimental Performance of Seismic Steel Beam-column Moment Joints”, Journal of Structural Engineering, June 1995, Vol. 121, No. 6, pp. 925-931.
[47] Yorgun, C. and Bayramoglu, G., “Cyclic Tests for Welded-plate Sections with End-plate Connections”, Journal of Constructional Steel Research, 2001, Vol. 57, pp. 1309-1320.
[48] Yu, Q.S.K. and Uang, C.M., “Effects of Near-fault Loading and Lateral Bracing on the Behaviour of RBS Moment Connections”, International Journal of Steel and Composite Structures, 2001, Vol. 1, No. 1, pp. 145-158.