numerical investigation of scale effect for propeller boss
TRANSCRIPT
Numerical Investigation of Scale Effect for Propeller Boss Cap Fins
Lurong Xu, Decheng Wan* State Key Laboratory of Ocean Engineering, School of Naval Architecture, Ocean and Civil Engineering, Shanghai Jiao Tong University,
Collaborative Innovation Center for Advanced Ship and Deep-Sea Exploration, Shanghai, China *Corresponding author
ABSTRACT In this paper, scale effect of PBCF at different advance coefficients is investigated using IDDES turbulence model and sliding mesh technique. Predicted results of thrust and torque coefficients at different advance coefficients agree well with their experimental counterparts. Numerical results indicate that PBCF can obtain a net propulsion efficiency improvement of 2% in the model scale. The augmentation of the propeller efficiency by full scale model is significantly twice as much as that of the model scale. KEY WORDS: PBCF; Sliding mesh method; Open water performance; Energy-saving effect; Scale effect INTRODUCTION In recent years, the International Maritime Organization (IMO) has speeded up the implementation of green shipbuilding and the limitation of greenhouse gas emissions from newly built ships. EEDI (Energy Efficiency Design Index) representing the energy efficiency of the ship is set up to establish a minimum energy efficiency standard for ships in the future. As a result, huge attention is drawn to the research of improving the propulsion efficiency of propeller. PBCF (Propeller Boss Cap Fins) is a kind of energy-saving devices which is installed behind the propeller and rotates along with the propeller as shown in the Fig. 1. Since the introduction in 1987, it is used widely for its good performance. Kurt et al. (2017) used the CFD commercial software STAR-CCM+ to do the design and the optimization of the PBCF. Series of parameters which had effect on the energy-saving of the PBCF were focused on. The general stage of the design and the optimization were summarized. The best achievement in improving efficiency by adding PBCF was about 1.3%. Chao Wang et al. (2009) analyzed thrust coefficient, torque coefficient, pressure distribution of propeller blade surface and velocity distribution of hub surface of PBCF at different advanced coefficients. Through showing details of flow field using CFD, it found that fin could effectively change the flow velocity distribution at the hub, making the flow of water which originally revolved around the propeller move along the fin to the rear of the propeller. Druckenbrod et al. (2015) studied the optimization process of
the CFD method for the design of PBCF. The optimization process was divided into two steps: the first step was to consider the change of propeller thrust, torque and efficiency after installing the hub and cap fin while the second step started with the hub vortex of the propeller and tried to minimize the hub vortex strength as far as possible. Berger et al. (2013) focused on the optimization design process of the hub fins with the method of CFD. Dang et al. (2012) investigated the detailed flow field of the propulsion system with the PSS using PIV and CFD two methods. It drew the conclusion that the CFD method had the ability to catch the detail and possible separation of the flow. The calculation result from the CFD method was in good agreement with that from the measurement of the PIV. It indicated the reliable of the CFD method. Yan Ma et al. (2011) used the RANS solver of CFD commercial software FLUENT to do the performance calculation of a 57000DWT bulk carrier. In the calculation, the SST k-ω turbulence model was used and the decoupling of velocity and pressure was based on the SIMPLE algorithm. The discrete equations were solved by Gauss-Seidel method and the algebraic multigrid was adopted to accelerate the solving speed. Propellers with and without PBCF were simulated to study energy saving effect of PBCF.
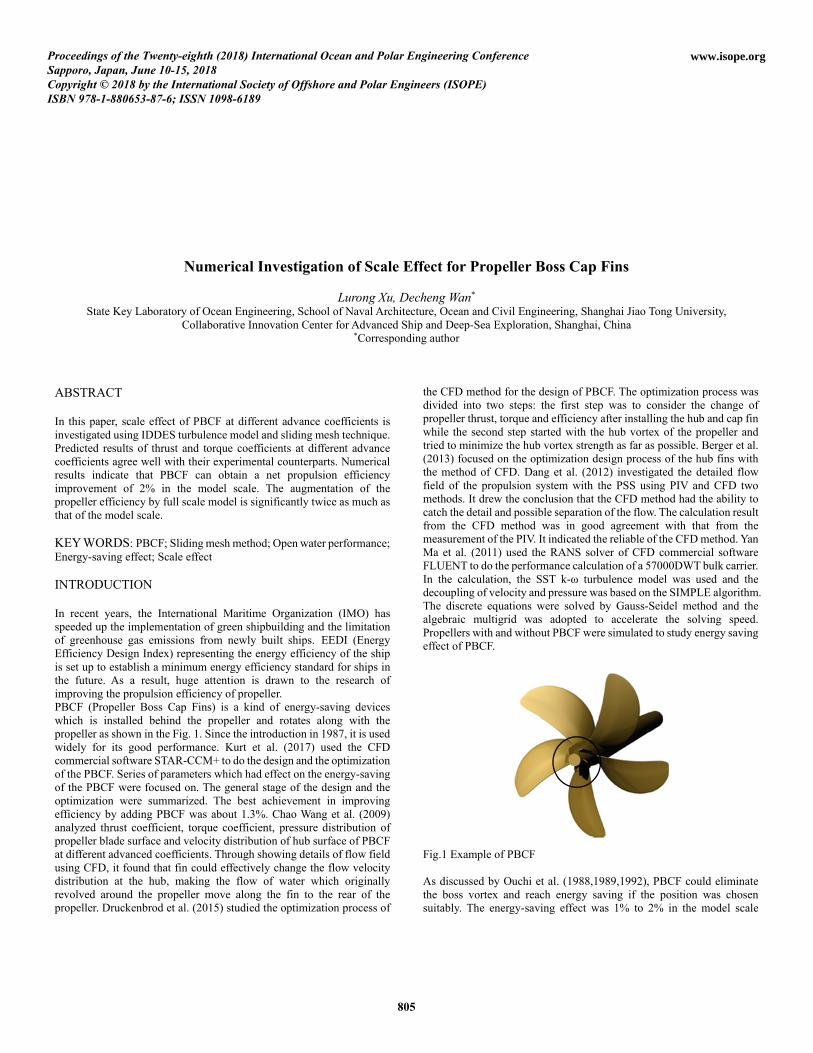
Fig.1 Example of PBCF As discussed by Ouchi et al. (1988,1989,1992), PBCF could eliminate the boss vortex and reach energy saving if the position was chosen suitably. The energy-saving effect was 1% to 2% in the model scale
805
Proceedings of the Twenty-eighth (2018) International Ocean and Polar Engineering ConferenceSapporo, Japan, June 10-15, 2018Copyright © 2018 by the International Society of Offshore and Polar Engineers (ISOPE)ISBN 978-1-880653-87-6; ISSN 1098-6189
www.isope.org

experiments and averagely 5.4% at full scale of 12 different vessels. Nojiri et al. (2011) noted that the efficiency improvement of propeller with PBCF was from 1%-1.5% according to model test, although full scale analyses for 16 different vessels shown 2% to 10% improvement on total propulsive efficiency. Kawamura et al. (2012) analyzed PBCF for two different propellers at model and full scale Reynolds numbers with two different in-flow conditions. They drew the conclusion that increased Reynolds number and presence of hull wake both benefited the effects of PBCF. This paper uses the pimpleDyMFoam solver based on open CFD (Computation Fluid Dynamic) software OpenFOAM to explore the scale effect of PBCF. The modified DES model -- S-A IDDES is used in the calculation to better simulate unsteady phenomena both at model scale and full scale cases. NUMERICAL METHOD IDDES Turbulence Model In the present CFD computation, RANS is main method for its low requirement for mesh numbers and appropriate accuracy. While the flow is characterized by unsteady phenomena, however, the vortex viscous will be overestimate which may ignore the significant vortex. LES method can better catch the vortex structure but calls for huge mesh numbers and calculation cost. DES (Detached Eddy Simulation) model is then put forward by Spalart and Allmaras (1997) which combines the advantages of both RANS and LES. More specifically, the model acts as a RANS model in attached boundary layers, although it will turn into LES for the separated flow regions. This paper applies the latest version of the DES models called S-A IDDES (Improved Delayed Detached Eddy Simulation, 2008) which combines the advantages of the Wall Modeled LES (WMLES) and the DDES (Delayed Detached Eddy Simulation, 2006) capabilities. Normally, the flow in the boundary layer can be divided into viscous sublayer, log layer and outer region. In the viscous sublayer, dimensionless velocity u+ is liner with dimensionless distance to the wall y+, which is defined as
++ = yku (1) where k is a constant. For smooth surface, dimensionless velocity u+ is liner with the natural logarithm of dimensionless distance to the wall y+, which is defined as
κ)ln(
u+
+ = Ey (2)
τuU /u =+ (3)
ντ /y yu=+ (4)
ρτ ωτ /=u (5)
where uτ is the friction velocity, κ is Von Karman constant, E is also a constant and τω is the shear stress. Usually, κ is equal to 0.41 and E is equal to 9.81 for smooth surface. In numerical simulations, to accurately catch the flow in the boundary layer, the first-layer grid shall be inside viscous sublayer which means that y+ should less than 5, leading to unacceptable numerous grid number. To settle this problem, wall function is applied which can expand the range of y+ to between 30 and 200, significantly decrease the grid number near wall.
Sliding Mesh Method Sliding mesh method plays an important role in the direct computing of the propeller. Two parts will be divided from a computation domain in the open water simulation of single propeller. One is the residual domain which remains static in the calculation, the other will surround the propeller and keep the same rotating velocity with it. Although the grids numbers on both surfaces may be inconsistent, the flux ought to be equal to each other in order to avoid the possible diverging in the computing process. For a better explanation, the overlapping area of sliding meshed is shown in the Fig. 2. Weight coefficient is firstly introduced which stands for the contribution per cell on one side of sliding surfaces making to the other side. Interpolation manner is based on the coefficient for the reasonable flux transmitting and flow field information exchanging. Supposing that the blue mesh is the main surface while the red mesh is slave surface respectively. The weight one cell owing from main surface to the cell in slave surface in the overlapping cell is the ratio how much overlapping area the cell in main surface accounts.
Fig. 2 Sketch of sliding mesh GEOMETRY AND SIMULATION DESIGN Geometry Model Propeller MP687 model is provided by Tokyo 2015 conference. The scale ratio of model scale is 40. The diameter of model propeller is 0.203m and the Reynolds number is on the order of 105, while it is on the order of 107 at the full scale. The principal particulars of the propeller both at model and full scale are shown in the Table 1, and Fig. 3 shows the perspective views of the propeller models. Computational Domain Computational domain is represented by a 10-D-diameter (D is the diameter of the propeller) cylinder extending 5D from the propeller face to the inlet, 5D to the outlet with a sliding surface surrounding the propeller. The inlet boundary is set as velocity inlet with zero pressure gradient. The outlet boundary is defined as zero pressure and zero velocity gradient. Boundary of “OuterCylinder” is applied as symmetry (see in Fig. 4). In this paper, the calculation of both model scale and full scale case are based on the same computation domain. Grid Generation The global background grid was generated by software ICEM which is adept for the creation of O-block mesh, although the fully unstructured girds are created by snappyMesh which depends on OpenFOAM. The
806
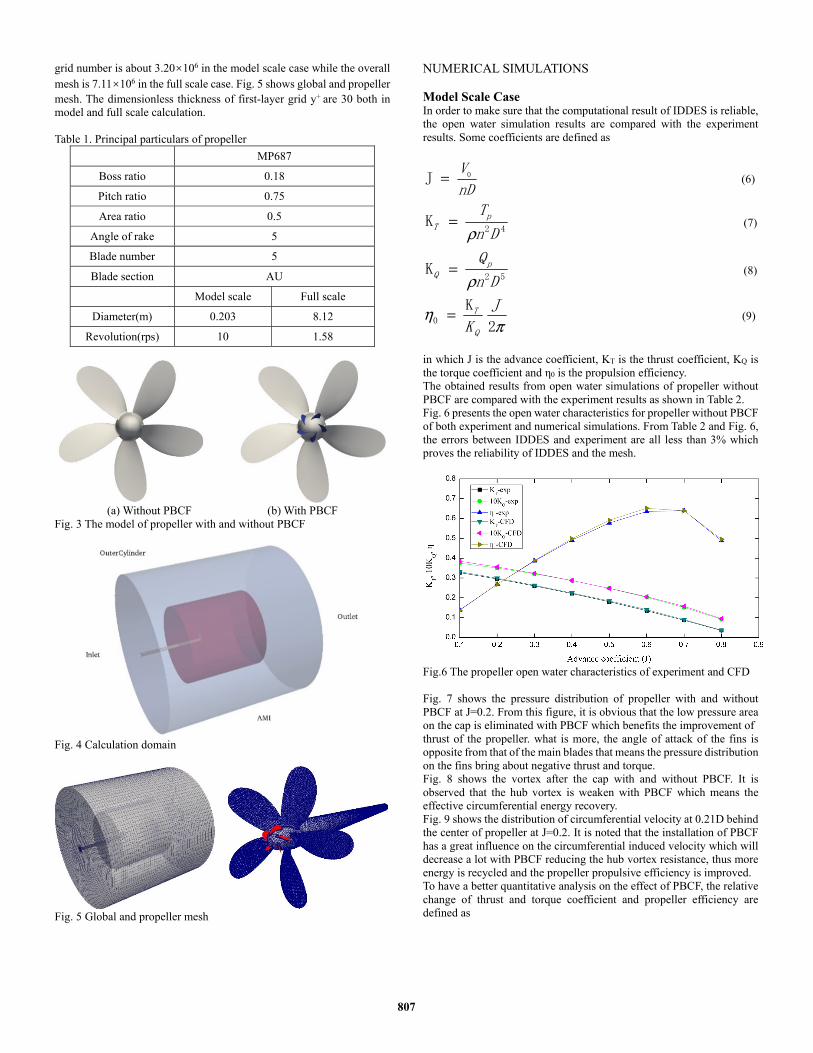
grid number is about 3.20×10⁶ in the model scale case while the overall mesh is 7.11×10⁶ in the full scale case. Fig. 5 shows global and propeller mesh. The dimensionless thickness of first-layer grid y+ are 30 both in model and full scale calculation. Table 1. Principal particulars of propeller
MP687
Boss ratio 0.18
Pitch ratio 0.75
Area ratio 0.5
Angle of rake 5
Blade number 5
Blade section AU Model scale Full scale
Diameter(m) 0.203 8.12
Revolution(rps) 10 1.58
(a) Without PBCF (b) With PBCF
Fig. 3 The model of propeller with and without PBCF
Fig. 4 Calculation domain
Fig. 5 Global and propeller mesh
NUMERICAL SIMULATIONS Model Scale Case In order to make sure that the computational result of IDDES is reliable, the open water simulation results are compared with the experiment results. Some coefficients are defined as
nD
V0J = (6)
42K
Dn
TpT ρ
= (7)
52K
Dn
QpQ ρ
= (8)
πη
2
K0
J
KQ
T= (9)
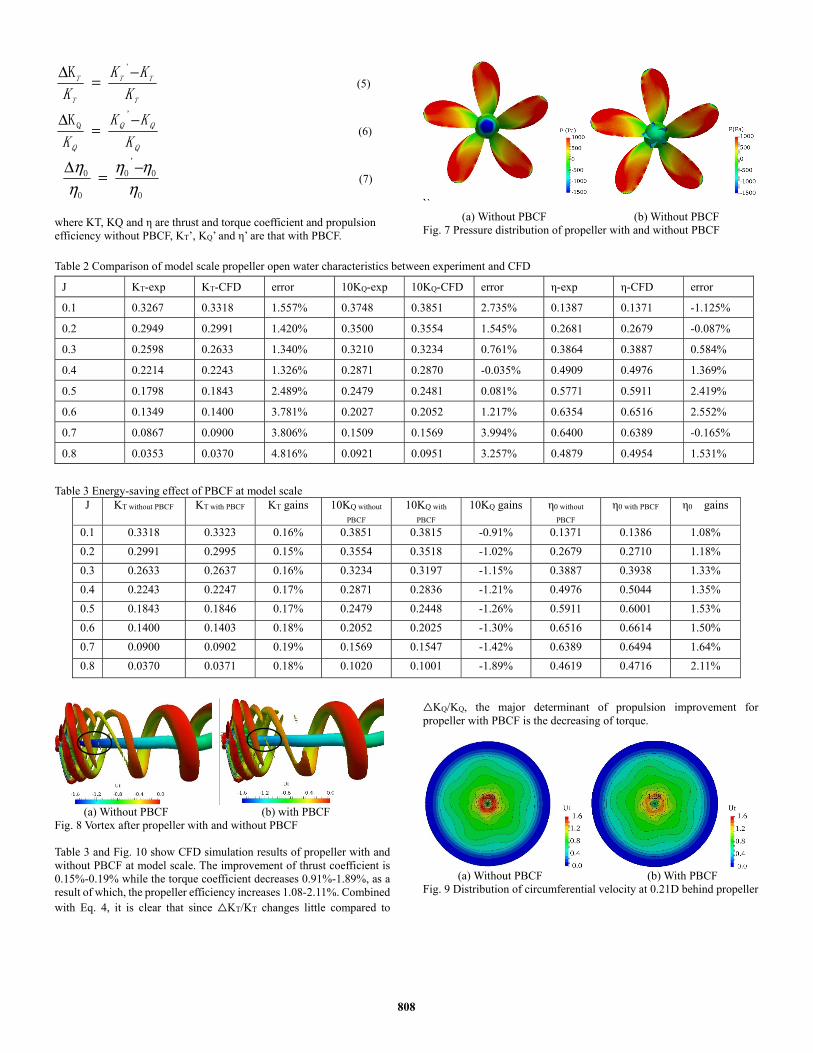
in which J is the advance coefficient, KT is the thrust coefficient, KQ is the torque coefficient and η0 is the propulsion efficiency. The obtained results from open water simulations of propeller without PBCF are compared with the experiment results as shown in Table 2. Fig. 6 presents the open water characteristics for propeller without PBCF of both experiment and numerical simulations. From Table 2 and Fig. 6, the errors between IDDES and experiment are all less than 3% which proves the reliability of IDDES and the mesh.
Fig.6 The propeller open water characteristics of experiment and CFD Fig. 7 shows the pressure distribution of propeller with and without PBCF at J=0.2. From this figure, it is obvious that the low pressure area on the cap is eliminated with PBCF which benefits the improvement of thrust of the propeller. what is more, the angle of attack of the fins is opposite from that of the main blades that means the pressure distribution on the fins bring about negative thrust and torque. Fig. 8 shows the vortex after the cap with and without PBCF. It is observed that the hub vortex is weaken with PBCF which means the effective circumferential energy recovery. Fig. 9 shows the distribution of circumferential velocity at 0.21D behind the center of propeller at J=0.2. It is noted that the installation of PBCF has a great influence on the circumferential induced velocity which will decrease a lot with PBCF reducing the hub vortex resistance, thus more energy is recycled and the propeller propulsive efficiency is improved. To have a better quantitative analysis on the effect of PBCF, the relative change of thrust and torque coefficient and propeller efficiency are defined as
807
T
TT
T
T
K
KK
K
−=Δ 'K (5)
Q
Q K
KK
K
−=
Δ 'QK (6)
0
0'
0
0
0
ηηη
ηη −=Δ
(7)
where KT, KQ and η are thrust and torque coefficient and propulsion efficiency without PBCF, KT’, KQ’ and η’ are that with PBCF.
``
(a) Without PBCF (b) Without PBCF Fig. 7 Pressure distribution of propeller with and without PBCF
Table 2 Comparison of model scale propeller open water characteristics between experiment and CFD
J KT-exp KT-CFD error 10KQ-exp 10KQ-CFD error η-exp η-CFD error
0.1 0.3267 0.3318 1.557% 0.3748 0.3851 2.735% 0.1387 0.1371 -1.125%
0.2 0.2949 0.2991 1.420% 0.3500 0.3554 1.545% 0.2681 0.2679 -0.087%
0.3 0.2598 0.2633 1.340% 0.3210 0.3234 0.761% 0.3864 0.3887 0.584%
0.4 0.2214 0.2243 1.326% 0.2871 0.2870 -0.035% 0.4909 0.4976 1.369%
0.5 0.1798 0.1843 2.489% 0.2479 0.2481 0.081% 0.5771 0.5911 2.419%
0.6 0.1349 0.1400 3.781% 0.2027 0.2052 1.217% 0.6354 0.6516 2.552%
0.7 0.0867 0.0900 3.806% 0.1509 0.1569 3.994% 0.6400 0.6389 -0.165%
0.8 0.0353 0.0370 4.816% 0.0921 0.0951 3.257% 0.4879 0.4954 1.531%
Table 3 Energy-saving effect of PBCF at model scale J KT without PBCF KT with PBCF KT gains 10KQ without
PBCF 10KQ with
PBCF 10KQ gains η0 without
PBCF η0 with PBCF η0 gains
0.1 0.3318 0.3323 0.16% 0.3851 0.3815 -0.91% 0.1371 0.1386 1.08% 0.2 0.2991 0.2995 0.15% 0.3554 0.3518 -1.02% 0.2679 0.2710 1.18% 0.3 0.2633 0.2637 0.16% 0.3234 0.3197 -1.15% 0.3887 0.3938 1.33% 0.4 0.2243 0.2247 0.17% 0.2871 0.2836 -1.21% 0.4976 0.5044 1.35% 0.5 0.1843 0.1846 0.17% 0.2479 0.2448 -1.26% 0.5911 0.6001 1.53% 0.6 0.1400 0.1403 0.18% 0.2052 0.2025 -1.30% 0.6516 0.6614 1.50% 0.7 0.0900 0.0902 0.19% 0.1569 0.1547 -1.42% 0.6389 0.6494 1.64% 0.8 0.0370 0.0371 0.18% 0.1020 0.1001 -1.89% 0.4619 0.4716 2.11%
(a) Without PBCF (b) with PBCF
Fig. 8 Vortex after propeller with and without PBCF Table 3 and Fig. 10 show CFD simulation results of propeller with and without PBCF at model scale. The improvement of thrust coefficient is 0.15%-0.19% while the torque coefficient decreases 0.91%-1.89%, as a result of which, the propeller efficiency increases 1.08-2.11%. Combined with Eq. 4, it is clear that since △KT/KT changes little compared to
△KQ/KQ, the major determinant of propulsion improvement for propeller with PBCF is the decreasing of torque.
(a) Without PBCF (b) With PBCF
Fig. 9 Distribution of circumferential velocity at 0.21D behind propeller
808
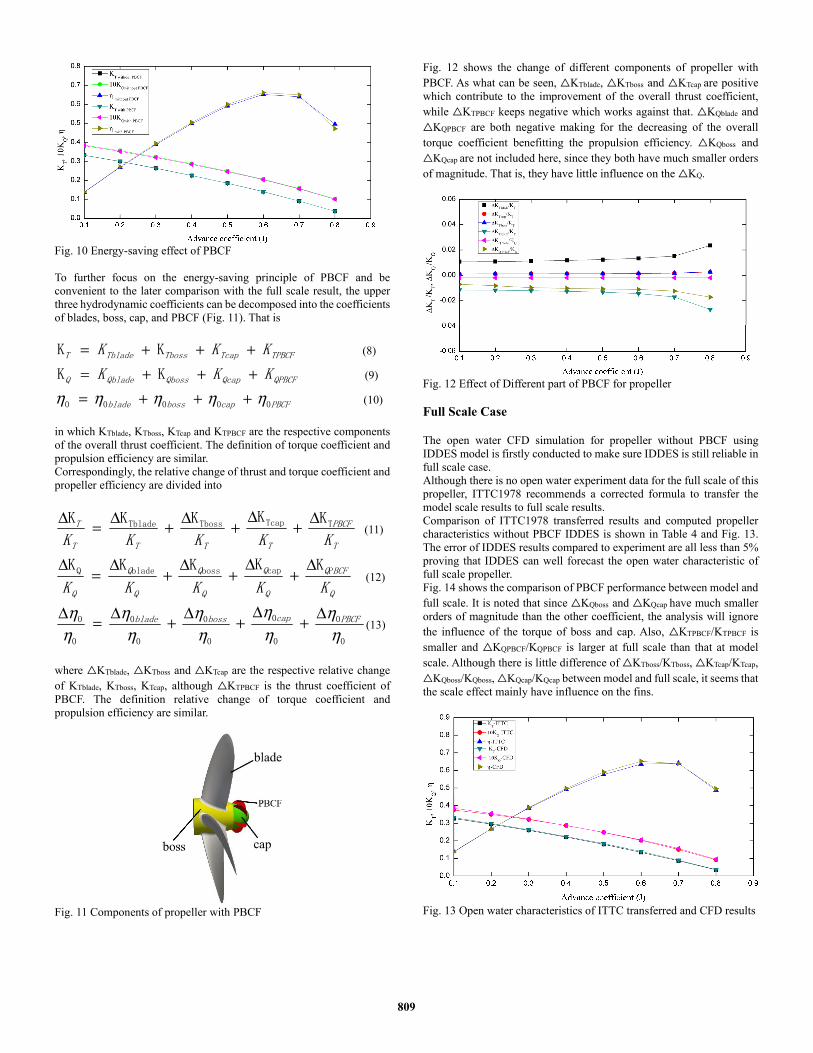
Fig. 10 Energy-saving effect of PBCF To further focus on the energy-saving principle of PBCF and be convenient to the later comparison with the full scale result, the upper three hydrodynamic coefficients can be decomposed into the coefficients of blades, boss, cap, and PBCF (Fig. 11). That is
TPBCFTcapTbossTbladeT KKK +++= KK (8)
QPBCFQcapQbossQbladeQ KKK +++= KK (9)
PBCFcapbossblade 00000 ηηηηη +++= (10) in which KTblade, KTboss, KTcap and KTPBCF are the respective components of the overall thrust coefficient. The definition of torque coefficient and propulsion efficiency are similar. Correspondingly, the relative change of thrust and torque coefficient and propeller efficiency are divided into
T
PBCF
TTTT
T
KKKKKTTcapTbossTblade KKKKK Δ+
Δ+Δ+Δ=Δ
(11)
Q
BCFQ
Q
Q
Q
Q
Q
Q
Q KKKKKPcapbossbladeQ KKKKK Δ
+Δ
+Δ
+Δ
=Δ
(12)
0
0
0
0
0
0
0
0
0
0
ηη
ηη
ηη
ηη
ηη PBCFcapbossblade Δ+
Δ+Δ+Δ=Δ
(13)
where △KTblade, △KTboss and △KTcap are the respective relative change of KTblade, KTboss, KTcap, although △KTPBCF is the thrust coefficient of PBCF. The definition relative change of torque coefficient and propulsion efficiency are similar.
Fig. 11 Components of propeller with PBCF
Fig. 12 shows the change of different components of propeller with PBCF. As what can be seen, △KTblade, △KTboss and △KTcap are positive which contribute to the improvement of the overall thrust coefficient, while △KTPBCF keeps negative which works against that. △KQblade and △KQPBCF are both negative making for the decreasing of the overall torque coefficient benefitting the propulsion efficiency. △KQboss and △KQcap are not included here, since they both have much smaller orders of magnitude. That is, they have little influence on the △KQ.
Fig. 12 Effect of Different part of PBCF for propeller Full Scale Case The open water CFD simulation for propeller without PBCF using IDDES model is firstly conducted to make sure IDDES is still reliable in full scale case. Although there is no open water experiment data for the full scale of this propeller, ITTC1978 recommends a corrected formula to transfer the model scale results to full scale results. Comparison of ITTC1978 transferred results and computed propeller characteristics without PBCF IDDES is shown in Table 4 and Fig. 13. The error of IDDES results compared to experiment are all less than 5% proving that IDDES can well forecast the open water characteristic of full scale propeller. Fig. 14 shows the comparison of PBCF performance between model and full scale. It is noted that since △KQboss and △KQcap have much smaller orders of magnitude than the other coefficient, the analysis will ignore the influence of the torque of boss and cap. Also, △KTPBCF/KTPBCF is smaller and △KQPBCF/KQPBCF is larger at full scale than that at model scale. Although there is little difference of △KTboss/KTboss, △KTcap/KTcap, △KQboss/KQboss, △KQcap/KQcap between model and full scale, it seems that the scale effect mainly have influence on the fins.
Fig. 13 Open water characteristics of ITTC transferred and CFD results
809
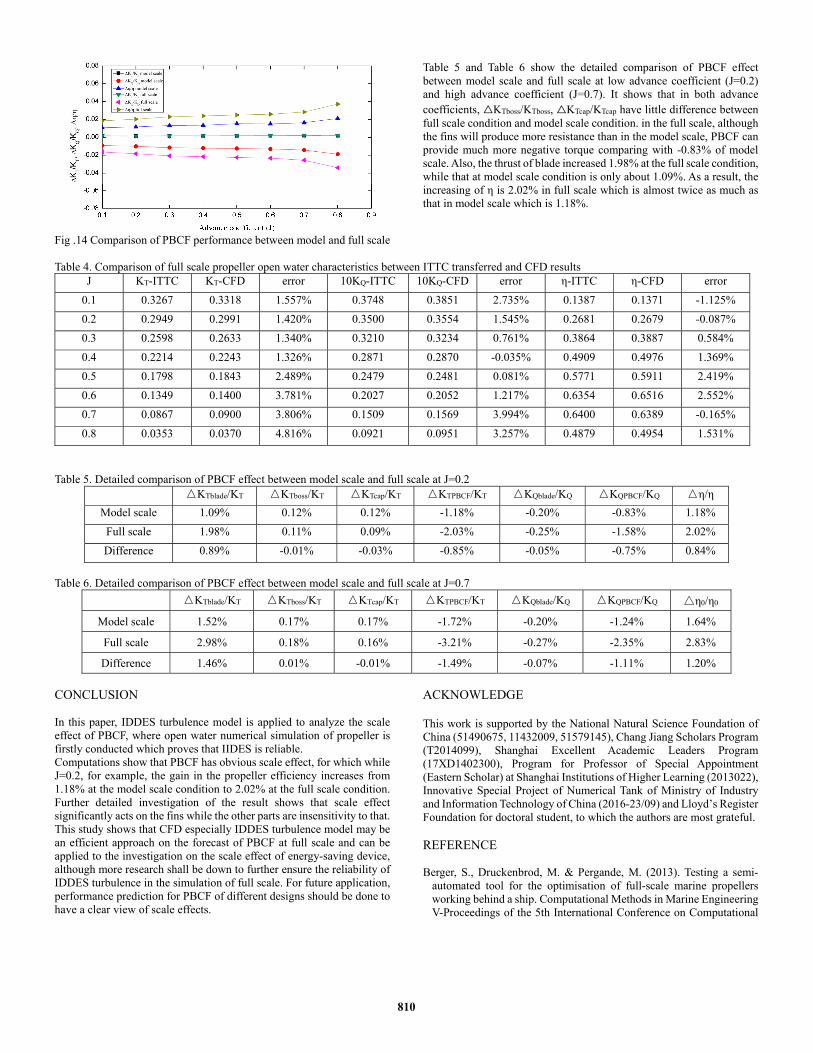
Fig .14 Comparison of PBCF performance between model and full scale
Table 5 and Table 6 show the detailed comparison of PBCF effect between model scale and full scale at low advance coefficient (J=0.2) and high advance coefficient (J=0.7). It shows that in both advance coefficients, △KTboss/KTboss, △KTcap/KTcap have little difference between full scale condition and model scale condition. in the full scale, although the fins will produce more resistance than in the model scale, PBCF can provide much more negative torque comparing with -0.83% of model scale. Also, the thrust of blade increased 1.98% at the full scale condition, while that at model scale condition is only about 1.09%. As a result, the increasing of η is 2.02% in full scale which is almost twice as much as that in model scale which is 1.18%.
Table 4. Comparison of full scale propeller open water characteristics between ITTC transferred and CFD results
J KT-ITTC KT-CFD error 10KQ-ITTC 10KQ-CFD error η-ITTC η-CFD error 0.1 0.3267 0.3318 1.557% 0.3748 0.3851 2.735% 0.1387 0.1371 -1.125% 0.2 0.2949 0.2991 1.420% 0.3500 0.3554 1.545% 0.2681 0.2679 -0.087% 0.3 0.2598 0.2633 1.340% 0.3210 0.3234 0.761% 0.3864 0.3887 0.584% 0.4 0.2214 0.2243 1.326% 0.2871 0.2870 -0.035% 0.4909 0.4976 1.369% 0.5 0.1798 0.1843 2.489% 0.2479 0.2481 0.081% 0.5771 0.5911 2.419% 0.6 0.1349 0.1400 3.781% 0.2027 0.2052 1.217% 0.6354 0.6516 2.552% 0.7 0.0867 0.0900 3.806% 0.1509 0.1569 3.994% 0.6400 0.6389 -0.165% 0.8 0.0353 0.0370 4.816% 0.0921 0.0951 3.257% 0.4879 0.4954 1.531%
Table 5. Detailed comparison of PBCF effect between model scale and full scale at J=0.2
△KTblade/KT △KTboss/KT △KTcap/KT △KTPBCF/KT △KQblade/KQ △KQPBCF/KQ △η/η Model scale 1.09% 0.12% 0.12% -1.18% -0.20% -0.83% 1.18%
Full scale 1.98% 0.11% 0.09% -2.03% -0.25% -1.58% 2.02% Difference 0.89% -0.01% -0.03% -0.85% -0.05% -0.75% 0.84%
Table 6. Detailed comparison of PBCF effect between model scale and full scale at J=0.7 △KTblade/KT △KTboss/KT △KTcap/KT △KTPBCF/KT △KQblade/KQ △KQPBCF/KQ △η0/η0
Model scale 1.52% 0.17% 0.17% -1.72% -0.20% -1.24% 1.64%
Full scale 2.98% 0.18% 0.16% -3.21% -0.27% -2.35% 2.83%
Difference 1.46% 0.01% -0.01% -1.49% -0.07% -1.11% 1.20%
CONCLUSION In this paper, IDDES turbulence model is applied to analyze the scale effect of PBCF, where open water numerical simulation of propeller is firstly conducted which proves that IIDES is reliable. Computations show that PBCF has obvious scale effect, for which while J=0.2, for example, the gain in the propeller efficiency increases from 1.18% at the model scale condition to 2.02% at the full scale condition. Further detailed investigation of the result shows that scale effect significantly acts on the fins while the other parts are insensitivity to that. This study shows that CFD especially IDDES turbulence model may be an efficient approach on the forecast of PBCF at full scale and can be applied to the investigation on the scale effect of energy-saving device, although more research shall be down to further ensure the reliability of IDDES turbulence in the simulation of full scale. For future application, performance prediction for PBCF of different designs should be done to have a clear view of scale effects.
ACKNOWLEDGE This work is supported by the National Natural Science Foundation of China (51490675, 11432009, 51579145), Chang Jiang Scholars Program (T2014099), Shanghai Excellent Academic Leaders Program (17XD1402300), Program for Professor of Special Appointment (Eastern Scholar) at Shanghai Institutions of Higher Learning (2013022), Innovative Special Project of Numerical Tank of Ministry of Industry and Information Technology of China (2016-23/09) and Lloyd’s Register Foundation for doctoral student, to which the authors are most grateful. REFERENCE Berger, S., Druckenbrod, M. & Pergande, M. (2013). Testing a semi-
automated tool for the optimisation of full-scale marine propellers working behind a ship. Computational Methods in Marine Engineering V-Proceedings of the 5th International Conference on Computational
810
Methods in Marine Engineering, 512-529. Dang, J., Dong, G., & Chen, H. (2012). An Exploratory Study on the
Working Principles of Energy Saving Devices (ESDs): PIV, CFD Investigations and ESD Design Guidelines. ASME 2012, International Conference on Ocean, Offshore and Arctic Engineering. 8, 1280-1287.
Druckenbrod, M., Wang, K., Greitsch, L., Heinke, H. J. & Abdel-Maksoud, M. (2015). Development of hub caps fitted with PBCF. Fourth International Symposium on Marine Propulsors smp’15.
Kawamura, T., Ouchi, K., & Nojiri, T. (2012). Model and full scale CFD analysis of propeller boss cap fins (PBCF). Journal of Marine Science & Technology, 17(4), 469-480.
Ma Y., Xin G., Shi X., & Huang G. (2011). Numerical Evaluation and Experimental Study of Energy Saving Device-Propeller Boss Cap Fins. Shipbuilding of China, 52(a01), 7-18.
Mizzi, K., Demirel, Y. K., Banks, C., Turan, O., Kaklis, P., & Atlar, M. (2017). Design optimisation of propeller boss cap fins for enhanced propeller performance. Applied Ocean Research, 62, 210-222.
Nojiri, T., Ishii, N., & Kai, H. (2010). Energy saving technology of PBCF (propeller boss cap fins) and its evolution. Journal of the Marine Engineering Society in Japan, 46(3), 350-358.
Ouchi K., Ogura M., Kono Y., Orito H., Shiosu T., Tamashima M., & Koizuka H. (1988). A Research and Development of PBCF (Propeller
Boss Cap Fins): Improvement of Flow from Propeller Boss. Journal of the Society of Naval Architects of Japan, 163, 66-78.
Ouchi, K., Tamashima, M., Kawasaki, T., & Koizuka, H. (1989). A research and development of PBCF (Propeller Boss Cap Fins): 2nd report: study on propeller slipstream and actual ship performance. Journal of the Society of Naval Architects of Japan, 165, 43-53.
Ouchi, K. (1992). Effect and Application of PBCF (Propeller Boss Cap Fins). Journal of MESJ,27(9), 768-778.
Spalart, P. R., Jou, W. H., Strelets, M., & Allmaras, S. R. (1997). Comments on the Feasibility of LES for Wings, and on a Hybrid RANS/LES Approach. Advances in DNS/LES.
Shur, M. L., Spalart, P. R., Strelets, M. K., & Travin, A. K. (2008). A hybrid rans-les approach with delayed-des and wall-modelled les capabilities. International Journal of Heat & Fluid Flow, 29(6), 1638-1649.
Travin, A. K., Shur, M. L., Spalart, P. R., Kh, M., & Strelets. (2006). Improvement of delayed detached-eddy simulation for les with wall modelling. Eccomas CFD.
Wang C., Huang S., Chang X., & Z J. (2009). The Prediction of Hydrodynamic Performance of Propeller Boss Cap Fins. Ship & Ocean Engineering, 38(6), 20-24.
811