numerical simulation for particle penetration depth distribution in deep bed filtration
TRANSCRIPT
Full Paper
Numerical Simulation for Particle PenetrationDepth Distribution in Deep Bed Filtration
A two-dimensional model has been developed to simulate particle penetrationthrough porous media. The particle penetration depends on many parameters in-cluding the Reynolds number, particle drag coefficient, the ratio of the diameterof injected to filtered particles, fluid velocity, and pore size, etc. The numericalmodel for separation efficiency in periodic porous media was studied. Previouswork has described the effects of injected particle size, Reynolds number and par-ticle drag coefficient. In this study, the porous media flow is modeled (solution ofthe Navier-Stokes equations) by using the finite element method, and the analysisis restricted to the case of two-dimensional periodic porous media. The effects ofthese factors and particle depth distribution in porous media are investigated. Itis noted that the results for the three Reynolds numbers 1, 16.56, and 100, arequalitatively similar, and about 40 % of particles are trapped in the top part ofthe filter.
Keywords: Filtration, Particles, Porous media, Simulation
Received: March 29, 2006; accepted: April 25, 2006
DOI: 10.1002/ceat.200600111
1 Introduction
Deep bed filtration is a process used to separate small solidparticles suspended in a fluid by using granular solids as thecollecting medium. Deep bed filtration has been widely stud-ied, both experimentally and numerically, for several decades.The numerical study of deep bed filter flow requires the mod-eling and solution of particle motion, deposition and fluidflow [1, 2]. The mathematical method of Ganatos et al. [3] isapplicable for computing intercepting gravitational depositionefficiencies, if the injected particles are very small or moveslowly enough, so that inertial effects can be neglected. Thephysical meaning of this assumption is that the injected parti-cles follow the fluid steam lines exactly. The authors find thedeposition efficiency due to gravitational effects is independentof the flow field, and therefore, also independent of the granu-lar bed porosity [3].
Imdakm and Sahimi [4] have carried out a study of thetransport of large particles flowing through porous media.They developed a two-dimensional square network porousmedium using the Monte Carlo method for the modeling ofthis phenomenon. The results of their work show the distribu-
tions of the distance along the direction of average velocitythat the solid particles travel before they cause any plugging. Alot of particles are trapped in the top of the filter. Their model-ing result is in agreement with experimental observations.Ghidaglia et al. [5], studied small non-Brownian particles car-ried inside a model porous medium under laminar flow condi-tions, both experimentally and numerically. They characterizedthe particle penetration depths by considering the hydrody-namic and gravitational forces, along with the important parti-cle sieving from the geometric structure of the pacing. AMonte Carlo simulation that approximated the packing by atwo-dimensional square network of cylindrical tubes was de-veloped along with the experimental study. Two different caseshave been proposed, to model penetration depth distributionin the case of flow direction, and penetration depth distribu-tion in the case of injected methods (individually or in pack-ets). Lee and Koplik [6], studied the evolution of the distribu-tion of trapped particles, as the number of trapped particlesincreases, and analyzed the trapped particle distribution. Anetwork model was used to study the behavior of both the par-ticles and a fluid in a filter.
It is possible to numerically estimate the macroscopic parti-cle deposition of a microstructured porous medium by includ-ing its key microstructural features in the computational do-main. In the present work, the porous media flow is modeledand the analysis is restricted to the case of two-dimensionalperiodic porous media. The computational domain is discre-tized using the finite element method. In the simulation, the
© 2006 WILEY-VCH Verlag GmbH & Co. KGaA, Weinheim http://www.cet-journal.com
C. Shin1
1 Samsung SDI Co. Ltd.,Suwon-si, South Korea.
–Correspondence: C. Shin ([email protected]), Samsung SDI Co.Ltd., 575, Shin-dong, Yeongtong-gu, Suwon-si, Gyeonggi-do, 443–391,South Korea.
Chem. Eng. Technol. 2006, 29, No. 8, 905–909 905
penetration depth distributions are exam-ined for different numbers of particles in-jected and different Reynolds numbers.The objective of this paper is to present theeffects of drag coefficient, and injected par-ticles on separation efficiency, and to simu-late the penetration depth distributions indeep bed filtration.
2 Periodic Porous Media
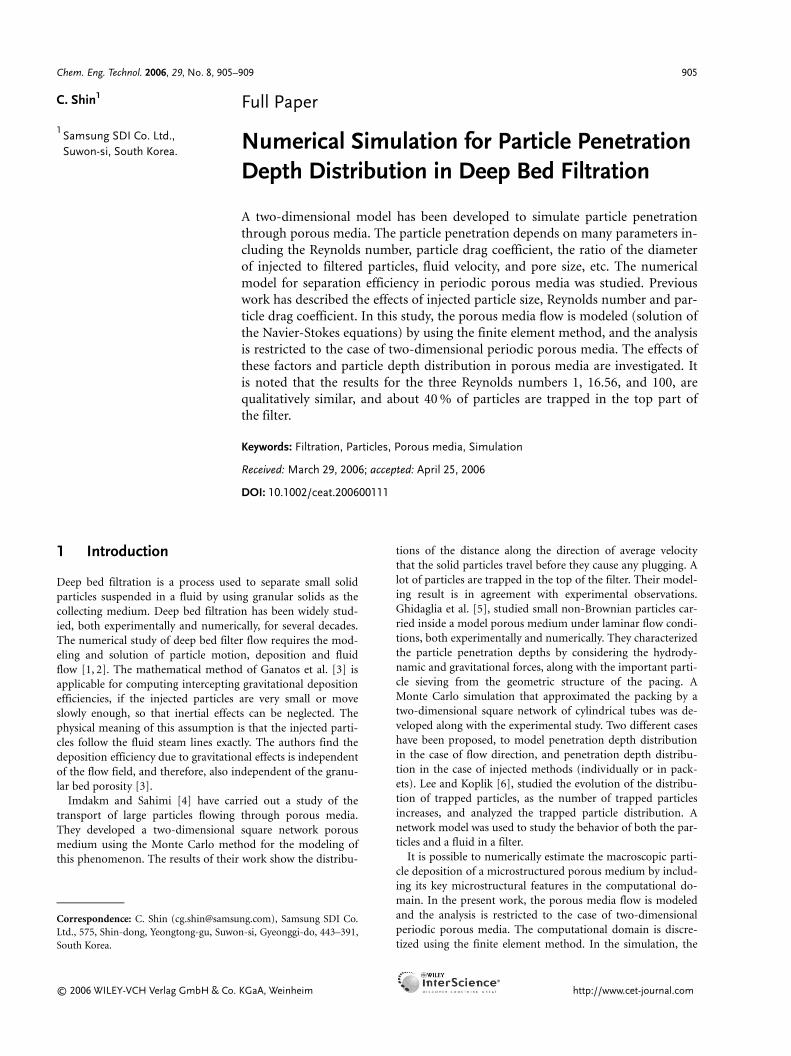
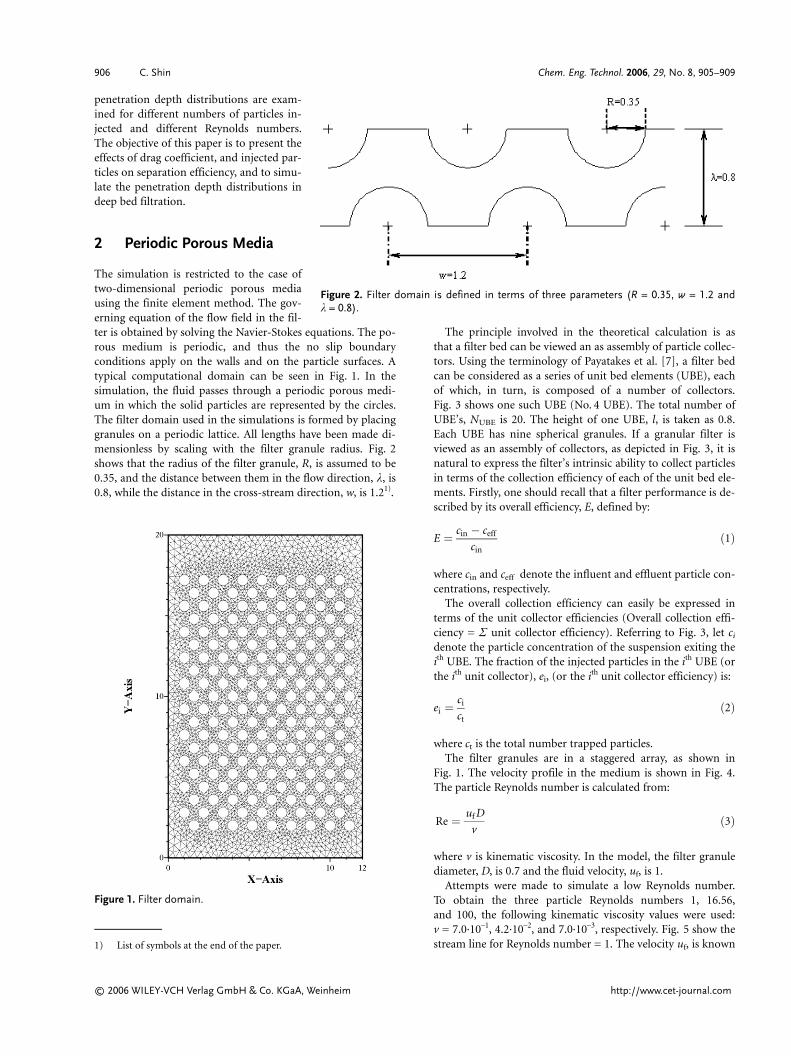
The simulation is restricted to the case oftwo-dimensional periodic porous mediausing the finite element method. The gov-erning equation of the flow field in the fil-ter is obtained by solving the Navier-Stokes equations. The po-rous medium is periodic, and thus the no slip boundaryconditions apply on the walls and on the particle surfaces. Atypical computational domain can be seen in Fig. 1. In thesimulation, the fluid passes through a periodic porous medi-um in which the solid particles are represented by the circles.The filter domain used in the simulations is formed by placinggranules on a periodic lattice. All lengths have been made di-mensionless by scaling with the filter granule radius. Fig. 2shows that the radius of the filter granule, R, is assumed to be0.35, and the distance between them in the flow direction, k, is0.8, while the distance in the cross-stream direction, w, is 1.21).
The principle involved in the theoretical calculation is asthat a filter bed can be viewed an as assembly of particle collec-tors. Using the terminology of Payatakes et al. [7], a filter bedcan be considered as a series of unit bed elements (UBE), eachof which, in turn, is composed of a number of collectors.Fig. 3 shows one such UBE (No. 4 UBE). The total number ofUBE’s, NUBE is 20. The height of one UBE, l, is taken as 0.8.Each UBE has nine spherical granules. If a granular filter isviewed as an assembly of collectors, as depicted in Fig. 3, it isnatural to express the filter’s intrinsic ability to collect particlesin terms of the collection efficiency of each of the unit bed ele-ments. Firstly, one should recall that a filter performance is de-scribed by its overall efficiency, E, defined by:
E � cin � ceff
cin�1�
where cin and ceff denote the influent and effluent particle con-centrations, respectively.
The overall collection efficiency can easily be expressed interms of the unit collector efficiencies (Overall collection effi-ciency = R unit collector efficiency). Referring to Fig. 3, let ci
denote the particle concentration of the suspension exiting theith UBE. The fraction of the injected particles in the ith UBE (orthe ith unit collector), ei, (or the ith unit collector efficiency) is:
ei � ci
ct�2�
where ct is the total number trapped particles.The filter granules are in a staggered array, as shown in
Fig. 1. The velocity profile in the medium is shown in Fig. 4.The particle Reynolds number is calculated from:
Re � uf D
v�3�
where v is kinematic viscosity. In the model, the filter granulediameter, D, is 0.7 and the fluid velocity, uf, is 1.
Attempts were made to simulate a low Reynolds number.To obtain the three particle Reynolds numbers 1, 16.56,and 100, the following kinematic viscosity values were used:v = 7.0·10–1, 4.2·10–2, and 7.0·10–3, respectively. Fig. 5 show thestream line for Reynolds number = 1. The velocity uf, is known
© 2006 WILEY-VCH Verlag GmbH & Co. KGaA, Weinheim http://www.cet-journal.com
Figure 1. Filter domain.
Figure 2. Filter domain is defined in terms of three parameters (R = 0.35, w = 1.2 andk = 0.8).
–1) List of symbols at the end of the paper.
906 C. Shin Chem. Eng. Technol. 2006, 29, No. 8, 905–909
at center of the inlet, and for the current simulations, a valueof uf = 1.0 is assumed, and the traction boundary conditionsare specified at the exit, according to:
mdvp
dt� CD�uf � up� �4�
mdvp
dt� f �5�
upn�1� upn
� f dt (6)
where m is the particle mass, CD is the drag coefficient, up isthe particle velocity, and uf is the fluid velocity. This drag coef-ficient is fixed at 20, because the drag coefficient possesses dif-ferent filter efficiencies for each of the three particle Reynoldsnumbers.
The porosity, e, is defined as:
e � p r2
2wk�7�
and for the simulations, is held fixed at 0.80. This is achievedby keeping the product, w k = 0.96.
3 Problem Statement and BoundaryConditions
The objective is to numerically simulate the flow of periodicporous media, and use the simulation results for estimatingboth the effective drag coefficient, and particle size, as well asaiding the understanding of the particle deposition in the deepbed filter. The fluid is assumed to be incompressible. At the in-let of the computational domain, the velocity, uf, is assumed,and at the exit:
u�inlet�exit � x�2a � x�a2
�8�
The no slip velocity boundary condition is applied at thesurface of filter particles and the periodic boundary:
u � 0
∂u∂x
� 0
��� �9�
is applied at the side walls of the domain.The trajectories of the particles are used to study the behav-
ior of the filter. These trajectories are calculated by integratingEq. (6) using the following second order scheme:
xpn�1� xpn
� upn� upn�1
2�Dt� �10�
ypn�1� ypn
� upn�upn�1
2�Dt� (11)
where xp, yp is the particle position, and Dt is the time step.These trajectories can be determined when the particle velocityat both the present and the previous time steps, are known.The number of particles released is increased until the statisti-cal properties of the filter become independent of this number.The time step used in the calculation is decreased to a valuesuch that the results become independent of the time step.One of the objectives of this work was to analyze the particlepenetration depth distribution by considering when each ofhydrodynamic, gravitational, and drag forces were dominant.In the study, it is assumed that the velocity field obtainedabove remains valid when small particles are injected alongwith the fluid. This assumption is reasonable provided the vol-ume concentration of injected particles is sufficiently small. Inthis limit of low concentration, the motion of a small particlein governed by Eq. (5), where f is the hydrodynamic force act-ing on the particle.
When the particles are injected individually, their trajec-tories inside the filter are calculated from Eqs. (10) and (11).As particles move toward the filter granule, their trajectoriesdeviate from the streamlines, and some of them may intersectwith the filter granule as the particles overlap. It is assumedthat the injected particle is captured at the surface of the filtergranule. If a particle moves out of the domain without touch-ing or colliding with any filter particle, it is assumed that it isnot captured.
The injected particles are assumed to have a fixed radius, r,which is varied to study its effect on the filter efficiency. In thecurrent simulations, the radius of the injected particle, r, is0.0001, where in this case the particles are individually in-jected. It is further assumed, based on the relative velocity ofthe fluid and particle, that the Reynolds number is small.Therefore CD is inversely proportional to the Reynolds num-ber. A single particle at a time is injected into the filter and theinitial velocity of the particle is taken to be zero. The particlesare released at y = 19, (see Fig. 1) and the value of x is variedto sample the channel width. A large number of particles arereleased at different uniformly distributed values of x.
4 Results and Discussion
The Navier-Stokes and continuity equations are solved usingthe finite element method in periodic computational domains
© 2006 WILEY-VCH Verlag GmbH & Co. KGaA, Weinheim http://www.cet-journal.com
Figure 3. One unit bed element (No. 4 UBE).
Figure 4. Velocity field in a model (No. 4 UBE).
Figure 5. Filter stream line for Re = 1 (No. 4 UBE).
Chem. Eng. Technol. 2006, 29, No. 8, 905–909 Filtration 907
using defined boundary conditions. The inlet and outlet flowsare assumed to be parabolic and the periodic boundary condi-tions are applied at the two side walls. The velocity is forced tobe zero on the surface of the filter granules. The particles to betrapped are released at the top of the filter bed. The initial ve-locity of these particles is assumed to be zero. Initially, the par-ticles move with the flowing fluid. Some particles are trappedwhile others pass through the filter.
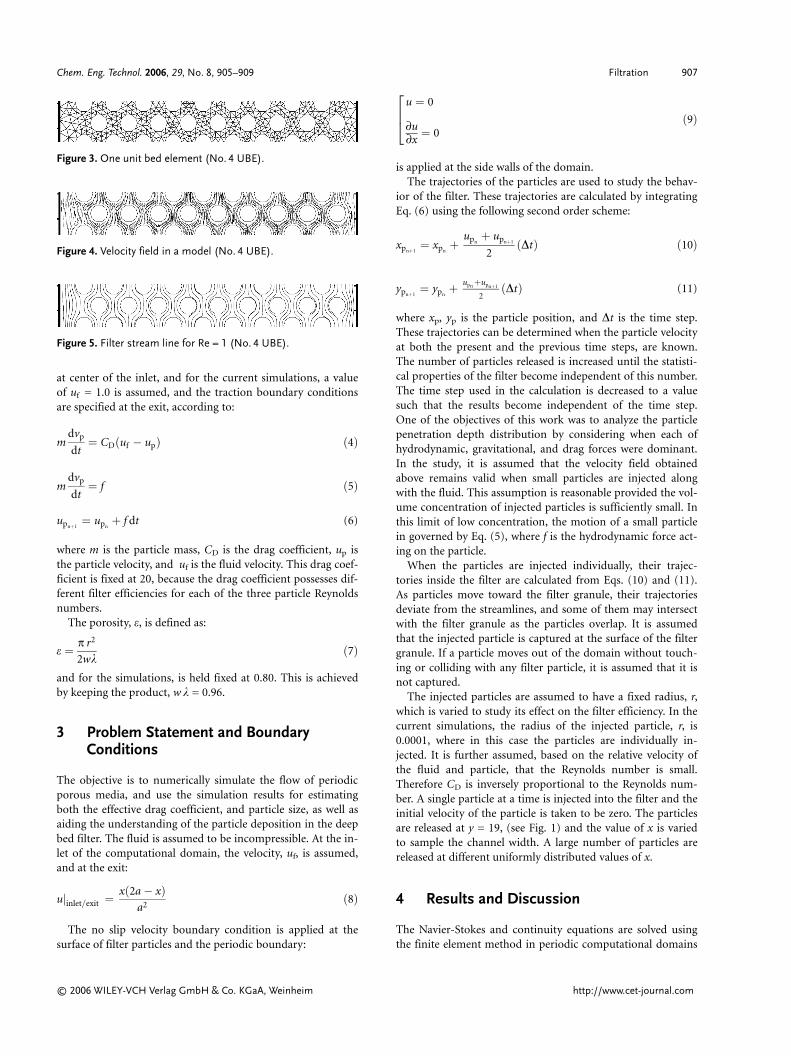
The purpose of this work was to simulate the porous medi-um for available results relating to this flow and to evaluate indetail their efficiency as a means for predicting the drag coeffi-cient at three different Reynolds number. Results for the dragforce action on a stationary sphere in a moving fluid at variousReynolds number from a staggered array model have been cal-culated and expressed in terms of the separation efficiency, E,for various values of the drag coefficient, CD. In this section, itis shown that the separation efficiency can be related to thedrag coefficient. Fig. 6 shows that the overall efficiency of par-ticles injected individually in the case of downward flow andfor r = 0.001. It is seen that the separation efficiency dependson the drag coefficient, only when the value of CD is between10 and 100. In this drag coefficient range, the reduction offiltration efficiency for Re = 1 is slower compared withRe = 16.56, and Re = 100. For CD < 10, the separation efficien-cy is approximately one, and for CD > 100, the separation effi-ciency is again constant at about 0.42. This graph shows thatthe separation efficiency is high when CD is low for everyReynolds number in this study.
The filter efficiency depends on the drag coefficient, CD,when CD is between 10 and 100. For CD < 10, the filter efficien-cy is approximately one, and for CD > 100, the filter efficiencyis again constant. Thus, CD was set to equal 20 and differentfilter efficiencies were observed for the Reynolds number ofthree different filter granules. In a previous study [1], the nu-merical results for the injected particle radius were studied(500 particles injected individually and the drag coefficient,CD, was 20). When the particle radius is increased, the filterefficiency also increases. The injected particle radius was set tor = 0.001, which can lead to a greatly different filter efficiencyfor the three different Reynolds numbers for the filter granule.When r increases from 0.00001 to 0.001, the filter efficiency isnot changed. From r = 0.001, the filter efficiency increases and
when r is above 0.1, the injected particles are all trapped in thefilter domain. In order to ensure that the time step used in thesimulation is sufficiently small, Dt was varied. Since the filterefficiency becomes independent of the value ofDt used, it is setto 0.001.
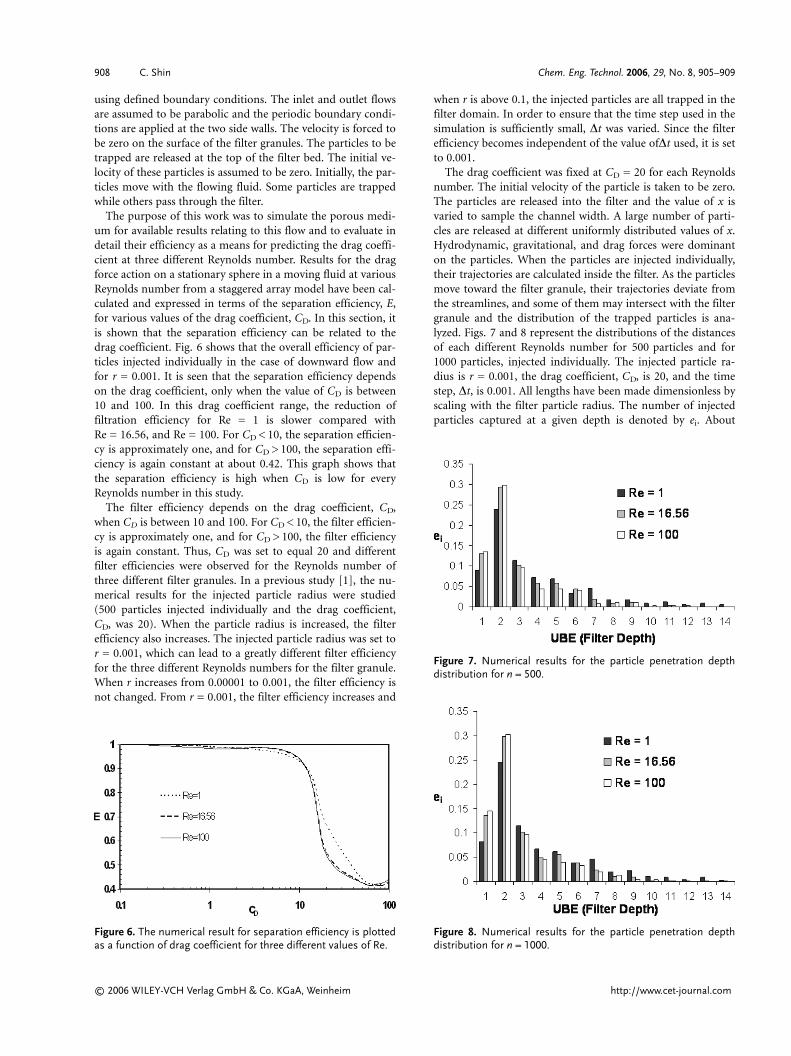
The drag coefficient was fixed at CD = 20 for each Reynoldsnumber. The initial velocity of the particle is taken to be zero.The particles are released into the filter and the value of x isvaried to sample the channel width. A large number of parti-cles are released at different uniformly distributed values of x.Hydrodynamic, gravitational, and drag forces were dominanton the particles. When the particles are injected individually,their trajectories are calculated inside the filter. As the particlesmove toward the filter granule, their trajectories deviate fromthe streamlines, and some of them may intersect with the filtergranule and the distribution of the trapped particles is ana-lyzed. Figs. 7 and 8 represent the distributions of the distancesof each different Reynolds number for 500 particles and for1000 particles, injected individually. The injected particle ra-dius is r = 0.001, the drag coefficient, CD, is 20, and the timestep, Dt, is 0.001. All lengths have been made dimensionless byscaling with the filter particle radius. The number of injectedparticles captured at a given depth is denoted by ei. About
© 2006 WILEY-VCH Verlag GmbH & Co. KGaA, Weinheim http://www.cet-journal.com
Figure 6. The numerical result for separation efficiency is plottedas a function of drag coefficient for three different values of Re.
Figure 7. Numerical results for the particle penetration depthdistribution for n = 500.
Figure 8. Numerical results for the particle penetration depthdistribution for n = 1000.
908 C. Shin Chem. Eng. Technol. 2006, 29, No. 8, 905–909
40 % of the particles were trapped in the top part of the filter.It is found that the results for the three Reynolds numbers 1,16.56, and 100, are qualitatively similar and many particleswere trapped in the top part of filter when the Reynolds num-ber is high. Although the three distributions for the three val-ues of Reynolds number are qualitatively similar, the distancethat is traveled by the particles is larger for the low values ofReynolds number. This numerical result is in agreement withthe previous simulations [4, 5, 8].
5 Conclusions
A finite element simulation approach to the problem of parti-cle penetration depth distribution in deep bed filter media hasbeen developed. This method offers a general technique forthe linking of the deep bed filter modeled by the Navier-Stokesequations to flow through a periodic porous medium. In thepresent study, the distributions of the trapped particle werestudied inside the filter depth. When r is changed from0.00001 to 0.001, the separation efficiency is not changed. Theprimary quantities of interest were the effect of particle size,Reynolds number and drag coefficient on the separation effi-ciency. The separation efficiency increased with increasinginjected particle size. The separation efficiency was found toincrease with increasing Reynolds number. The ranges of thedrag force were examined for different Reynolds numbers, i.e.,Re = 1, 16.56 and 100. It was discovered that the drag coeffi-cient range, (10 < CD < 100) will change the separation effi-ciency. About 40 % of particles were trapped in the top part ofthe filter. It is found that the results for the three Reynoldsnumbers 1, 16.56, and 100, are qualitatively similar and manyparticles were trapped in the top part of filter. The results arein qualitative agreement with previous experimental data[4, 5, 8]. In this case, the hydrodynamic force, gravity force,and inertial force on the particles were seen to be dominant.The particle behavior is too simple to be compared with ex-perimental data. However, finite element simulation modelsare believed to be representative of deep bed filter media.
Symbols used
CD drag coefficientci number of particles exiting the ith UBEcin number of particles injected into the filterceff number of particles effluentct total number trapped particleD diameter of granuled distanceE separation efficiencyei ith unit collector efficiencyi particle number in the modelm particle massn number of particlesp particle coordinatesR the radius of the filter granuleRe granular Reynolds numberr radius of injected particleuf fluid velocityup particle velocityv kinematic viscosityw distance between granular particle in cross stream
directionX plane of networkx bed widthxp particle x-positionyp particle y-positione porosityDt time stepk distance between granular particle in cross-stream
direction
References
[1] C. Shin, Chem. Eng. Sci. 2006, 61, 2324.[2] R. Rajagopalan, C. Tien, AIChE J. 1976, 22, 523.[3] P. Ganatos, R. Pfeffer, S. Weinbaum, J. Fluid Mechanics 1978,
84, 79.[4] A. O. Imdakm, M. Sahimi, Phys. Rev. A 1987, 36, 5304.[5] C. Ghidaglia, L. Arcangelis, J. Hinch, E. Guazzelli, Phys.
Fluids 1996, 8, 6.[6] J. Lee, J. Koplik, Phys. Rev. E 1996, 54, 4011.[7] A. C. Payatakes, C. Tien, R. M. Turian, AIChE J. 1973, 19,
58.[8] V. Nassehi, Chem. Eng. Sci. 1998, 53, 1253.
© 2006 WILEY-VCH Verlag GmbH & Co. KGaA, Weinheim http://www.cet-journal.com
Chem. Eng. Technol. 2006, 29, No. 8, 905–909 Filtration 909