numerical simulation of hurricane bonnie (1998)....
TRANSCRIPT

Numerical Simulation of Hurricane Bonnie (1998). Part III: Energetics
WALLACE HOGSETT AND DA-LIN ZHANG
Department of Atmospheric and Oceanic Science, University of Maryland, College Park, College Park, Maryland
(Manuscript received 29 January 2009, in final form 13 March 2009)
ABSTRACT
Despite considerable research on tropical cyclones (TCs), few studies have been performed to examine
inner-core energy conversions because of the lack of high-resolution data. In this study, the TC energetic
characteristics in relation to intensity and structural changes under different sheared environments are in-
vestigated using a 5-day cloud-resolving simulation of Hurricane Bonnie (1998). Results show that in the
presence of intense vertical shear Bonnie undergoes high-frequency fluctuations in intensity and energy
conversions (at a time scale of 3 h) during the partial eyewall stage. The fluctuations are closely related to the
life cycle of individual convective elements that propagate cyclonically around the downshear portion of the
eyewall. The energy conversions are shown to be maximized in the vicinity of the radius of maximum wind
(RMW), thus affecting strongly TC intensity. On average, about 2% of latent energy can be converted to
kinetic energy to increase TC intensity. After the vertical shear subsides below a threshold, intensity fluc-
tuations become small as convective elements reorganize into an axisymmetric eyewall in which energy
conversions are more evenly distributed.
Fourier decomposition is conducted to separate the wavenumber-0, -1, and -2 components of inner-core
energetics. Whereas wavenumber-1 perturbations dominate the partial eyewall stage, the propagation of
wavenumber-2 perturbations is shown to be closely related to individual convective elements during both the
partial eyewall and axisymmetric stages. The wavenumber-2 perturbations can be traced as they move around
the eyewall in the form of vortex–Rossby waves, and they play a role in determining the large intensity
fluctuations during the partial eyewall stage and the formation of an outer eyewall to replace the partial inner
eyewall at the later stage.
1. Introduction
Tropical cyclones (TCs) devastate life and property by
concentrating large amounts of kinetic energy (KE)
within a small radius in the inner-core regions. Most of
the KE is generated through a continuous series of en-
ergy conversions, with the latent energy (LE) as the
fundamental source, which is obtained primarily through
upward fluxes of latent heat from the underlying warm
ocean and released in convective clouds in the eyewall.
Some of the released LE is used to increase KE via
pressure adjustment to the gradient–wind balance, and
the location and quantity of such energy transformations
dictate the intensification rate of TCs.
Several observational and modeling studies have been
performed to understand the KE production in relation
to LE in TCs. Frank (1977) used composites of rawin-
sondes to calculate the KE and moist static energy bud-
gets of TCs and showed how TCs import KE from their
environment and produce most KE in the near-surface
layer. McBride (1981) composited data from both the
Atlantic and Pacific basins to calculate energy budgets for
different tropical cloud clusters. It was found that inten-
sifying storms are characterized by a synoptic-scale in-
crease in KE and a decrease in LE, which is consumed
through latent heat release (LHR). Both studies, how-
ever, were limited by the poor resolution of observations
from investigating the energetic processes of an individ-
ual storm. The lack of observations over the tropical
oceans is particularly troublesome for studying impor-
tant energetic processes that occur in the inner-core
convective regions, which are not conducive to in situ
measurements.
However, the ability of mesoscale models to reproduce
the structures and evolution of TCs and provide dense,
high-quality data is continually increasing. For example,
Tuleya and Kurihara (1975) used the Geophysical Fluid
Corresponding author address: Dr. Da-Lin Zhang, Dept. of
Atmospheric and Oceanic Science, University of Maryland, College
Park, College Park, MD 20742–2425.
E-mail: [email protected]
2678 J O U R N A L O F T H E A T M O S P H E R I C S C I E N C E S VOLUME 66
DOI: 10.1175/2009JAS3087.1
� 2009 American Meteorological Society
Dynamics Laboratory (GFDL) TC model to simulate an
idealized TC, and they calculated budgets of mean and
eddy KE, as well as LE, at different stages of storm
development. They found that the KE budgets are de-
termined primarily by the mean flow, although the con-
tribution of eddies is not negligible. Wang (2002a) also
examined the inner-core energetics of a simulated TC
vortex and found that the maximum eddy KE, located
in the lower levels near the radius of maximum wind
(RMW), appears to be associated with vortex–Rossby
waves (VRWs). Although VRWs have been hypothe-
sized to be active in the inner core of TCs (Montgomery
and Kallenbach 1997) and have been observed using
radar data (Reasor et al. 2000; Corbosiero et al. 2006)
and simulated in high-resolution models (e.g., Wang
2001, 2002a,b), nonetheless their roles in intensity changes
remain unclear. Corbosiero et al. (2006) showed that
wavenumber-2 features propagate around the eyewall
of a vertically sheared hurricane and resemble theoreti-
cal VRWs in their tangential and outward propagation
speeds. VRWs may develop as a result of barotropic in-
stability in the eyewall (Kossin et al. 2000) or vertical
shear (Reasor and Montgomery 2001). But the relative
active or passive nature of the waves in TC intensity
changes remains elusive.
Recently, cloud-resolving models have been success-
fully applied to simulating the structures and evolution of
hurricanes with real observations at very high resolution
(e.g., Liu et al. 1997; Braun 2002; Zhu et al. 2004, here-
after Part I) and they have evolved to the point where
they can be used to confidently investigate the inner-core
dynamics of individual storms. Given the observational
limitations, such real-data simulations could provide dy-
namically consistent data to study energetic and wave
characteristics of TCs. Thus, the purposes of this study are
(i) to present the three-dimensional (3D) structures and
evolution of hurricane energetics in relation to intensity
and structural changes during its life cycle, (ii) to provide
insight into the energy conversion processes that link
the TC energetics, and (iii) to examine the roles of deep
convection and VRWs in determining the hurricane in-
tensity and structural fluctuations. These will be achieved
by performing quasi-Lagrangian budget analyses of a
cloud-resolving simulation of Hurricane Bonnie (1998)
using the fifth-generation Pennsylvania State University–
National Center for Atmospheric Research Mesoscale
Model (MM5), as described in Part I. In Zhu and Zhang
(2006a, hereafter Part II) numerical experiments were
conducted to test the sensitivity of the simulation to mi-
crophysical processes, which expectedly play a significant
role in the intensification of the storm.
The next section provides a brief review of Hurricane
Bonnie (1998) and the model simulation from Part I.
Section 3 presents the budget equations used for the study.
Section 4 shows time series of the storm-integrated KE
and LE budgets. Section 5 examines the 3D structures
of the energy conversion processes. Section 6 shows the
evolution of the mean and eddy components of KE and
relates the KE intensity changes to the azimuthal and
radial propagations of VRWs during two different stages
of Bonnie. A summary and concluding remarks are given
in the final section.
2. Overview
During its lifetime, Bonnie underwent a complex in-
tensity and structural evolution. Airborne radar observa-
tions show that the eyewall was highly asymmetric during
22–25 August 1998—a period of rapid intensification—
and then it evolved through an eyewall replacement into a
more axisymmetric structure during 25–27 August, prior
to landfall. The structural evolution can be explained in
terms of vertical wind shear that was strongest during
the partial eyewall stage and then weakened to allow for
axisymmetrization. That is, the highest radar reflectivity
occurred on the downshear (left) side of the shear vector
with a wavenumber-1 asymmetry early in Bonnie’s life-
time, and Bonnie began to transition to a more classic
axisymmetric TC devoid of significant asymmetric struc-
tures as the shear subsided on 24 August.
Observational studies of Bonnie suggest that her
structural evolution is more complicated than the above
description. Heymsfield et al. (2001) used satellite and
airborne radar data to show that during the partial eyewall
stage several convective cells developed and decayed, one
after the other, on the downshear side of the vortex. They
showed that convective cells developed downshear and
progressed cyclonically around the downshear (left) half
of the storm. They suggested that downdrafts inside the
eye, associated with the episodic vigorous eyewall up-
drafts, may enhance the warm core of the storm. Molinari
and Vollaro (2008) used dropsondes and satellite data to
show that the downshear side of Bonnie not only ex-
hibited episodic cellular convection but also contained
a sufficient balance of instability and vertical shear to
support supercells, similar to those observed in the mid-
latitudes. Supercells are well known to have longer life-
times than convective cells that occur in the absence of
vertical shear.
Part I shows that the MM5 simulation of Bonnie
agrees quite well with the observed track, structure, and
intensity. As observed, the simulated Bonnie exhibits
rapid intensification ending at 48 h into the simulation and
subsequently maintains her intensity, except for some
slight oscillations due to an eyewall replacement cycle.
The simulated Bonnie also exhibits the shear-forced
SEPTEMBER 2009 H O G S E T T A N D Z H A N G 2679

wavenumber-1 reflectivity pattern that evolves into axi-
symmetry as the vertical shear subsides.
In this study, we utilize the same model simulation at
the finest mesh size of 4 km that was used in Part I, but
with the model output at time intervals of 15 min, which
will allow for the emergence of details that are not ap-
parent in the 6-hourly output data used in Part I. A time
series of storm intensity, given in Fig. 1, shows that
the general evolution resembles that shown in Part I:
rapid intensification (36–48 h), maintenance (48–66 h),
and finally a weakening (66–81 h) and reintensification
(81–96 h). The latter two phases are associated with an
eyewall replacement cycle, which is characterized by
the decay of the shear-forced partial eyewall centered
around R 5 50 km (Fig. 2a) and the subsequent re-
intensification through the replacement of the inner eye-
wall by an outer axisymmetric eyewall centered around
R 5 100 km (Fig. 2b). This eyewall replacement occurs as
Bonnie moves into an environment with decreasing ver-
tical shear (Part I).
It should be mentioned that the time series of the
maximum surface wind, shown in Fig. 1, exhibits more
significant fluctuations than that in Part I because of the
use of 15-min model output here. The fluctuations dur-
ing 36–66 h, reaching 10 m s21, are semiregular with a
period of 2–5 h, and they are not ‘‘numerical noise’’ but
instead are related to hurricane intensity changes. In
fact, the period with high-amplitude fluctuations coin-
cides with the period when vertical shear is larger than
12 m s21 (see Fig. 8). Thus, as one of the objectives of
this study, we wish to understand the origin and mech-
anisms of the high-frequency intensity fluctuations from
an energetics point of view.
Because Part I has shown many 3D structures of
Bonnie, we will focus here on the energetics during the
following two characteristic stages of Bonnie: the asym-
metric and axisymmetric stages. During the asymmetric
partial eyewall stage, the vertical shear vector points from
west-northwest to east-southeast (Fig. 2a), so the maxi-
mum low-level KE and radar reflectivity are collocated in
the downshear (left) half of the eyewall, with some slight
phase difference. The KE and radar reflectivity also ex-
hibit asymmetric structures along the west–east cross
section, with a greater vertical extent on the eastern side
due to downshear-enhanced vertical motion (Fig. 2c). A
secondary effect of the vertical shear is the downshear tilt
of the vortex.
As the vertical shear decreases to less than 5 m s21,
both the KE and radar reflectivity evolve to axisym-
metry in the horizontal (Fig. 2b) and vertical (Fig. 2d).
That is, the shear-forced horizontal wavenumber-1 struc-
tures have nearly disappeared, and the eyewall evolution
can be described in the context of persistent wavenumber-2
features, as will be shown in section 6. Of interest is that
during this later stage larger KE is distributed over a
larger area in the eyewall (cf. Figs. 2a,b), whereas the
maximum surface wind is actually smaller (Fig. 1). In the
vertical, Bonnie shows a classic axisymmetric upright
vortex, with low-level inflow, outward-sloping eyewall
updrafts, and upper-level outflow (Fig. 2d). The remain-
der of this study will focus on the energetic mechanisms
by which Bonnie undergoes rapid intensity fluctuations
during the partial eyewall stage and on how she transi-
tions between these extreme states of asymmetry and
axisymmetry via an eyewall replacement.
3. Energy equations
In this study, quasi-Lagrangian budget equations for
LE, KE, and total potential energy (TPE) are derived
based on the nonhydrostatic MM5 system (Dudhia
1993). Table 1 summarizes the energetic quantities used
in this study. Various energies per unit volume (J m23)
are defined as
LE 5 rLyq
y,
TPE 5 r(cyT 1 gz) 5 IE 1 PE, and
KE 5 rV
h�V
h
2,
where Vh is the horizontal velocity with respect to the
ground, qy is the water vapor mixing ratio, Ly is the latent
heat of vaporization, cy is the specific heat at constant
FIG. 1. Time series (15 min) of the minimum central pressure
(dashed; hPa) and the maximum surface winds (solid; m s21) from
the 36–96-h simulation. The three characteristic stages of deepen-
ing, maintenance, and eyewall replacement (ERC) are delineated
(bottom line), as well as the asymmetric and axisymmetric stages
(top line). The dotted segment of the ERC stage (84–90 h) denotes
the period in which the most rapid transition to axisymmetry occurs.
2680 J O U R N A L O F T H E A T M O S P H E R I C S C I E N C E S VOLUME 66

volume, and the other variables assume their typical
meteorological definition. The vertical component of
KE, w2/2, is excluded because it is one to two orders of
magnitude smaller than the horizontal component.
We start from a prognostic equation for LE, which is
essentially the available water vapor contained in the
atmosphere, to account for the most crucial component
for TC development and maintenance. It is obtained
by multiplying the water vapor budget equation from
Zhang et al. (2002) by the latent heat of vaporization, Ly:
d
dt(LE) 5�rL
y(Q
con�Q
ev) 1 LHF 1 LE
d lnr
dt, (1)
where the three rhs terms represent sources and sinks of
LE due to condensation and evaporation (LHR), the
evaporative source of vapor fluxes from the ocean sur-
face (LHF), and the condensing or dilution of LE due to
density changes (LDEN). The final term arises from the
inclusion of density in the definition of LE. Note that the
density changes can be estimated as negative 3D ve-
locity divergence through the mass continuity equation.
For the sake of energy conversion analysis, Ly(Qcon 2 Qev)
is approximated by the net heating rate, cp/p du/dt,
where p 5 (p0/p)R/cp, u is the potential temperature,
R is the universal gas constant, and du/dt ’ (V 2 U) �$u,
where U is the horizontal storm motion vector and the
del operator is the 3D gradient. This approximation for
heating introduces errors such as those due to radiation
and the local u tendency resulting from the internal
dynamics, but the latter was found by Zhang et al. (2002)
to be small (see their Figs. 3 and 5).
While the latent heating rates can serve as a proxy for
the LE consumed in deep convection, the same term
appears, but with an opposite sign, in the TPE equation,
which can be obtained directly from the MM5 thermo-
dynamic equation:
d
dt(TPE) 5�$ � (pV) 1 V
H� $p9 1 rL
y(Q
con�Q
ev)
1 SHF 1 TPEd lnr
dt, (2)
where the five terms on the rhs represent the sources
and sinks of TPE due to the convergence of pressure, the
FIG. 2. (a),(b) Horizontal distribution of KE, contoured at intervals of 4 3 102 J kg21, and radar reflectivity
(shaded) at 900 hPa averaged during (a) the 46–47-h and (b) the 96–97-h simulations; (c),(d) the corresponding
west–east vertical cross sections through the storm center. In-plane flow vectors are superposed. The thick arrow in
(a) denotes the vertical shear vector in the 850–200-hPa layer.
SEPTEMBER 2009 H O G S E T T A N D Z H A N G 2681
horizontal cross-isobaric flow (p9 denotes the deviation
from the hydrostatic base-state pressure), the latent
heating rate, sensible heat fluxes from the ocean surface,
and the condensing or dilution of TPE due to density
changes. For the purposes of this study, we will consider
TPE to be simply the intermediary between LE and KE,
both of which will be the focus of the present study.
The KE equation can be obtained by taking the dot
product of the MM5 horizontal momentum equation:
d
dt(KE) 5�V
H� $p9�V
H� F 1 KE
d lnr
dt, (3)
where KE changes because of horizontal cross-isobaric
flow when work is done by air parcels against the hori-
zontal pressure force (KGEN), friction including the
boundary layer processes and vertical and horizontal
diffusion (KDIS), and the condensing or dilution of KE
due to density changes (KDEN).
The intensification and maintenance of a TC can be
described as a series of energy conversions that occur
primarily within its secondary circulations. As moist air
is drawn from the planetary boundary layer (PBL) up-
ward and condensed into liquid water, latent heat is
released in exchange for water vapor. In this way, LE
is converted to TPE through latent heating; that is,
C(LE, TPE) 5 rLy(Qcon 2 Qev). The midtropospheric
warming causes pressure drops below, leading to in-
creases in the pressure gradient force. As a result, KE
must increase, and it does so at the expense of TPE via
adiabatic cross-isobaric flow to regain gradient balance.
Thus, KE is produced through conversion from TPE;
that is, C(TPE, KE) 5 2VH � $p9, and TPE is the in-
termediary between KE and LE.
4. Volume-integrated energetics
Although Eqs. (1)–(3) are useful for estimating the
spatial structures of TC energetics, it would be more
appropriate to use the area- or volume-averaged bud-
gets that could distinguish internal sources/sinks from
the lateral boundary fluxes, especially when the time
evolution of the storm-scale integrated quantities in a
storm-relative framework is examined. For this purpose,
we define a control cylindrical volume of R 5 200 km
and z 5 15 km, centered at the minimum surface pres-
sure, following the movement of Bonnie at 15-min
intervals during the 36–96-h integration. The volume-
integrated form of Eqs. (1)–(3) can be written using
(Dutton 1976)
d
dt
ðV(t)
a dV
" #5
ðV(t)
›a
›tdV 1
ðS
aU � n dS
5
ðV(t)
EsdV 1
ðS
a(U�V) � n dS, (4)
where a denotes LE, KE, and TPE; Es is the energy
sources minus sinks (i.e., the rhs terms of each energy
equation); S represents the two-dimensional surface
that laterally bounds the control volume; and U rep-
resents the horizontal translation velocity of the con-
trol volume. The last rhs term represents the energy
flux divergence at the lateral boundaries. To distinguish
from their differential forms, we refer to the volume-
integrated energies as bulk energetics (i.e., BLE, BKE,
and BTPE). In addition, a volume average has been im-
plicitly assumed for the bulk energies as well as for their
budget terms. By combining Eq. (4) with Eqs. (1) and (3),
and after some manipulation, the volume-integrated
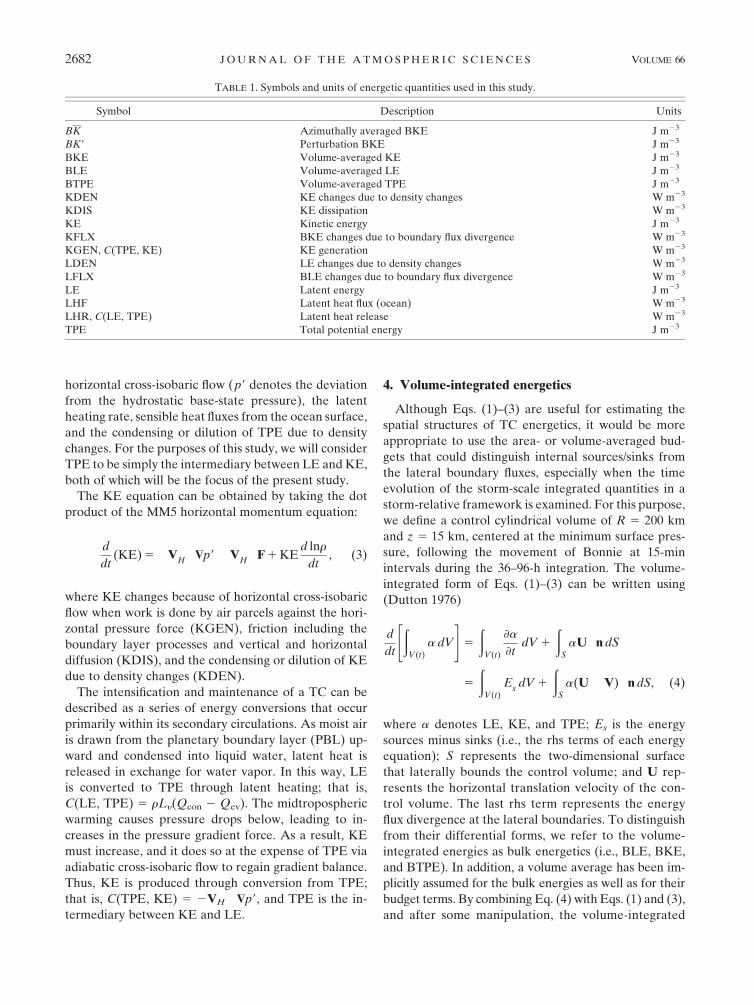
TABLE 1. Symbols and units of energetic quantities used in this study.
Symbol Description Units
BK Azimuthally averaged BKE J m23
BK9 Perturbation BKE J m23
BKE Volume-averaged KE J m23
BLE Volume-averaged LE J m23
BTPE Volume-averaged TPE J m23
KDEN KE changes due to density changes W m23
KDIS KE dissipation W m23
KE Kinetic energy J m23
KFLX BKE changes due to boundary flux divergence W m23
KGEN, C(TPE, KE) KE generation W m23
LDEN LE changes due to density changes W m23
LFLX BLE changes due to boundary flux divergence W m23
LE Latent energy J m23
LHF Latent heat flux (ocean) W m23
LHR, C(LE, TPE) Latent heat release W m23
TPE Total potential energy J m23
2682 J O U R N A L O F T H E A T M O S P H E R I C S C I E N C E S VOLUME 66
forms of the budget equations for BKE and BLE are
obtained:
d
dtBKE 5�
ðV
H� $p9 dV �
ðV
H� F dV
�ð
$ �KE(V�U) dV, and (5)
d
dtBLE 5�
ðrL
V(Q
con�Q
ev) dV �
ðLHF dV
�ð
$ � LE(V�U) dV, (6)
where the symbols take on the previously defined mean-
ings. The flux divergence terms on the rhs of Eqs. (5)
and (6) are hereafter referred to as KFLX and LFLX. To
make sure that the budget residues are small, we have
compared the energy changes calculated from the lhs
terms of Eqs. (5) and (6) to those obtained by summing
the rhs forcing terms during the study period and have
found that the differences between the two approaches
are small (not shown).
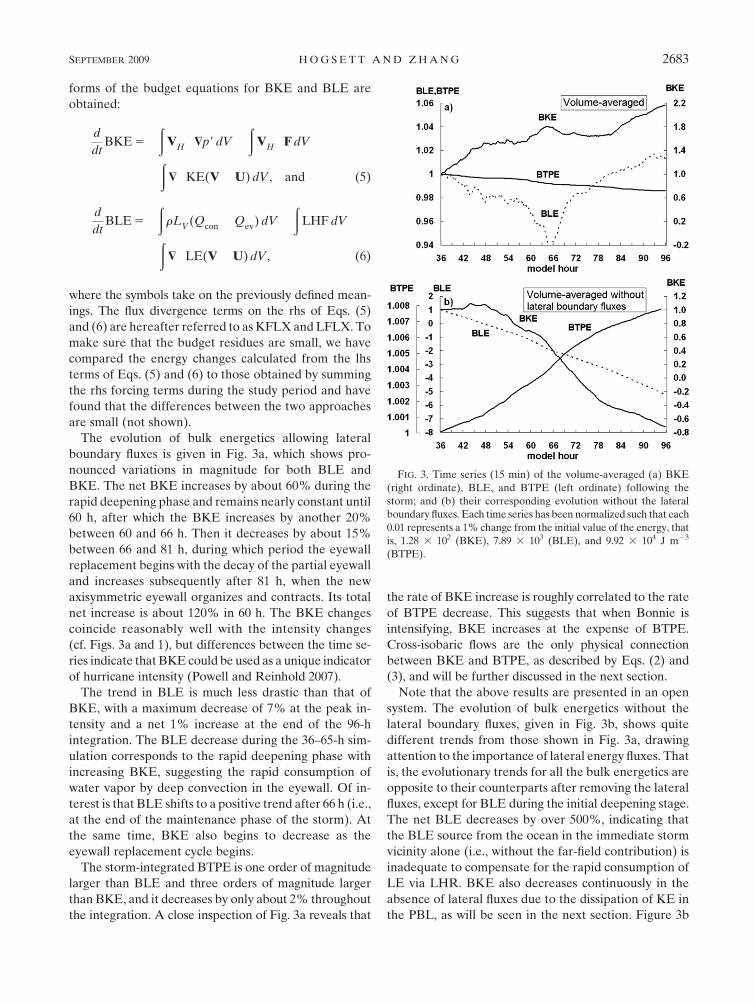
The evolution of bulk energetics allowing lateral
boundary fluxes is given in Fig. 3a, which shows pro-
nounced variations in magnitude for both BLE and
BKE. The net BKE increases by about 60% during the
rapid deepening phase and remains nearly constant until
60 h, after which the BKE increases by another 20%
between 60 and 66 h. Then it decreases by about 15%
between 66 and 81 h, during which period the eyewall
replacement begins with the decay of the partial eyewall
and increases subsequently after 81 h, when the new
axisymmetric eyewall organizes and contracts. Its total
net increase is about 120% in 60 h. The BKE changes
coincide reasonably well with the intensity changes
(cf. Figs. 3a and 1), but differences between the time se-
ries indicate that BKE could be used as a unique indicator
of hurricane intensity (Powell and Reinhold 2007).
The trend in BLE is much less drastic than that of
BKE, with a maximum decrease of 7% at the peak in-
tensity and a net 1% increase at the end of the 96-h
integration. The BLE decrease during the 36–65-h sim-
ulation corresponds to the rapid deepening phase with
increasing BKE, suggesting the rapid consumption of
water vapor by deep convection in the eyewall. Of in-
terest is that BLE shifts to a positive trend after 66 h (i.e.,
at the end of the maintenance phase of the storm). At
the same time, BKE also begins to decrease as the
eyewall replacement cycle begins.
The storm-integrated BTPE is one order of magnitude
larger than BLE and three orders of magnitude larger
than BKE, and it decreases by only about 2% throughout
the integration. A close inspection of Fig. 3a reveals that
the rate of BKE increase is roughly correlated to the rate
of BTPE decrease. This suggests that when Bonnie is
intensifying, BKE increases at the expense of BTPE.
Cross-isobaric flows are the only physical connection
between BKE and BTPE, as described by Eqs. (2) and
(3), and will be further discussed in the next section.
Note that the above results are presented in an open
system. The evolution of bulk energetics without the
lateral boundary fluxes, given in Fig. 3b, shows quite
different trends from those shown in Fig. 3a, drawing
attention to the importance of lateral energy fluxes. That
is, the evolutionary trends for all the bulk energetics are
opposite to their counterparts after removing the lateral
fluxes, except for BLE during the initial deepening stage.
The net BLE decreases by over 500%, indicating that
the BLE source from the ocean in the immediate storm
vicinity alone (i.e., without the far-field contribution) is
inadequate to compensate for the rapid consumption of
LE via LHR. BKE also decreases continuously in the
absence of lateral fluxes due to the dissipation of KE in
the PBL, as will be seen in the next section. Figure 3b
FIG. 3. Time series (15 min) of the volume-averaged (a) BKE
(right ordinate), BLE, and BTPE (left ordinate) following the
storm; and (b) their corresponding evolution without the lateral
boundary fluxes. Each time series has been normalized such that each
0.01 represents a 1% change from the initial value of the energy, that
is, 1.28 3 102 (BKE), 7.89 3 103 (BLE), and 9.92 3 104 J m23
(BTPE).
SEPTEMBER 2009 H O G S E T T A N D Z H A N G 2683
also shows negative energies for both KE and LE at the
later stages because more inward than outward lateral
energy fluxes occur, especially for LE. On the other
hand, BTPE increases, albeit by less than 1%, implying
that the sensible heat, converted from latent heat in the
storm, is transported away from the storm across the
lateral boundaries.
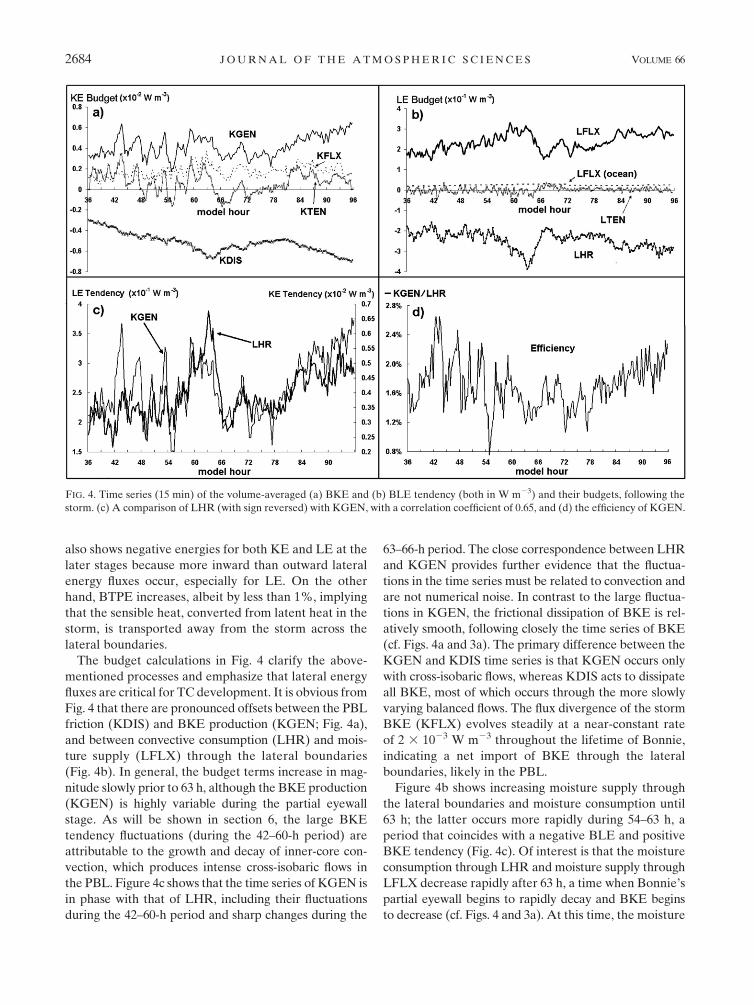
The budget calculations in Fig. 4 clarify the above-
mentioned processes and emphasize that lateral energy
fluxes are critical for TC development. It is obvious from
Fig. 4 that there are pronounced offsets between the PBL
friction (KDIS) and BKE production (KGEN; Fig. 4a),
and between convective consumption (LHR) and mois-
ture supply (LFLX) through the lateral boundaries
(Fig. 4b). In general, the budget terms increase in mag-
nitude slowly prior to 63 h, although the BKE production
(KGEN) is highly variable during the partial eyewall
stage. As will be shown in section 6, the large BKE
tendency fluctuations (during the 42–60-h period) are
attributable to the growth and decay of inner-core con-
vection, which produces intense cross-isobaric flows in
the PBL. Figure 4c shows that the time series of KGEN is
in phase with that of LHR, including their fluctuations
during the 42–60-h period and sharp changes during the
63–66-h period. The close correspondence between LHR
and KGEN provides further evidence that the fluctua-
tions in the time series must be related to convection and
are not numerical noise. In contrast to the large fluctua-
tions in KGEN, the frictional dissipation of BKE is rel-
atively smooth, following closely the time series of BKE
(cf. Figs. 4a and 3a). The primary difference between the
KGEN and KDIS time series is that KGEN occurs only
with cross-isobaric flows, whereas KDIS acts to dissipate
all BKE, most of which occurs through the more slowly
varying balanced flows. The flux divergence of the storm
BKE (KFLX) evolves steadily at a near-constant rate
of 2 3 1023 W m23 throughout the lifetime of Bonnie,
indicating a net import of BKE through the lateral
boundaries, likely in the PBL.
Figure 4b shows increasing moisture supply through
the lateral boundaries and moisture consumption until
63 h; the latter occurs more rapidly during 54–63 h, a
period that coincides with a negative BLE and positive
BKE tendency (Fig. 4c). Of interest is that the moisture
consumption through LHR and moisture supply through
LFLX decrease rapidly after 63 h, a time when Bonnie’s
partial eyewall begins to rapidly decay and BKE begins
to decrease (cf. Figs. 4 and 3a). At this time, the moisture
FIG. 4. Time series (15 min) of the volume-averaged (a) BKE and (b) BLE tendency (both in W m23) and their budgets, following the
storm. (c) A comparison of LHR (with sign reversed) with KGEN, with a correlation coefficient of 0.65, and (d) the efficiency of KGEN.
2684 J O U R N A L O F T H E A T M O S P H E R I C S C I E N C E S VOLUME 66
consumption decreases more than the moisture supply,
which is consistent with the positive tendency of BLE
and negative tendency of BKE during 66–69 h (cf.
Figs. 4b and 3). This period can be considered a time of
moisture replenishment, as the partial eyewall and asso-
ciated BLE consumption diminish. After 72 h, both the
moisture consumption and supply rates increase slowly
as Bonnie reorganizes into axisymmetry. Note that the
moisture supply from the lateral boundaries is an order
of magnitude larger than that from the ocean surface.
Although the surface moisture flux contributes a small
amount of BLE within the R 5 200 km integration
domain, the storm would not intensify without it or
at the reduced amount (see Zhu and Zhang 2006b),
suggesting the importance of surface moisture fluxes
occurring at a much larger scale. In general, the BLE
budget is in delicate balance, with the BLE tendency
(LTEN; Fig. 4b) representing a small difference be-
tween two large terms, LFLX and LHR, and a small
contribution from the ocean flux at the storm scale.
Although the evolution of BKE coincides generally
well with that of the minimum central pressure and
maximum surface wind (VMAX), the correspondence is
not exact. One novel way to address the relationship
between BKE and VMAX has been set forth by Maclay
et al. (2008), who created phase diagrams describing
BKE deviations as a function of VMAX for various ob-
served storms. That is, for a given VMAX, the BKE de-
viation is calculated in reference to an expected value of
BKE that is estimated as the best fit from the observed
data of multiple storms. A storm with a negative or
positive BKE deviation at any moment could be con-
sidered as being bulk-energetically small or large, re-
spectively. For example, the record-breaking Hurricane
Wilma (2005) with a smaller RMW at its maximum in-
tensity and Katrina (2005) with a larger RMW near
landfall are extreme examples of storms with negative
and positive KE deviations, respectively.
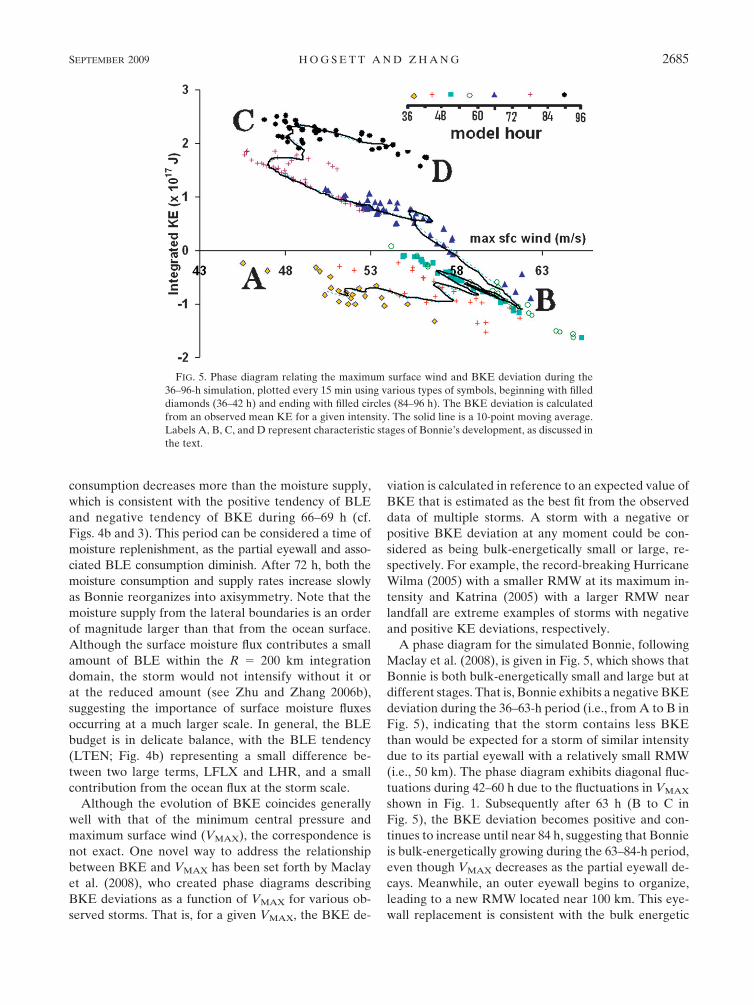
A phase diagram for the simulated Bonnie, following
Maclay et al. (2008), is given in Fig. 5, which shows that
Bonnie is both bulk-energetically small and large but at
different stages. That is, Bonnie exhibits a negative BKE
deviation during the 36–63-h period (i.e., from A to B in
Fig. 5), indicating that the storm contains less BKE
than would be expected for a storm of similar intensity
due to its partial eyewall with a relatively small RMW
(i.e., 50 km). The phase diagram exhibits diagonal fluc-
tuations during 42–60 h due to the fluctuations in VMAX
shown in Fig. 1. Subsequently after 63 h (B to C in
Fig. 5), the BKE deviation becomes positive and con-
tinues to increase until near 84 h, suggesting that Bonnie
is bulk-energetically growing during the 63–84-h period,
even though VMAX decreases as the partial eyewall de-
cays. Meanwhile, an outer eyewall begins to organize,
leading to a new RMW located near 100 km. This eye-
wall replacement is consistent with the bulk energetic
FIG. 5. Phase diagram relating the maximum surface wind and BKE deviation during the
36–96-h simulation, plotted every 15 min using various types of symbols, beginning with filled
diamonds (36–42 h) and ending with filled circles (84–96 h). The BKE deviation is calculated
from an observed mean KE for a given intensity. The solid line is a 10-point moving average.
Labels A, B, C, and D represent characteristic stages of Bonnie’s development, as discussed in
the text.
SEPTEMBER 2009 H O G S E T T A N D Z H A N G 2685
growth that begins near hour 66 and ends near hour 84.
Between 84 and 96 h (C to D in Fig. 5), the BKE devi-
ation decreases once again, suggesting a decrease in the
bulk-energetic size of Bonnie. In fact, as shown in Part I,
this period is characterized by the contraction of the
axisymmetric eyewall.
In this regard, the phase diagram provides a 3D de-
scription of the evolution of Bonnie in terms of the
storm size, intensity, and development stage. The phase
transitions are relatively smooth throughout most of the
evolution, except for the 42–60-h period during which
Bonnie exhibits rapid diagonal oscillations every few
hours (Fig. 5). Each oscillation gives the appearance of a
‘‘horizontal question mark,’’ as suggested by Maclay
et al. (2008), and represents alternating intensification
and bulk-energetic shrinking (down to the right) and
weakening and bulk-energetic growth (up to the left).
This behavior is associated with organized convective
processes in the eyewall that will be discussed in the next
section. Such a close correspondence of the horizontal
question mark shape between the observation-based
study of Maclay et al. and the results here (Fig. 5) en-
courage further confidence in the realism of the present
simulation of Bonnie.
5. Energy conversions
LHR and KGEN are the two primary energy con-
version processes—that is, C(LE, TPE) and C(TPE,
KE) represent the main route of energy from LE to KE,
and they are highly correlated (Fig. 4c). However, on
average only about 1.8% of LHR could be converted to
KE through KGEN (Fig. 4d), while the remainder is
used to heat the atmosphere. In this sense, the hurricane
is thermodynamically inefficient. Large fluctuations in
the thermodynamic efficiency, varying from 0.8% to
2.6%, occur during the partial eyewall stage through
KGEN because of the large oscillations in cross-isobaric
flows to be discussed later in the context of VRWs. Note
that the mean efficiency remains above 1.6%, except
during 63–78 h, during which period the bulk energetic
size of Bonnie is increasing (cf. Figs. 4d and 5) but BKE
is decreasing (cf. Figs. 4d and 3a). This implies that when
Bonnie is weakening and bulk-energetically growing, it
is least efficient in converting LE to KE. On the con-
trary, when BKE is increasing most rapidly, efficiency
increases, due partly to the increased KE and partly to
the reduced RMW (Hack and Schubert 1986).
Figure 6 shows that C(LE, TPE) and C(TPE, KE) are
also horizontally well correlated. For example, during the
partial eyewall stage, the shear-induced vertical circula-
tion, as described by Black et al. (2002) and Zhang and
Kieu (2006), dictates the distribution of LHR, with higher
magnitudes on the downshear left and little in the south-
western quadrant of the eyewall (Fig. 2a). Thus, both
C(LE, TPE) and C(TPE, KE) are peaked in the north-
eastern quadrant where the friction-induced convergence
is maximized (Fig. 6a). In the vertical, C(TPE, KE) is
peaked at the surface in the eastern half (Fig. 6c), and it
becomes negative in the supergradient outflows aloft
(see Zhang et al. 2001).
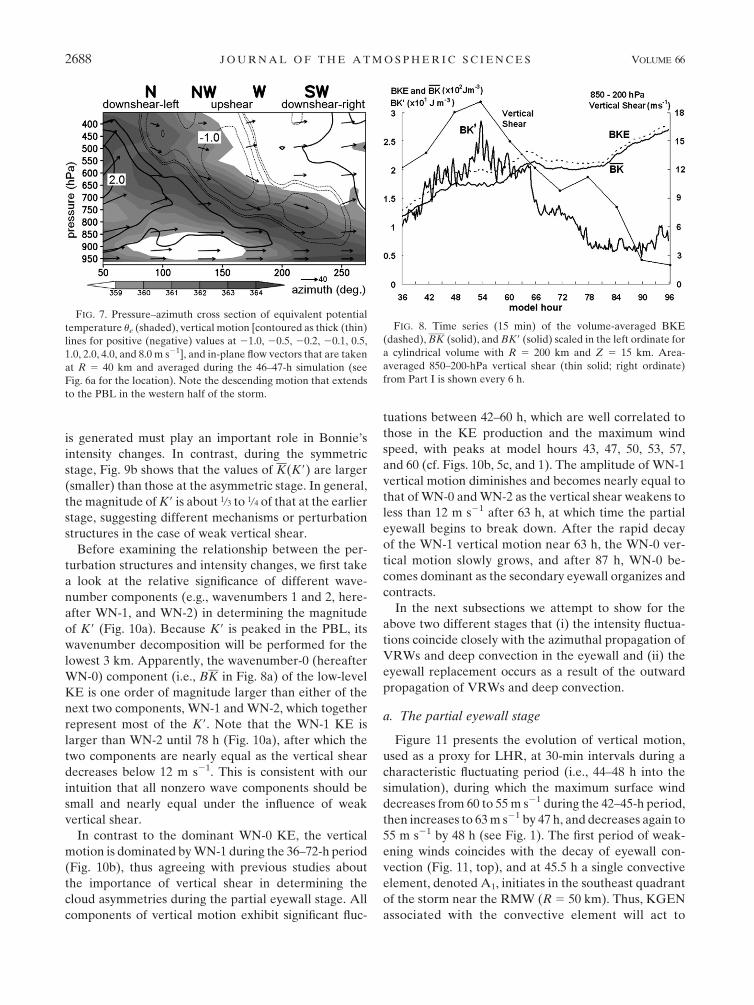
However, the energy conversion to KE is negative in
the lowest 300 hPa and positive aloft in the western half
(Fig. 6c) because of the presence of vertically distributed
radial flows that are opposite to those in the eastern half.
This vertical structure appears to be typical under the
influence of strong vertical shear. That is, the strong in-
flow aloft descends isentropically on the upshear side of
the eyewall, and the resulting increase in the tangential
flow as a result of the angular momentum conservation
may cause the centrifugal force to exceed the local
radial pressure gradient force, leading to the super-
gradient consumption of KE near the inner eyewall edge
(Fig. 6c). On the other hand, the KE destruction in the
lowest 300-hPa layer does not seem to be associated with
the supergradient outflow jet, as discussed in Zhang et al.
(2001). Our analysis reveals that it is associated with
evaporatively driven outflows from moist downdrafts
that are induced on the upshear side, as precipitation
particles advect cyclonically in the eyewall and then
encounter a dry intrusion in the 550–800-hPa minimum
ue layer (cf. Figs. 6c and 7). As discussed in Kieu and
Zhang (2008), the generation of moist downdrafts in the
minimum ue layer represents the thermodynamic impact
of vertical wind shear. The moist downdrafts could
eventually reach the surface and generate locally higher
pressures to reverse the mean pressure gradients in the
PBL such that the descending flows could be forced
outward (Fig. 7). Such an outflow has also been observed
by Black and Holland (1995) in Hurricane Kerry (1979),
which developed in a strong sheared environment. They
attributed this outflow to a combination of surface pro-
cesses and environmental shear.
After the transition to axisymmetry, Bonnie exhibits
more symmetric LHR and KGEN in both the horizontal
(Fig. 6b) and vertical (Fig. 6d), only with a slight asym-
metric circulation in the eye. Although LHR occurs
throughout the eyewall, positive KGEN appears mostly
over a broad region in the lowest 100-hPa layer with the
peak near the RMW. Positive KGEN appears also near
the melting level where secondary convergence occurs.
Note the KE consumption in the low-level eye (Fig. 6b)
due to the presence of divergent flows associated with
the supergradient outflows above (see Liu et al. 1997;
Zhang et al. 2001). This indicates that moist air is drawn
from the eye, against the pressure gradient force, into
2686 J O U R N A L O F T H E A T M O S P H E R I C S C I E N C E S VOLUME 66
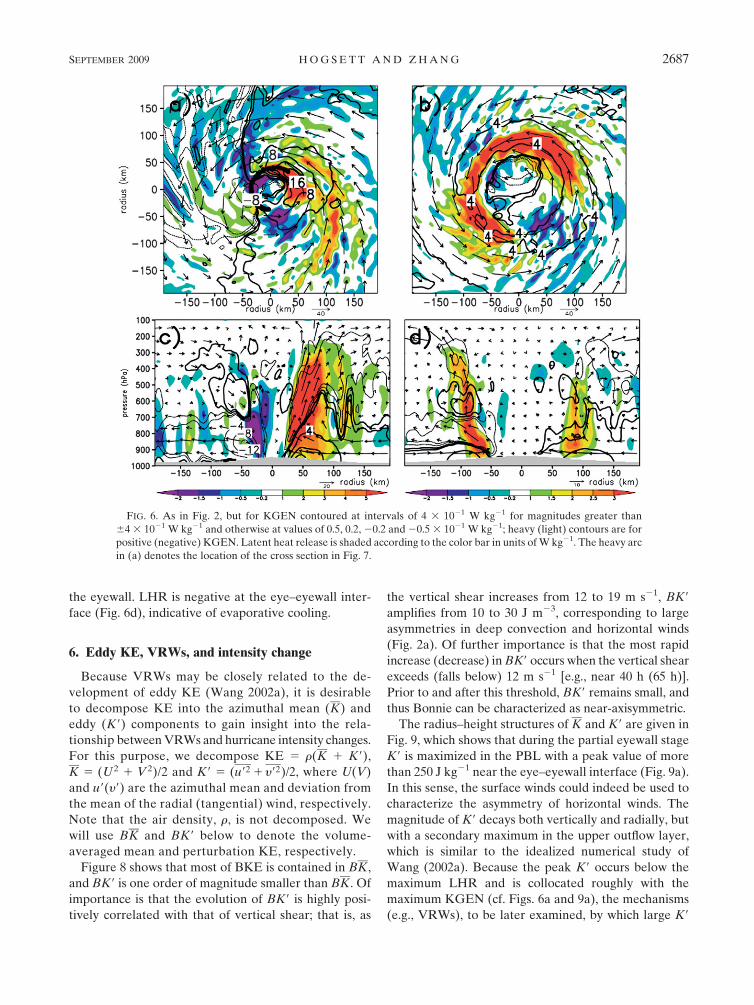
the eyewall. LHR is negative at the eye–eyewall inter-
face (Fig. 6d), indicative of evaporative cooling.
6. Eddy KE, VRWs, and intensity change
Because VRWs may be closely related to the de-
velopment of eddy KE (Wang 2002a), it is desirable
to decompose KE into the azimuthal mean (K) and
eddy (K9) components to gain insight into the rela-
tionship between VRWs and hurricane intensity changes.
For this purpose, we decompose KE 5 r(K 1 K9),
K 5 (U2 1 V2)/2 and K9 5 (u92 1 y92)/2, where U(V)
and u9(y9) are the azimuthal mean and deviation from
the mean of the radial (tangential) wind, respectively.
Note that the air density, r, is not decomposed. We
will use BK and BK9 below to denote the volume-
averaged mean and perturbation KE, respectively.
Figure 8 shows that most of BKE is contained in BK,
and BK9 is one order of magnitude smaller than BK. Of
importance is that the evolution of BK9 is highly posi-
tively correlated with that of vertical shear; that is, as
the vertical shear increases from 12 to 19 m s21, BK9
amplifies from 10 to 30 J m23, corresponding to large
asymmetries in deep convection and horizontal winds
(Fig. 2a). Of further importance is that the most rapid
increase (decrease) in BK9 occurs when the vertical shear
exceeds (falls below) 12 m s21 [e.g., near 40 h (65 h)].
Prior to and after this threshold, BK9 remains small, and
thus Bonnie can be characterized as near-axisymmetric.
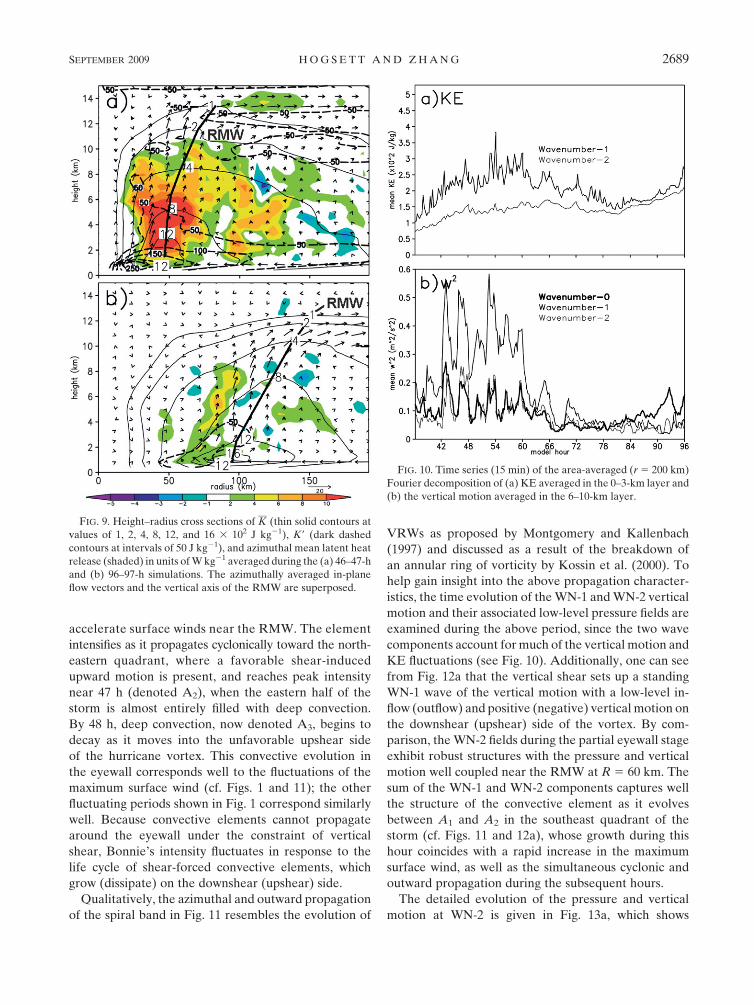
The radius–height structures of K and K9 are given in
Fig. 9, which shows that during the partial eyewall stage
K9 is maximized in the PBL with a peak value of more
than 250 J kg21 near the eye–eyewall interface (Fig. 9a).
In this sense, the surface winds could indeed be used to
characterize the asymmetry of horizontal winds. The
magnitude of K9 decays both vertically and radially, but
with a secondary maximum in the upper outflow layer,
which is similar to the idealized numerical study of
Wang (2002a). Because the peak K9 occurs below the
maximum LHR and is collocated roughly with the
maximum KGEN (cf. Figs. 6a and 9a), the mechanisms
(e.g., VRWs), to be later examined, by which large K9
FIG. 6. As in Fig. 2, but for KGEN contoured at intervals of 4 3 1021 W kg21 for magnitudes greater than
64 3 1021 W kg21 and otherwise at values of 0.5, 0.2, 20.2 and 20.5 3 1021 W kg21; heavy (light) contours are for
positive (negative) KGEN. Latent heat release is shaded according to the color bar in units of W kg21. The heavy arc
in (a) denotes the location of the cross section in Fig. 7.
SEPTEMBER 2009 H O G S E T T A N D Z H A N G 2687
is generated must play an important role in Bonnie’s
intensity changes. In contrast, during the symmetric
stage, Fig. 9b shows that the values of K(K9) are larger
(smaller) than those at the asymmetric stage. In general,
the magnitude of K9 is about 1/3 to 1/4 of that at the earlier
stage, suggesting different mechanisms or perturbation
structures in the case of weak vertical shear.
Before examining the relationship between the per-
turbation structures and intensity changes, we first take
a look at the relative significance of different wave-
number components (e.g., wavenumbers 1 and 2, here-
after WN-1, and WN-2) in determining the magnitude
of K9 (Fig. 10a). Because K9 is peaked in the PBL, its
wavenumber decomposition will be performed for the
lowest 3 km. Apparently, the wavenumber-0 (hereafter
WN-0) component (i.e., BK in Fig. 8a) of the low-level
KE is one order of magnitude larger than either of the
next two components, WN-1 and WN-2, which together
represent most of the K9. Note that the WN-1 KE is
larger than WN-2 until 78 h (Fig. 10a), after which the
two components are nearly equal as the vertical shear
decreases below 12 m s21. This is consistent with our
intuition that all nonzero wave components should be
small and nearly equal under the influence of weak
vertical shear.
In contrast to the dominant WN-0 KE, the vertical
motion is dominated by WN-1 during the 36–72-h period
(Fig. 10b), thus agreeing with previous studies about
the importance of vertical shear in determining the
cloud asymmetries during the partial eyewall stage. All
components of vertical motion exhibit significant fluc-
tuations between 42–60 h, which are well correlated to
those in the KE production and the maximum wind
speed, with peaks at model hours 43, 47, 50, 53, 57,
and 60 (cf. Figs. 10b, 5c, and 1). The amplitude of WN-1
vertical motion diminishes and becomes nearly equal to
that of WN-0 and WN-2 as the vertical shear weakens to
less than 12 m s21 after 63 h, at which time the partial
eyewall begins to break down. After the rapid decay
of the WN-1 vertical motion near 63 h, the WN-0 ver-
tical motion slowly grows, and after 87 h, WN-0 be-
comes dominant as the secondary eyewall organizes and
contracts.
In the next subsections we attempt to show for the
above two different stages that (i) the intensity fluctua-
tions coincide closely with the azimuthal propagation of
VRWs and deep convection in the eyewall and (ii) the
eyewall replacement occurs as a result of the outward
propagation of VRWs and deep convection.
a. The partial eyewall stage
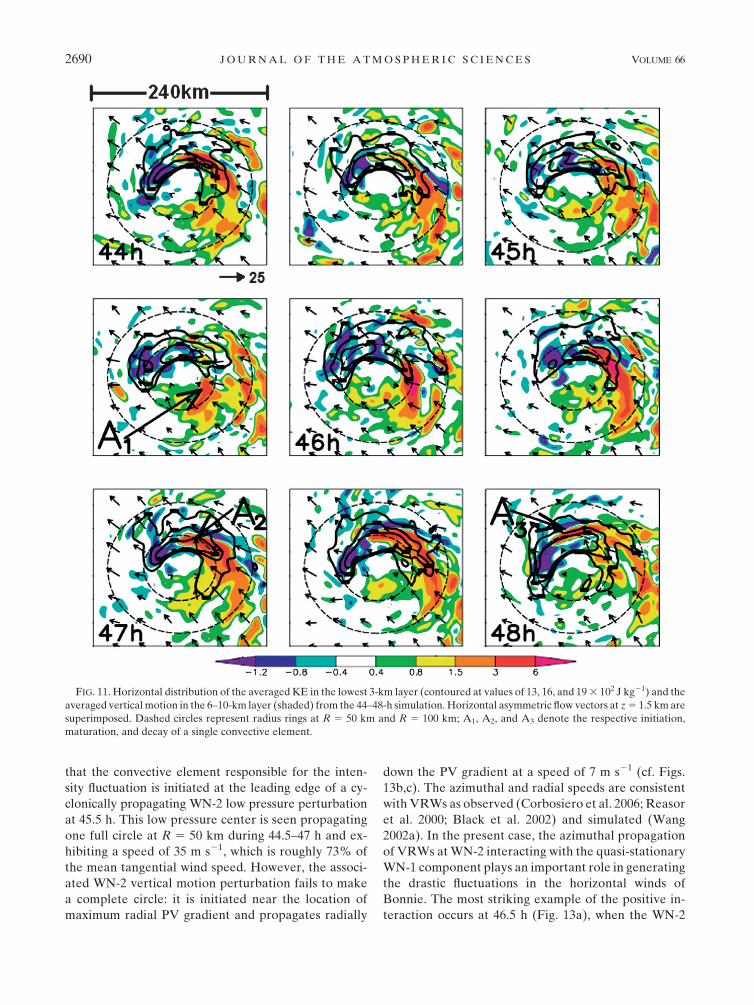
Figure 11 presents the evolution of vertical motion,
used as a proxy for LHR, at 30-min intervals during a
characteristic fluctuating period (i.e., 44–48 h into the
simulation), during which the maximum surface wind
decreases from 60 to 55 m s21 during the 42–45-h period,
then increases to 63 m s21 by 47 h, and decreases again to
55 m s21 by 48 h (see Fig. 1). The first period of weak-
ening winds coincides with the decay of eyewall con-
vection (Fig. 11, top), and at 45.5 h a single convective
element, denoted A1, initiates in the southeast quadrant
of the storm near the RMW (R 5 50 km). Thus, KGEN
associated with the convective element will act to
FIG. 8. Time series (15 min) of the volume-averaged BKE
(dashed), BK (solid), and BK9 (solid) scaled in the left ordinate for
a cylindrical volume with R 5 200 km and Z 5 15 km. Area-
averaged 850–200-hPa vertical shear (thin solid; right ordinate)
from Part I is shown every 6 h.
FIG. 7. Pressure–azimuth cross section of equivalent potential
temperature ue (shaded), vertical motion [contoured as thick (thin)
lines for positive (negative) values at 21.0, 20.5, 20.2, 20.1, 0.5,
1.0, 2.0, 4.0, and 8.0 m s21], and in-plane flow vectors that are taken
at R 5 40 km and averaged during the 46–47-h simulation (see
Fig. 6a for the location). Note the descending motion that extends
to the PBL in the western half of the storm.
2688 J O U R N A L O F T H E A T M O S P H E R I C S C I E N C E S VOLUME 66
accelerate surface winds near the RMW. The element
intensifies as it propagates cyclonically toward the north-
eastern quadrant, where a favorable shear-induced
upward motion is present, and reaches peak intensity
near 47 h (denoted A2), when the eastern half of the
storm is almost entirely filled with deep convection.
By 48 h, deep convection, now denoted A3, begins to
decay as it moves into the unfavorable upshear side
of the hurricane vortex. This convective evolution in
the eyewall corresponds well to the fluctuations of the
maximum surface wind (cf. Figs. 1 and 11); the other
fluctuating periods shown in Fig. 1 correspond similarly
well. Because convective elements cannot propagate
around the eyewall under the constraint of vertical
shear, Bonnie’s intensity fluctuates in response to the
life cycle of shear-forced convective elements, which
grow (dissipate) on the downshear (upshear) side.
Qualitatively, the azimuthal and outward propagation
of the spiral band in Fig. 11 resembles the evolution of
VRWs as proposed by Montgomery and Kallenbach
(1997) and discussed as a result of the breakdown of
an annular ring of vorticity by Kossin et al. (2000). To
help gain insight into the above propagation character-
istics, the time evolution of the WN-1 and WN-2 vertical
motion and their associated low-level pressure fields are
examined during the above period, since the two wave
components account for much of the vertical motion and
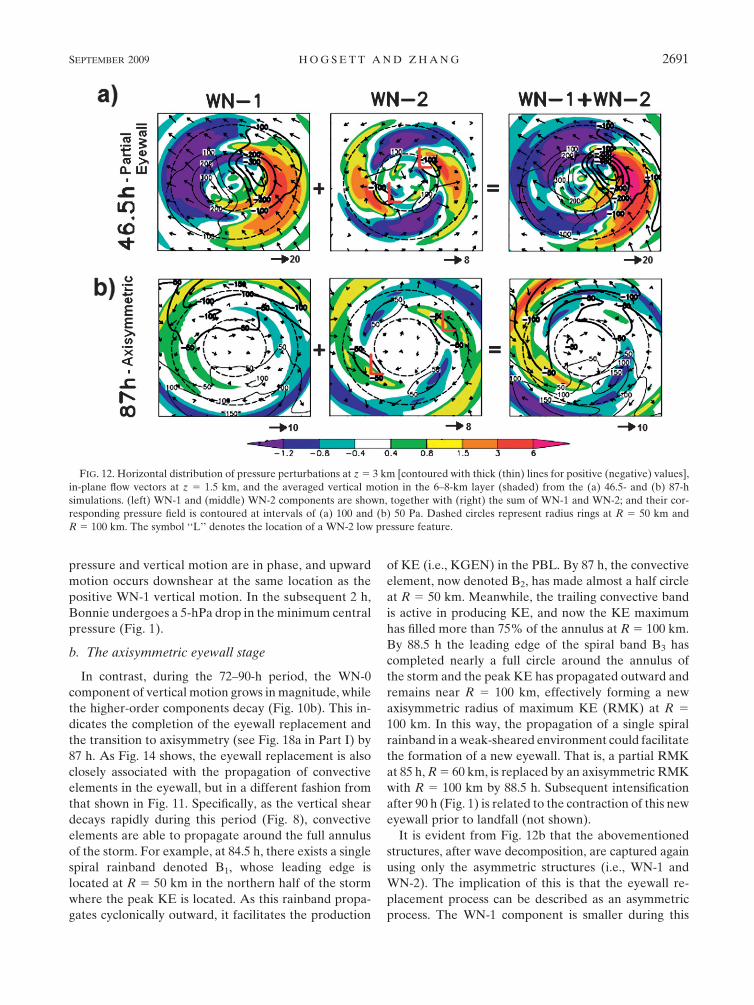
KE fluctuations (see Fig. 10). Additionally, one can see
from Fig. 12a that the vertical shear sets up a standing
WN-1 wave of the vertical motion with a low-level in-
flow (outflow) and positive (negative) vertical motion on
the downshear (upshear) side of the vortex. By com-
parison, the WN-2 fields during the partial eyewall stage
exhibit robust structures with the pressure and vertical
motion well coupled near the RMW at R 5 60 km. The
sum of the WN-1 and WN-2 components captures well
the structure of the convective element as it evolves
between A1 and A2 in the southeast quadrant of the
storm (cf. Figs. 11 and 12a), whose growth during this
hour coincides with a rapid increase in the maximum
surface wind, as well as the simultaneous cyclonic and
outward propagation during the subsequent hours.
The detailed evolution of the pressure and vertical
motion at WN-2 is given in Fig. 13a, which shows
FIG. 9. Height–radius cross sections of K (thin solid contours at
values of 1, 2, 4, 8, 12, and 16 3 102 J kg21), K9 (dark dashed
contours at intervals of 50 J kg21), and azimuthal mean latent heat
release (shaded) in units of W kg21 averaged during the (a) 46–47-h
and (b) 96–97-h simulations. The azimuthally averaged in-plane
flow vectors and the vertical axis of the RMW are superposed.
FIG. 10. Time series (15 min) of the area-averaged (r 5 200 km)
Fourier decomposition of (a) KE averaged in the 0–3-km layer and
(b) the vertical motion averaged in the 6–10-km layer.
SEPTEMBER 2009 H O G S E T T A N D Z H A N G 2689
that the convective element responsible for the inten-
sity fluctuation is initiated at the leading edge of a cy-
clonically propagating WN-2 low pressure perturbation
at 45.5 h. This low pressure center is seen propagating
one full circle at R 5 50 km during 44.5–47 h and ex-
hibiting a speed of 35 m s21, which is roughly 73% of
the mean tangential wind speed. However, the associ-
ated WN-2 vertical motion perturbation fails to make
a complete circle: it is initiated near the location of
maximum radial PV gradient and propagates radially
down the PV gradient at a speed of 7 m s21 (cf. Figs.
13b,c). The azimuthal and radial speeds are consistent
with VRWs as observed (Corbosiero et al. 2006; Reasor
et al. 2000; Black et al. 2002) and simulated (Wang
2002a). In the present case, the azimuthal propagation
of VRWs at WN-2 interacting with the quasi-stationary
WN-1 component plays an important role in generating
the drastic fluctuations in the horizontal winds of
Bonnie. The most striking example of the positive in-
teraction occurs at 46.5 h (Fig. 13a), when the WN-2
FIG. 11. Horizontal distribution of the averaged KE in the lowest 3-km layer (contoured at values of 13, 16, and 19 3 102 J kg21) and the
averaged vertical motion in the 6–10-km layer (shaded) from the 44–48-h simulation. Horizontal asymmetric flow vectors at z 5 1.5 km are
superimposed. Dashed circles represent radius rings at R 5 50 km and R 5 100 km; A1, A2, and A3 denote the respective initiation,
maturation, and decay of a single convective element.
2690 J O U R N A L O F T H E A T M O S P H E R I C S C I E N C E S VOLUME 66
pressure and vertical motion are in phase, and upward
motion occurs downshear at the same location as the
positive WN-1 vertical motion. In the subsequent 2 h,
Bonnie undergoes a 5-hPa drop in the minimum central
pressure (Fig. 1).
b. The axisymmetric eyewall stage
In contrast, during the 72–90-h period, the WN-0
component of vertical motion grows in magnitude, while
the higher-order components decay (Fig. 10b). This in-
dicates the completion of the eyewall replacement and
the transition to axisymmetry (see Fig. 18a in Part I) by
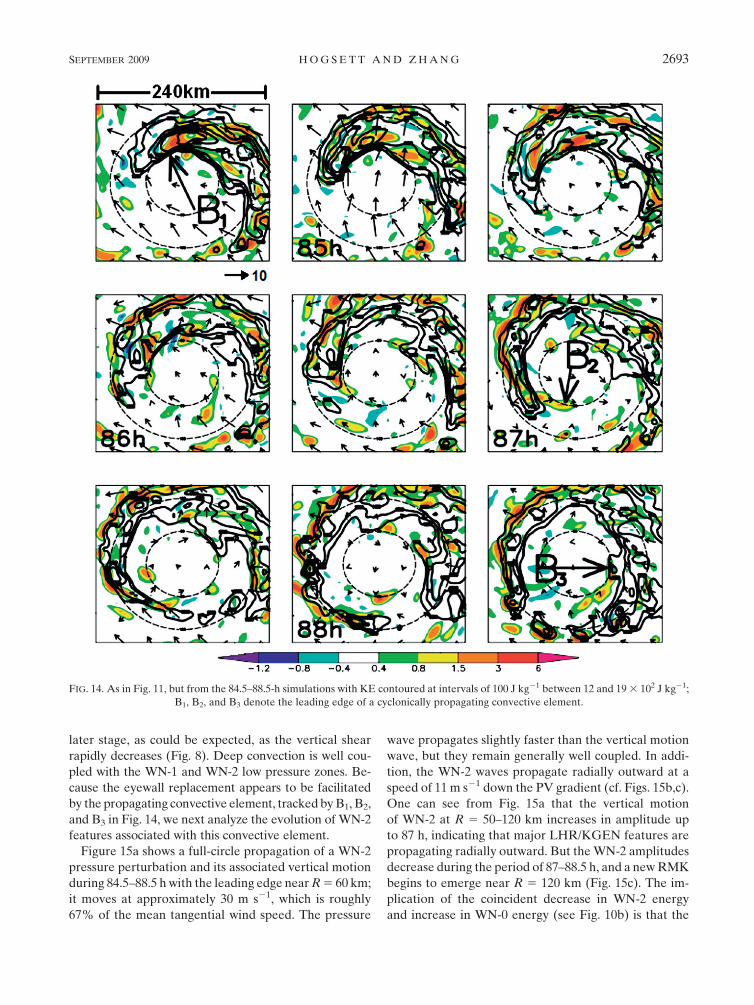
87 h. As Fig. 14 shows, the eyewall replacement is also
closely associated with the propagation of convective
elements in the eyewall, but in a different fashion from
that shown in Fig. 11. Specifically, as the vertical shear
decays rapidly during this period (Fig. 8), convective
elements are able to propagate around the full annulus
of the storm. For example, at 84.5 h, there exists a single
spiral rainband denoted B1, whose leading edge is
located at R 5 50 km in the northern half of the storm
where the peak KE is located. As this rainband propa-
gates cyclonically outward, it facilitates the production
of KE (i.e., KGEN) in the PBL. By 87 h, the convective
element, now denoted B2, has made almost a half circle
at R 5 50 km. Meanwhile, the trailing convective band
is active in producing KE, and now the KE maximum
has filled more than 75% of the annulus at R 5 100 km.
By 88.5 h the leading edge of the spiral band B3 has
completed nearly a full circle around the annulus of
the storm and the peak KE has propagated outward and
remains near R 5 100 km, effectively forming a new
axisymmetric radius of maximum KE (RMK) at R 5
100 km. In this way, the propagation of a single spiral
rainband in a weak-sheared environment could facilitate
the formation of a new eyewall. That is, a partial RMK
at 85 h, R 5 60 km, is replaced by an axisymmetric RMK
with R 5 100 km by 88.5 h. Subsequent intensification
after 90 h (Fig. 1) is related to the contraction of this new
eyewall prior to landfall (not shown).
It is evident from Fig. 12b that the abovementioned
structures, after wave decomposition, are captured again
using only the asymmetric structures (i.e., WN-1 and
WN-2). The implication of this is that the eyewall re-
placement process can be described as an asymmetric
process. The WN-1 component is smaller during this
FIG. 12. Horizontal distribution of pressure perturbations at z 5 3 km [contoured with thick (thin) lines for positive (negative) values],
in-plane flow vectors at z 5 1.5 km, and the averaged vertical motion in the 6–8-km layer (shaded) from the (a) 46.5- and (b) 87-h
simulations. (left) WN-1 and (middle) WN-2 components are shown, together with (right) the sum of WN-1 and WN-2; and their cor-
responding pressure field is contoured at intervals of (a) 100 and (b) 50 Pa. Dashed circles represent radius rings at R 5 50 km and
R 5 100 km. The symbol ‘‘L’’ denotes the location of a WN-2 low pressure feature.
SEPTEMBER 2009 H O G S E T T A N D Z H A N G 2691
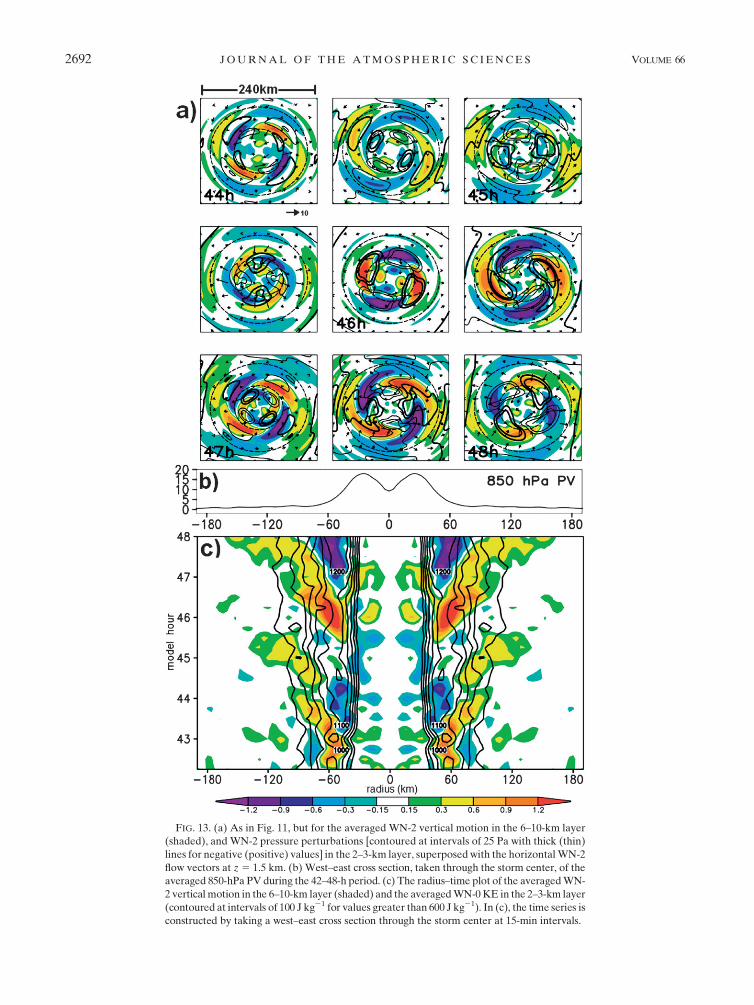
FIG. 13. (a) As in Fig. 11, but for the averaged WN-2 vertical motion in the 6–10-km layer
(shaded), and WN-2 pressure perturbations [contoured at intervals of 25 Pa with thick (thin)
lines for negative (positive) values] in the 2–3-km layer, superposed with the horizontal WN-2
flow vectors at z 5 1.5 km. (b) West–east cross section, taken through the storm center, of the
averaged 850-hPa PV during the 42–48-h period. (c) The radius–time plot of the averaged WN-
2 vertical motion in the 6–10-km layer (shaded) and the averaged WN-0 KE in the 2–3-km layer
(contoured at intervals of 100 J kg21 for values greater than 600 J kg21). In (c), the time series is
constructed by taking a west–east cross section through the storm center at 15-min intervals.
2692 J O U R N A L O F T H E A T M O S P H E R I C S C I E N C E S VOLUME 66
later stage, as could be expected, as the vertical shear
rapidly decreases (Fig. 8). Deep convection is well cou-
pled with the WN-1 and WN-2 low pressure zones. Be-
cause the eyewall replacement appears to be facilitated
by the propagating convective element, tracked by B1, B2,
and B3 in Fig. 14, we next analyze the evolution of WN-2
features associated with this convective element.
Figure 15a shows a full-circle propagation of a WN-2
pressure perturbation and its associated vertical motion
during 84.5–88.5 h with the leading edge near R 5 60 km;
it moves at approximately 30 m s21, which is roughly
67% of the mean tangential wind speed. The pressure
wave propagates slightly faster than the vertical motion
wave, but they remain generally well coupled. In addi-
tion, the WN-2 waves propagate radially outward at a
speed of 11 m s21 down the PV gradient (cf. Figs. 15b,c).
One can see from Fig. 15a that the vertical motion
of WN-2 at R 5 50–120 km increases in amplitude up
to 87 h, indicating that major LHR/KGEN features are
propagating radially outward. But the WN-2 amplitudes
decrease during the period of 87–88.5 h, and a new RMK
begins to emerge near R 5 120 km (Fig. 15c). The im-
plication of the coincident decrease in WN-2 energy
and increase in WN-0 energy (see Fig. 10b) is that the
FIG. 14. As in Fig. 11, but from the 84.5–88.5-h simulations with KE contoured at intervals of 100 J kg21 between 12 and 19 3 102 J kg21;
B1, B2, and B3 denote the leading edge of a cyclonically propagating convective element.
SEPTEMBER 2009 H O G S E T T A N D Z H A N G 2693
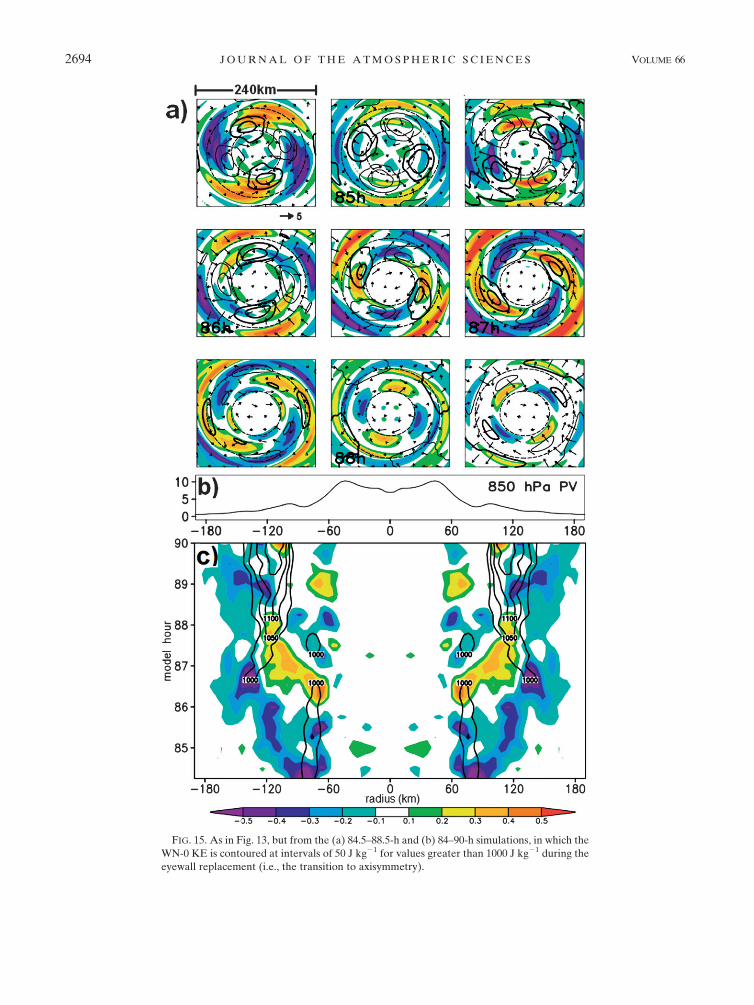
FIG. 15. As in Fig. 13, but from the (a) 84.5–88.5-h and (b) 84–90-h simulations, in which the
WN-0 KE is contoured at intervals of 50 J kg21 for values greater than 1000 J kg21 during the
eyewall replacement (i.e., the transition to axisymmetry).
2694 J O U R N A L O F T H E A T M O S P H E R I C S C I E N C E S VOLUME 66
outward-propagating WN-2 waves are being axisym-
metrized, a process that can occur as they slow their radial
propagation, undergo filamentation, and take on a more
symmetric appearance (Montgomery and Kallenbach
1997).
7. Summary and conclusions
In this study, the energetic characteristics of TCs in
relation to intensity and structural changes under dif-
ferent sheared conditions are analyzed using a cloud-
resolving simulation of the life cycle of Hurricane Bonnie
(1998) with the finest resolution of 4 km at 15-min in-
tervals. In the presence of intense vertical shear, Bonnie
exhibits a partial eyewall with an RMW of 50 km and
large intensity fluctuations with quasi-regular periods of
2–5 h. Then, Bonnie undergoes an eyewall replacement
as the vertical shear subsides below 12 m s21, and her
intensity varies smoothly during the subsequent axi-
symmetric stage with an RMW of 100 km.
It is found that time series of BKE compare fairly well,
though not exactly, to the sequence of intensity changes.
A phase diagram is plotted, following Maclay et al.
(2008), to show that Bonnie is bulk-energetically small
during the partial eyewall stage but large after the eye-
wall replacement cycle. Most of the BKE is generated in
the lowest 3 km of the eyewall, and its combination
with the environmental KE flux divergence is balanced
by the KE dissipation in the PBL. The LE supply from
Bonnie’s environment also plays an important role in
determining the magnitude of LHR in the eyewall, but
only less than 2% of the total LHR could be converted
to KE. Results show that the conversion to KE could be
negative on the upshear side of the eyewall due to the
development of evaporatively driven moist downdrafts
in the eyewall. It is also found that the storm-scale eddy
KE is proportional to the magnitude of vertical shear,
with most of the eddy KE concentrated in the PBL near
the RMW.
Results show that the intensity fluctuations are closely
related to the fluctuations in energy conversions through
deep convection of varying intensity in the partial eye-
wall, rather than to ‘‘numerical noise.’’ Because vertical
shear acts to enhance (suppress) vertical motion down-
shear (upshear), convective cells undergo a cycle of growth
on the downshear side and decay on the upshear side—a
WN-1 phenomenon. That is, as the cells grow (decay), the
enhanced (suppressed) KE production near the RMW
in the PBL locally accelerates (decelerates) the maxi-
mum wind speed on the downshear (upshear) side.
Fourier decomposition of the flow fields shows con-
vectively generated WN-2 perturbations that resemble
VRWs propagating in the eyewall during both the asym-
metric and axisymmetric stages. That is, they adhere
to VRW theory by propagating azimuthally at a speed
slower than the mean tangential wind, and outward down
the radial PV gradient. Moreover, convection associated
with the WN-2 perturbations evolves in concert with the
fluctuations in VMAX during the partial eyewall stage.
Similarly, a WN-2 perturbation, free from the constraint
of vertical shear, exhibits cyclonic and outward prop-
agation during the eyewall replacement cycle. Its radial
propagation stalls at large radii, but the deep convec-
tion remains active and appears to facilitate the de-
velopment of an outer eyewall. However, the timing
and location of the eyewall replacement phenomenon
appears to be determined by the large-scale flows, be-
cause VRWs do occur often in TCs.
Acknowledgments. We thank Dr. T. Zhu for providing
the high-resolution data for the present study, and two
anonymous reviewers for their helpful comments. This
work was supported by ONR Grant N000140710186 and
NASA Grant NNG05GR32G.
REFERENCES
Black, M. L., and G. J. Holland, 1995: The boundary layer of Tropical
Cyclone Kerry (1979). Mon. Wea. Rev., 123, 2007–2028.
——, J. F. Gamache, F. D. Marks Jr., C. E. Samsury, and
H. E. Willoughby, 2002: Eastern Pacific Hurricanes Jimena of
1991 and Olivia of 1994: The effect of vertical wind shear on
structure and intensity. Mon. Wea. Rev., 130, 2291–2312.
Braun, S. A., 2002: A cloud-resolving simulation of Hurricane Bob
(1991): Storm structure and eyewall buoyancy. Mon. Wea.
Rev., 130, 1573–1592.
Corbosiero, K. L., J. Molinari, A. R. Aiyyer, and M. L. Black, 2006:
The structure and evolution of Hurricane Elena (1995). Part II:
Convective asymmetries and evidence for vortex-Rossby
waves. Mon. Wea. Rev., 134, 3073–3091.
Dudhia, J., 1993: A nonhydrostatic version of the Penn State–
NCAR Mesoscale Model: Validation tests and simulation
of an Atlantic cyclone and cold front. Mon. Wea. Rev., 121,
1493–1513.
Dutton, J. A., 1976: The Ceaseless Wind. McGraw-Hill, 576 pp.
Frank, W. M., 1977: The structure and energetics of the tropical
cyclone II. Dynamics and energetics. Mon. Wea. Rev., 105,1136–1150.
Hack, J. J., and W. H. Schubert, 1986: Nonlinear response of at-
mospheric vortices to heating by organized cumulus convec-
tion. J. Atmos. Sci., 43, 1559–1573.
Heymsfield, G. M., J. B. Halverson, J. Simpson, L. Tian, and
T. P. Bui, 2001: ER-2 Doppler radar investigations of the
eyewall of Hurricane Bonnie during the Convection and
Moisture Experiment-3. J. Appl. Meteor., 40, 1310–1330.
Kieu, C. Q., and D.-L. Zhang, 2008: Genesis of Tropical Storm
Eugene (2005) from merging vortices associated with ITCZ
breakdowns. Part I: Observational and modeling analyses.
J. Atmos. Sci., 65, 3419–3439.
Kossin, J. P., W. H. Schubert, and M. T. Montgomery, 2000: Un-
stable interactions between a hurricane’s primary eyewall and
SEPTEMBER 2009 H O G S E T T A N D Z H A N G 2695
a secondary region of enhanced vorticity. J. Atmos. Sci., 57,
3893–3917.
Liu, Y., D.-L. Zhang, and M. K. Yau, 1997: A multiscale numerical
study of Hurricane Andrew (1992). Part I: Explicit simulation
and verification. Mon. Wea. Rev., 125, 3073–3093.
Maclay, K. S., M. DeMaria, and T. H. Vonder Haar, 2008: Tropical
cyclone inner-core kinetic energy evolution. Mon. Wea. Rev.,
136, 4882–4898.
McBride, J. L., 1981: Observational analysis of tropical cyclone for-
mation. Part III: Budget analysis. J. Atmos. Sci., 38, 1152–1166.
Molinari, J., and D. Vollaro, 2008: Extreme helicity and intense
convective towers in Hurricane Bonnie. Mon. Wea. Rev., 136,4355–4372.
Montgomery, M. T., and R. J. Kallenbach, 1997: A theory for vortex
Rossby waves and its application to spiral bands and intensity
changes in hurricanes. Quart. J. Roy. Meteor. Soc., 123, 435–465.
Powell, M., and T. Reinhold, 2007: Tropical cyclone destructive
potential by integrated kinetic energy. Bull. Amer. Meteor.
Soc., 88, 1–14.
Reasor, P. D., and M. T. Montgomery, 2001: Three-dimensional
alignment and corotation of weak, TC-like vortices via linear
vortex Rossby waves. J. Atmos. Sci., 58, 2306–2330.
——, ——, F. D. Marks Jr., and J. F. Gamache, 2000: Low wave-
number structure and evolution of the hurricane inner core
observed by airborne dual-Doppler radar. Mon. Wea. Rev.,
128, 1653–1680.
Tuleya, R. E., and Y. Kurihara, 1975: The energy and angular
momentum budgets of a three-dimensional tropical cyclone
model. J. Atmos. Sci., 32, 287–301.
Wang, Y., 2001: An explicit simulation of tropical cyclones with a
triply nested movable mesh primitive equation model: TCM3.
Part I: Model description and control experiment. Mon. Wea.
Rev., 129, 1370–1394.
——, 2002a: Vortex Rossby waves in a numerically simulated
tropical cyclone. Part I: Overall structure, potential vor-
ticity, and kinetic energy budgets. J. Atmos. Sci., 59, 1213–
1238.
——, 2002b: Vortex Rossby waves in a numerically simulated
tropical cyclone. Part II: The role in tropical cyclone structure
and intensity changes. J. Atmos. Sci., 59, 1239–1262.
Zhang, D.-L., and C. Q. Kieu, 2006: Potential vorticity diagnosis
of a simulated hurricane. Part II: Quasi-balanced contri-
butions to forced secondary circulations. J. Atmos. Sci., 63,
2898–2914.
——, Y. Liu, and M. K. Yau, 2001: A multiscale numerical study of
Hurricane Andrew (1992). Part IV: Unbalanced flows. Mon.
Wea. Rev., 129, 92–107.
——, ——, and ——, 2002: A multiscale numerical study of Hur-
ricane Andrew (1992). Part V: Inner-core thermodynamics.
Mon. Wea. Rev., 130, 2745–2763.
Zhu, T., and D.-L. Zhang, 2006a: Numerical simulation of Hurri-
cane Bonnie (1998). Part II: Sensitivity to varying cloud mi-
crophysical processes. J. Atmos. Sci., 63, 109–126.
——, and ——, 2006b: The impact of the storm-induced SST
cooling on hurricane intensity. Adv. Atmos. Sci., 23, 14–22.
——, ——, and F. Weng, 2004: Numerical simulation of Hurricane
Bonnie (1998). Part I: Eyewall evolution and intensity
changes. Mon. Wea. Rev., 132, 225–241.
2696 J O U R N A L O F T H E A T M O S P H E R I C S C I E N C E S VOLUME 66