numerical simulation of interlaminar damage …numerical simulation of interlaminar damage...
TRANSCRIPT
International Journal of Solids and Structures 44 (2007) 3101–3113
www.elsevier.com/locate/ijsolstr
Numerical simulation of interlaminar damage propagationin CFRP cross-ply laminates under transverse loading
Masaaki Nishikawa a, Tomonaga Okabe b,*, Nobuo Takeda c
a Department of Aeronautics and Astronautics, School of Engineering, The University of Tokyo,
c/o Transdisciplinary Sciences Bldg. Mailing Box 311, 5-1-5 Kashiwanoha, Kashiwa-shi, Chiba 277-8561, Japanb Department of Aerospace Engineering, Tohoku University, 6-6-01 Aoba-yama, Aoba-ku, Sendai 980-8579, Japan
c Department of Advanced Energy, Graduate School of Frontier Sciences, The University of Tokyo,
c/o Transdisciplinary Sciences Bldg. Mailing Box 302, 5-1-5 Kashiwanoha, Kashiwa-shi, Chiba 277-8561, Japan
Received 4 April 2006; received in revised form 7 September 2006Available online 16 September 2006
Abstract
This paper proposes a numerical simulation of interlaminar damage propagation in FRP laminates under transverseloading, using the finite element method. First, we conducted drop-weight impact tests on CFRP cross-ply laminates. Aply crack was generated at the center of the lowermost ply, and then a butterfly-shaped interlaminar delamination waspropagated at the 90/0 ply interface. Based on these experimental observations, we present a numerical simulation of inter-laminar damage propagation, using a cohesive zone model to address the energy-based criterion for damage propagation.This simulation can address the interlaminar delamination with high accuracy by locating a fine mesh near the damageprocess zone, while maintaining computational efficiency with the use of automatic mesh generation. The simulated resultsof interlaminar delamination agreed well with the experiment results. Moreover, we demonstrated that the proposedmethod reduces the computational cost of the simulation.� 2006 Elsevier Ltd. All rights reserved.
Keywords: Composite material; Finite element method; Delamination; Cross-ply laminate; Transverse loading
1. Introduction
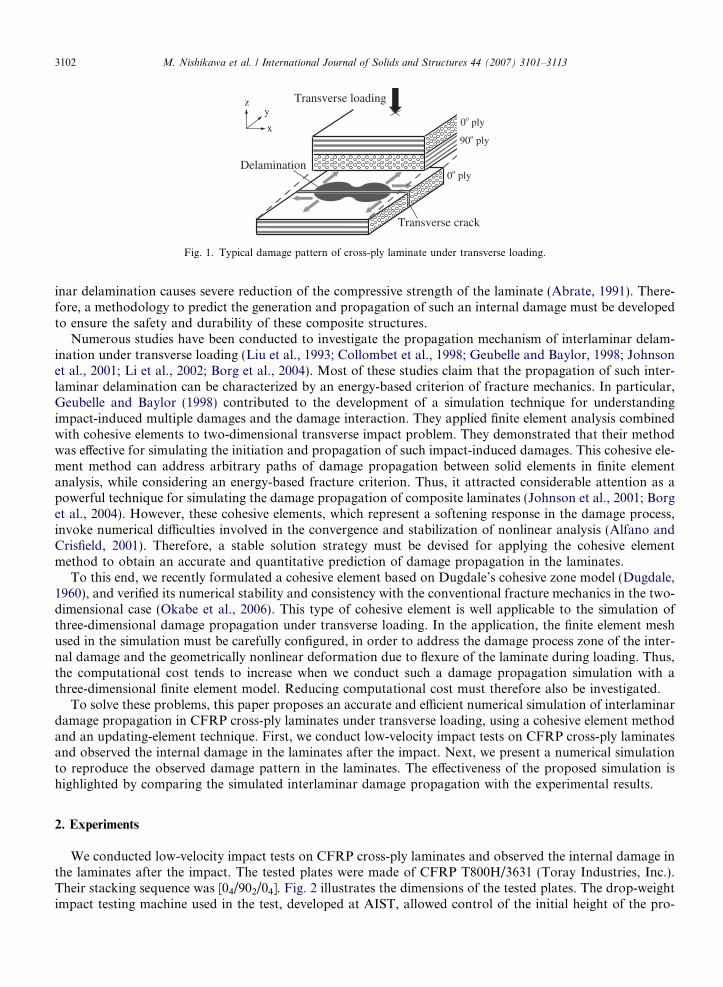
Composite structures composed of carbon fiber reinforced plastics (CFRP) laminates have recently beenput into practical use by the aerospace industry, because of the weight saving of the structural components.However, CFRP laminates tend to suffer from internal damage, such as ply cracks and delaminations betweenthe plies, even under a much lower load than the final failure load. In particular, since the interlaminar fracturetoughness of the laminate is inferior to its in-plane fracture toughness, interlaminar delamination between theplies with different fiber orientations is easily induced by transverse loading to the laminate (Fig. 1). Interlam-
0020-7683/$ - see front matter � 2006 Elsevier Ltd. All rights reserved.
doi:10.1016/j.ijsolstr.2006.09.007
* Corresponding author. Tel./fax: +81 22 795 6984.E-mail address: [email protected] (T. Okabe).
x
y
Transverse crack
Delamination
Transverse loading
0o ply
90o ply
0o ply
z
Fig. 1. Typical damage pattern of cross-ply laminate under transverse loading.
3102 M. Nishikawa et al. / International Journal of Solids and Structures 44 (2007) 3101–3113
inar delamination causes severe reduction of the compressive strength of the laminate (Abrate, 1991). There-fore, a methodology to predict the generation and propagation of such an internal damage must be developedto ensure the safety and durability of these composite structures.
Numerous studies have been conducted to investigate the propagation mechanism of interlaminar delam-ination under transverse loading (Liu et al., 1993; Collombet et al., 1998; Geubelle and Baylor, 1998; Johnsonet al., 2001; Li et al., 2002; Borg et al., 2004). Most of these studies claim that the propagation of such inter-laminar delamination can be characterized by an energy-based criterion of fracture mechanics. In particular,Geubelle and Baylor (1998) contributed to the development of a simulation technique for understandingimpact-induced multiple damages and the damage interaction. They applied finite element analysis combinedwith cohesive elements to two-dimensional transverse impact problem. They demonstrated that their methodwas effective for simulating the initiation and propagation of such impact-induced damages. This cohesive ele-ment method can address arbitrary paths of damage propagation between solid elements in finite elementanalysis, while considering an energy-based fracture criterion. Thus, it attracted considerable attention as apowerful technique for simulating the damage propagation of composite laminates (Johnson et al., 2001; Borget al., 2004). However, these cohesive elements, which represent a softening response in the damage process,invoke numerical difficulties involved in the convergence and stabilization of nonlinear analysis (Alfano andCrisfield, 2001). Therefore, a stable solution strategy must be devised for applying the cohesive elementmethod to obtain an accurate and quantitative prediction of damage propagation in the laminates.
To this end, we recently formulated a cohesive element based on Dugdale’s cohesive zone model (Dugdale,1960), and verified its numerical stability and consistency with the conventional fracture mechanics in the two-dimensional case (Okabe et al., 2006). This type of cohesive element is well applicable to the simulation ofthree-dimensional damage propagation under transverse loading. In the application, the finite element meshused in the simulation must be carefully configured, in order to address the damage process zone of the inter-nal damage and the geometrically nonlinear deformation due to flexure of the laminate during loading. Thus,the computational cost tends to increase when we conduct such a damage propagation simulation with athree-dimensional finite element model. Reducing computational cost must therefore also be investigated.
To solve these problems, this paper proposes an accurate and efficient numerical simulation of interlaminardamage propagation in CFRP cross-ply laminates under transverse loading, using a cohesive element methodand an updating-element technique. First, we conduct low-velocity impact tests on CFRP cross-ply laminatesand observed the internal damage in the laminates after the impact. Next, we present a numerical simulationto reproduce the observed damage pattern in the laminates. The effectiveness of the proposed simulation ishighlighted by comparing the simulated interlaminar damage propagation with the experimental results.
2. Experiments
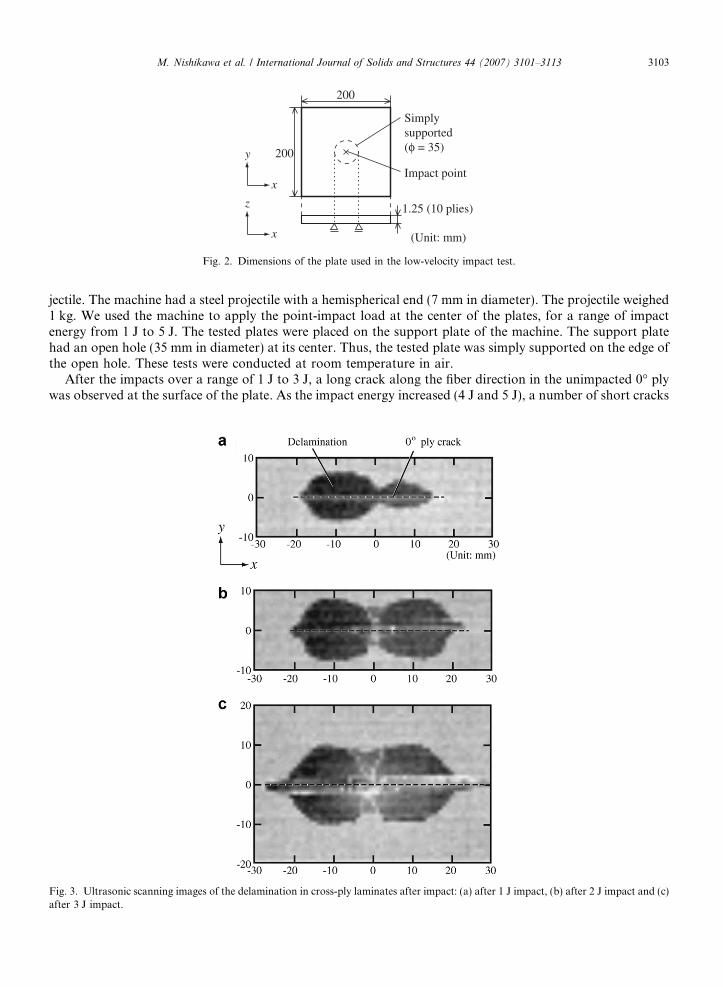
We conducted low-velocity impact tests on CFRP cross-ply laminates and observed the internal damage inthe laminates after the impact. The tested plates were made of CFRP T800H/3631 (Toray Industries, Inc.).Their stacking sequence was [04/902/04]. Fig. 2 illustrates the dimensions of the tested plates. The drop-weightimpact testing machine used in the test, developed at AIST, allowed control of the initial height of the pro-
x
y
200
200
Simplysupported(φ = 35)
Impact point
x
z
(Unit: mm)
1.25 (10 plies)
Fig. 2. Dimensions of the plate used in the low-velocity impact test.
M. Nishikawa et al. / International Journal of Solids and Structures 44 (2007) 3101–3113 3103
jectile. The machine had a steel projectile with a hemispherical end (7 mm in diameter). The projectile weighed1 kg. We used the machine to apply the point-impact load at the center of the plates, for a range of impactenergy from 1 J to 5 J. The tested plates were placed on the support plate of the machine. The support platehad an open hole (35 mm in diameter) at its center. Thus, the tested plate was simply supported on the edge ofthe open hole. These tests were conducted at room temperature in air.
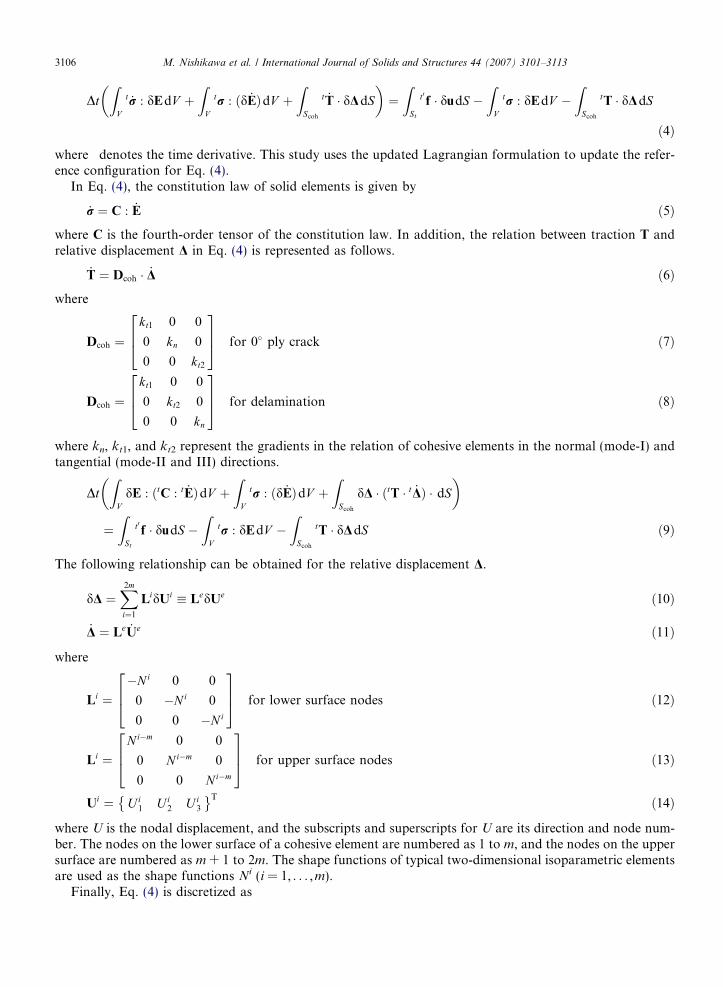
After the impacts over a range of 1 J to 3 J, a long crack along the fiber direction in the unimpacted 0� plywas observed at the surface of the plate. As the impact energy increased (4 J and 5 J), a number of short cracks
Fig. 3. Ultrasonic scanning images of the delamination in cross-ply laminates after impact: (a) after 1 J impact, (b) after 2 J impact and (c)after 3 J impact.

3104 M. Nishikawa et al. / International Journal of Solids and Structures 44 (2007) 3101–3113
were generated near the long central crack. Fiber fracture was also observed at the impact point. Fig. 3 pre-sents ultrasonic scanning images of the interlaminar delamination in the laminates after the impact. A butter-fly-shaped interlaminar delamination was observed at the 90/0 lower interface of the laminates. Thedelaminated area was enlarged with increasing impact energy.
3. Simulation procedure
This section describes the damage propagation simulation based on finite element analysis for internal dam-age (0� ply crack and interlaminar delamination), for a range of low-velocity impact energy from 1 J to 3 J.Since the impact duration is long enough due to the low-velocity impact, the inertial effect on the interlaminardamage propagation is negligible as the previous literature points out (Abrate, 1991). Thus, the present sim-ulation employs a static analysis to address this low-velocity impact.
Considering symmetry, the present simulation uses a one-quarter model in Fig. 4. The dimensions of themodel are presented in Fig. 2. Each ply is modeled by a homogeneous orthotropic-elastic body and dividedinto three-dimensional solid elements. To simulate the propagation of the ply crack at the center in the low-ermost 0� ply and interlaminar delaminations at the ply interfaces, cohesive elements are incorporated betweensolid elements at the corresponding positions.
Here, the cohesive elements are interface elements that relate the relative displacement between solid ele-ments D and the traction force per unit area T, as shown in Fig. 5(a). This simulation addresses the relationbetween relative displacement and traction as illustrated in Fig. 5(b) and (c). This element acts as a penaltyelement maintaining the continuity of the displacements between the solid elements, while the interfacebetween the solid elements is intact. When the traction reaches its maximum value Ti,max(i = I, II, III), itremains constant in the damage process zone, based on Dugdale’s assumption (Dugdale, 1960) that the trac-tion on the crack surface is uniform. Assuming that the traction is unloaded when the energy release ratereaches its critical value Gic (i = I, II, III) with increasing relative displacement, the critical relative displace-ment Dic (i = I, II, III) is defined as
Dic ¼Gic
T i;max
þ T i;max
2k1
ð1Þ
where k1 denotes the initial gradient in the relation of the cohesive element. When the damage process is inprogress under a mixed-mode stress state, the final energy criterion is redefined as
D � DI
DIc
� �2
þ DII
DIIc
� �2
þ DIII
DIIIc
� �2
¼ 1 ð2Þ
When the absolute value of relative displacement decreases in the damage process zone, elastic-unloading isconsidered by setting the initial gradient k1. We call this cohesive element as the Dugdale cohesive element.
Here, we briefly describe the motivations and background for using the Dugdale cohesive element in thepresent simulation. We found that the calculated results with a certain bi-linear cohesive element, using thecoarse finite element mesh, significantly differ from those of fracture mechanics even for the simplest problemof mode-I single-crack growth and the tangent stiffness matrix for calculation in the implicit finite element
x
y
Impact forcez
1/4 analytical region
Fig. 4. Analytical model for the cross-ply laminate under transverse loading.

Solidelement
Solidelement
T
Crack path
ΔΙΙ
ΔΙ
ΔΙΙΙT
ract
ion
Relative displacement
GI
ΔIc0
Elastic-unloading
Unloading
Contactstate
TI,max
Damageprocess zone
Tra
ctio
nRelative displacement
GII
ΔIIc0
TII,max
Elastic-unloading
GII
−ΔIIc
−TII,max
Damageprocess zone
Unloading
a
b c
Fig. 5. Dugdale cohesive element used in the simulation: (a) cohesive element, (b) Mode-I cohesive law and (c) Mode-II and III cohesivelaw.
M. Nishikawa et al. / International Journal of Solids and Structures 44 (2007) 3101–3113 3105
method becomes an indefinite matrix as the crack grows (Okabe et al., 2006). This is because the bi-linearcohesive elements employ a negative gradient to represent the relation between traction and relative displace-ment in the damage process. On the contrary, since the Dugdale cohesive element does not employ a negativegradient, the positive-definiteness of the tangent stiffness matrix can be easily ensured. The simulation withDugdale cohesive element is thus less sensitive to the size of the finite element mesh than the bi-linear cohesiveelements that include softening response in the damage process. This was demonstrated in our previous study.This is the reason for using the Dugdale cohesive element in the present study.
Since the Dugdale cohesive element is a two-parameter model (maximum traction and critical energyrelease rate), the brittle fracture of composites can be addressed by adjusting these parameters. Okabeet al. (2006) demonstrated for the transverse cracking problem in cross-ply laminates that the simulated resultsconverge to the fracture mechanics results for brittle fracture, when the maximum traction of the cohesive ele-ment is increased.
Next, we present the formulation and solution strategy of the finite element simulation. The virtual workfor the analytical region V including the cohesive zone Scoh is as follows.
ZVr : dEdV þ
ZScoh
T � dDdS ¼Z
St
f � dudS ð3Þ
Here, r is the stress tensor, E is the Green–Lagrange strain tensor, u is the displacement vector, f is the externalforce vector on the prescribed boundary St, and d is the virtual component. The second term of Eq. (3) cor-responds to the virtual work by cohesive elements. Let us now consider the unknown variables at timet 0 = t + Dt, using the known variables until time t. Considering the limit Dt! 0, Eq. (3) is linearized as
3106 M. Nishikawa et al. / International Journal of Solids and Structures 44 (2007) 3101–3113
DtZ
V
t _r : dEdV þZ
V
tr : ðd _EÞdV þZ
Scoh
t _T � dDdS� �
¼Z
St
t0f � dudS �Z
V
tr : dEdV �Z
Scoh
tT � dDdS
ð4Þ
where Æ denotes the time derivative. This study uses the updated Lagrangian formulation to update the refer-ence configuration for Eq. (4).In Eq. (4), the constitution law of solid elements is given by
_r ¼ C : _E ð5Þ
where C is the fourth-order tensor of the constitution law. In addition, the relation between traction T andrelative displacement D in Eq. (4) is represented as follows._T ¼ Dcoh � _D ð6Þ
whereDcoh ¼kt1 0 0
0 kn 0
0 0 kt2
264
375 for 0� ply crack ð7Þ
Dcoh ¼kt1 0 0
0 kt2 0
0 0 kn
264
375 for delamination ð8Þ
where kn, kt1, and kt2 represent the gradients in the relation of cohesive elements in the normal (mode-I) andtangential (mode-II and III) directions.
DtZ
VdE : ðtC : t _EÞdV þ
ZV
tr : ðd _EÞdV þZ
Scoh
dD � ðtT � t _DÞ � dS� �
¼Z
St
t0 f � dudS �Z
V
tr : dEdV �Z
Scoh
tT � dDdS ð9Þ
The following relationship can be obtained for the relative displacement D.
dD ¼X2m
i¼1
LidUi � LedUe ð10Þ
_D ¼ Le _Ue ð11Þ
where
Li ¼�N i 0 0
0 �N i 0
0 0 �N i
264
375 for lower surface nodes ð12Þ
Li ¼Ni�m 0 0
0 N i�m 0
0 0 Ni�m
264
375 for upper surface nodes ð13Þ
Ui ¼ U i1 Ui
2 U i3
� �T ð14Þ
where U is the nodal displacement, and the subscripts and superscripts for U are its direction and node num-ber. The nodes on the lower surface of a cohesive element are numbered as 1 to m, and the nodes on the uppersurface are numbered as m + 1 to 2m. The shape functions of typical two-dimensional isoparametric elementsare used as the shape functions Ni (i = 1, . . . ,m).
Finally, Eq. (4) is discretized as
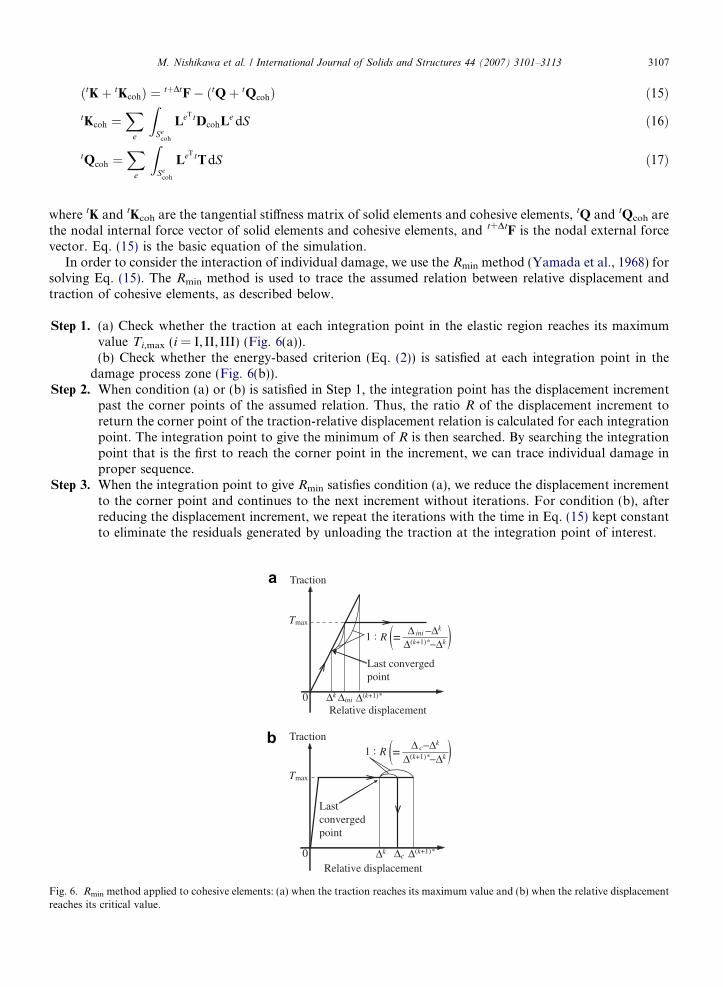
Fig. 6.reache
M. Nishikawa et al. / International Journal of Solids and Structures 44 (2007) 3101–3113 3107
ðtKþ tKcohÞ ¼ tþDtF� ðtQþ tQcohÞ ð15ÞtKcoh ¼
Xe
ZSe
coh
LeT tDcohLe dS ð16Þ
tQcoh ¼X
e
ZSe
coh
LeT tTdS ð17Þ
where tK and tKcoh are the tangential stiffness matrix of solid elements and cohesive elements, tQ and tQcoh arethe nodal internal force vector of solid elements and cohesive elements, and t+DtF is the nodal external forcevector. Eq. (15) is the basic equation of the simulation.
In order to consider the interaction of individual damage, we use the Rmin method (Yamada et al., 1968) forsolving Eq. (15). The Rmin method is used to trace the assumed relation between relative displacement andtraction of cohesive elements, as described below.
Step 1. (a) Check whether the traction at each integration point in the elastic region reaches its maximumvalue Ti,max (i = I, II, III) (Fig. 6(a)).
R
s i
(b) Check whether the energy-based criterion (Eq. (2)) is satisfied at each integration point in thedamage process zone (Fig. 6(b)).
Step 2. When condition (a) or (b) is satisfied in Step 1, the integration point has the displacement incrementpast the corner points of the assumed relation. Thus, the ratio R of the displacement increment toreturn the corner point of the traction-relative displacement relation is calculated for each integrationpoint. The integration point to give the minimum of R is then searched. By searching the integrationpoint that is the first to reach the corner point in the increment, we can trace individual damage inproper sequence.
Step 3. When the integration point to give Rmin satisfies condition (a), we reduce the displacement incrementto the corner point and continues to the next increment without iterations. For condition (b), afterreducing the displacement increment, we repeat the iterations with the time in Eq. (15) kept constantto eliminate the residuals generated by unloading the traction at the integration point of interest.
Traction
Relative displacement
Tmax
0 Δini
Last converged point
Δ(k+1)*Δk
RΔ(k+1)*−ΔkΔ ini −Δk
1 : ( (=
Relative displacement
Tmax
0 Δc
Traction
Δ(k+1)*Δk
RΔ(k+1)*−Δk
Δ c−Δk1 : ( (=
Lastconverged point
a
b
min method applied to cohesive elements: (a) when the traction reaches its maximum value and (b) when the relative displacementts critical value.
3108 M. Nishikawa et al. / International Journal of Solids and Structures 44 (2007) 3101–3113
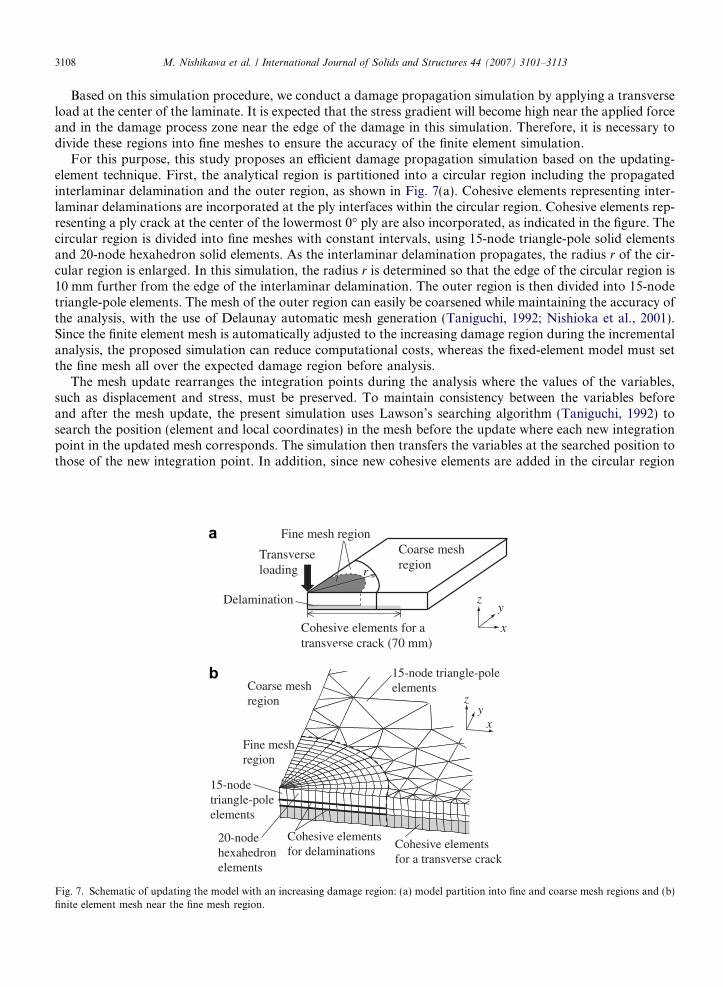
Based on this simulation procedure, we conduct a damage propagation simulation by applying a transverseload at the center of the laminate. It is expected that the stress gradient will become high near the applied forceand in the damage process zone near the edge of the damage in this simulation. Therefore, it is necessary todivide these regions into fine meshes to ensure the accuracy of the finite element simulation.
For this purpose, this study proposes an efficient damage propagation simulation based on the updating-element technique. First, the analytical region is partitioned into a circular region including the propagatedinterlaminar delamination and the outer region, as shown in Fig. 7(a). Cohesive elements representing inter-laminar delaminations are incorporated at the ply interfaces within the circular region. Cohesive elements rep-resenting a ply crack at the center of the lowermost 0� ply are also incorporated, as indicated in the figure. Thecircular region is divided into fine meshes with constant intervals, using 15-node triangle-pole solid elementsand 20-node hexahedron solid elements. As the interlaminar delamination propagates, the radius r of the cir-cular region is enlarged. In this simulation, the radius r is determined so that the edge of the circular region is10 mm further from the edge of the interlaminar delamination. The outer region is then divided into 15-nodetriangle-pole elements. The mesh of the outer region can easily be coarsened while maintaining the accuracy ofthe analysis, with the use of Delaunay automatic mesh generation (Taniguchi, 1992; Nishioka et al., 2001).Since the finite element mesh is automatically adjusted to the increasing damage region during the incrementalanalysis, the proposed simulation can reduce computational costs, whereas the fixed-element model must setthe fine mesh all over the expected damage region before analysis.
The mesh update rearranges the integration points during the analysis where the values of the variables,such as displacement and stress, must be preserved. To maintain consistency between the variables beforeand after the mesh update, the present simulation uses Lawson’s searching algorithm (Taniguchi, 1992) tosearch the position (element and local coordinates) in the mesh before the update where each new integrationpoint in the updated mesh corresponds. The simulation then transfers the variables at the searched position tothose of the new integration point. In addition, since new cohesive elements are added in the circular region
x
yz
Transverse loading
Delamination
r
Fine mesh regionCoarse mesh region
Cohesive elements for a transverse crack (70 mm)
Cohesive elements for delaminations
Fine mesh region
xy
zCoarse mesh region
Cohesive elements for a transverse crack
15-node triangle-pole elements
15-nodetriangle-poleelements
20-nodehexahedronelements
a
b
Fig. 7. Schematic of updating the model with an increasing damage region: (a) model partition into fine and coarse mesh regions and (b)finite element mesh near the fine mesh region.

M. Nishikawa et al. / International Journal of Solids and Structures 44 (2007) 3101–3113 3109
after the mesh update, we substitute the stress at the corresponding position before the update into the tractionat each integration point of the cohesive elements. Fig. 8 schematically illustrates this process.
4. Results and discussion
Based on the simulation procedure presented in the previous section, we simulated the propagation ofinterlaminar delamination in CFRP cross-ply laminates under transverse loading. Table 1 presents thematerial properties used in the simulation. These were reported by Yashiro et al. (2005). Table 2 liststhe parameters of cohesive elements representing 0� ply crack and interlaminar delamination. As in theexperiment, simply supported boundary conditions were applied at the circular edge, which was 35 mm
x
yz
Integrationpoint
DoublenodeNewly
introducedcohesiveelement
Singlenode
T = t
t
TractionStressvector
Fig. 8. Schematic of a newly added cohesive element by mesh update.
Table 1Material properties of T800H/3631 unidirectional ply
Young’s modulusELL 148 GPaETT, Ezz 9.57 GPa
Poisson’s ratiomLT, mLz 0.356mTz 0.49
Elastic shear modulusGLT, GLz 4.5 GPaGTz 3.5 GPa
Thermal expansion coefficientaT, az 36.0 · 10�6 K�1
aL �0.6 · 10�6 K�1
Temperature change DT 165 K
Subscripts L, T, z denote the fiber axial direction, transerve direction and thickness direction, respectively.
Table 2Strength parameters of cohesive elements used in the simulation
Ply crack
Mode-I maximum traction TI,max 60 MPaMode-II, III maximum traction TII,max, TIII,max 100 MPaMode-I critical energy release rate GIc 100 J/m2
Mode-II, III critical energy release rate GIIc, GIIIc 200 J/m2
Delamination
Mode-I maximum traction TI,max 60 MPaMode-II, III maximum traction TII,max, TIII,max 100 MPaMode-I critical energy release rate GIc 100 J/m2
Mode-II, III critical energy release rate GIIc, GIIIc 400 J/m2

3110 M. Nishikawa et al. / International Journal of Solids and Structures 44 (2007) 3101–3113
in diameter. The simulation represented these boundary conditions by applying the penalty-functionmethod to selected points with constant intervals. The analysis was controlled by the uniformly distributedtransverse load, which was applied to the element at the center of the plate. (A similar treatment can befound in Li et al. (2002).)
The simulated results indicated that a ply crack first extended in the lowermost 0� ply and then the inter-laminar delamination at the 90/0 ply interface was generated at the crack tip. Fig. 9 illustrates the simulatedresults of interlaminar delamination at the 90/0 ply interface at three levels of the applied transverse load.Each load level corresponds to the impact energy presented in Fig. 3. (The correspondence between loadand impact energy was verified by a spring-mass model. A general explanation of the spring-mass modelcan be found in Shivakumar et al. (1985) and Olsson (1992).) The figure plots the distribution of D definedin Eq. (2). D � 0 denotes an intact interface, 0 6 D 6 1 denotes a damage process zone, and D P 1 denotesa completely damaged interface. As also seen in Fig. 3, the interlaminar delamination is butterfly-shapedand extends longer in the 0� fiber direction. The delaminated area is enlarged with the increasing transverseloading. Although the minute difference in the delamination length in x-direction can be found between Figs.3 and 9 due to the difference of the 0� ply crack growth, the simulated results agree well with experimentalresults as a whole.
-10
0
10
-30 -20 -10 0 10 20 30
x
y
0.1 0.2 0.3 0.4 0.5 0.6 0.7 0.8 0.9 1.0D :
(intact) (damaged)0o ply crackDelamination
(Unit: mm)
-30 -20 -10 0 10 20 30-20
-10
0
10
20
-30 -20 -10 0 10 20 30-20
-10
0
10
20
a
b
c
Fig. 9. Simulated delaminations at the 90/0 ply interface in CFRP cross-ply laminates: (a) after 1 J impact (impact force = 1.4 kN), (b)after 2 J impact (impact force = 2.3 kN) and (c) after 3 J impact (impact force = 3.0 kN).
x y
za
b
c
d
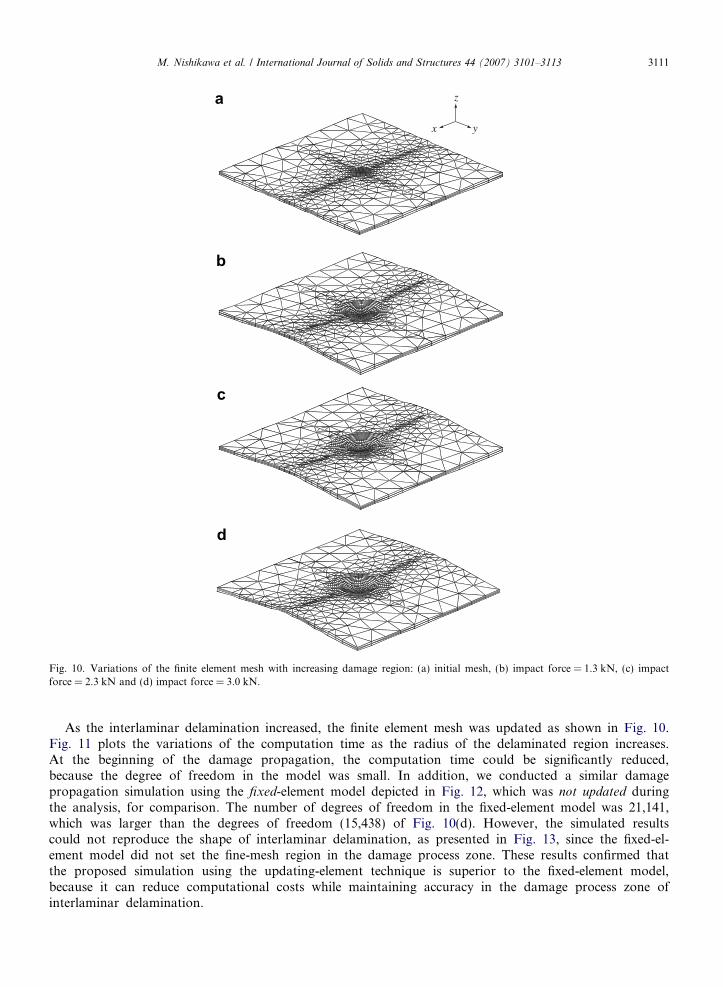
Fig. 10. Variations of the finite element mesh with increasing damage region: (a) initial mesh, (b) impact force = 1.3 kN, (c) impactforce = 2.3 kN and (d) impact force = 3.0 kN.
M. Nishikawa et al. / International Journal of Solids and Structures 44 (2007) 3101–3113 3111
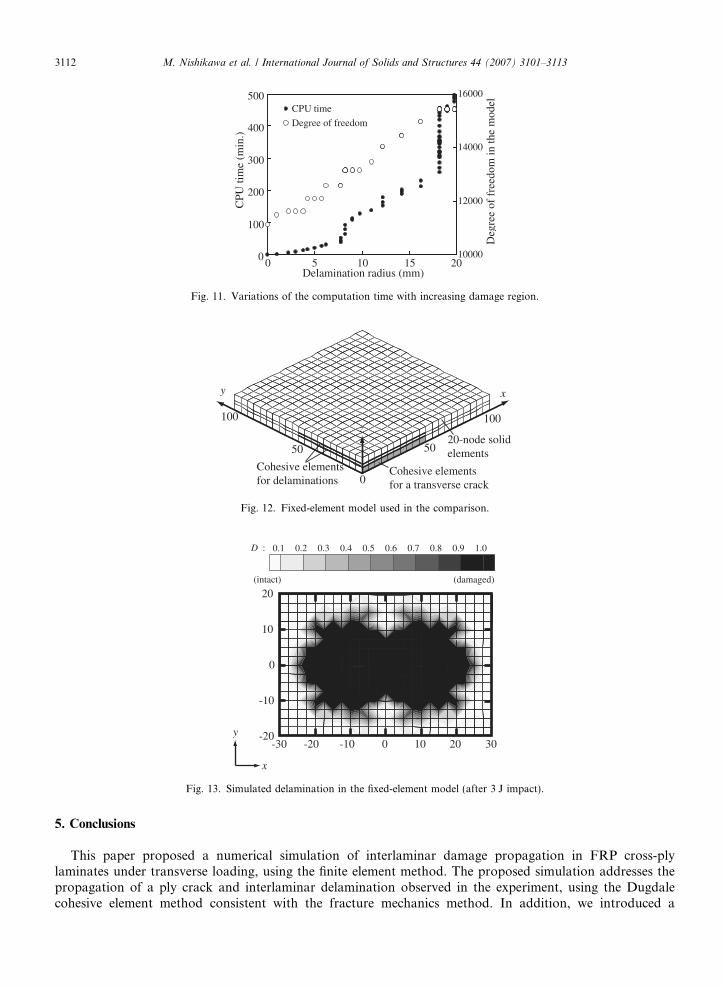
As the interlaminar delamination increased, the finite element mesh was updated as shown in Fig. 10.Fig. 11 plots the variations of the computation time as the radius of the delaminated region increases.At the beginning of the damage propagation, the computation time could be significantly reduced,because the degree of freedom in the model was small. In addition, we conducted a similar damagepropagation simulation using the fixed-element model depicted in Fig. 12, which was not updated duringthe analysis, for comparison. The number of degrees of freedom in the fixed-element model was 21,141,which was larger than the degrees of freedom (15,438) of Fig. 10(d). However, the simulated resultscould not reproduce the shape of interlaminar delamination, as presented in Fig. 13, since the fixed-el-ement model did not set the fine-mesh region in the damage process zone. These results confirmed thatthe proposed simulation using the updating-element technique is superior to the fixed-element model,because it can reduce computational costs while maintaining accuracy in the damage process zone ofinterlaminar delamination.
CPU
tim
e (m
in.)
Delamination radius (mm)
0
100
200
300
400
500
0 5 10 15 2010000
12000
14000
16000
CPU time
Degree of freedom
Deg
ree
of f
reed
om in
the
mod
el
Fig. 11. Variations of the computation time with increasing damage region.
xy
z
0
100100
5050
Cohesive elements for delaminations
20-node solid elements
Cohesive elements for a transverse crack
Fig. 12. Fixed-element model used in the comparison.
-30 -20 -10 0 10 20 30-20
-10
0
10
20
0.1 0.2 0.3 0.4 0.5 0.6 0.7 0.8 0.9 1.0D :
(intact) (damaged)
x
y
Fig. 13. Simulated delamination in the fixed-element model (after 3 J impact).
3112 M. Nishikawa et al. / International Journal of Solids and Structures 44 (2007) 3101–3113
5. Conclusions
This paper proposed a numerical simulation of interlaminar damage propagation in FRP cross-plylaminates under transverse loading, using the finite element method. The proposed simulation addresses thepropagation of a ply crack and interlaminar delamination observed in the experiment, using the Dugdalecohesive element method consistent with the fracture mechanics method. In addition, we introduced a
M. Nishikawa et al. / International Journal of Solids and Structures 44 (2007) 3101–3113 3113
simulation procedure using the updating-element method to analyze the damage process zone of internal dam-age with high accuracy. We demonstrated that the computation time can be reduced because the updating-el-ement method can arbitrarily adjust the fine-mesh region to the damaged region. Moreover, the proposedsimulation well reproduced the shape of interlaminar delamination in the laminates observed in the experi-ment, compared with the fixed-element model consisting of about the same degrees of freedom.
Acknowledgements
We would like to thank Dr. J. Takatsubo and Dr. N. Toyama (AIST) for their cooperation and valuablecomments in the experiment. T.O. acknowledges the support of the Ministry of Education, Culture, Sports,Science and Technology of Japan under Grants-in-Aid for Scientific Research (No. 18760515). M.N. alsoacknowledges the support of the Ministry of Education, Culture, Sports, Science and Technology of Japanunder Grants-in-Aid for Scientific Research (No. 17-11722).
References
Abrate, S., 1991. Impact on laminated composite materials. Applied Mechanics Review 44, 155–191.Alfano, G., Crisfield, M.A., 2001. Finite element interface models for the delamination analysis of laminated composites: mechanical and
computational issues. International Journal for Numerical Methods in Engineering 50, 1701–1736.Borg, R., Nilsson, L., Simonsson, K., 2004. Simulation of low velocity impact on fiber laminates using a cohesive zone based delamination
model. Composites Science and Technology 64, 279–288.Collombet, F., Labin, X., Lataillade, J.L., 1998. Impact behavior of laminated composites: physical basis for finite element analysis.
Composites Science and Technology 58, 463–478.Dugdale, D.S., 1960. Yielding of steel sheets containing slits. Journal of the Mechanics and Physics of Solids 8, 100–104.Geubelle, P.H., Baylor, J.S., 1998. Impact-induced delamination of composites: a 2D simulation. Composites 29B, 589–602.Johnson, A.F., Pickett, A.K., Rozycki, P., 2001. Computational methods for predicting impact damage in composite structures.
Composites Science and Technology 61, 2183–2192.Li, C.F., Hu, N., Yin, Y.J., Sekine, H., Fukunaga, H., 2002. Low-velocity impact-induced damage of continuous fiber-reinforced
composite laminates. Part I. An FEM numerical model. Composites 33A, 1055–1062.Liu, S., Kutlu, Z., Chang, F.K., 1993. Matrix cracking and delamination in laminated composite beams subjected to a transverse
concentrated line load. Journal of Composite Materials 27, 436–470.Nishioka, T., Tokudome, H., Kinoshita, M., 2001. Dynamic fracture-path prediction in impact fracture phenomena using moving finite
element method based on Delaunay automatic mesh generation. International Journal of Solids and Structures 38, 5273–5301.Okabe, T., Nishikawa, M., Takeda, N., 2006. Numerical simulation of tensile damage process in FRP cross-ply laminates. Transactions of
the Japan Society of Mechanical Engineers Series A 72, 1254–1261 (in Japanese).Olsson, R., 1992. Impact response of orthotropic composite plates predicted from a one-parameter differential equation. AIAA Journal 30,
1587–1596.Shivakumar, K.N., Elber, W., Illg, W., 1985. Prediction of impact force and duration due to low-velocity impact on circular composite
laminates. Transactions of the ASME: Journal of Applied Mechanics 52, 674–680.Taniguchi, T., 1992. Automatic Mesh Generation for FEM: Use of Delaunay Triangulation. Morikita Publishing (in Japanese).Yamada, Y., Yoshimura, N., Sakurai, T., 1968. Plastic stress–strain matrix and its application for the solution of elastic–plastic problems
by the finite element method. International Journal of Mechanical Sciences 10, 343–354.Yashiro, S., Takeda, N., Okabe, T., Sekine, H., 2005. A new approach to predicting multiple damage states in composite laminates with
embedded FBG sensors. Composites Science and Technology 65, 659–667.