numerical simulation of the surface air temperature change
TRANSCRIPT

Journal of the Meteorological Society of Japan, Vol. 90B, pp. 11--31, 2012 11
doi:10.2151/jmsj.2012-B02
Numerical Simulation of the Surface Air Temperature Change Caused by Increases of
Urban Area, Anthropogenic Heat, and Building Aspect Ratio in the Kanto-Koshin Area
Toshinori AOYAGI
Atmospheric Environment and Applied Meteorology Research Department,
Meteorological Research Institute, Tsukuba, Japan
Nobuyuki KAYABA
Global Environment and Marine Department, Japan Meteorological Agency, Tokyo, Japan
and
Naoko SEINO
Forecast Research Department, Meteorological Research Institute, Tsukuba, Japan
(Manuscript received 13 July 2011, in final form 18 December 2011)
Abstract
We investigated a warming trend in the Kanto-Koshin area during a 30-year period (1976–2006). The warm-ing trends at AMeDAS stations were estimated to average a little less than 1.3�C/30 years in both summer andwinter. These warming trends were considered to include the trends of large-scale and local-scale warming e¤ects.Because a regional climate model with 20-km resolution without any urban parameterization could not well ex-press the observed warming trends and their daily variations, we investigated whether a mesoscale atmosphericmodel with an urban canopy scheme could express them.
To make the simulations realistic, we used 3 sets of real data: National Land Numerical Information datasetsfor the estimation of the land use area fractions, anthropogenic heat datasets varying in space and time, and GISdatasets of building shapes in the Tokyo Metropolis for the setting of building aspect ratios. The time integrationsover 2 months were executed for both summer and winter. A certain level of correlation was found between thesimulated temperature rises and the observed warming trends at the AMeDAS stations. The daily variation of thetemperature rises in urban grids was higher at night than in the daytime, and its range was larger in winter thanin summer. Such tendencies were consistent with the observational results.
From factor analyses, we figured out the classic and some unexpected features of urban warming, as follows:(1) Land use distribution change (mainly caused by the decrease of vegetation cover) had the largest daytimewarming e¤ect, and the e¤ect was larger in summer than in winter; (2) anthropogenic heat had a warming e¤ectwith 2 small peaks owing to the daily variation of the released heat and the timing of stable atmospheric layerformation; and (3) increased building height was the largest factor contributing to the temperature rises, with asingle peak in early morning.
1. Introduction
Surface air temperature warming trends derivedfrom long-term observations in Japan are wellknown. The trends reflect the global warming base-line shift, but the magnitude of the shift, especially
Corresponding author: Toshinori AOYAGI: Atmo-spheric Environment and Applied Meteorology Re-search Department, Meteorological Research Institute,1-1, Nagamine, Tsukuba, 305-0052, Japan.E-mail: [email protected] 2012, Meteorological Society of Japan

in urban areas, is obviously larger than expected.The excess magnitude is attributed to the so-calledurbanization e¤ect, that is, an e¤ect of humanactivities. Recently, Fujibe (2009) estimated urbanwarming trends over 27 years (from 1979 to 2006)by using observational data from the AutomatedMeteorological Data Acquisition System (AMe-DAS). The study showed that annual mean temper-ature warming trends ranged from approximately0.3�C per decade (at AMeDAS observatories sur-rounded by the smallest population densities) to0.5�C per decade (at observatories with the largestdensities). This analysis suggests an associationbetween urban temperature trends and human ac-tivities.
As shown by Fujibe (2010) in a review of urbanwarming in Japanese cities, the warming e¤ects ofurban surfaces are more apparent at night, in par-ticular during the cold season, corresponding to alow mixing depth in the stable surface layer. Dur-ing the past few decades, however, studies of urbanclimatology in Japan have taken a strong interest inthe midsummer heat load of cities because of its as-sociation with an increased risk of heat stroke. Healso observed that the region having the greatesttemperature increase (more than 1�C per 30 years)in the summer extended from the vicinity of Tokyoto the northwestern corner of the Kanto Plain. Thisresult is consistent with the findings of a decrease indaytime pressure at the center of the Kanto Plainand a shift of wind direction toward the area oflower pressure (Fujibe 1994, 2003).
Besides observational research, simulation studiesof urban climatology have been performed. Usingtheir local climate model, Kimura and Takahashi(1991) assessed the e¤ects of anthropogenic heatload and land use modification from vegetation tourban surfaces on the surface air temperature inthe Kanto Plain. Their simulation was performedunder atmospheric conditions averaging 36 typicalclear summer days. The temperature rise inducedby the addition of anthropogenic heat and themodification of land use was estimated to be ap-proximately 3�C (nighttime) and 1�C (daytime) atthe center of the Tokyo Metropolitan area. Theyconcluded that the anthropogenic heat load is themain cause of nighttime warming and diminishedvegetation is the primary cause of the temperaturerise during the daytime. Ichinose et al. (1999) alsoconducted a numerical simulation with a moredetailed and realistic distribution of the anthro-pogenic heat. Their simulation showed that the sur-
face air temperature could rise by about 1.5�C on asummer day and by about 2.5�C on a winter day,peaking at late evening at the center grid of theheat distribution.
Kusaka et al. (2000) provided 3 di¤erent bottomboundary conditions for their mesoscale model byusing land use information from 1900, 1950, and1985. After performing some sensitivity experi-ments using the 3 land use scenarios under typicalsummer atmospheric conditions, they estimatedthat the warming bias might be about 2–3�C over85 years (1990–1950) and about 1–2�C over thelater 35 years (1950–1985). They also noted thatthe warm bias areas were distributed around theouter part but not in the center of the Tokyo Met-ropolitan area.
Kusaka and Kimura (2004a, b) estimated urbancanyon e¤ects, such as redistribution of radiation,heat transfers among surfaces in the canyon, andreduction of wind speeds inside the canopy layer,using their 2-dimensional atmospheric model towhich they coupled their urban canopy model (Ku-saka et al. 2001). The results of their simulationshowed that urban warming could occur by onlythe canyon e¤ects of urban buildings.
These earlier numerical studies on urban warm-ing succeeded as a sort of factor analysis. Theirsimulations, however, were carried out under ideal-ized or other clear and calm atmospheric condi-tions. Therefore, a simple comparison cannot bemade between such warming bias predictions andobservational temperature trends of the real atmo-sphere, in which many atmospheric phenomenacan occur. The surface changes must be sensitiveto the weather conditions. Furthermore, there arepossible interactions between urban surfaces andmeteorological phenomena, such as cloud genera-tion caused by the urban heat load (Inoue andKimura 2004, 2007).
To estimate the sensitivity of land surface mod-ification to urban warming e¤ects more accurately,reproduction experiments with increased realismhave recently been employed that use mesoscalemodels incorporating the concept of urban canopyenergy balances coupled to their land surfaceschemes. Numerical simulations using cloud resolv-ing non-hydrostatic models are mainly performedwith realistic initial and boundary conditions basedon reanalysis data. Kusaka et al. (2009) tried to re-produce the summer meteorological fields of 2002,2003, and 2004 by targeting the Weather Researchand Forecast model (WRF) onto the Kanto area,
12 Journal of the Meteorological Society of Japan Vol. 90B

and they showed the availability of the WRF modelto climatic research. Adachi and Kimura (2010) re-searched the urban e¤ects of 10 years of land usemodification (from 1987 to 1997) on the nighttimetemperatures of cities in the Kanto Plain by con-ducting simulation with their Terrestrial Environ-ment Research Center version of the RegionalAtmospheric Modeling System (TERC-RAMS).They conducted the TERC-RAMS simulationswith experimental matrices under the followingconditions: 2 surface boundary conditions of 1987and 1997, 2 atmospheric boundary conditions ofthe 1980’s and 1990’s downscaled from Japanesere-analysis (JRA-25) datasets (Onogi et al. 2007),and atmospheric conditions derived by the pseudo-global warming downscaling method (Kawase et al.2009). They pointed out that urban warming duringthe nighttime (0200–0400 LST) in August from1987 to 1997 might be about 0.3–0.4�C around thecenter of the Tokyo Metropolitan area. Hara et al.(2010) checked the sensitivity of the atmosphericstability, which will change after global warming,to the urban heat island intensity in winter by a nu-merical simulation with the WRF model. Theyshowed that the nighttime urban heat island willgrow on average in winter as the atmosphere be-comes more stratified by future global warming.Although their interest was in the relationship be-tween global warming and the urban heat island,their research showed that the WRF system can be
applied to urban climate research on wintertimee¤ects.
Likewise, our intention was to reproduce theurban warming potential caused by urban growthin recent decades by numerical simulations withour non-hydrostatic atmospheric model. In thispaper, we compare the results with observed tem-perature trends. For a more consistent comparison,we use land use information from the years corre-sponding to the observational dataset. After evalu-ating the reproducibility and checking the limita-tion of the reproduction, we perform some classicsensitivity studies of urban e¤ects, that is, the ef-fects of decreased vegetation area, anthropogenicheat load, and the structural change of urban build-ing canopies.
2. Warming trends in the Kanto-Koshin area
The study area was the Kanto-Koshin region ineastern central Japan. First, we briefly reviewwarming trends from 1976 to 2006 observed atthe AMeDAS stations. Figure 1 shows the distri-butions of seasonally averaged temperature trendsfor summer (July and August) and winter (Januaryand February) as derived by a simple regressionmethod. Only data without any statistical discon-nection during the years of the study period wereused. A bigger square represents a warmer trendat the station and a variety of symbols show thet-test significance levels. Table 1 lists the trends
Fig. 1. Daily average temperature trends and their significances at AMeDAS stations. The size of the squarerepresents the trend. The indicated marks represent the significance levels of the trends.
February 2012 T. AOYAGI et al. 13

Table 1. AMeDAS stations in the study area (the Kanto-Koshin region). The trends and their significances derivedfrom 31 years (1976–2006) of observational data are also listed.
Trend [�C/30 years] Significance [%]
Station ID Station Name summer winter summer winter
36476 KOORIYAMA 1.69 1.52 95 98
36667 SHIRAKAWA 1.16 1.31 87 95
40201 MITO 1.28 1.30 89 96
41141 OTAWARA 1.12 1.33 88 96
41166 OKUNIKKO 1.26 1.01 96 82
41277 UTSUNOMIYA 1.64 2.05 96 99
42251 MAEBASHI 1.67 1.36 95 96
42266 KIRYU 0.92 1.14 76 93
43056 KUMAGAYA 1.86 1.67 97 99
43156 CHICHIBU 1.43 1.55 94 98
44131 TOKYO 1.53 1.48 94 98
45147 CHOSHI 0.81 0.97 77 85
45212 CHIBA 1.74 1.75 97 99
45371 KATSUURA 0.71 1.22 79 94
45401 TATEYAMA 1.05 0.82 92 84
46106 YOKOHAMA 1.43 1.44 95 98
48156 NAGANO 1.06 1.14 89 87
48256 UEDA 0.50 0.62 54 61
48331 KARUIZAWA 1.59 1.37 98 92
48361 MATSUMOTO 1.46 0.94 97 78
48491 SUWA 1.55 1.33 99 87
48606 KISOFUKUSHIMA 1.59 1.09 99 82
48767 IIDA 1.65 0.92 99 80
49142 KOFU 1.72 1.65 99 99
49251 KAWAGUCHIKO 1.67 1.37 99 94
50206 MISHIMA 1.49 1.40 98 97
50281 AJIRO 1.06 1.02 88 91
50331 SHIZUOKA 1.03 1.16 91 94
50456 HAMAMATSU 1.28 1.31 96 94
50551 OMAEZAKI 0.67 1.45 74 96
50561 IROZAKI 0.68 0.90 75 86
54651 TAKADA 1.09 1.25 89 94
14 Journal of the Meteorological Society of Japan Vol. 90B
and significance levels at each station. Simpleaveraged warming trends were estimated to be alittle less than 1.3�C/30 years for both summerand winter. Note that all of the trends were posi-tive in both seasons. Among the trends with asignificance level of over 80%, 8 stations (stationIDs 42251, 48331, 48491, 48606, 48767, 49251,44131, and 45401) had larger trends in summerthan in winter and only 2 stations (41277 and43156) had warming trends larger in winter thanin summer. It can be seen that the inland warmingtrends were larger than the coastal ones in bothseasons.
Figure 2 shows the seasonal daily trends at theindividual stations. The seasonal averages over 2months of the 24-hourly surface air temperatureswere determined and their yearly trends were esti-mated. Stations were classified into 3 types: A) sta-tions with large warming trends during the day-time, B) stations with flat trends throughout theday, and C) stations with small warming trendsduring the daytime. The classification was per-formed as follows. First, stations with a standarddeviation within 0.1�C for each of 24 hourly valueswere categorized as group B. Next, the stationswhose averaged trends during daytime (0600–1800LST for summer, 0700–1700 LST for winter) werelarger than during the night were categorized asgroup A. Other stations were categorized to groupC. Following this procedure, for summer, 27 sta-tions were sorted equally into groups A, B, andC. For winter, however, almost all of the stationswere categorized as group C. Figure 2D shows thetime series of di¤erentials between the 1990’s and1980’s climatic surface air temperatures aroundthe Kanto-Koshin area as simulated by the Non-Hydrostatic Regional Climate Model (NHRCM;Ishizaki et al. 2009), downscaled from JRA-25without any consideration of urban e¤ects. Com-pared to the observational results, the warmingtrends of the NHRCM are considerably underesti-mated in summer and slightly overestimated inwinter. Furthermore, the daily variations of thewarming trends are very poorly reproduced. Suchdiscrepancies are probably caused by the lack ofurban e¤ects in the NHRCM.
Next, by utilizing a meteorological mesoscalemodel, we investigate whether urbanization e¤ects,such as the decrease of vegetation, increase ofanthropogenic heat, and structural changes insideurban areas, can explain the average or the dailyvariation of these warming trends.
3. Experimental setting
The aim of this study was to check the reproduci-bility of the daily variations of observational warm-ing trends during a 30-year period, as described inthe previous section, using a sophisticated atmo-spheric model. In particular, we estimate the contri-butions of land surface modifications to the warm-ing by altering the bottom boundary conditionsof the atmospheric model. A brief introduction tothe atmospheric model and urban parameterizationscheme coupled to the model is presented in thissection. The specifications of the initial and bound-ary conditions, the settings, and the data used in thereproduction and some sensitivity experiments arealso described.
3.1 Atmospheric model
The base model used in this study is the JapanMeteorological Agency Non-Hydrostatic Model(JMA-NHM; Saito et al. 2007). The JMA-NHMis a fully compressible atmospheric model thatwas adopted as an operational regional mesoscalemodel at the JMA. The main specifications aredescribed in Table 2. We selected the operationalsettings for almost all of the settings for the model.
For urban grids, however, we adopted the single-layered urban canopy scheme of Aoyagi and Seino(2011) instead of the default simple slab type sur-face scheme. This urban canopy scheme is an ex-tended version of the energy balance scheme of ur-ban canopy models originally proposed by Masson(2000) and Kusaka et al. (2001). The 3-dimensionalconsideration of the estimation of radiation distri-butions by building canopies and the consider-ation of latent heat fluxes from stored water on thebuilding surfaces are parts of our urban scheme inthis study, which we extended from the originalmodels. Figure 3 are schematic images of a flux cir-cuit of this urban canopy scheme and an ordinaryslab scheme. The application of the urban canopyscheme enables us to describe urban radiative ef-fects and the modifications of heat fluxes from thecanopy surfaces.
Using this atmospheric model, we executed sev-eral simulations of the Kanto-Koshin area with ahorizontal grid scale of 4 km. Operational meso-scale analysis (MANAL) data of the JMA wereused as the initial atmospheric conditions. Forsummer simulation, MANAL data of 25 June2006 0000 UTC were used as the initial conditions.Continuous integration over about 2 months was
February 2012 T. AOYAGI et al. 15

executed while providing the 3 hourly MANALdata as lateral boundary conditions of the simula-tion. After about 1 week spin-up, the half hourlyoutput from 01 July 2006 0000 UTC to 31 August2006 2330 UTC was used for the analysis. For
winter simulation, MANAL data from 25 De-cember 2006 0000 UTC were used as the initialconditions and simulated data from 01 January2007 0000 UTC to 28 February 2007 2330 UTCwere used for the analysis.
Fig. 2. Daily seasonal variation of temperature trends. (A) Groups of observatories having trends withan upward convex shape, (B) with flat daily variation, and (C) with a downward convex shape. (D) Dailyvariation of the temperature trends derived from the 20 years dataset (1981–2000) of the NHRCM-20kmsimulation results, downscaled from JRA-25.
16 Journal of the Meteorological Society of Japan Vol. 90B

3.2 Land use settings
The land surface parameters used as the bottomboundary conditions were derived from the 1976and 2006 versions of the National Land NumericalInformation (land use data) provided by the Minis-try of Land, Infrastructure, Transport and Tourismof Japan. The area fractions of 11 types of surface
categories are stored in the land use dataset with agrid spacing of about 100 m. A stacked bar chart ofoccupancies and a bar chart of the increase or de-crease of each category from 1976 to 2006 in thestudy area are shown in Fig. 4. It is obvious thatthe building lot area increased significantly andvegetation areas of paddy field, farm area, and
Table 2. Principal specifications of the JMA-NHM.
Governing equations Fully compressible non-hydrostatic equations
Horizontal discretization Grid point method
Treatment of advection term Fourth-order flux form, advection corrected
Map projection Lambert conformal projection
Vertical grid series Hybrid z*-coordinate, Ishida (2008)
Topography GTOPO30
Sea-Land distributions National Land Numerical Information
Cloud microphysics Bulk scheme with ice phase predict qv, qc, qr, qi, qs, qg
Cumulus parameterization Kain-Fritsch & Cloud microphysics
Turbulent closure Improved Mellor-Yamada Level 3
Cloud radiation Kitagawa (2000)
Clear sky radiation Yabu et al. (2005)
Clouds in radiation processes Partial condensation scheme; Hara (2008)
Solid water content Force restore method
Surface parameters Proportional distribution by land use area
Surface scheme Beljaars and Holtslag (1991) þUrban canopy scheme (urban grids only)
Fig. 3. Schematic images of the flux circuits. The left image represents the urban canopy scheme used for theurban grids. The right image represents the slab surface scheme used otherwise for the non-urban grids.
February 2012 T. AOYAGI et al. 17

forests decreased. Note that the golf area was re-categorized in the newer version of the land usedata and thus divided from the forest area. We as-sumed that the 3 categories of building lots, road,
and unclassified area were urban surfaces. The bot-tom image in Fig. 4 shows the horizontal distribu-tion of urban surface fraction di¤erences between1976 and 2006. Over almost all of the study area,the urban area increased. The increased area ofurban surface is clearly seen in the northern part ofthe Kanto Plain, in the area surrounding Tokyo’s23 wards, along parts of the coastline, and alongsome of the trunk railway lines and highways. It isnoteworthy that the area fraction of urban surfacesdid not change around central Tokyo. This impliesthat by 1976 the urban surfaces had already beensaturated in central Tokyo.
The 4-km grids that are covered with over 50%of urban surface are referred to as ‘‘urban grids’’in this study. We applied the urban canopy schemeto the urban grids in order to consider the e¤ects ofbuildings on radiation distribution and heat trans-fer. Buildings were assumed to occupy 60% of thebuilding lots and to be regularly arranged in anurban grid with an average height of 10 m. The re-sidual 40% of building lots and the other types ofsurfaces were assumed to be ground area in urbancanyons. The parameters of the ground area wereset by a weighted average by area of the parameterslisted in Table 3, such as wetness, albedo, volumet-ric heat capacity, and thermal conductivity. Table 4shows the parameters of the o‰ce buildings consid-ered in the urban canopy scheme. We applied theslab surface scheme for the other non-urban grids.The parameters for the slab scheme were also setby the area-weighted average values of Table 3.
3.3 Anthropogenic heat load
The heat load due to human activity has one ofthe largest impacts on the surface air temperature.We used the realistic anthropogenic heat distri-butions with daily variations proposed by Senooet al. (2004). This anthropogenic heat model doesnot consider any heat pump e¤ects as more sophis-ticated building energy analysis models (Kikegawaet al. 2003; Ohashi et al. 2007) used to estimate theheat released from buildings do. However, the heattransmitted into the building from the exterior envi-ronment through roofs and walls was released e‰-ciently in the form of heat fluxes from the surfacesowing to insulation layers and air spaces, as listedin Table 4. Although the original dataset was pro-vided with a grid resolution of 10 00 in latitude andlongitude (about 250 m� 300 m), the values wereaveraged with a resolution of 4 km for this study.Anthropogenic heat was loaded only onto the
Fig. 4. The area fraction di¤erences betweenthe 1976 and 2006 land use datasets (top).The increase or decrease of each land usetype in the form of cell (@100 m� 100 m)counts stored in the original NationalLand Numerical Information datasets(middle). The horizontal distribution ofthe increases and decreases of the urbanarea fraction in 4 km� 4 km grids, whichwere used in the numerical simulationsexecuted in this study (bottom).
18 Journal of the Meteorological Society of Japan Vol. 90B

urban grids in the simulation for 2006. Because theanthropogenic heat dataset had been prepared onlyfor the Tokyo Metropolis and 6 prefectures aroundTokyo, the anthropogenic heat was set to 0 for
any urban grids in other prefectures. Figure 5shows the horizontal distributions of the averageanthropogenic heat in summer and winter. Theheat was loaded in the form of sensible and latent
Table 3. Parameter list for each land use type used in the land surface schemes of the JMA-NHM.
Type Wetness* Albedo
Volumetricheat capacity[J K�1 m�3]
Thermalconductivity[m2 s�1]
Roughness*[m]
paddy 0.8/0.3 0.18 1.7� 106 0.7� 10�6 0.3/0.2
farm 0.4/0.3 0.20 1.7� 106 0.5� 10�6 0.3/0.2
forest 0.35/0.3 0.20 1.7� 106 0.5� 10�6 3.0/3.0
wasted 0.1/0.1 0.25 1.6� 106 1.4� 10�6 0.1/0.1
building 0.02/0.02 0.20 2.0� 106 1.5� 10�6 3.0/3.0
road 0.03/0.03 0.25 2.0� 106 2.0� 10�6 1.0/1.0
other 0.1/0.1 0.25 2.0� 106 1.0� 10�6 0.5/0.5
river, lake 0.65/0.65 0.10 4.2� 106 0.8� 10�6 0.05/0.05
coast 0.5/0.5 0.15 2.9� 106 0.74� 10�6 0.1/0.1
sea 1.0/1.0 0.10 1.9� 106 1.3� 10�6 0.001/0.001
golf 0.35/0.25 0.15 1.8� 106 0.5� 10�6 0.4/0.1
* (summer/winter)
Table 4. Parameters for the o‰ce building materials used in the urban canopy scheme as quoted from ECCJ (2005).
MaterialThickness
[m]
Volumetricheat capacity[J m�3 K�1]
Thermalconductivity[W m�1 K�1]
Lightweight concrete 0.06 1.607� 106 0.779
Polystyrene board 0.025 3.516� 104 0.037
Asphalt 0.01 9.209� 105 0.11
Roof Ordinary concrete 0.15 1.934� 106 1.395
Air space 0.01 1.19� 103*1 0.0241*2
Plasterboard 0.009 1.633� 106 0.791
Asbestos acoustic board 0.012 2.512� 105 0.064
Tile 0.008 2.009� 106 1.279
Mortar 0.02 1.591� 106 1.512
Wall Ordinary concrete 0.15 1.934� 106 1.395
Air space 0.01 1.19� 103 0.0241
Plasterboard 0.012 1.633� 106 0.791
*1estimated from the density and constant pressure specific heat of air at 25�C.*2value for air at 0�C.
February 2012 T. AOYAGI et al. 19

Fig. 5. Horizontal distributions of the seasonal averaged anthropogenic heat in the form of sensible heat(top) and latent heat (middle). As an example, the bottom plots represent the time variations of anthropo-genic heat added to the Tokyo grid.
20 Journal of the Meteorological Society of Japan Vol. 90B
heat fluxes. It can be seen that anthropogenic heatis concentrated around central Tokyo. The amountof heat in that area is 10 W m�2 larger in winterthan in summer. The unique daily variation wasconsidered at each urban grid. As an example, thebottom plots of Fig. 5 show time series of theanthropogenic heat at the Tokyo grid.
3.4 The building aspect ratio
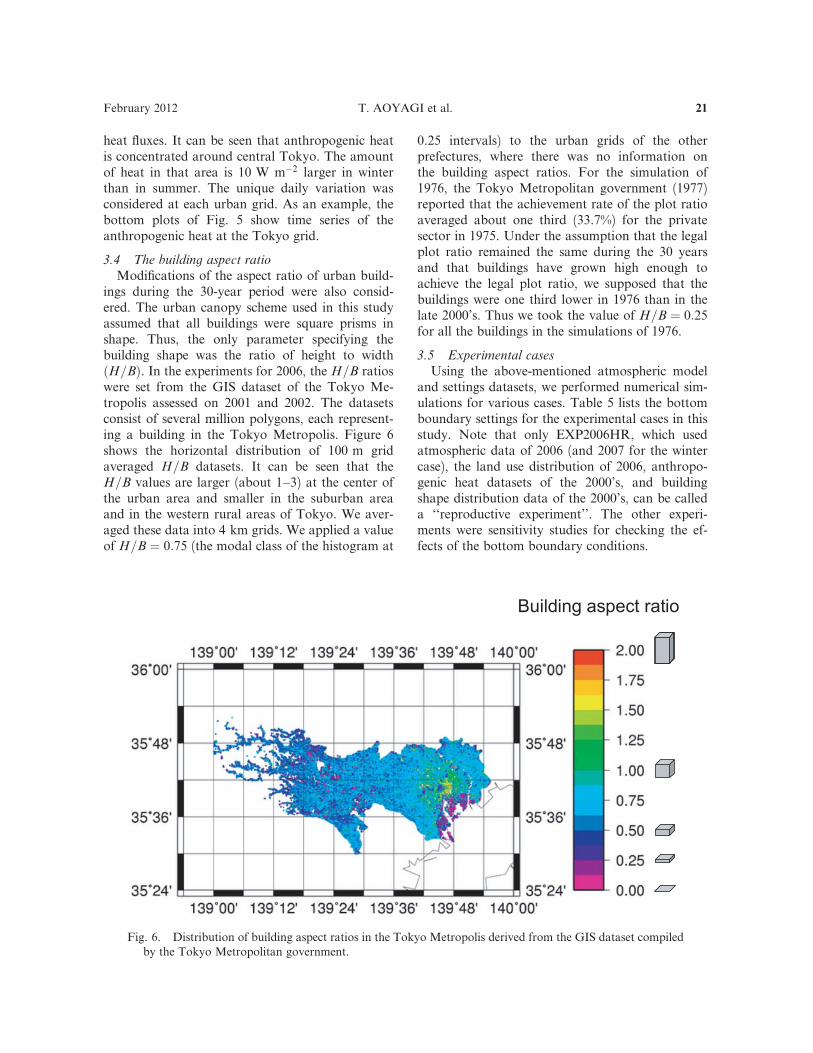
Modifications of the aspect ratio of urban build-ings during the 30-year period were also consid-ered. The urban canopy scheme used in this studyassumed that all buildings were square prisms inshape. Thus, the only parameter specifying thebuilding shape was the ratio of height to widthðH=BÞ. In the experiments for 2006, the H=B ratioswere set from the GIS dataset of the Tokyo Me-tropolis assessed on 2001 and 2002. The datasetsconsist of several million polygons, each represent-ing a building in the Tokyo Metropolis. Figure 6shows the horizontal distribution of 100 m gridaveraged H=B datasets. It can be seen that theH=B values are larger (about 1–3) at the center ofthe urban area and smaller in the suburban areaand in the western rural areas of Tokyo. We aver-aged these data into 4 km grids. We applied a valueof H=B ¼ 0:75 (the modal class of the histogram at
0.25 intervals) to the urban grids of the otherprefectures, where there was no information onthe building aspect ratios. For the simulation of1976, the Tokyo Metropolitan government (1977)reported that the achievement rate of the plot ratioaveraged about one third (33.7%) for the privatesector in 1975. Under the assumption that the legalplot ratio remained the same during the 30 yearsand that buildings have grown high enough toachieve the legal plot ratio, we supposed that thebuildings were one third lower in 1976 than in thelate 2000’s. Thus we took the value of H=B ¼ 0:25for all the buildings in the simulations of 1976.
3.5 Experimental cases
Using the above-mentioned atmospheric modeland settings datasets, we performed numerical sim-ulations for various cases. Table 5 lists the bottomboundary settings for the experimental cases in thisstudy. Note that only EXP2006HR, which usedatmospheric data of 2006 (and 2007 for the wintercase), the land use distribution of 2006, anthropo-genic heat datasets of the 2000’s, and buildingshape distribution data of the 2000’s, can be calleda ‘‘reproductive experiment’’. The other experi-ments were sensitivity studies for checking the ef-fects of the bottom boundary conditions.
Fig. 6. Distribution of building aspect ratios in the Tokyo Metropolis derived from the GIS dataset compiledby the Tokyo Metropolitan government.
February 2012 T. AOYAGI et al. 21

4. Results
4.1 Overall e¤ects
The upper panels of Fig. 7 show the di¤erentialsof the surface air temperature averaged over 2months between experiments EXP2006HR andEXP1976. Warming biases over almost the entireKanto-Koshin area can be seen in association withthe e¤ects of land use change, anthropogenic heatload, and the increased building height. The posi-tive bias was smaller along the coast and largeraround the Tokyo Metropolitan area and in theinland urban area. Although the situations weresimilar in both summer and winter, the biases werelarger in winter than in summer.
To determine the reproducibility of the real tem-perature trends over the 30-year period (Fig. 1), weexamined the bottom plots in Fig. 7, which showscatter diagrams between the observational trendsand the di¤erentials (EXP2006HR-EXP1976) atthe grid point where the corresponding station lies.A rough one-to-one relationship can be seen be-tween them, although some points (Tokyo andTakada) deviate by quite a lot from the rest of thepopulation. The correlation coe‰cients were 0.294with a significance level of 90% for the summercase and 0.444 with a significance level of 99% forthe winter case. The y-intercept around 1.0�C/30years can be recognized as the trend without urban-ization e¤ects, that is, the global warming trend.This estimated value is consistent with the tempera-ture trend of approximately 0.3�C per decade in theNorthern Hemisphere for 1979–2005 reported bythe IPCC (2007).
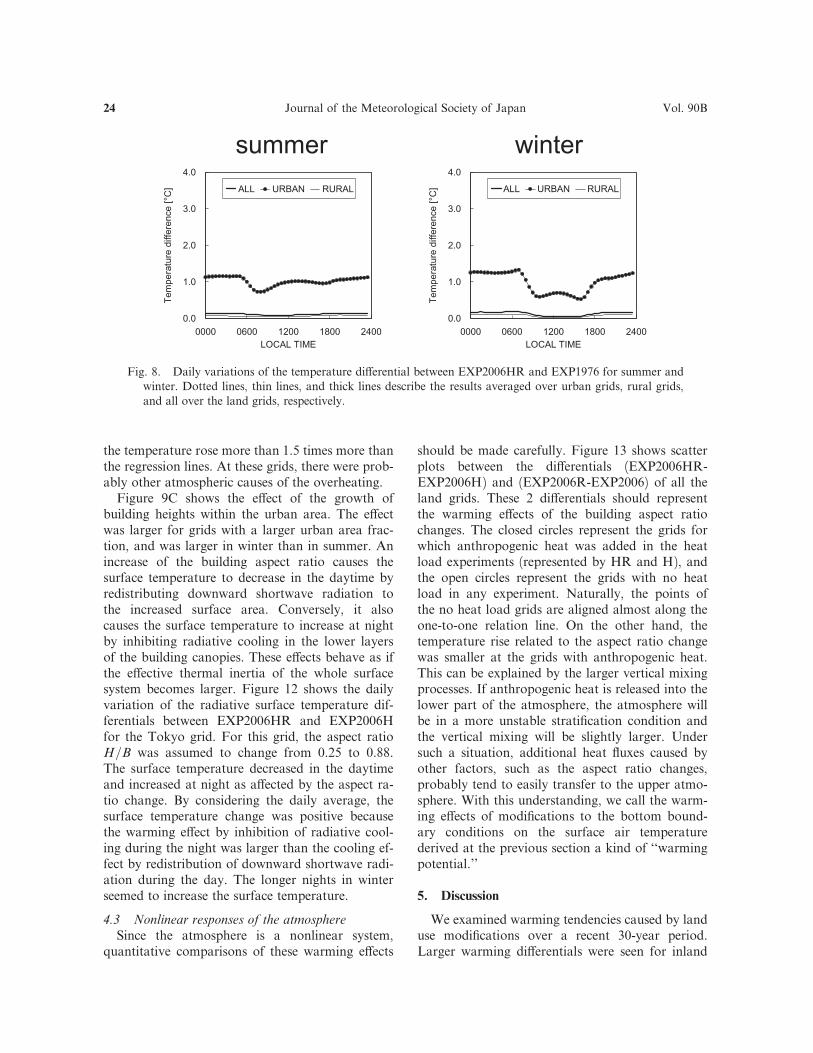
Figure 8 shows the daily variation of temperaturedi¤erences between EXP2006HR and EXP1976.Spatial averaging among all of the urban gridswas performed in both experiments. A smaller tem-perature rise in the daytime and a larger one during
the night, which is the same tendency as that ofthe observational trends (Fig. 2C), can be seen. Themagnitude relation of the diurnal range (i.e., thewinter case is larger than the summer case) andthe magnitude itself are well reproduced if Fig. 2Cis considered to be typical of daily variations af-fected by urbanization.
4.2 Factor analyses
As mentioned in section 3.2, we performed addi-tional experiments to identify how each factora¤ects the warming trends. The di¤erentials of 2months’ average temperatures are shown inFig. 9. The di¤erentials are A) EXP2006-EXP1976,B) EXP2006H-EXP2006, and C) EXP2006HR-EXP2006H, which represent the warming e¤ectsby the decrease of vegetation, the addition ofanthropogenic heat, and the growth of buildingheights, respectively. Figure 10 shows the dailyvariation of the di¤erentials averaged over all theurban grids for 2006.
The warming e¤ect due to land use change, thatis, area fraction changes, was larger in the area sur-rounding central Tokyo. The e¤ect was also largerin inland urban areas. These areas experienced sim-ilar land use changes, namely, large decreases in thevegetation fractions, replaced by urban surfaces.Thus, the warming e¤ect in the daytime can beexplained by the well-known Bowen ratio e¤ect.Along with vegetation decrease (the growth of ur-banization), the latent heat fluxes from the surfacesbecome smaller and instead the sensible heat fluxesbecome larger. The larger sensible heat flux warmsup the surface air. From the daily variation of theland use change e¤ect (the lines with closed circlesin Fig. 10), the variation seems to coincide withthe movement of the sun during the day. This syn-chronous variation with the movement of the sunsupports the idea that the temperature rise was
Table 5. List of the experiments performed for this study. The last 3 experiments were sensitivity studies.
EXP. NAMELand use
informationAnthropogenicheat release
Building aspect ratioHeight :Width
EXP1976 1976 Not Considered 1 :4
EXP2006HR 2006 Considered 3 :4*1
EXP2006 2006 Not Considered 1 :4
EXP2006H 2006 Considered 1 :4
EXP2006R 2006 Not Considered 3 :4*1
*1Aspect ratios in the Tokyo Metropolis were determined from the GIS dataset.
22 Journal of the Meteorological Society of Japan Vol. 90B

caused by the Bowen ratio e¤ect. The result showsthe point where the Bowen ratio e¤ect was larger inthe moist summer than in the dry winter. The figurealso shows slight warming di¤erentials during thenight. Increased urban area in place of vegetationintrinsically led to more buildings, which resultedin the slight nighttime warming by inhibition ofradiative cooling.
Figure 9B shows the horizontal distribution ofthe di¤erentials of EXP2006H-EXP2006, repre-senting the anthropogenic heat e¤ect on the warm-ing trend. Not surprisingly, the warming area waslimited to around the area where anthropogenicheat was released. The warming rate in winter
was around 2�C, and was larger than in summer(around 1�C). Figure 11 shows a scatter plot withregression lines between the loaded heat amountsversus temperature increases at the urban grids.The heating e‰ciency was obviously larger inwinter. There are 2 possible causes: the amount ofanthropogenic heat was originally larger in winter,or the e¤ect of heat release tended to be strongerin winter when the average height of the atmo-spheric boundary layer is lower and when a stablestratified surface layer is often formed. Some over-heated grids where the rate of temperature rise wasmuch larger than the regression lines can be seen inFig. 11. The closed circles represent grids at which
Fig. 7. Di¤erentials of the averaged surface air temperature between the simulations of EXP2006HR andEXP1976. The bottom scatter plots show the correlations between the observed trends and the temperaturedi¤erentials at the corresponding grids of the AMeDAS stations.
February 2012 T. AOYAGI et al. 23
the temperature rose more than 1.5 times more thanthe regression lines. At these grids, there were prob-ably other atmospheric causes of the overheating.
Figure 9C shows the e¤ect of the growth ofbuilding heights within the urban area. The e¤ectwas larger for grids with a larger urban area frac-tion, and was larger in winter than in summer. Anincrease of the building aspect ratio causes thesurface temperature to decrease in the daytime byredistributing downward shortwave radiation tothe increased surface area. Conversely, it alsocauses the surface temperature to increase at nightby inhibiting radiative cooling in the lower layersof the building canopies. These e¤ects behave as ifthe e¤ective thermal inertia of the whole surfacesystem becomes larger. Figure 12 shows the dailyvariation of the radiative surface temperature dif-ferentials between EXP2006HR and EXP2006Hfor the Tokyo grid. For this grid, the aspect ratioH=B was assumed to change from 0.25 to 0.88.The surface temperature decreased in the daytimeand increased at night as a¤ected by the aspect ra-tio change. By considering the daily average, thesurface temperature change was positive becausethe warming e¤ect by inhibition of radiative cool-ing during the night was larger than the cooling ef-fect by redistribution of downward shortwave radi-ation during the day. The longer nights in winterseemed to increase the surface temperature.
4.3 Nonlinear responses of the atmosphere
Since the atmosphere is a nonlinear system,quantitative comparisons of these warming e¤ects
should be made carefully. Figure 13 shows scatterplots between the di¤erentials (EXP2006HR-EXP2006H) and (EXP2006R-EXP2006) of all theland grids. These 2 di¤erentials should representthe warming e¤ects of the building aspect ratiochanges. The closed circles represent the grids forwhich anthropogenic heat was added in the heatload experiments (represented by HR and H), andthe open circles represent the grids with no heatload in any experiment. Naturally, the points ofthe no heat load grids are aligned almost along theone-to-one relation line. On the other hand, thetemperature rise related to the aspect ratio changewas smaller at the grids with anthropogenic heat.This can be explained by the larger vertical mixingprocesses. If anthropogenic heat is released into thelower part of the atmosphere, the atmosphere willbe in a more unstable stratification condition andthe vertical mixing will be slightly larger. Undersuch a situation, additional heat fluxes caused byother factors, such as the aspect ratio changes,probably tend to easily transfer to the upper atmo-sphere. With this understanding, we call the warm-ing e¤ects of modifications to the bottom bound-ary conditions on the surface air temperaturederived at the previous section a kind of ‘‘warmingpotential.’’
5. Discussion
We examined warming tendencies caused by landuse modifications over a recent 30-year period.Larger warming di¤erentials were seen for inland
Fig. 8. Daily variations of the temperature di¤erential between EXP2006HR and EXP1976 for summer andwinter. Dotted lines, thin lines, and thick lines describe the results averaged over urban grids, rural grids,and all over the land grids, respectively.
24 Journal of the Meteorological Society of Japan Vol. 90B
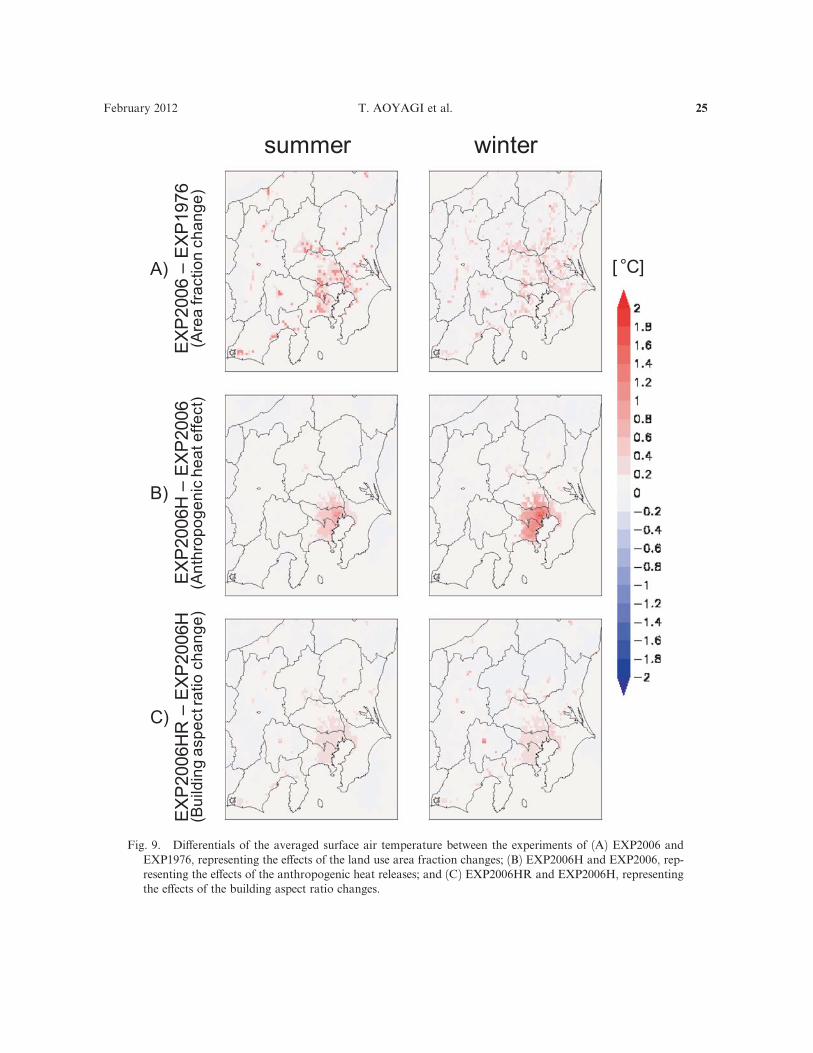
Fig. 9. Di¤erentials of the averaged surface air temperature between the experiments of (A) EXP2006 andEXP1976, representing the e¤ects of the land use area fraction changes; (B) EXP2006H and EXP2006, rep-resenting the e¤ects of the anthropogenic heat releases; and (C) EXP2006HR and EXP2006H, representingthe e¤ects of the building aspect ratio changes.
February 2012 T. AOYAGI et al. 25

grids having large land use changes and strongurban growth, with less warming along the coast-lines. These warming tendencies were qualitativelyin good agreement with the observed warmingtrends. The features of the daily variation, such aslarger warming during the night and smaller warm-ing during the day, were also in good agreementwith observations. The correlation factors, how-ever, showed only weak concordance between thesimulation and the observation.
First, the discrepancy between the analyticalmethods used in the simulation and for the obser-vations should be recognized. The warming resultsfrom the simulation were simple di¤erences be-tween sensitivity experiments that used the sameinitial and lateral boundary atmospheric condi-tions. On the other hand, the warming trends de-rived from the observations were calculated usingregression analysis. As discussed in the sections onfactor analysis and the nonlinear response of the
Fig. 10. Time variations of the temperature di¤erences averaged between the experiments. The di¤erentialswere averaged over all urban grids.
∆ ∆
Fig. 11. Scatter diagrams between the anthropogenic heat amounts added to the urban grids and the temper-ature increases at the grids. The closed circles indicate grids whose temperatures rose more than 150% morethan the regression lines.
26 Journal of the Meteorological Society of Japan Vol. 90B

atmosphere, atmospheric stability a¤ects the verti-cal mixing of heat fluxes. Therefore, there mightbe easily warmed years and insensitive years. We
should keep in mind that the observational trendsinvolve such large-scale interannual variations.
Furthermore, there is probably some room todiscuss the applicability of the base settings listedin Table 3 for representing each type of land use in1976, although the parameters are well optimizedand are used presently for operational predictionsat the JMA. Although we tried to use datasets ofanthropogenic heat and building shapes as real aspossible for the 2006 simulations, the settings ofthose for 1976 are a matter of speculation.
For more precise reproduction, we had to down-scale using various reanalysis datasets, for example,of JRA-25 (Onogi et al. 2007), as initial and lateralboundary conditions and had to perform numericalintegrations over several decades. As no release ofanthropogenic heat was assumed in the 1976 study,the e¤ects of anthropogenic heat were probablyoverestimated. The considerable overestimation forTokyo seemed to be caused by overestimation ofthe anthropogenic heat e¤ect. This can be ex-plained by the larger discrepancy in the wintercase. We assumed that there was no anthropogenicheat in 1976, but there already could have been acertain amount of heat loaded in a megacity suchas Tokyo. On the other hand, the overestimationat Takada in the summer case seemed to be causedby the land use e¤ect. This can be explained by
∆
Fig. 12. Di¤erences in radiative surface tem-peratures between the experiments ofEXP2006HR and EXP2006H for the To-kyo grid. The radiative surface temperaturewas estimated from the surface tempera-tures of the roofs, walls, and the ground asdefined in the urban canopy scheme. Thedotted and solid lines represent the summerand winter cases, respectively.
∆ ∆
∆ ∆
Fig. 13. Scatter plots between the temperature di¤erentials of (EXP2006HR-EXP2006H) and (EXP2006R-EXP2006). These di¤erentials both represent the warming e¤ects of the building aspect ratio changes.Open circles are the grids without any anthropogenic heat in the simulations. Closed circles are the gridsonto which anthropogenic heat was loaded.
February 2012 T. AOYAGI et al. 27

the fact that discrepancy from the observed trendwas only observed in the summer case. Actually,the Takada meteorological observatory has largerpremises than other typical observatories, withmany trees along with a nearby stream, althoughit is surrounded by urban land. Such a local envi-ronment could be a cause of the large di¤erencebetween the simulation and the observation. Thiscould be a possible limitation of this study.
The area fraction changes of the land use catego-ries over the 30-year period showed a positive im-pact on the surface air temperature. The warminge¤ect seemed to be mainly caused by the decreaseof vegetation. This could be explained by the well-known Bowen ratio e¤ect. The simulations con-firmed that the Bowen ratio e¤ect is larger in amoist and sunny summer than in a dry winter withweak sunshine. From this analogy, this kind ofwarming e¤ect should be larger in western Japan,where it is humid, than in drier northern Japan.Furthermore, from the aspect of urban planning,the importance of keeping large green spaces is im-plied if we think that Japan will gain more featuresof a humid subtropical climate as global warmingprogresses in the future.
The impact of the anthropogenic heat was largerin winter than in summer. The sensitivity of theatmosphere to the input heat load was larger inwinter (Fig. 11). This can be explained by the
inhibition of vertical mixing in the relatively stableatmosphere of winter seasons. However, in thewinter case (Fig. 10), the e¤ect of the anthropo-genic heat load peaked in the evening and thewarming range slightly decreased up through dawneven though the atmosphere must have becomemore stable during these hours. The decrease ofthe heat amount during the night by itself likelyproduced the evening peak. The largest peak in themorning can be explained by the combination ofstable atmospheric conditions and the large heatamounts in that time range.
A proportional relation between the heat releaseand the warming e¤ect can be seen in Fig. 11.There are a number of points, however, that obvi-ously deviate from the average proportion. Thegray squares in Fig. 14 show the grids of these over-heated points (indicated by closed circles in Fig.11). It can be seen that they appear in areas sur-rounding the centers of heat loads. The vectors inthe figure show the direction of the average surfacewind. The contour lines represent the advectionterms of the potential temperature at the lowestatmospheric level, calculated from hourly data andaveraged throughout the seasons. Overall, theurban area had negative heat advection. Theoverheated areas, however, correspond to the less-negative advection areas in both summer andwinter. Considering the average wind field, the
Fig. 14. Horizontal distributions of the overheated grids (closed circles in Fig. 12). The vectors represent the2 months’ averaged vectors of the surface winds at 10 m. The contour lines represent the advection term ofthe potential temperature at the lowest atmospheric level.
28 Journal of the Meteorological Society of Japan Vol. 90B

advection of relatively warm air from the upwindurban area can be one cause of overheating in sum-mer. In winter, the locally larger heat loads in themidwest part of Tokyo, where some bedroom sub-urbs lie along trunk railways, form the less-negativeadvection areas around them, although there existless densely urbanized grids in the upwind area ofthe overheated grids under the northerly prevailingwind.
We arrived at the possibility that the temperaturerise was caused by the increase in the building as-pect ratio from the simulations. The main factorappears to be the temperature rise of the urban sur-faces. The e¤ect of the surface warming during thenight was larger than the e¤ect of surface coolingduring the daytime. The total e¤ect was larger inwinter, when nights are relatively longer, than insummer. From this hypothesis, the e¤ect of theaspect ratio changes should be larger in northernJapan because the nighttime is relatively longerthere than in other areas. The e¤ect should alsobe larger in inland basins where radiative coolingoccurs e¤ectively.
6. Conclusions
By numerical simulations using the JMA-NHM,we studied how much 3 bottom boundary conditionchanges, namely, in land use area fraction, anthro-pogenic heat release, and increased building aspectratio, could explain the warming trends observedat the AMeDAS stations during a 30-year period(1976–2006). Unlike previous sensitivity studies inwhich the simulations were executed under ideal-ized or other typical atmospheric conditions, wetried to determine the warming e¤ects of the landsurface modifications on the average surface air tem-perature under many weather conditions throughlonger-time simulations.
From the di¤erentials between simulations with2 bottom boundary conditions emulating the landsurfaces of 1976 and 2006, the possible sources ofwarming along with the urbanization were deter-mined. The correlation coe‰cients between the si-mulated di¤erentials and the observational trendsat the grids of the AMeDAS stations showed alower correlation (0.294 with a significance levelof 90%) in the summer case and fairly good cor-relation (0.444 with a significance level of 99%) inwinter.
A sensitivity study of land use modification, i.e.,the spread of urban area, showed a warming e¤ecton average, and that the e¤ect was larger in grids
where the land use modification rate was larger.The e¤ects were very small in central Tokyo be-cause the urban area fraction was already saturatedthere by 1976. This e¤ect was larger in summerwhen the Bowen ratio is originally small.
The warming e¤ect of anthropogenic heat wasconcentrated to the central urban area where theheat was mainly loaded. The e¤ect was larger inwinter owing to relatively stable atmospheric con-ditions. Maximum warming was observed in themorning and a secondary peak was seen in the eve-ning if we set the heat to vary realistically withtime.
The increase of the aspect ratio of the buildingsalso had a warming e¤ect on the surface air temper-ature. It was mainly caused by the inhibition of ra-diative cooling during nighttime, and the e¤ect waslarger in winter. The daily variation of this e¤ecthad a single peak in the morning.
Secondarily, the simulations in this study showedthat there would be large discrepancies in the re-sults depending on the settings of the bottomboundary conditions, although the dependency didnot seem to a¤ect the whole atmosphere systemso much. The results of this study illustrate theimportance of more precise land surface settingswhen we assess the environment of the surfacelayer, which is the most important layer for humanactivities.
Acknowledgments
The authors thank Dr. Tsuyoshi Kinouchi of theTokyo Institute of Technology for providing theanthropogenic heat datasets. This work was sup-ported by the Global Environment Research Fund(S-5-3) of the Ministry of the Environment, Japan.This work was partly supported by a Grand-in-Aidfor Scientific Research (B22340141) from the JapanSociety for the Promotion of Science.
References
Beljaars A. C. M., and A. A. M. Holtslag, 1991: Flux pa-rameterization over land surface for atmosphericmodels. J. Appl. Meteor., 30, 327–341.
Adachi S., and F. Kimura, 2010: A factor analysis on thenighttime warming trends in the Kanto area ofJapan. J. Jpn. Study Group Clim. Impact Apll., 28,5–13 (in Japanese).
Aoyagi T., and N. Seino, 2011: A square prism urbancanopy scheme for the NHM and its evaluationon summer conditions in the Tokyo metropolitanarea, Japan. J. Appl. Meteor. Climatol., 50, 1476–1496.
February 2012 T. AOYAGI et al. 29

ECCJ, 2005: Report of survey on the e¤ect of energyconservations to mitigation of heat island phenom-ena. Energy Conservation Center Japan, 266 pp (inJapanese).
Fujibe F., 1994: Long-term falling trends of pressure overthe Kanto Plain as evidence of increasing heatcontent in the lower atmosphere in the daytime ofthe warm season. J. Meteor. Soc. Japan, 72, 785–792.
Fujibe F., 2003: Long-term surface wind changes in theTokyo metropolitan area in the afternoon of sunnydays in the warm season. J. Meteor. Soc. Japan,81, 141–149.
Fujibe F., 2009: Detection of urban warming in recenttemperature trends in Japan. Int. J. Climatol., 29,1811–1822.
Fujibe F., 2010: Urban warming in Japanese cities andits relation to climate change monitoring. Int. J.Climatol., 31, 162–173.
Hara M., H. Kusaka, F. Kimura, and Y. Wakazuki,2010: E¤ect of global climate change on urbanheat island intensity of Tokyo metropolitan area—winter season case—. Nagare, 29, 353–361 (in Jap-anese with English abstract).
Hara T., 2008: Radiation Processes. Separate volume of
annual report of NPD, 54, 133–137 (in Japanese).Ichinose T., K. Shimodozono, and K. Hanaki, 1999:
Impact of anthropogenic heat on urban climate inTokyo. Atmos. Environ., 33, 3897–3909.
Inoue T., and F. Kimura, 2004: Urban e¤ects on low-level clouds around the Tokyo metropolitan areaon clear summer days. Geophys. Res. Lett., 31,L05103, doi:10.1029/2003GL018908.
Inoue T., and F. Kimura, 2007: Numerical experimentson fair-weather clouds forming over the urbanarea in northern Tokyo. SOLA, 3, 125–128.
IPCC, 2007: Climate change 2007: The physical sciencebasis. In contribution of working group I to thefourth assessment report of the IPCC, Solomon S.,Qin D., Manning M., Chen Z., Marquis M.,Averyt K., Tignor M., Miller H. L. (eds). Cam-bridge University Press: New York; 1056 pp.
Ishida J., 2008: The governing equations of the JMA-NHM and the implementation of the hybridterrain following vertical coordinates. Separate
volume of annual report of NPD, 54, 27–43 (inJapanese).
Ishizaki N., and I. Takayabu, 2009: On the warmingevents over Toyama Plain by using NHRCM.SOLA, 5, 129–132.
Kawase H., T. Yoshikane, M. Hara, F. Kimura, T. Ya-sunari, B. Ailikun, H. Ueda, and T. Inoue, 2009:Intermodel variability of future changes in theBaiu rainband estimated by the pseudo globalwarming downscaling method. J. Geophys. Res.,114, D24110, doi:10.1029/2009JD011803.
Kikegawa Y., Y. Genchi, H. Yoshikado, and H. Kondo,2003: Development of a numerical simulation sys-tem toward comprehensive assessments of urbanwarming countermeasures including their impactsupon the urban building’s energy demands. Appl.Energy, 76, 449–466.
Kimura F., and S. Takahashi, 1991: The e¤ects of land-use and anthropogenic heating on the surfacetemperature in the Tokyo metropolitan area: Anumerical experiment. Atmos. Environ., 25B, 155–164.
Kitagawa H., 2000: Radiation Processes. Separate vol-
ume of annual report of NPD, 46, 16–31 (in Japa-nese).
Kusaka H., F. Kimura, H. Hirakuchi, and M. Mizutori,2000: The e¤ects of land-use alteration on thesea breeze and daytime heat island in the Tokyometropolitan area. J. Meteor. Soc. Japan, 78,405–420.
Kusaka H., H. Kondo, Y. Kikegawa, and F. Kimura,2001: A simple single-layer urban canopy modelfor atmospheric models: Comparison with multi-layer and slab models. Bound.-Layer Meteor., 101,329–358.
Kusaka H., and F. Kimura, 2004a: Coupling a single-layer urban canopy model with a simple atmo-spheric model: Impact on urban heat island simu-lation for an idealized case. J. Meteor. Soc, Japan,82, 67–80.
Kusaka H., and F. Kimura, 2004b: Thermal e¤ects ofurban canyon structure on the nocturnal heatisland: Numerical experiment using a mesoscalemodel coupled with an urban canopy model. J.
Appl. Meteor., 43, 1899–1910.Kusaka H., T. Takata, and Y. Takane, 2009: Reproduci-
bility of regional climate in central Japan using the4-km resolution WRF model. SOLA, 6, 113–116.
Masson V., 2000: A physically-based scheme for theurban energy budget in atmospheric models.Bound.-Layer Meteor., 94, 357–397.
Ohashi Y., Y. Genchi, H. Kondo, Y. Kikegawa, and Y.Hirano, 2007: Influence of air-conditioning wasteheat on air temperature in Tokyo during summer:Numerical experiments using an urban canopymodel coupled with a building energy model. J.
Appl. Meteor. Climatol., 46, 66–81.Onogi K., J. Tsutsui, H. Koide, M. Sakamoto, S. Ko-
bayashi, H. Hatsushika, T. Matsumoto, N. Yama-zaki, H. Kamahori, K. Takahashi, S. Kadokura,K. Wada, K. Kato, R. Oyama, T. Ose, N. Man-noji, and R. Taira, 2007: The JRA-25 reanalysis.J. Meteor. Soc. Japan, 85, 369–432.
Saito K., J. Ishida, K. Aranami, T. Hara, T. Segawa, M.Narita, and Y. Honda, 2007: Nonhydrostatic at-mospheric models and operational development atJMA. J. Meteor. Soc. Japan, 85B, 271–304.
30 Journal of the Meteorological Society of Japan Vol. 90B

Senoo H., M. Kanda, T. Kinouchi, and A. Hagishima,2004: Estimation of anthropogenic heat and vaporemission, and the impact on local meteorology.Ann. J. Hydr. Eng., JSCE, 48, 160–174 (in Japa-nese with English abstract).
Tokyo Metropolitan government, 1977: A summary of
urban planning 1976 (Toshi Keikaku Gaiyou1976). Tokyo Metropolitan government, 336 pp.(in Japanese).
Yabu S., S. Murai, and H. Kitagawa, 2005: Clear-skyradiation scheme. Separate volume of annual report
of NPD, 51, 53–64 (in Japanese).
February 2012 T. AOYAGI et al. 31