nureg/ia-0124, 'international agreement report, assessment ... · relap5/mod2 cycle 36.04 of a...
TRANSCRIPT
NUREG/IA-0124ICSP-JC-SPR-R
InternationalAgreement Report
Assessment of RELAP5/MOD2Against a Pressurizer SprayValve Inadverted Fully OpeningTransient and Recovery byNatural Circulation inJose Cabrera Nuclear StationPrepared byR. Arroyo, L. Rebollo
Union Electrica Fenosac/Capitan Haya 5328020 MadridSpain
Office of Nuclear Regulatory ResearchU.S. Nuclear Regulatory CommissionWashington, DC 20555
June 1993
Prepared as part ofThe Agreement on Research Participation and Technical Exchangeunder the International Thermal-Hydraulic Code Assessmentand Application Program (ICAP)
Published byU.S. Nuclear Regulatory Commission

NOTICE
This report was prepared under an international cooperativeagreement for the exchange of technical information. Neitherthe United States Government nor any agency thereof, or any oftheir employees, makes any warranty, expressed or implied, orassumes any legal liability or responsibility for any third party'suse, or the results of such use, of any information, apparatus pro-duct or process disclosed in this report, or represents that its useby such third party would not infringe privately owned rights.
Available from
Superintendent of DocumentsU.S. Government Printing Office
P.O. Box 37082Washington,"D.C. 20013-7082
and
National Technical Information ServiceSpringfield, VA 22161

NUREG/IA-0124ICSP-JC-SPR-R
InternationalAgreement Report
Assessment of RELAP5/MOD2Against a Pressurizer SprayValve Inadverted Fully OpeningTransient and Recovery byNatural Circulation inJose Cabrera Nuclear StationPrepared byR. Arroyo, L Rebollo
Union Electrica Fenosac/Capitan Haya 5328020 MadridSpain
Office of Nuclear Regulatory ResearchU.S. Nuclear Regulatory CommissionWashington, DC 20555
June 1993
Prepared as part of.-
The Agreement on Research Participation and Technical ExOtangeunder the Internatbonal Thermal-Hydraulic Code Assessmentand AppLication Progra (iCAP)
Published byU.S. Nuclear Regulatory Commission
NOTICE
This report documents work performed under the sponsorship of the Consejo De
Seguridad Nuclear of Spain. The information in this report has been provided
to the USNRC under the terms of an information exchange agreement between the
United States and Spain (Technical Exchange and Cooperation-Agreement Between
the United States Nuclear Regulatory Commission and the Consejo De Seguridad
Nuclear of Spain in the field of reactor safety research and development,
November 1985). Spain has consented to the publication of this report as a
USNRC document in order that it may receive the widest possible circulation
among the reactor safety community. Neither the United'States Government nor
Spain or any agency thereof, or any of their employees, makes any warranty,
expressed or implied, or assumes any legal liability of responsibility for
any third party's use, or the results of such use, or any information,
apparatus, product or process disclosed in this report, or represents that
its use by such third party would not infringe privately owned rights.

ABSTRACT
This document presents the comparison between the
simulation results and the plant measurements of a real event
that took place in JOSE CABRERA nuclear power plant in August
3 0 th, 1984. The event was originated by the total, continuous
and inadverted opening of the pressurizer spray valve
PCV-400A.
JOSE CABRERA power plant is a single loop Westinghouse
PWR belonging to UNION ELECTRICA FENOSA, S.A. (UNION FENOSA),
an Spanish utility which participates in the International
Code Assessment and Applications Program (ICAP) as a member of
UNIDAD ELECTRICA, S.A. (UNESA). This is the second of its
two contributions to the Program: the first one was an
application case and this is an assessment one.
The simulation has been performed using the RELAPS/MOD2
cycle 36.04 code, running on a CDC CYBER 180/830 computer
under NOS 2.5 operating system.
The main phenomena have been calculated correctly and
some conclusions about the 3D characteristics of the
condensation due to the spray and its simulation with a ID
tool have been got.

EXECUTIVE SUMMARY
This work shows the results of the analysis with
RELAP5/MOD2 cycle 36.04 of a real event that took place in
JOSE CABRERA nuclear power plant in August 3 0 th, 1984. The
-event had its origen in a total, continuous and inadverted
opening of the pressurizer spray valve PCV-400A. This is the
second contribution of UNION ELECTRICA FENOSA, S.A. (UNION
FENOSA) to ICAP.
JOSE CABRERA nuclear plant is a single loop Westinghouse
PWR. A general purpose nodalization of JOSE CABRERA for RELAP5
has been used. This nodalization is being widely used in
thermal-hydraulic applications and has given good results.
The inadverted opening of the spray valve caused a
reactor coolant system depressurization, producing a reactor
trip. The reactor coolant pump was manually stopped half an
hour later in order to stop the spray flow. Afterwards, the
cooling of the primary system was due to natural circulation.
The safety injection system (9.7 MPa shut-off pressure) did
not introduce water into the primary circuit because the RCS
pressure was stabilized at 10.0 MPa.
The calculation purpose was not to study the control
systems response, because they worked mainly in their manual
mode, but to analyse the main thermal-hydraulic phenomena that
appeared during the transient: steam condensation in the
pressurizer due to the continuous spray flow and corresponding
-ii-

RCS depressurization, primary " cooling from the
generator, reactor coolant pump trip effect,
circulation, etc.
steam
natural
This objective was reached, the main phenomena were
reproduced in the simulation and the discrepancies were
justified. Main results of pressurizer separated effects
experiments (MIT and NEPTUNUS) have been confirmed. In
general, RELAP5/MOD2 code has performed properly and the host
computer, CDC CYBER 180/830 has run well with the code with a
good CPU time to real time ratio.
-iii-

LIST OF TABLES
TABLE 4.1
TABLE 5.1
TABLE 5.2
TABLE 5.3
TABLE 6.1
TABLE 6.2
TABLE 7.1
RELAP5/MOD2 model description (nodalization).
Stabilization system actuation logic.
Steady state results at nominal conditions.
Steady state results at 96%.
Sequence of events.
Variables identification in the transient figures.
Run statistics.
-iv-
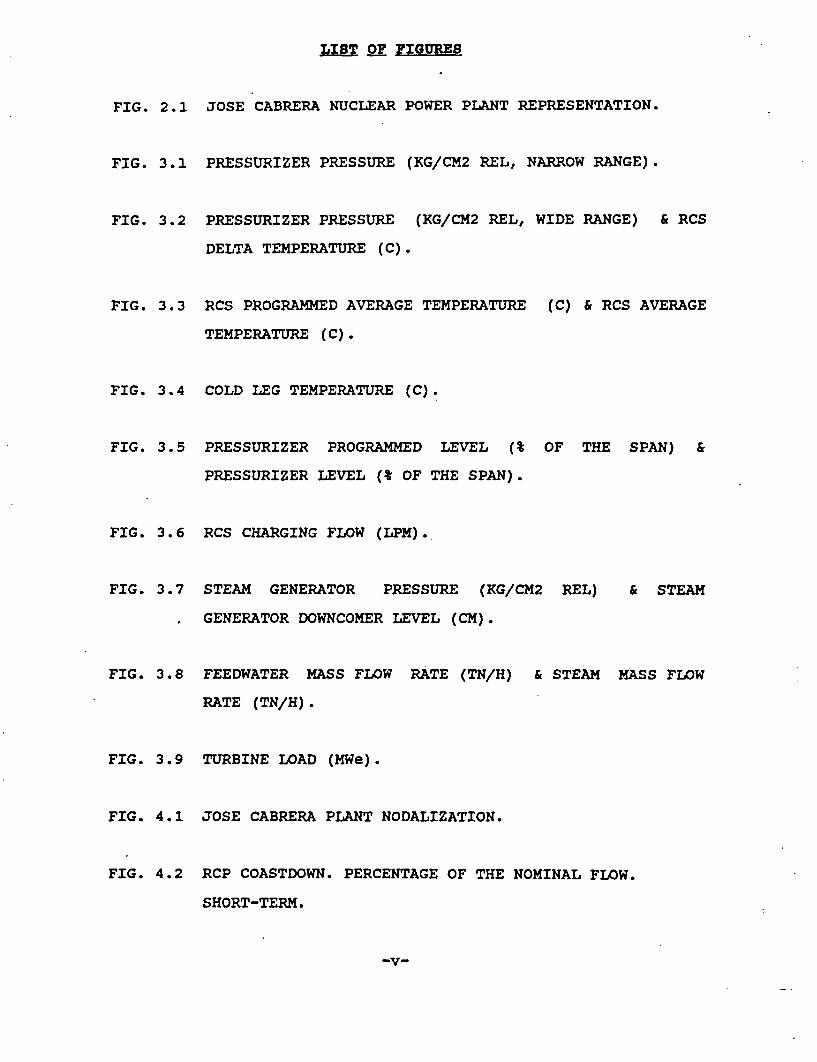
FIG. 2.1
FIG. 3.1
FIG. 3.2
FIG. 3.3
FIG. 3.4
FIG. 3.5
FIG. 3.6
FIG. 3.7
FIG. 3.8
FIG. 3.9
FIG. 4.1
FIG. 4.2
LIo OF FIGURES
JOSE CABRERA NUCLEAR POWER PLANT REPRESENTATION.
PRESSURIZER PRESSURE (KG/CM2 REL, NARROW RANGE).
PRESSURIZER PRESSURE (KG/CM2 REL, WIDE RANGE) & RCS
DELTA TEMPERATURE (C).
RCS PROGRAMMED AVERAGE TEMPERATURE (C) & RCS AVERAGE
TEMPERATURE (C).
COLD LEG TEMPERATURE (C).
PRESSURIZER PROGRAMMED LEVEL (% OF THE SPAN) &
PRESSURIZER LEVEL (% OF THE SPAN).
RCS CHARGING FLOW (LPM).
STEAM GENERATOR PRESSURE (KG/CM2 REL) & STEAM
GENERATOR DOWNCOMER LEVEL (CM).
FEEDWATER MASS FLOW RATE (TN/H) & STEAM MASS FLOW
RATE (TN/H).
TURBINE LOAD (MWe).
JOSE CABRERA PLANT NODALIZATION.
RCP COASTDOWN. PERCENTAGE OF THE NOMINAL FLOW.
SHORT-TERM.

o_1 or ZGZun (CONT.)
FIG. 4.3 RCP COASTDOWN. PERCENTAGE OF THE NOMINAL FLOW.
LONG-TERM.
FIG. 4.4 AD-HOC REDUCED NODALIZATION.
FIG. 6.1 PRESSURIZER PRESSURE (KG/CM2 REL).
FIG. 6.2 RCS AVERAGE TEMPERATURE (C).
FIG. 6.3 COLD LEG TEMPERATURE (C).
FIG. 6.4 RCS DELTA TEMPERATURE (C).
FIG. 6.5 PRESSURIZER LEVEL (% OF SPAN).
FIG. 6.6 STEAM GENERATOR PRESSURE (KG/CM2 REL).
FIG. 6.7 STEAM GENERATOR DOWNCOMER LEVEL (CM).
FIG. 6.8 FEEDWATER MASS FLOW RATE (KG/S).
FIG. 6.9 STEAM MASS FLOW RATE (KG/S).
FIG. 6.10 CORE POWER (W).
FIG. 6.11 SPRAY MASS FLOW RATE (KG/S).
FIG. 6.12 PRESSURIZER HEATERS POWER (W).
-vi-

LIST aF FIGURES (CONT.)
FIG. 6.13 RCS & STEAM GENERATOR TEMPERATURES (K).
FIG. 6.14 LIQUID & SATURATION CORE EXIT TEMPERATURE (K).
FIG. 6.15 AVERAGE CHANNEL CLAD TEMPERATURE (K).
FIG. 6.16 RCS MASS FLOW RATE (KG/S).
FIG. 6.17 PRESSURIZER TEMPERATURES - NODE 1 (K).
FIG. 6.18 PRESSURIZER TEMPERATURES - NODE 2 (K).
FIG. 6.19 PRESSURIZER TEMPERATURES - NODE 3 (K).
FIG. 6.20 PRESSURIZER TEMPERATURES - NODE 4 (K).
FIG. 6.21 PRESSURIZER TEMPERATURES - NODE 5 (K).
FIG. 6.22 PRESSURIZER TEMPERATURES - NODE 6 (K).
FIG. 6.23 PRESSURIZER TEMPERATURES - NODE 7 (K).
FIG. 6.24 PRESSURIZER TEMPERATURES - NODE 8 (K).
FIG. 6.25 PRESSURIZER VOID FRACTION - NODES 5 & 6.
FIG. 7.1 CPU TIME (S).
-vii-


CONTENTS
ABSTRACT ................................................. 1
EXECUTIVE SUMMARY ........................................ i
LIST OF TABLES ......................... e.................. iv
LIST OF FIGURES .............. oo...... o..... ................ v
1.- INTRODUCTION ... o................. o ....... o ... o.... o...... 1
2.- NUCLEAR STATION DESCRIPTION .......................... 3
3.- EVENT DESCRIPTION ................... o ............ 6
4.- CODE INPUT MODEL DESCRIPTION ......................... 10
4.1 Primary system nodalization ..................... o11
4.2 Secondary system nodalization .................... 14
4.3 Trips and control variables ..................... 19
4.4 Simplifications ............................. o .... 21
5.- STEADY STATE CALCULATION ............................. 22
6.- TRANSIENT RESULTS AND COMPARISON WITH PLANT DATA ..... 24
7.- RUN STATISTICS ............ o ...... ...... 388.- CONCLUSIONS .......... ...................... ....... 39
9.- REFERENCES .......... o ... o ...... ............ o .... .. . 43
ADDENDUM A: ASSESSMENT OF RELAP5/MOD2 AGAINST PRESSURIZER
SEPARATED EFFECTS EXPERIMENTS.
ix


FOREWORD
This report has been prepared by Uni6n Electrica Fenosa
in the framework of the ICAP-UNESA Project.
The report represents one of the application calculations
submitted in fulfilment of the bilateral agreement for coo-
peration in thermalhydraulic activities between the Consejo
de Seguridad Nuclear of Spain (CSN) and the United States
Nuclear Regulatory Commission (USNRC) in the form of Spanish
contribution to the International Code Assessment and Appli-
cations Program (ICAP) of the USNRC whose main purpose is
the validation of the TRAC and RELAP system codes.
The Consejo de Seguridad Nuclear has promoted a coordi-
nated Spanish Nuclear Industry effort (ICAP-SPAIN) aiming to
satisfy the requirements of this agreement and to improve
the quality of the technical support groups at the Spanish
Utilities, Spanish Research Establishments, Regulatory Staff
and Engineering Companies, for safety purposes.
This ICAP-SPAIN national program includes agreements
between CSN and each of the following organizations:
- Unidad Elictrica (UNESA)
- Uni6n Iberoamericana de Tecnologla El~ctrica (UITESA)
- Empresa Nacional del Uranio (ENUSA)
- TECNATOM
- EMPRESARIOS AGRUPADOS
- LOFT-ESPARA
The program is executed by 12 working groups and a gener-
ic code review group and is coordinated by the "Comit4 de
Coordinaci'n".. This committee has approved the distribution
of this document for ICAP purposes.
xiD-1/90-MPNV


I.- INTRODUCTION.
The "International Thermal-Hydraulic Code Assessment and
Applications Program (ICAP)" is being developed by some
organizations from several countries coordinated by the U.S.
Nuclear Regulatory Commision' (USNRC). Its purpose is to
obtain a good vision of the USNRC thermal-hydraulic codes
validity over the widest range of possible applications. The
program generic interest derives from the extended diffusion
and use of these computer codes.
The Spanish contributions to ICAP consist of different
calculations, both assessment and application ones, with the
RELAP5/MOD2, TRAC-PFI/MODI and TRAC-BF1 codes. The assessment
cases compare simulations with real data, basically from
commercial operating plants. The application cases study
accidental situations, which prove the main thermal-hydraulic
models of these codes in an exhaustive manner.
UNION ELECTRICA FENOSA, S.A. (UNION FENOSA) participates
in ICAP as a member of UNIDAD ELECTRICA, S.A. (UNESA)
contributing with two calculations: an application case
(ref. 1) and an assessment case.
This report shows the assessment case, in which a real
event in JOSE CABRERA nuclear power plant (NPP), a single-loop
Westinghouse. PWR belonging to UNION FENOSA, is studied. This
event was caused by the total, continuous and inadverted
locked opening of the pressurizer spray valve, producing the
reactor trip. The reactor coolant pump (RCP) was manually

stopped afterwards and this caused the cooling of the primary
system by natural circulation without safety injection into
the primary circuit.
RELAP5/MOD2-cycle 36.04 running on a CDC CYBER 180/830
computer under the NOS 2.5 operating system was used to
analyse the selected plant transient.
The purpose of the calculation was not that of studying
the interphase between the control systems, most of which were
working in manual mode, and the thermohydraulic response of
the plant, but that of reproducing the main event phenomena.
The analysis has been based on the main thermal-hydraulic
phenomena that the event presented: pressurizer steam
condensation and corresponding reactor coolant system (RCS)
depressurization, RCS cooling from the steam generator (SG),
RCP trip effect, natural circulation, etc.
JOSE CABRERA NPP, where the event tooks place, is
described in section 2, and the event itself in section 3.
The model of the plant, used as RELAP5/MOD2 code input deck,
is explained in section 4. The steady state results are
commented in section 5. Section 6 shows the analysis results
and their comparison with available plant data. Section 7
shows some interesting data on computer performance, and,
finally, the main conclusions obtained are summarized in
section 8.
-2-

2.- NUCLEA STThIO DESCRIPTION.
The analysis was done for JOSE CABRERA Nuclear Power
Plant (fig. 2.1), a Westinghouse PWR commercial plant, sited
in Zorita de los Canes (Guadalajara), belonging to UNION
FENOSA, a Spanish utility (ref. 2). The plant had its first
criticallity in 1968 and was the first nuclear station
connected to the Spanish electrical grid.
The Reactor Coolant System (RCS) has only one loop that
includes the cold leg, reactor pressure vessel, hot leg,
pressurizer, steam generator tubes, cross-over leg, and
reactor coolant pump. The Chemical and Volume Control System
(CVCS) as well as the Residual Heat Removal System (RHRS) are
also connected to the reactor coolant loop.
Nominal reactor power of 510 Mwt is generated by the
reactor core that has a configuration of 69 fuel assemblies
(14 x 14) with 2.40 m of active length. Reload fuel has an
average enrichment of 3.60% in U-235. The plant nominal
output electrical power is 160 Mwe with a frequency of 50 Hz.
The Emergency Core Cooling System (ECCS) connects
directly to the downcomer of the reactor vessel and includes
one accumulator, two intermediate pressure safety injection
pumps taking borated water from the reload water storage tank,
and two recirculation pumps and a jet pump taking water from
the containment sump and feeding the injection pumps in the
recirculation phase of a loss of coolant accident (LOCA).
There is one single steam generator that links thermally
-3-

the primary and secondary systems. It includes the downcomer
annulus, riser boiling chamber, separators and dryers.
In the secondary side the typical balance of plant (BOP)
components are included (two 50% main feedwater pumps, steam
line, safety (4) and steam-dump (3) valves, main steam
isolation valve, turbine trip valves (2), main steam control
valves (4), high (1) and low (1) pressure turbines, condenser,
heaters (4), etc).
Main feedwater comes directly into the upper part of the
downcomer without passing through any preheater section inside
the steam generator, being previously heated through the
heaters installed between the condenser and the steam
generator. The circulation ratio in the secondary side of the
steam generator is 1.96 at full power.
The SG auxiliary-emergency feedwater system includes one
turbine driven and two motor operated pumps. Both subsystems
take cold demineralized water from a tank and start their
operation automatically. The turbine driven subsystem (AFWS)
injects into the upper part of the downcomer, injection
requiring the turbine operator intervention, by opening an
isolation valve from the Control Room. The motor operated
subsystem (EFWS) injects directly into the lower part of the
SG tubes, no operator action being necessary to allow the
subsystem injection. For this subsystem there is also the
possibility of an optional injection into the upper part of
the downcomer once the operator lines up properly the system.
The plant operates normally in automatic mode under the
-4-

influence of the reactor control system that maintains the
programmed coolant average temperature in the primary system
by acting on the control bank B position.
The RCS pressure is controlled by the pressurizer
pressure control system which acts on the PORV's, spray valve
and heaters. The pressurizer level control system follows a
level program as a function of the average temperature in the
RCS by acting on the speed of one of the two charging pumps.
The steam generator level is controlled in operation by
acting on the feedwater control valve based on the level error
for the specified level setpoint, the feedwater flow and the
steam flow.
Finally, there is a system to control the primary average
temperature after the turbine trip by opening the steam-dump
valves to the atmosphere (2) and to the condenser (1). This
system can also work under pressure control by following a
manually selected steam generator pressure setpoint.
The safety of the plant is guaranteed by the Reactor
Protection System and the Emergency Safety Features.
-5-

3.- EVET DESCRIPTION.
The event that was selected to be analysed and simulated
with the RELAP5/MOD2 code is a reactor trip in JOSE CABRERA
NPP, which happened at 13:40 h, August 30th, 1984. It was
caused by the total, continuous and inadverted opening of the
pressurizer spray valve PCV-400A that remained locked at its
fully open position for more than half an hour. Until the
beginning of the transient, the plant had been operating under
automatic control with all the main parameters within normal
ranges, at 96% thermal power.
The valve opening fault was not due to a control failure
by the pressurizer pressure control system, but to a failure
in its driving mechanism. At that time the only indication of
the valve position in the Control Room, in percentage of
demanding opening, came from the control system. Therefore,
the indication the reactor operator could see during the
depressurization event was 0% opening, preventing the correct
diagnosis of the event. As a result of the evaluation by the
NPP technical support center and in order to solve this
problem in the future, a valve PCV-400A stem actual position
indication was installed in the Control Room. This solution
was considered acceptable by the Consejo de Seguridad Nuclear
(Spanish regulatory commission).
When the primary pressure decrease following the spray
valve opening was observed, the turbine operator tried to
control it by means of a manual turbine load reduction. The
pressurizer relief and spray valves indications were also
checked showing 0% opening demanded by the pressurizer
-6-

pressure control system.
The pressurizer level control system was set into its
manual control mode, and the second charging pump was manually
started to try to repressurize the primary circuit by partial
refilling of the pressurizer.
As the RCS pressure went on decreasing, the low pressure
reactor trip was produced at the programmed setpoint, so
inducing a simultaneous turbine trip. After the turbine trip,
the steam release through the steam-dump valves, which were
working in their temperature control mode trying to reach the
RCS no-load average temperature (275.0 "C), caused the primary
pressure to go on decreasing very quickly. Therefore, the
steam-dump control system was set into its pressure control
mode by the reactor operator, and was manually controlled from
that moment on.
The safety injection signal was automatically activated.
From then on, the operation team continuously monitored the
intermediate pressure safety injection pumps performance
parameters, specially the driving motors currents and the ECCS
lines flow. The ECCS flow indication was always 0.0 m3 /h, and
the current of the motors was maintained at the normal value
that is measured during the pumps maintenance monthly tests
with the pumps working in the recirculation mode from/to the
borated water tank. This fact demonstrated that cold water
was never introduced into the vessel. This was also
consistent with the fact that the minimum pressurizer pressure
measured during the event was, according to the wide range
recorder, 100.0 Kg/cm2 (rel.), for a safety injection nominal
-7-

shut-off pressure of 99.0 Kg/cm2 (rel.).
When an auxiliar operator could go into the containment
building, once its normal conditions were checked, he
confirmed that the valve PCV-400A was fully open. A little
bit later, and because it was impossible to close the valve
either locally or from the Control Room, the RCP was tripped
to finish the depressurization, by stopping the spray flow.
By this operation, around half an hour after the beginning of
the transient, the ECCS injection of cold borated water into
the vessel downcomer was just prevented avoiding the potential
risk of pressurized thermal shock to the reactor vessel. Some
time later, the auxiliar operator could manually close this
valve locally.
Throughout the incident, the operation team supervised
the core behaviour by reading the core exit thermocouples
temperatures, in order to control the subcooling margin that
was always higher than 20.0 "C.
The minimum measured levels were 25% for the pressurizer
and -80.0 cm for the steam generator.
About 40 minutes after the RCS depressurization was
initiated, the event was already solved and the pressure was
being recovered with natural circulation in the RCS, the fan
coolers of the vessel head functioning, without any
pressurizer level symptom of a steam bubble formation in the
vessel head.
The lack of a process computer at the plant prevented
-8-

knowing exactly the sequence of the event and the precise
chronology of the operators intervention. Both had to be
deduced from the several records and graphics available in the
trip report, within the limits associated with their scales,
speeds and precisions. In spite of these difficulties, this
transient was selected as an assessment case because of its
duration and the amplitude of the variation of the main
thermal-hydraulic plant variables.
Figures 3.1 to 3.9 show the available plant records, on
which this validation study is based. More information about
this incident can be found in references 3 and 4.
-9-
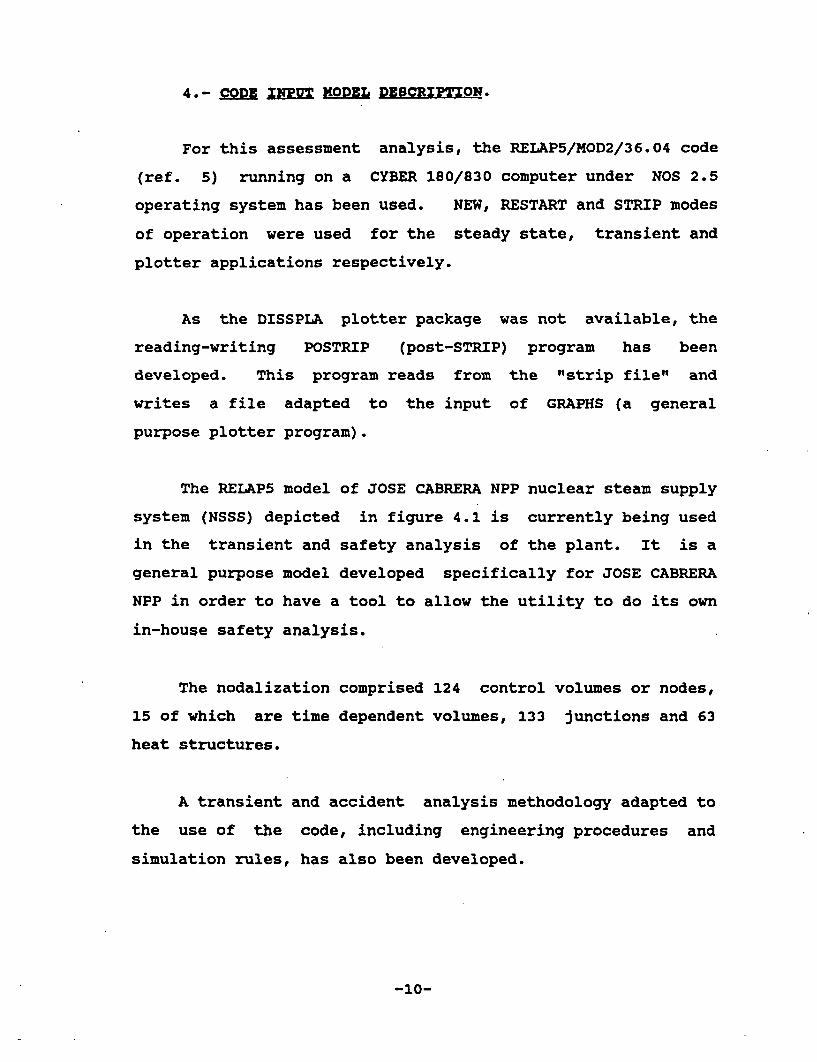
4.- CODE INPUT MODZL DZECRIpTION.
For this assessment analysis, the RELAP5/MOD2/36.04 code
(ref. 5) running on a CYBER 180/830 computer under NOS 2.5
operating system has been used. NEW, RESTART and STRIP modes
of operation were used for the steady state, transient and
plotter applications respectively.
As the DISSPLA plotter package was not available, the
reading-writing POSTRIP (post-STRIP) program has been
developed. This program reads from the "strip file" and
writes a file adapted to the input of GRAPHS (a general
purpose plotter program).
The RELAP5 model of JOSE CABRERA NPP nuclear steam supply
system (NSSS) depicted in figure 4.1 is currently being used
in the transient and safety analysis of the plant. It is a
general purpose model developed specifically for JOSE CABRERA
NPP in order to have a tool to allow the utility to do its own
in-house safety analysis.
The nodalization comprised 124 control volumes or nodes,
15 of which are time dependent volumes, 133 junctions and 63
heat structures.
A transient and accident analysis methodology adapted to
the use of the code, including engineering procedures and
simulation rules, has also been developed.
-10-

4.1.- Primary system nodalization.
The reactor core was divided into eight vertical nodes; a
six nodes pipe (209) representing the active core and two
unheated inlet (211) and outlet (207) nodes respectively. The
upper plenum (206) collects coolant coming from the core, from
the core bypass (210) and from the head of the vessel.
The vessel has a lower (four nodes annulus 208) and an
upper (204, 202) downcomer, a lower (212) and an upper (201)
dome, and an upper plenum (203, 205). Three bypass ways for
the coolant have been considered: core bypass (from 210 to
206), vessel head bypass (from 205 to 206), and cold leg - hot
leg bypass (from 208 to 100). By applying appropriate loss
coefficients, the specified flow distribution between core
flow and each bypass flow was met.
The hot leg was divided into two nodes (100 and 105), the
junction of wich corresponds to the surge line (three nodes
pipe 300) connection.
The pressurizer was modelled by two pipe components; the
two nodes upper one (312) and the six nodes lower one (310),
the connection of wich corresponds to the spray junction (from
354 to 310). This nodalization was chosen in order to allow
the model to introduce coolant spray from the pump discharge
(150) through- the-spray line (three nodes pipe 350, single
volume 354) directly into the steam volume under the influence
of the modulation of the spray control valve (352).
Heat structures to simulate both the pressurizer heaters
-11-

and the heat losses have been modelled. Also the continuous
spray mass flow rate of has been considered. There is an
equilibrium among this continuous spray (0.08 Kg/s),- the
pressurizer heat losses (15 Kw) and the power generated by the
proportional heaters power during the steady state (40 Kw).
The pressurizer relief lines (322, 326), valves (324,
328) and collector (330), as well as the safety lines (314,
318) and valves (316, 320) have been simulated. The four
nodes pipe common safety-relief collector (332) carries the
steam discharges into the pressurizer relief tank that was
simulated as a couple of volumes; the bottom one corresponds
to the water part (334) and the top one corresponds to the
steam-nitrogen part (336). The rupture disc was simulated by
a valve (338) having the disc real section and an opening
set-point equal to its rupture pressure. This valve allows
the discharge of steam directly to the containment atmosphere
simulated as a boundary condition (time dependent volume 340).
The primary side of the steam generator was modeled with
an inlet plenum (110), the portion of the tubes in the "up"
direction inside the tubeplate (115), the eight nodes pipe
(120) representing the U-tubes, the portion of tubes in the
"down" direction inside the tubeplate (125), and the outlet
plenum (130).
The loop-seal between the steam generator outlet and the
pump suction was simulated with three volumes corresponding to
the "down" part (140), the "horizontal" part (142) and the
"up" part (144).
-12-

The reactor coolant pump (150) was represented using the
specific homologous curves obtained from Westinghouse.
Two-phase factors from LOFT facility were used to simulate the
degraded behavior under abnormal conditions of void fraction
as an application of the conclusions of reference 6. The RCP
speed coastdown after a trip has been fitted by comparison
with plant reliable measurements of a specific test performed
at hot zero power conditions. The adjusted parameter has been
the internal friction torque and specially the TF 0 parameter
of this torque in the RELAP5/MOD2 input deck. As a
consequence of that, a good agreement has been got between
measured and calculated mass flow rates (fig. 4.2 and 4.3).
The cold leg leading from the pump discharge to the
vessel inlet was represented by two nodes (160, 165). The
injection of the charging system was simulated by a time
dependent volume (164) and a time dependent junction (163).
By applying the appropriate friction and form pressure
loss coefficients, the thermal-hydraulic design reference loop
pressure distribution, total pressure drop and flow were
achieved.
The emergency core cooling system was simulated by a
couple of subsystems. The passive subsystem includes the
accumulator (600), the discharge line (605), the isolation
valve (610), the three nodes pipe discharge line (620), and
the check valve (630). By tuning appropriated coefficients
the referenced Westinghouse accumulator discharge mass flow
rate under LBLOCA conditions was met. The active subsystem
corresponds to the safety injection pumps, modeled as a time
-13-

dependent junction (655) taking borated water from the reload
water storage tank (time dependent volume 650) as a boundary
condition. The injection flow has been defined as a function
of the primary system back-pressure with conservative
assumptions for the line pressure losses.
Heat structures for the accumulator, vessel, reactor core
(average and hot channels), hot leg, surge line, pressurizer,
steam generator plena, U-tubes, loop seal, pump, spray line
and cold leg, have been simulated. In the case of the SG
plena, three different heat structures have been considered:
one connecting each plenum with the containment atmosphere,
one connecting both plena, and one connecting each plenum with
the riser, simulating the tubeplate thermal structure.
The point kinetic model, including best estimate fuel
temperature, coolant temperature and coolant density feed-back
reactivity effects, has been selected for the active heat
structures of the reactor core. Realistic data have also been
used in the estimation of the decay heat which is obtained
from the ANS-79 standard. The reactor control and protection
systems based on the functional diagrams corresponding to the
real gains and delays measured at the power station have been
simulated too.
4.2.- Secondary system nodalization.
Feedwater was simulated as a time dependent junction
(445), connected to the upper part of the downcomer, taking
warm water from the time dependent volume (444) that
-14-
represents the outlet of the 4 th heater. Feedwater
temperature was simulated based on at power and post-trip
operational data.
Turbine driven auxiliary feedwater pump was represented
as a time dependent junction (449), connected to the upper
part of the downcomer, taking cold water from a constant
temperature time dependent volume (448).
Emergency feedwater motor pumps were simulated as a time
dependent junction (457), connected to the lower part of the
riser, taking cold water from a constant temperature time
dependent volume (456).
The steam generator downcomer was simulated by a five
nodes annulus (450). The single junction (455) connects the
downcomer bottom to the riser inlet. The riser was
represented by a five nodes pipe (400) with the same
elevations as their counterparts in the downcomer. The first
four are thermally connected to the primary system through the
U-tube heat structure.
A non-ideal but nearly-real first separator (410) was
simulated at the top of the riser with special detail in the
carry-over and carry-under flow characteristics. To do that,
a geometrical analysis of the real dimensions of the ciclonic
pathways in the separators has been done so as to obtain the
values of the VOVER (carry-over) and VUNDER (carry-under)
parameters for the RELAP5 separator model. A connection (from
410 to 450) representing the separator draining paths has been
provided. The separator bypass (440), connecting the
-15-

downcomer and the steam dome, has been simulated.
By applying the appropriate friction and form loss
coefficients in the natural circulation loop of the steam
generator (400, 410, 450), with the highest resistance located
in the downcomer/riser junction (455), the specified
circulation ratio of 1.96 has been met. Also, by adjusting
the secondary side liquid inventory, the measured downcomer
level has been obtained.
The steam node (420) corresponds to the volume between
the ciclonic separator and the steam dryer. The dryer was
simulated as a nearly-ideal second separator (424) which
allowed nearly-only steam to escape upwards. The drain flow
path (426) represents the real pipes that connect the steam
dryer to the top of the downcomer.
The steam volume at the top of the steam generator dome
has at its bottom a plate of orifices that behaves as a
separator and so it has been simulated as an ideal third
separator (430) allowing only steam to escape upwards. The
drain flow path (428) represents the real pipes that connect
the plate of orifices to the top of the downcomer.
When defining the scope of the plant model, this special
emphasis in the simulation of the three separator stages,
including the real definition of the draining ways, was
considered to be important in the analysis of
depressurizations of the secondary system due to steam line
breaks. These draining pipes behave in such an event as a
riser bypass leakage pathways for the inventory of the steam
-16-

generator that leaves the downcomer without any cooling effect
on the primary coolant through the riser/U-tubes thermal
connection.
The steam line was divided in several parts, a four nodes
pipe (500), two single nodes (502, 504), the main steam
isolation valve (506), a single node ( 508), a three nodes
pipe (510), the turbine trip valve (512), a single node (513),
the main steam control valve (514) and the time dependent
volume (516) that represents the turbine.
The turbine was simulated as a boundary condition
selecting its constant back-pressure high enough just to avoid
critical flow in the main steam line valves.
The real characteristics and actuation logic of each
valve have been modeled. Also, by using the appropriate
friction and form loss coefficients, the reference secondary
pressure distribution was met.
The model includes four safety valves (540, 544, 548 and
552) as well as their relief lines (542, 546, 550,and 554) to
the environment atmosphere simulated as constant time
dependent volumes (560, 561, 562 and 563).
The steam consumption of the turbine driven pump has been
simulated by time dependent junctions discharging to the
environment atmosphere (time dependent volumes 460 and 462)
for the turbining (459) and turbining-pumping (461) modes of
operation.
-17-
The automatic steam-dump system modulates the opening of
the relief valve (532) to the condenser (time dependent volume
538) through the relief line (530, 534) and the opening of the
relief valves (522 and 526) to the environment atmosphere
(time dependent volumes 564 and 565) through their relief
lines (524, 528), looking for the RCS no-load programmed
average temperature. There is a common relief line (520) to
the atmosphere and a general common relief line (518) from the
main steam line. A valve (536) isolates the relief line to
the condenser in case of loss of offsite A.C. power,
protecting the condenser that would be unavailable under this
circunstance.
Heat structures for the steam generator vessel and
internals have also been simulated.
A sensitivity calculation tuning the hydraulic diameter
of the steam generator U-tubes/riser heat structure was done
to fit the pressure in the secondary side at nominal power.
The explanation for this correction can be found in the
substantial amount of crossflow created by the U-tubes support
plates and the "U" curve itself inside the riser. The
crossflow enhances the heat transfer considerably and is not
taken into account in the standard heat transfer correlations.
The tuned hydraulic diameter corresponds to a value
similar to the gap between tubes. This value was only used in
the definition of the U-tubes/riser heat structure,
maintaining the real geometric value of the hydraulic diameter
for the definition of the riser volumes.
-18-

A summary description of the model including concept,
node number and type is given in Table 4.1.
4.3.*- Trips and control variables.
The software of the reactor protection system has been
modelled with a set of trips that forces the reactor scram
when necessary.
A wide range of control variables has been defined to
model the different control systems that work in the plant:
a) RCS average temperature control system:
Before the reactor trip, this system controls the rods
bank insertion and withdrawal taking into account:
- the difference between the primary average
temperature and the programmed one as a function
of the turbine load determined by the pressure in
the impulse chamber.
- the difference between the primary pressure and
the reference one.
After the reactor trip, this system controls the steam
dump from the steam generator to the atmosphere and to
the condenser by following a primary temperature
programme, as well as the stem position of the
feedwater valve by following a RCS temperature
-19-

hysteresis cicle.
b) Pressurizer pressure control system:
This system controls the primary pressure by acting on
the s.pfay, PORV's and heaters, looking for maintaining
the reference pressure.j
c) Pressurizer level control system:
This system controls the pressurizer level by acting
on the speed of the CVCS charging pumps, looking for
maintaining the programmed level as a function of the
RCS average temperature.
d) Steam generator level control system:
This system controls the level of the steam generator
by acting on the stem position of the feedwater
control valve, looking for maintaining the constant
reference SG level.
For an easier comparison with plant measurements in
assessment cases, all the important Control Room
instrumentation has been simulated with their actual units and
delays (2.0 sec. for liquid temperature, 20.0 sec. for steam
temperature, 1.0 sec. for liquid and steam mass flow rate, and
0.5 sec. for pressure).
-20-

4.4.- simplifications.
In order to save CPU time in the specific transient
analyses of this report, some simplifications have been done
in the general purpose model to generate a reduced ad-hoc one
(fig. 4.4), some control volumes and junctions being deleted
(for instance, and due to the fact that this is a
depressurization transient, the pressurizer relief lines,
PORV's, safety lines and valves as well as the relief tank
have been eliminated), the final nodalization having 73
control volumes, all of which remain as previously defined
excepting the spray valve that has been removed and
substituted by a constant mass flow rate TMDPJUN.
-21-

5.- STEADY STATE CALCULATION.
The first step was to get a steady state condition
representing the normal operation of the plant at full power.
The aim was to get the desired stable condition with the
minimum CPU time consumption. The simulated control system,
that reproduces the real characteristics of the system in the
plant, behaved slowly with high code running time and was not
considered the more appropriate for getting the steady state.
To that aim, a stabilization system has been developed
according to the logic of actuation represented in Table 5.1.
In this way, the pressurizer pressure and level, primary
coolant flow, primary average temperature, steam generator
pressure and steam generator downcomer level have been fitted
to the values measured in the plant.
This stabilization system was based on controllers that,
by using properly selected gains, fitted the system parameters
in such a way that the error signal (defined as the difference
between the desired and the calculated value of each
controlled variable) was reduced to zero as fast and stably as
possible.
Reactor power and feedwater temperature were maintained
constant as boundary conditions representing the nominal
values corresponding to the normal operating condition. For
this first calculation the kinetic model was not used.
After 346.5 sec. reactor time steady state calculation a
fully stable condition for the controlled model has been got.
-22-

The final state has fitted the desired full power measured
operating conditions. The RELAPS/MOD2 code stopped the steady
state calculation once the stability condition was accepted by
its internal checking procedure.
Then, a second step eliminating the stabilization system
and introducing the reactor kinetic model and the real reactor
control and protection systems was carried out. The stable
condition was reached inmediately. Table 5.2 gives a summary
of the comparison between the main variables measured and
calculated in the steady state simulation at full power.
Since the plant conditions at the beginning of the event
were not exactly those corresponding to 100% power, but to
96%, a new steady state corresponding to these conditions was
obtained with the same methodology as explained above.
Because this steady state calculation started from the steady
state at 100% power, the new desired conditions at 96% power
were found very quickly. These new steady state results,
which were used as the start point for the transient, are
shown in table 5.3 compared to the measured values.
-23-

6.- TRANSIENT RESULTS AND COMPARISON WITH PLANT DATA.
The purpose of this analysis was to compare the response
of the RELAP5/MOD2 code with the selected plant transient,
focusing the attention on the following aspects of the RCS:
- depressurization due to the continuous spray,
- response to the cooldown from the steam generator,
- response to the RCP trip,
- natural circulation evolution.
As is regular practice in JOSE CABRERA NPP, the operation
team worked most of the control systems. So these systems
didn't perform according to their automatic logic.
The control systems behaviour during the transient up to
the 2150.0 sec. studied in this simulation may be summarized
as follows:
- RCS average temperature control system:
It worked in automatic mode for the first 435.0 sec. in
the transient (up to the reactor trip), reducing power
to match the manual turbine load decrease.
- Pressurizer pressure control system:
It worked in automatic mode during the whole transient.
From 87.0 sec. on, all the pressurizer heaters worked
at full power (300 Kw).
-24-

- Pressurizer level control system:
Before the reactor trip (435.0 sec.), the reactor
operator started the second charging pump manually and,
from then on, the whole system was manually operated to
maintain the desired pressurizer level. Taking into
account the operator intervention, the charging flow
has been simulated as a TMDPJUN following the plant
register data (fig. 3.6).
- Steam-dump control system:
Just after the turbine trip, the reactor operator
switched the system from RCS average temperature
control mode to SG pressure control mode, setting the
adequate pressure setpoint to obtain the desired RCS
average temperature. Taking into account that, because
of the high capacity of the steam-dump valves, the SG
pressure response reached in a few seconds the demanded
one the measured SG pressure has been used as the
reference for the simulation of the actuation of the
control system.
- Steam generator level control system:
Once the turbine was tripped, it was manually
controlled by the turbine operator to recover the steam
generator downcomer level and to maintain it within an
acceptable range.
In the calculation with RELAP5/MOD2 the automatic and
-25-

manual modes of the control systems behaviour have been
simulated, simplifying their modelation as much as possible,
especially after the operators took the control of the
systems. Anyway, as mentioned above, the main aim of the
calculation was not to validate the control systems
performance, as other plant transients would be more suitable
for this purpose.
Therefore, the response of the pressurizer level and the
steam generator pressure have been fitted with special care.
Great attention has not been given to the steam generator
level evolution, whose impact on other variables, specially in
the primary circuit, is not very important as has been proved
by sensitivity calculations.
The spray mass flow rate has been set as a TMDPJUN in
order to obtain with the RELAP5/MOD2 models related to this
phenomenon and specially with the condensation one, the same
depressurization rate that was measured at the plant until the
reactor trip. The assumption of a constant mass flow rate
TMDPJUN model may be justified taking into account the
following considerations:
- There is a constant geometry in the RCS between the
discharge of the main coolant pump and the spray nozzle
in the pressurizer.
- The failure of the spray valve forced a fully open
position with constant area from the begining of the
transient on.
-26-

- The density of the fluid in the cold leg was
practically constant because of the small variation in
the temperature and the reduced impact of the
depressurization on it.
- A previous calculation of the same transient with
TRAC-PFI/MODI (ref. 7) in which the spray valve was
simulated with a VALVE component showed an almost
constant calculated mass flow rate.
It has been shown that, with this hypothesis, the more
suitable value of the equivalent mass flow rate at nominal
conditions is 2.7 Kg/s, in contrast with the design mass flow
rate of 4.8 Kg/s (reference documentation). It is important
to point out that the real spray flow can not be measured in
the plant and so it is not well defined but only referenced
from the Westinghouse design data.
The discrepancy between both flows might be due to two
different reasons:
- The three-dimensional (3D) characteristics of the
condensation phenomenon caused by the spray (ref. 8):
* Geometry of the nozzle and distance to the
pressurizer level that may be divided into three
spray zones: the continuous liquid. zone, the
break-up zone and the droplet zone.
* Mean drop diameter, velocity, spray angle and
break-up length as a function of the spray mass
-27-

flow rate.
* Form of the liquid sheet - characterized by the
spray angle and the break-up length - that is
responsible for the final form and efficiency of
the spray.
* Break-up length. of the liquid sheet into a swarm
of fine droplets as a function of Weber and Jacob
numbers. Due to the mechanism of aerodynamic
instability, the produced drops are of very
different sizes and fly at different velocities.
It may be summarized that in order to describe the
spray, measurements of the shape and length of the
liquid sheet and of the size and velocity distributions
of the droplets are necessary.
- The limitation of the condensation correlations of the
RELAP5/MOD2 code when analysing the condensation
process only in one dimension (MD).
A similar 1D code (TRAC-PFl/MOD1) yielded a calculated
spray mass flow rate of 2.9 Kg/s (ref. 7), in fact very close
to the RELAPS/MOD2 value of 2.7 Kg/s, in such a way that it
may be concluded that it is not a problem of models and
correlations but of physical effects and/or uncertainty in the
real mass flow rate.
The time sequence of the transient's more significant
events is shown in table 6.1.
-28-

At time t=0.0 sec. the spray valve was completely open,
and a RCS depressurization began due to the pressurizer steam
cooling and condensation (fig. 6.1). This depressurization
activated the pressure control system in such a way that, at
time 87.0 sec., all the pressurizer heaters were working at
full power and maintained this situation until the end of the
simulation.
As the depressurization continued, the shift supervisor
asked the turbine operator to decrease the turbine load in
order to create a reactor/turbine mismatch to force an
increase of the RCS temperature during the first moments in
order to reduce the pressure decrease rate. He therefore
throttled the turbine control valves,- forcing a pressure
increase in the steam generator.
The RCS average temperature control system started
working when this temperature was higher than the system dead
band, decreasing the nuclear power by means of control bank B
insertion (fig. 6.2, 6.3 and 6.4). The throttling action
produced an average temperature increase of between 0.5 and
1.0 "C in the primary circuit and a later temperature decrease
by following automatically the program of average temperature
in the RCS as a function of the turbine load. In this way the
turbine load decreased and, therefore, the nuclear power
decreased from 96%, the starting point, to 85% of- the rated
value.
The mentioned RCS average temperature increase produced a
primary coolant swelling and the corresponding pressurizer
-29-

level increase (fig. 6.5). The level control system, still
performing in automatic mode, decreased the flow of the
controlled CVCS charging pump. Afterwards, when the RCS
average temperature decreased and the pressurizer level
decreased consequently, the same pump automatically increased
its flow. From this moment to the reactor trip, which occurs
very soon, the second charging pump was manually started and
the reactor operator tooks control of the pressurizer level.
The manually started charging pump, injected its maximum flow
of 240.0 1/min into the system.
The primary system depressurization continued until the
low pressurizer pressure reactor trip set point of 125.5* 2Kg/cm (rel.) was reached (fig. 6.1). As a result of the
reactor trip, the turbine tripped and the steam-dump valves
tried to get the no-load temperature in the RCS. Some seconds
later, when the primary average temperature was lower than
280.0 OC, the main feedwater control valve began to close, in
order to obtain a mass flow rate of 5% of the nominal one in
70.0 sec. time.
The hot and cold leg temperature decreased and,
therefore, the RCS average temperature reduction (fig. 6.2,
6.3 and 6.4), produced a pressurizer level decrease (fig.
6.5), that was partially compensated by the charging pumps
both working in their manual mode. In normal conditions, the
level after the reactor trip would have automatically reached
a value of 18% of the span. In the transient, under the
manual influence of the reactor operator, a minimum level of
25% of the span was reached. It must be noted that the
primary system pressure decreased sharper in the simulation
-30-

than in the plant. That was because the pressurizer emptying
and refilling caused a sharper depressurization and
pressurization in the analytic results with RELAP5/MOD2 than
observed, as was also demonstrated with the NEPTUNUS Y-05
pressurizer experiment and its subsequent study with this code
(addendum A).
It has also been observed, as in other transients, a
calculated steam generator level drop larger than measured in
the plant after the turbine trip (fig. 6.7). This was due to
the dynamic effects on the instrumentation, to the way the
level in the RELAP5 model was defined (sum of all the
downcomer cells liquid fraction multiplied by their heights),
to the nodalization of the decreasing area annulus node
(450-01) which was between the upper part and the lower part
of the downcomer and finally to the uncertainty in the
circulation ratio and feedwater flow after the reactor trip.
The feedwater flow evolution corresponding to the closing
of the control valve from its nominal position to the 5% one
has been considered to be linear, although it would be logical
to assume that in the first phase of the closing transient the
flow would decrease very slightly with the result of a value
higher than simulated. So, in the analysis, the integrated
mass introduced has been supposed to be lower than it would
actually be at the plant (fig. 6.8). The feedwater
temperature may also have some effect; the best estimate
temperature evolution coming from other turbine trip analysis
has been adopted.
Less than one minute after the turbine trip, the
-31-

steam-dump control system was manually set into its SG
pressure control mode. The reactor operator tuned the
pressure setpoint to meet the desired RCS temperature
evolution, which is equivalent to open the steam-dump valves
when needed.
In the first phase of the steam-dump manual control the
steam generator pressure is allowed to *increase (fig. 6.6),
with the subsequent RCS temperature and pressurizer level
increase in the primary circuit. This fact, in combination
with the additional pressurizer level increase as a result of
the charging pumps manually working, forces a RCS
repressurization which, for the same reason mentioned
regarding the emptying after the reactor trip, is sharper in
the simulation than observed in the plant (fig. 6.1).
After the partial refilling, the pressurizer level
changes as a function of the primary average temperature, with
small deviations due to manual and not very severe charging
flow oscillations around the letdown flow value (fig. 6.5).
There is a phase in the simulation, between 800.0 sec.
and 1150.0 sec., with a pressurizer pressure sharp decrease
and later increase while the primary temperature and
pressurizer level are increasing (fig. 6.1, 6.2 and 6.5).
This tendency, apparently against the physic laws, appears in
the plant records too, but in a smoother manner. It has been
thought that this abnormal tendency could be due to local
effects in the pressurizer, which had been refilled with
subcooled water coming from the hot leg. This fact, together
with the pressurizer water stratification and temperature
-32-

axial gradient that forces the homogenization of the
stratified water zones, the interphase heat transfer and the
pressurizer walls temperature effects, justifies this pressure
response.
The calculated depressurization that appears between
1150.0 and 1350.0 sec. is sharper than measured in the plant.
This discrepancy has been considered to be due to a code
malfunction as a consequence of the calculation of very cold
water introduced in the node 6 of the pressurizer when the
node 5 is just filled of water and the pressurizer level
increasing continues. The very cold water temperature
calculated at node 6, colder than the water at node 5 and
colder than the previous calculated spray temperature at node
6 after its heating in the steam condensation proccess,
results very near to the pressurizer inlet spray temperature.
This non-physical-meaning code malfunction could correspond to
the same error observed in the RELA5/MOD2 simulation of the
MIT pressurizer test (addendum A) when the pressure evolution
was abnormally calculated at the time the level was going from
one node to the next one.
After this phase, from about 1350.0 sec., all the
variables evolution meets the steam generator pressure
evolution very well and with its effect on the primary
temperature (fig. 6.6).
Between 1450.0 sec. and 1550.0 sec. a significant
steam-dump manual depressurization in the steam generator is
forced by the reactor operator (fig. 6.6), producing an RCS
average temperature decrease (fig. 6.2). Approximately at
-33-

that time, the system's lowest.pressure is reached, about
100.0 Kg/cm 2(rel.) according to the plant records. Anyway,
this pressure was greater than the one at which the safety
injection begins injecting water into the system because a
value of 0.0 m3/h safety injection flow was observed. In the
simulation, the lowest pressure is about 2.0 Kg/cm2 lower than
measured and would have forced the ECCS water injection into
the reactor pressure vessel if the corresponding TMDPJUN would
not have been inhibited previously in the input deck.
At 1550.0 sec. the shift supervisor asked the reactor
operator to trip the RCP once the problem has been clearly
identified, in order to stop the spray flow. The main pump
takes about 80.0 sec. to stop and, meanwhile, the spray flow
decreases until it eventually stoped. Once the
,depressurization cause is finished and also due to the pump
trip, the RCS begins increasing its pressure (fig. 6.1).
The hot leg temperature increases due to the RCP trip,
but the cold leg temperature is not affected in the short
term. This produces a primary average temperature and primary
delta temperature increase (fig. 6.2 and 6.4).
At 1650.0 sec. the steam-dump is manually opened by the
reactor operator in order to control the primary heating. The
sharp cooling it produces can be seen more quickly and is
sharper in the cold leg than in the hot leg, due to the low
primary flow in natural circulation, and so, although the
average temperature decreases, the delta temperature
increases. This delta temperature increase, in combination
with the one described above (the first one due to the hot leg
-34-

temperature increasing, the second one due to the cold leg
temperature decreasing), produces a very significant peak of
the delta temperature, about 30.0 "C at the plant and 20.0 *C
in the simulation (fig. 6.2, 6.3 and 6.4).
The difference between these two values has been
concluded to be due in some way to different causes:
- A sharper or slightly shifted in time steam generator
pressure evolution as a consequence of the turbine
operator intervention.
- The records system reliability for such abrupt changes.
- The actual lack of hot leg axial temperature
homogeneity, specially under low flow conditions.
- The temperature instrumentation locations in the upper
part of the hot and cold legs for delta temperature
calculation in the plant.
The last two reasons create a 3D problem beyond the ID
design bases of the RELAP5 code. This effect of axial thermal
gradient in the hot leg combined with the instrumentation
location has been previously observed in the plant, even under
RCS nominal flow with the RCP running, when there is a
pressurizer level decrease because of a malfunction of the
CVCS and saturated water goes out of the pressurizer, is not
mixed and flows through the upper part of the hot leg long
enough to activate the reactor trip on "variable low
pressurizer pressure" that is equivalent in this nuclear
-35-

station to the OTAT reactor trip of a standard Westinghouse
3-loop PWR.
After that, stable natural circulation is intended. Of
course, it is affected by the reactor operator manual action
on steam generator pressure through the manual control of the
steam-dump valves. The natural circulation primary delta
temperature is established at about 12.0 "C at plant and 13.0
"C in the simulation (fig. 6.4). That is because the RELAP5
primary model has been fitted to the reference pressure drop
that corresponds to the thermal design flow (75000. gpm),
8.5% lower than the actual flow. This actual flow is about
82000. gpm, but it is difficult to know it exactly. That is
just a direct consequence of the overestimation in the
pressure drop coefficients of the RCS based on the
Westinghouse design references. 'The RCS nominal flow
deviation justifies the small discrepancy observed in the
simulation in the stabilized delta temperature under natural
circulation: the RCS flow is lower and the delta temperature
is higher than in the plant measurements.
The RELAP5/MOD2 simulation confirms the lack of a steam
bubble formation in the vessel head due to the RCP trip under
no-load RCS temperature and low pressure conditions.
The simulation finishes at 2150.0 sec., with the RCS
pressure being recovered. This pressure is, at the end of the
calculation, 106.0 Kg/cm2 and. it is increasing (fig. 6.1).
Natural circulation is established, although it is affected by
the manual depressurization of the steam generator performed
by the reactor operator.
-36-

A good agreement between the code results and the data
recorded in plant can be observed in all the transient phases,
specially considering that all the interesting phenomena are
clearly shown and the most significant discrepancies have been
explained according to the RELAP5 models or the way some
boundary conditions have been assumed. The higher primary
temperature discrepancies are about 2.0-3.0 °C, and the2greater RCS pressure discrepancies are about 5.0-6.0 Kg/cm
The worst agreement corresponds to the steam generator level,
but even that variable shows about 30.0-35.0 cm. as the
greatest discrepancy between plant and simulation.data, which
is considered acceptable.
Finally it is important to point out that the code
assessment conclusion depends on the quality of the records.
The script type thickness with the nominal recording speed of
1 inch/hour, which really is a little bit different from one
record to another, produce an uncertainty of about 70.0 s. The
uncertainty about the value of the variables depends on the
scale .of each one and is higher the higher the scale. Finally
the chronology of events of the NPP trip report is just
approximate. All these reasons make very difficult to
describe the sequence of events with a greater accuracy.
Figures 6.1 to 6.9 show, in plant units and with the
corresponding instrumentation delays, the comparison between
the real data and those obtained in simulation. The remaining
figures, from 6.10 to 6.25, have been attached to make the
transient more easily understandable. Table 6.2 shows the
variables identification for the transient figures.
-37-

7.- RUN STATISTICS.
During the first 1650.0 sec. of the transient, up to
100.0 sec. after the RCP trip, the maximum allowed time step
was 0.5 sec. From this time to the end of the simulation,
500.0 sec. more, the maximum allowed time step was relaxed to
1.0 sec., as the Courant limit was less restrictive during
this phase because of the low velocity of the fluid in the
primary circuit.
Figure 7.1 shows the CPU time comsumption as a function
of real time. Twice in the transient the integral CPU time
goes to 0.0 sec. and corresponds to the time when a restart
with some changes in the input file is made.
The run statistics summary is shown in table 7.1. The
average CPU time (35172. sec.) to real time (2150.0 sec.)
ratio was 16.36 to 1.
-38-

8.- CONCLUSIONS.
RELAAP5/MOD2-cycle 36.04 has been used for an assessment
case, comparing the analysis results with plant measurements
of a real incident that took place in August 1984. The
reference nuclear plant, JOSE CABRERA, has been nodalized and
this nodalization is being used in a wide range of
thermal-hydraulic applications. Both code and the model have
worked friendly and properly.
The comparison with plant measurements has been difficult
due to the lack of a process computer, the quality of the
registers and, consequentely, the data uncertainties.
Nevertheless, the selected transient has a big interest both
generic (because of the thermalhydraulic phenomena that took
place) and specific (behaviour of the single-loop nuclear
power plant).
It has been possible to reproduce the main events in the
transient and reach a good agreement between the simulation
and the plant data. The steam generator level has been the
variable in which a lower fitting effort has been done. It
was proved that the highest discrepancy of 20.0-30.0 cm. has
not a big impact on the other primary and secondary variables.
Concerning RCS temperatures and pressure the highest
discrepancies have been 2.0-3.0 OC and 5.0-6.0 Kg/cm2
respectively.
The spray mass flow rate has been tuned to fit a
depressurization rate similar to the one in the plant before
the reactor trip, The parameter was kept constant for the
-39-

rest of the pump running time. The spray calculated value is
lower than the reference design one. The same applies to
TRAC-PFl/MODl, for which the fitted value is close to the one
of RELAPS. The discrepancy is due to the one-dimensional
characteristic of RELAP5 studying a tri-dimensional phenomenon
and mainly to the fact that the reference is a design value
that can not be measured in the plant. However, with a well
tuned spray equivalent mass flow rate, it is not neccessary a
3D pressurizer model to simulate its effect on the RCS
pressure.
Some experimental results (NEPTUNUS Y-05 and MIT
pressurizer tests) have been simulated to check the code.
From their results with no uncertainty about the spray flow it
may be concluded that the code underpredict the spray
condensation efficiency. Based on this evaluation and the
results of the plant simulation it might be concluded that the
real spray flow in the plant is lower than the fitted one, so
much lower than the design reference value. However, to
support this conclusion, the previously mentioned 3D phenomena
should be considered.
As in the simulation of the experiments, the plant RCS
depressurization and pressurization due to pressurizer partial
emptying and refilling were sharper in the analysis than in
the plant measurements and also an abnormal pressure responsiG
appears when the pressurizer level changes from one node to
the next one.
It is important to- remark the big effect of some
pressurizer local phenomena (such as cold water stratification
-40-

with axial temperature gradient, heat transfer in the
water/steam and spray/steam interphases', heat thansfer from/to
the walls, heat slabs properties, heat losses to the
containment atmosphere) on the.RCS, pressure. A detailed
pressurizer nodalization is required to properly simulate
these effects.
The response of the steam generator level immediately
after the turbine trip is sharper in the simulation than in
the plant. This might be due to the way of modelling the
collapsed liquid level in the steam generator downcomer.. The
necessity of modelling the downcomer delta pressure
instrumentation or, at least, of giving a good table of level
as a function of the mass inventory, specially in the zones
with complex geometry, has been detected.
In general, the primary parameters have followed very
well the cooldown induced from the steam generator. The very
high peak of delta temperature in the RCS after the main
coolant pump trip has been obtained and also the stable delta
temperature in natural circulation has been properly
calculated without a vessel head steam bubble formation. This
means that the friction and form pressure losses coefficients,
fitted with the pump running, are good enough to reproduce the
pressure losses in natural circulation with a Reynolds number
much lower.
The final calculation has been carried out after several
sensitivity Analyses. In spite of the duration of the
transient, these analyses have been possible because of the
good CPU time to real time ratio, specially after the RCP trip
-41-

when the CPU time consumption decreased a lot because the
maximum allowed time step could be higher due to the lower
restriction of the Courant limit. Also, the CDC CYBER 180/830
computer has performed successfully with RELAP5/MOD2.
-42-

9 - REFERENCES.
1.- L., Rebollo, UNION FENOSA,."RELAPS/MOD2 analysis 2 A
postulated 'cold "~g SBLOCA' simultaneous to _ 'total
black-out, event in JOSE CABRERA nuclear station as an
aDDlication .2 'lessons learned' from OECD-LOFT LP-SB-3
experiment. Development of a mitiQation procedure.", ICAP
report, October, 1987.
2.- Josd Cabrera Nuclear Power Plant Final Safety Analysis
Report (1968).
3.- J. Fornieles, UNION FENOSA, "Central Nuclear Jose Cabrera:
Informe de disparo. de la central por disparo del reactor
(motivado pM bala presi6n, causada por la apertura local
de ja PCV-400A)", ID-95, Septiembre, 1984.
4.- R. de la Vega, CSN, Acta de Inspecci6n AIN/123/JC/84 del
Consejo de Seguridad Nuclear, Septiembre, 1984.
5.- V.H.Ramsom & R.J. Wagner. "RELAPS/MOD2 Code Manual."
NUREG/CR-4312, EGG-2396, INEL, USA, December, 1985.
6.- J.B. Adams, D.L. Batt & V.T. Berta. "Xnfluence of LOFT
Pn Simulations 2A Thermal-Hydraulic Aspects 2f Commercial
En Safety", NUCLEAR SAFETY, April-June, 1986.
7.- R. Martinez, TECNATOM, "Assessment of RAC-PFI/MODI
against an inadverted Dressurizer ssray total oveninq jn
the JOSE CABRERA power plant", ICAP report, December,
1990.
-43-

8.- A. Ch~vez, F. Mayinger, Technische Universitdt Minchen,
"B_•av characterization and direct measurement of drop
size and velocitv distributions using pulsed laser
holocraDhy", European Two-Phase Flow Group Meeting,
Brussels, 30-31 May and 1 June 1988.
-44-

TABLE 4.1_RELXS/MOD2 model description (nodalization).
CONCEPT
PRIMARY COOLAMT SYSTEM
NODE NODENUMBER TYPE
Cold leg - pump discharge ......................Charging flow (CVCS) .................CVCS tank ..................... o. .......... ..Cold leg - vessel inlet ... ......... . .....Vessel downcomer - lower part ..............Vessel bottom . . ........ o............ o......oCore lower plenum ....... .0.V.0....Core inlet junction .o. .... . ....Reactor core ....... _.o. ... .... ...........Core outlet junction .............. . ........Core upper plenum .... .... .. .o.o............Core bypass ... . ................... o .... .Reactor outlet ...........................Vessel downcomer junction .............Vessel downcomer - ECCS injectionVessel downcomer junction ....... ....Vessel downcomer - upper part .................Vessel top ..........Vessel upper-upper plenum ..................Vessel upper plenum .... ooo..o... ... . ... o......Hot leg - vessel outlet .... . .... .o.o. ... . ....Hot leg - steam generator inlet ...... eo.......
S.G. tube inside the tube-plate (hot)S.G. tube connected to the riser ..S.G. tube inside the tube-plate (cold)S.G. outlet plenum .. ... . ..... . .... ... .o.oCross over leg - S.G. outlet ............ ..Cross over leg - intermediate o....Cross over leg - pump inlet ....................Primary coolant pump ......Pressurizer surge line....Pressurizer inlet junctionPressurizer vessel (lower part) .............Pressurizer junction .. ... .....................Pressurizer vessel (upper part) .........Pressurizer safety valve 1 inletPressurizer safety valve 1 .................Pressurizer safety valve 2 inlet ..............Pressurizer safety valve 2Pressurizer relief valve 1 inlet'. .... oooo[oo.Pressurizer relief valve 1 ..................Pressurizer relief valve 2 inlet ..............Pressurizer relief valve 2 .... . ......Pressurizer relief collector .... ..........Pressurizer relief-safety collector ...........
160163164165208212211243209244207210206245204246202201203205100105110115120125130140142144150300301310311312314316318320322324326328330332
branchtm.dp. jun.tm.dp.vol.branchannulusbranchsingle vol.single jun.pipesingle jun.single vol.pipebranchsingle jun.annulussingle jun.annulusbranchbranchbranchbranchbranchbranchbranchpipebranchbranchbranchbranchsingle vol.pumppipesingle jun.pipesingle jun.pipebranchvalvebranchvalvebranchvalvebranchvalvebranchpipe

TABLE 4.1 RELPSZ/MOD2 model description (nodalization). (Cont.)
CONCEPT NODE NODENUMBER TYPE
Pressurizer relief tank (water volume) .........Pressurizer relief tank (steam volume) .........Pressurizer relief tank rupture disc ...........Containment atmosphere .........................Cold leg - spray line connection...............Pressurizer spray line (up) ....................Pressurizer spray valve ........................Pressurizer spray line (down) ..................Accumulator ....................................Accumulator discharge line .....................Accumulator isolation valve ....................Accumulator discharge line................Accumulator discharge line check valve...Reload water storage tank ....................Emergency core cooling system (pumps) ..........
SECONDARY SYSTEM
S.G. downcomer ....... 0 ........ ............. ... ..S.G. downcomer - riser connection .............S.G. riser .............. ................ .....S.G. separator ...... .... . ... . ........... .. ...S.G. separator bypass . ........................S.G. separator outlet steam volume .............S.G. first dryer .. ... o....o.........o.....o........S.G. first dryer draining pipe ..S.G. second dryer (orifice plate) ..S.G. second dryer draining pipe ............S.G. feedwater tank ........ ....... . .... ......S.G. feedwater flow .... o.. .. .................AFWS turbine-driven pump FW2 suction tank ......AFWS turbine-driven pump FW2 junction ..........EFWS motor pump suction tank ...........EFWS motor pump junction ...................Steam line (S.G. outlet) ......................Steam line ........ .. ......... ............Steam line ...................... o...............Steam line isolation valveSteam line ......Steam line o............ ................. o........Turbine trip valve .........................Steam line ............ ....... .... ...... ... .Main steam control valveTurbine ... ..................................... oS.G. safety valve 1 .........................S.G. safety valve 1 discharge lineEnvironmental atmosphere ...................
334336338340349350352354600605610620630650655
450455400410440420424426430428444445448449456457500502504506508510512513514516540542560
branchbranchvalvetm.dep.volsingle jun.pipevalvebranchaccumulatorsingl vol.valvepipevalvetm.dep.vol.tm.dep.jun.
annulussingle jun.pipeseparatorbranchbranchseparatorbranchseparatorbranchtm.dep.voltm.dep.jun.tm.dep.voltm.dep.jun.tm.dep.vol.tm.dep.jun.pipebranchbranchvalvebranchpipevalvesingl vol.valvetm.dep.vol.valvebranchtm.dep.vol.

TABLE 4.1 RELAPS/MOD2 model description (nodalization). (Cont.)
CONCEPT NODE NODENUMBER TYPE
S.G. safety valve 2 ..... .................S.G. safety valve2 discharge line ............Environmental atmosphere ...S.G. safety valve 3 .........................S.G. safety valve 3 discharge lineEnvironmental atmosphere .S.G. safety valve 4 o .... ..................S.G. safety valve 4 discharge line ... ..........Environmental atmosphere .................... .AFWS FW2 steam consumption (injecting)Environmental atmosphere ............ .AFWS FW2 steam consumption (not injecting)Environmental atmosphereSteam relief line ... ..... o...o.....Steam relief line to the atmosphere ...S.G. relief valve 1 (to the atmosphere) .......
S.G. relief valve 1 discharge line ......Environmental atmosphereS.G. relief valve 2 (to the atmosphere)S.G. relief valve 2 discharge lineEnvironmental atmosphereS.G. relief line to the condenser ....S.G. relief valve 3 (to the condenser)S.G. relief valve 3 discharge lineCondenser isolation valveCondenser ... ...... o .o.... o......... o..........
544546561548550562552554563459460461462518520522524564526528565530532534536538
valvebranchtm.dep.vol.valvebranchti.dep.vol.valvebranchtm.dep.vol.tm.dep.jun.tm. dep.vol.tm.dep.jun.tm.dep.vol.branchsingle vol.valvebranchtm.dep.vol.valvebranchtm.dep.vol.branchvalvesingle vol.valvetm.dep.vol.

TABLE 5.1 Stabilization system actuation logic
* VARIABLE TO BE FITTED * CONTROL SYSTEM ACTION ** * ."
* Primary pressure * Time dependent .volume connected to the *
* * pressurizer-steam dome *
* Primary coolant average temperature * Main steam control valve modulation *
************************************************************************************** *****************
* * •
* Primary system mass flow rate * Reactor coolant pump speed modulation *
* Pressurizer level * Make-up andlet-down (CVCS) modulation *
Steam generator downcomer level * Main feedwater modulation
* Primary - secondary temperature difference. * ** * Parametric analysis of the hydraulic diameter ** Steam generator pressure * *

TABLE 5.2 Steady state results at nominal conditions.
* Variable Units k JOSE CABRERA * RELAP5/MOD2** (measured) *(calculated)*'* ** * *
* Reactor power (Mw) 510.00 * 510.00 *
SRCS average teldperature (AK 566.60 * 566.60, ** e
* Pressurizer level M() 64.00 * 64.00 -ft* * 82
* Pressurizer pressure WPM 13.82 * 13.82 k
RCS mass flow rate * (Kg/s) * 3605.00 * 3605.00 *
* Reactor coolant pump speed * (rpm) * 990.00 * 995.00 f
* Steam generator pressure W (MPa) M 4.63 * 4.63 *
* Steam generator circulation rate * ( ) * 1.96 * 1.96.*
f Steam generat6r collapsed liquid level * ( cm ) * 0.0 * 0.0 *t ft ft f *
* Steam flow rate f (Kg/s) * 266.40 * 265.90 f
* Feedwater temperature * ( 0 K) * 477.00 * 477.00 *ft ft ft ft **** ******** ************ *************** *** ** *

TABLE 5.3 Steady state results at 96.0%
* Variable * Units * JOSE CABRERA * RELAP5/MOD2*, * * (measured) *(calculated)*
**************************************************** ********* ************* **************************
, * • * *
* Reactor power * (Mw) * 490.00 * 490.00 *
* RCS average temperature * (0K) * 565.80 * 565.70 *
* Pressurizer level * (M) * 62.00 * 61.90 *
* Pressurizer pressure * (MPa) * 13.82 * 13.82 *
* RCS mass flow rate * (Kg/s) * 3686.80 * 3686.80 *
* Reactor coolant pump speed * (rpm) * 990.00 * 995.00 "
* Steam generator pressure * (MPa) * 4.68 * 4.68 *
Steam generator circulation rate * ( - ) * 1.96 * 1.96 *
* Steam generator collapsed liquid level * (cm) * 0.0 * 0.0 *
* Steam flow rate * (Kg/s) * 255.40 * 256.00 *
* Feedwater temperature * ( 0 K) * 477.00 * 477.00 *
*********************************************** * * * *

TABLE 6.1. BeauenDO 21 EveZnt
EVENT TIME (s)
calculated
Spray valve PCV-400A opening
Pressurizer heaters at full power
Turbine load decrease begins
Reactor trip
Turbine trip
Safety injection signal
Manual reactor coolant pump trip
End of simulation
0.0
87.0
135.0
435.0
435.0
462.0
1550.0
2150.0
measured
0.0
120.0
135.0
440.0
440.0
470.0
1550.0

TABLE 6.2 Variables identification JA the transient fitures
CNTRLVARCNTRLVARCNTRLVARCNTRLVARCNTRLVARCNTRLVARCNTRLVARMFLOWJMFLOWJCNTRLVARMFLOWJCNTRLVARTEMPFTEMPFTEMPFTEMPGTEMPFSATTEMPHTTEMPHTTEMPHTTEMPHTTEMPHTTEMPHTTEMPMFLOWJTEMPFTEMPGSATTEMPHTTEMPTEMPFTEMPGSATTEMPHTTEMPTEMPFTEMPGSATTEMPHTTEMPTEMPFTEMPGSATTEMPHTTEMPTEMPFTEMPGSATTEMPHTTEMPTEMPFTEMPGSATTEMPHTTEMPTEMPFTEMPGSATTEMPHTTEMPTEMPFTEMPGSATTEMPHTTEMPVOIDGVOIDGCPUTIME
0660560540580730760834450000004300100001114250000001003500300001650100001000100004300100002070100002070100002091001102091002102091003102091004102091005102091006101050100003100100003100100003100100003101001053100200003100200003100200003102001053100300003100300003100300003102002053100400003100400003100400003102003053100500003100500003100500003102004053100600003100600003100600003102005053120100003120100003120100003102006053120200003120200003120200003121001053100500003100600000
- PRZ PRESSURE (KG/CM2 REL)- RCS AVERAGE TEMPERATURE (C)- COLD LEG TEMPERATURE (C)- RCS DELTA TEMPERATURE (C)- PRZ LEVEL (% OF SPAN)- SG PRESSURE (KG/CM2 REL)- SG DOWNCOMER LEVEL (CM)- FEEDWATER MASS FLOW RATE (KG/S)- STEAM MASS FLOW RATE (KG/S)- CORE POWER (W)- SPRAY MASS FLOW RATE (KG/S)- PRZ HEATERS POWER (W)- SPRAY TEMPERATURE (K)- COLD LEG TEMPERATURE (K)- HOT LEG TEMPERATURE (K)- SG DOME TEMPERATURE (K)- CORE EXIT TEMPERATURE (K)- CORE EXIT SATURATION TEMPERATURE (K)- AVERAGE CHANNEL CLAD TEMP. NODE 1 (K)- AVERAGE CHANNEL CLAD TEMP. NODE 2 (K)- AVERAGE CHANNEL CLAD TEMP. NODE 3 (K)- AVERAGE CHANNEL CLAD TEMP. NODE 4 (K)- AVERAGE CHANNEL CLAD TEMP. NODE 5 (K)- AVERAGE CHANNEL CLAD TEMP. NODE 6 (K)- RCS MASS FLOW RATE (KG/S)- PRZ LIQUID TEMPERATURE NODE 1 (K)- PRZ STEAM TEMPERATURE NODE 1 (K)- PRZ SATURATION TEMPERATURE NODE 1 (K)- PRZ WALL TEMPERATURE NODE 1 (K)- PRZ LIQUID TEMPERATURE NODE 2 (K)- PRZ STEAM TEMPERATURE NODE 2 (K)- PRZ SATURATION TEMPERATURE NODE 2 (K)- PRZ WALL TEMPERATURE NODE 2 (K)- PRZ LIQUID TEMPERATURE NODE 3 (K)- PRZ STEAM TEMPERATURE NODE 3 (K)- PRZ SATURATION TEMPERATURE NODE 3 (K)- PRZ WALL TEMPERATURE NODE 3 (K)- PRZ LIQUID TEMPERATURE NODE 4 (K)- PRZ STEAM TEMPERATURE NODE 4 (K)- PRZ SATURATION TEMPERATURE NODE 4 (K)- PRZ WALL TEMPERATURE NODE 4 (K)- PRZ LIQUID TEMPERATURE NODE 5 (K)- PRZ STEAM TEMPERATURE NODE 5 (K)- PRZ SATURATION TEMPERATURE NODE 5 (K)- PRZ WALL TEMPERATURE NODE 5 (K)- PRZ LIQUID TEMPERATURE NODE 6 (K)- PRZ STEAM TEMPERATURE NODE 6 (K)- PRZ SATURATION TEMPERATURE NODE 6 (K)- PRZ WALL TEMPERATURE NODE 6 (K)- PRZ LIQUID TEMPERATURE NODE 7 (K)- PRZ STEAM TEMPERATURE NODE 7 (K)- PRZ SATURATION TEMPERATURE NODE 7 (K)- PRZ WALL TEMPERATURE NODE 7 (K)- PRZ LIQUID TEMPERATURE NODE 8 (K)- PRZ STEAM TEMPERATURE NODE 8 (K)- PRZ SATURATION TEMPERATURE NODE 8 (K)- PRZ WALL TEMPERATURE NODE 8 (K)- PRZ VOID FRACTION NODE 5- PRZ VOID FRACTION NODE 6- CPU TIME (S)

TABLE 7.1 - nt
Real time RT = 2150.0 seconds
CPU time CPU - 35172.0 seconds
Total number of volumes C - 73
Total number of time steps DT - 25961
(CPU x 1006)/(c x DT) - 18.5

U.- w .. •
06
F'.
I I.~ it.
~ ji; f~1* , ..Ii * **'
IlI I
RFW I1
"r3
(inmC-)
:I>m
zCC-)
mm"VI-
z-4
m
m
mz-4.
z
:2
Eccs

Th{-81*b IL'III H! ! .
FIG. 3.1. PRESSURIZER PRESSURE (KG/CM2 REL, NARROW RANGE)
10 30 40.,
161
FIG 3.2. PRESSURIZER PRESSURE (KG/CM2 REL, WIDE RANGE)
RCS DELTA TEMPERATURE (C)
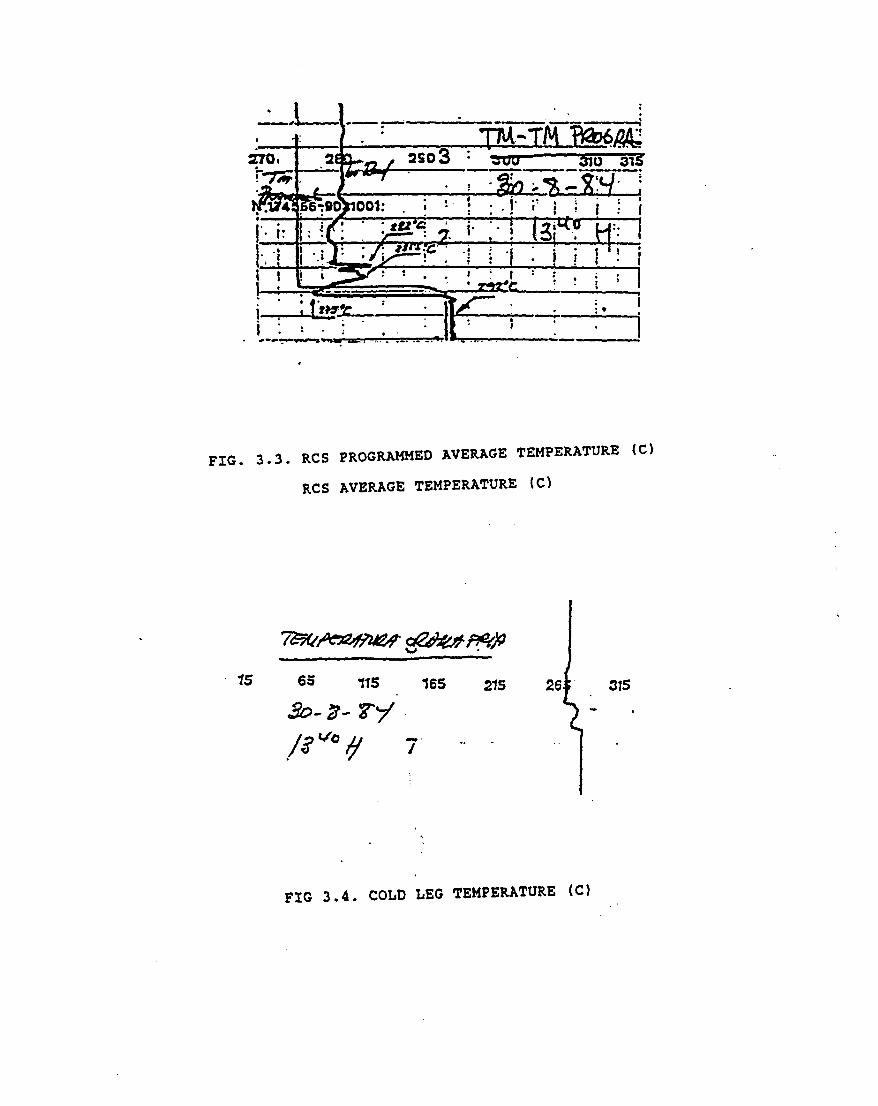
FIG. 3.3. RCS PROGRAMMED AVERAGE TEMPERATURE (C)
RCS AVERAGE TEMPERATURE (C)
15 65 115 165 215 26 315
A? - 7.
FIG 3.4. COLD LEG TEMPERATURE (C)

20i 40 * 60 .80 Tact
• 8
FIG. 3.5. PRESSURIZER PROGRAMMED LEVEL (1 OF SPAN)
PRESSURIZER LEVEL (% OF SPAN)
010 it 20
N*174566-012-0T011_ _ _;
FIG. 3.6. RCS CHARGING FLOW (LPM)

i.
at
..." ".... ........111 60 90 ;60- 30 3 60 J
• -10 -Z.0,3.I I . " : : . •- , . ..~
FIG. 3.7. STEAM GENERATOR PRESSURE (KG/CM2 REL)
STEAM GENERATOR DOWNCOMER LEVEL (CM)
I
I400 600 800 1000 1200
43 4a v /7
FIG. 3.8. FEEDWATER MASS FLOW RATE (TN/H)
STEAM MASS FLOW RATE (TN/H)

FIG. 3.9. TURBINE LOAD (MWe)

FIG. 4.1 JOSE CABRERA PLANT NODALIZATION

RELAP5fl¶0020 -I. Il~a1oA/cNJco
MRELAPS/M0020 + EOIDA/CNJCO
FIG. 4.2. RCP COASTDOWN. PERCENTAGE OF THE NOMINAL FLOW.
SHORT-TERM.
FIG. 4.3. RCP'COASTDOWN. PERCENTAGE OF THE NOMINAL FLOW.
LONG-TERM.

351
0U-
FIG. 4.4. AD-HOC REDUCED NODALIZATION

E1 CNTRLVAR 66 A PLANT DATA
IDNZ 0
N
(n
Lco
A
A
A
A
A A
A
I I I I I I I I I I I I I I I I I I i I I I I I0 t0 20 30 40 50 60 70 e0 90 300 310 120 130 140 150 160 170 180 190 200 210 220 230
TIME (S) *IO'
UNION-FENOSA ICAP INADVERTED PRZ SPRAY TOTAL OPENING (FIG 6.1 )

ID CNTRLVAR 56 A PLANT DATA
Go
0N
n"0)
N
03m
Cq
:0)Z) c
I--< •: to<'-a
ILUcc_,O
ILU
LUI(.20)<NW
a:N
< tNN
(u)
co
a:ONq
A
AA
A
A A AA A
A A
A
0 10 20 30 40 50 60 70 8o 90 100 110 120 130 140 150 160 170 180 190 200 210 220 230
TIME (S) *IO'
UNION-FENOSA ICAP INADVERTED PRZ SPRAY TnTAI. nPFNTNIN ( Ff T - . 9

[P CNTRLVAR 54 A PLANT DATA
,N
0
0)NN
0)NN
UJ
toz
<N
CLitZN
I-J
N~c
(2dA
0
0 E0)toN
0)toN
NtoN
totoN
100 110 120 130 140 150 160 170 180 190 200 210 220 230
TIME (S) w10'
UNJON-FENOSA ICAP INADVERTED PRZ SPRAY TOTAL OPENING (FIG R

M CNTRLVAR 58 A PLANT DATA
w
(.4
(J c0-
w 0u
A
A A
AA
A
A
A
A
AA
a
0 0 20 30 40 o0 60 70 80 90 100 110 120 130 140 150 IGO 170
TIME (S) w10'180 190 200 210 220 230
UNION-FENOSA ]CAP INADVERTED PRZ SPRAY TOTAL OPENING (FIG 6,4)

11] CNTRLVAR 73 A PLANT DATA
to
N
zto
In
(I)
LL t
LL n
0
WVto
m
N.
0N.
A
s" A
V,
I I I I I I I I I I I I I I I
a 10 20 ..30 40 50 60 70 80 so 100 110 120 1330 140 350 160 170 180 190 200 210 220 230
TIME (S) *1IO'
UNION-FENOSA ICAP INADVERTED PRZ SPRAY TOTAL OPENING (FIG 6.5)

El CNTRLVAR 76 A PLANT DATA
to
w
in
U '
LDJ
IZ
'n
in-D
(n in
- I - I I I I I I I I I I I I I0 10. 20 .30 4o 50 6O 70 80 90 100 110 120 130 14o 150 160 170 190 190 200 230 220 230
TIME (S) 410'
UNION-FENOSA ]CAP INADVERTED PRZ SPRAY TOTAL OPENING (FIG 6.6)

ID CNTRLVAR 83 A PLANT DATA
CD
-3:
0Li(n
A
A *
A
AA
A
A
0 io 20 so 4o 50 6o 70 go 90 1OO 110 120 130 14O 150 160 170 190 190 200 210 220 230TIME (S) *10'
UNION-FENOSA ICAP INAOVERTEO PRZ SPRAY TOTAL OPENING (FTGC 9.7

mD MFLOWJ 445000000 A PLANT DATA
0
0
03co('4
0w
CD
co
LU
LUL-3
D--
CD1
LUkL
0
0
A AA '-El--rn
0T I I I I I | I I I I I I I I I
0 30 20 30 40 90 60 70 80 90 100 110 120 130 140 150 160 170 18o 190 200 210 220 230
TIME (S) *lO'
iNIfON-FFNOqA IrAP INAnVFRTFD PR7 SPRAY TfTAI. nPFNTNf- Fir- 6.R i

ID MFLOWJ 430010000 A PLANT DATA
0)
0
CIN
0toJ
N
-0
*0
0
Lii
U-)
0~
11,
.... ... . ~- a AIj, .......I
0 10 20~I ~ ~ I ' I I I I "• I I *-T 4' ~ I I I I I I l- I *• I -- I30 40 50 60 70 s0 90 100 I10 120 130 140 150 160 170 190 190 200 210 220 230
TJME (S) *lO'
UNION-FENOSA ]CAP INADVERTED PRZ SPRAY TOTAL OPENING (Fig fq)

[1 CNTRLVAR Ill.
V I I 1 . . . 220 230
a0 1 20 30 40 50 60 70 80 90 100 110 120 1.30 140 150 160 170 180 190 200 210
TIME (S) *10'
UNION-FENOSA ICAP INADVERTED PRZ SPRAY TOTAL OPENING (FIG bIU

FD MFLOWJ 425000000
0
N'M-O Eg 9 E3 E3 E9 E9
m m m
V
N
w
U)-
CLO
I:
N
0
C0I - - I I~T I~I - I I I~1 U I I j La L~j ~ La
0I I I I I I I I I I I I I I I I " , I 'q I ý I ,'10 20 30 40 50 60 70 80 90 100 130 320 330 340 150 160 170 180 190 200 210 220 230
TIME (S) W10'
UNION-FENOSA ICAP INADVERTED PRZ SPRAY TOTAL OPENING (FJG6.11)

mD CNTRLVAR 10lO0-
0oo 110 120 130 140 150 160 170 260 190 200 210 220 230TIME (S) w10'
UNION-FENOSA ]CAP INADVERTED PRZ SPRAY TOTAL OPENING (FIG 6.12)
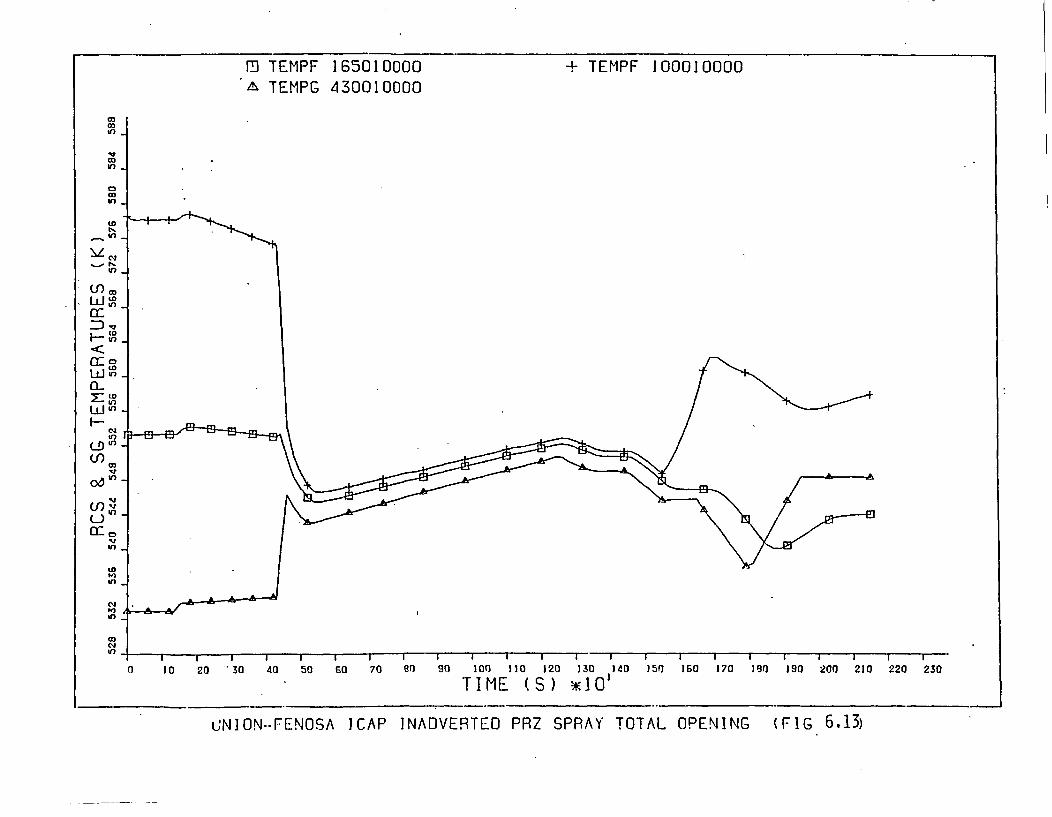
P] TEMPF 165010000A TEMPG 430010000
+ TEMPF 100010000
co00
in
.0
in
tn
(tn
cc
oOin
CL)r wtn
(0
in
w
In
0 10 20 30 40 50 60 70 go 90 100 110 120 330 140 )50 160 170 190 190 200 210 220 230
TIME (S) Y4O'
GNION-FENOSA JCAP INADVERTED PRZ SPRAY TOTAL OPENING (FIG 6,13)

21 TEMPF 207010000 + SATTEIP 207010000
!2
sa
in
L0 i0
MWin
in
0,
oin
C-)
r-4
ID n
in
Ini'n
ont-4
In
0 10 20 30 40 50 60 70 80 90 100 110 120 130 140 150 160 170 190 190 200 210 220 230
TIME (S) *10'
UNION-FENOSA ]CAP INADVERTEO PRZ SPRAY TOTAL OPENING (FIG 6.1L)

2D HTTEMP 209100110A HTTEMP 209100310X HTTEMP 209100510
* HTTEMP 209100210* HTTEMP 2091004107 HTTEMP 209100610
tO 20 30 40 50 so 70 90 90 100 310 J20 130 140 150 160 170 180 190 200 210 220 230
TIME (S) ,I0l
UNJON-FENOSA ICAP ]NADVERTED PRZ SPRAY TOTAl. OPFNINr; (Flr. 6.1-'
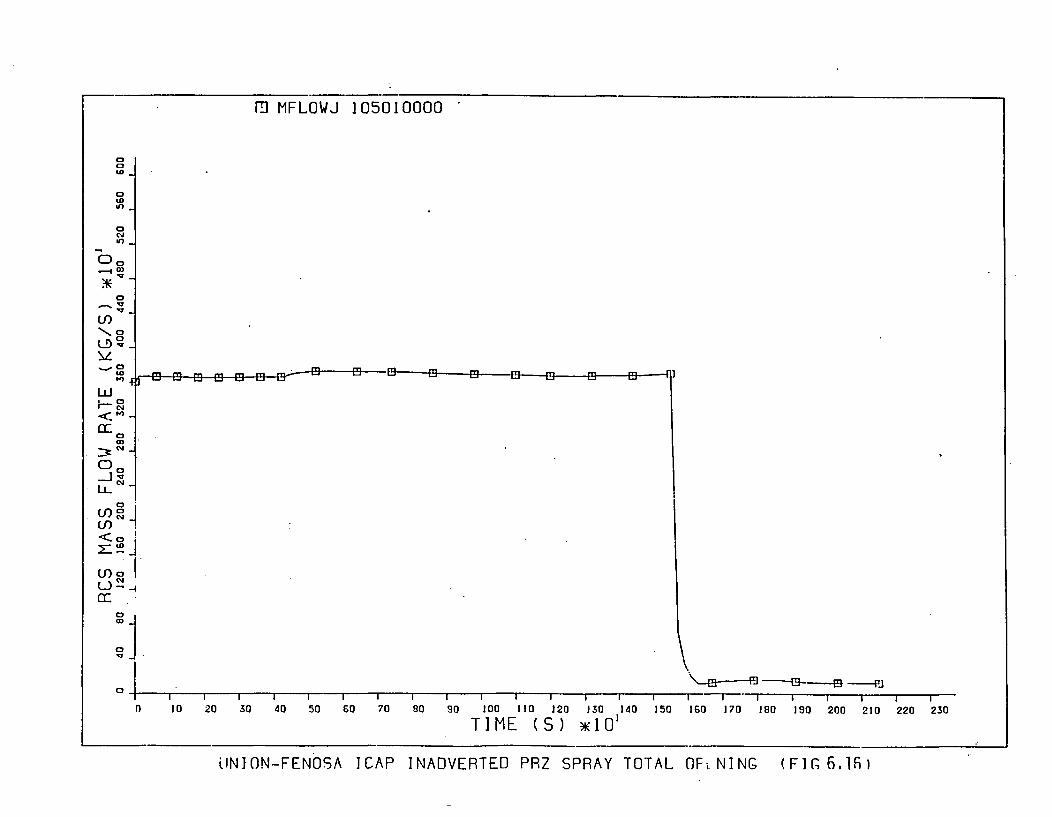
F3- tIFLOWJ 105010000
n03wn
03Wnin
%0
Ul)
0,
0
C3
C3o
w
Ld N
a)
<0X23
Ippppp9 F9
U)oCL) -4-
0)
C3 I I I I I I I I I I I I I.4-
n N0 20 30 4-0 so 60 70 80 s0 100 110 120 130 40 150 GO0 170 180 190 200 210 220 230
TIME (3) w10'
UNION-FEN OSA ICAP JNADVERTEIJ PRZ SPRAY TOTAL OFi.N]N@ (Fl(-,6.1-9)

WD TEMPF 310010000A SATTEMP 310010000
+ TEMPG 310010000* HTTEMP 310100105
co
0
003to
Lo
N.-- t m
0z~
Ln
C mLU
LiiIn-
N 0tD
watntn
Ntoin
coan
!o :0 20 30 40 50 6o 70 80, 90 100 110 120 1.1o 140 150 160 170 190 190 200 210 220 230.
TIME (S) W10'
UNION-FENOSA JCAP INADVERTED PRZ SPRAY TOTAL OPENING (FIC 6.17)

ED TEMPF 310020000A SATTEMP 310020000
* TEMPG 310020000* HTTEMP 310200105
to
to
00to
Lii
to
U) %n
Lin
cow
co
toin
in
to
0 8o 90 100 110 120 130 140 190 16O 170 180 1SO 200 210 220 230
TIME (S) w10'
UNION-FENOSA ICAP INADVERTED PRZ SPRAY TOTAL OPENING (FIG6.18)

mD TEMPF 310030000A SATTEMP 310030000
* TEMPG 310030000* HTTEMP 310200205
100 110 J20 130 140 150 IGO 170 180 190 200 210 220 230TIME (S) *lO'
UNION-FENOSA ]CAP INADVERTED PRZ SPRAY TOTAL OPENING (FIG 6.lq)

E2 TEMPF 310040000A SATTEMP 310040000
+ TEMPG 310040000* HTTEMP 310200305
03to
to0to
Lo
LU 0
Z: oa)
LU
M
LU
LU c
N
CL
INC,In
0coin
0 10 20 30 40 50 60 70 80 . 90 100 110 120 130 140 150 160 170 180 190 200 210 220 230
TIME (S) w10'I
UNJON-FENOSA ICAP INADVERTED PRZ SPRAY TOTAL OPENING (FIG 6.20)

•1D TEMPF 310050000A SATTEMP 310050000
+ TEMPG 310050000*÷ HTTEMP 310200405
Lo
nC3
Ni
Lo
0ZC3
toc 0)
a)Z) in
F--
00
d0~
N
(L
tn
tn
0 10 20 30 40. 50 60 70 81 90 100 110 120 1.30 140 150 160 170 1Or 190 200 210 220 230
TIME (S) x-1O'
UN]ON-FENOSA ]CAP INADVERTED PRZ SPRAY TOTAL OPENING (FIG,6,21)

ff TEMPF 310060000A SATTEMP 310060000
X TEMPF 350030000
+ TEMPG 310060000* HTTEMP 310200505
U,
0
(Lto
C)
Zin
mu,
o.Zen
Lo in
0i
tnI/I
%nvI,n
000 1 20 30 40 50 60 70 . 80 90 100 110 120 ISO 140 150 160 170 180 190 200 210 220 230
TIME (S) w10'
UN]ON-FENOSA ICAP INADVERTED PRZ SPRAY TOTAL OPENING (FIGC6.9)

ID TEMPF 312010000A SATTEMP 312010000
+ TEMPG 31201000011 HTTEMP 310200605
0
coato
to0Lo
to
li00
Lo
i 0,C:) U'to
DU')tLI-
cr n
LLI
ccnF- 0
-a01)
N'
03a).n
100 110 120 130 140 15o 160 170 190 .90 200 210 220 230TIME (S) w10'
UNION-FENOSA ]CAP INADVERTED PRZ SPRAY TOTAL OPENING (FiG6.23

ID TEMPF 312020000A SATTEMP 312020000
* TEMPG 312020000* HTTEMP 312100105
r) !0 20 30 40 50 Go 70 so 90 100 110 120 130 140 150 160 170 180 190 200 210 220 230TIME (S) w1O'
UNION-FENOSA ICAP INADVERTED PRZ SPRAY TOTAL OPENING (FIG 6.24)

ID VOIDG 310050000
0
LO06
Ln~
(o00
Zd0
ZO_0 L
<1-
a: 0LL 0
. N•
..C0
0
0;
a)
0i
+ VOJOG 3100GO000
.4-
:1; .: I. -| | | I | I I I "t" "1" I'-- I I I - I I
0 10 20 30 40 50 60 70 8r) 90 100 ig0 120 130 140 150 360 170 380 390 200 210 220 230
TIME (S) .KIO'
UNION.-FENOSA ]CAP INADVERTED PRZ SPRAY TOTAL OPENING (FIG 6.25)

ID CPUTIMEO
C4I
Lo0
0)
0 C
,-I
C0
Wa
Ld c
y-2
C4
C3
N 10 20 30 40 50 60 70 s0 90 100 10E 120 130 140 150 160 170 1 F0 1.90 200 210 220 230
TIMEI (S) *KI01
UNION-FENOSA ]CAP INADVERTED PRZ SPRAY TOTAL OPENING (FIG 7.1)

A~DDENDUM A
ASSESSMENT OF RE~L.PLkIQP AGANST PREBOURIZB SEPARATE
EFFETS XPEIMENTS!


ASSESSMENT OF RELAPS/MOD2 aGAINST PRESSURIZER SEPARATED EFFECTS
EXPERIMENTS
To evaluate the RELAP5/MOD2 response to pressurizer filling
transients and the interphases impact, two pressurizer separated
effects experiments have been selected. These experiments were
conducted at the NEPTUNUS (Holland) and MIT (USA) experimental
facilities.
The local pressurizer performance is emphasized in these
concerns because it presents the wall/steam, liquid-steam and
spray/steam interphases and, consequently, it generates the global
pressure value to be transmitted throughout the system.
Before discussing the mentioned separated effects
experiments, the most significant pressurizer parameters have been
studied.. These parameters are:
a) Geometry:
Height, diameter, spray valve position, wall
thickness and material properties.
It imay be pointed out that the volumes of these
pressurizers are 0.032 m 3 (MIT) and 1.26 m3
(NEPTUNUS) to confront with the 9.0 M 3 in the
pressurizer of JOSE CABRERA NPP.
- A.I -

b) Operating conditions:
Pressure and level in steady state operation
(saturation equilibrium) prior to each experiment.
c) Interphases:
Liquid-steam, liquid-wall, steam-wall and
steam-spray.
d) Boundary conditions:
Heat losses, heaters power, continuous and controlled
spray flow, surge line flow, relief and safety
valves.
After an evaluation based on the definition of the
"importance" functions for the interphases, it may be concluded
that, due to the scale of the experimental pressurizers with
respect to the one of JOSE CABRERA NPP, the "importance" of the
interphases is amplified by a factor of between 1.65 and 3.48 for
the NEPTUNUS pressurizer, and between 90.0 and 398.0 for the MIT
pressurizer.
Simulation of these pressurizer tests is considered
appropriate since, if with such an amplification the code provides
an acceptable response, the scalability to JOSE CABRERA NPP will be
guaranteed and the uncertainty minimized.
- A.2 -

I.- MIT-A EXPERIMENT SIMULATION.
The pressurizer is a small one of 0.032 m3 (fig A.1) set
up in the laboratories of the Massachusetts Institute of
Technology (MIT), USA, operating much below the reference
reactor nominal values. The experiment started from a thermal
saturated equilibrium condition at a pressure of 6.1+5 Pa and
a fixed level of 0.35 m.
The experiment consisted of a partial filling with cold
water (43 *C) up to a final level of 0.86 m. with spray and
heaters out of operation. Pressure increased due to
compression of the steam bubble that became overheated, thus
producing heat transfer to the subcooled liquid interphase,
wall condensation and heat losses to the environment. coolant
stratification was also observed during the test.
A system model for the RELAP5/MOD2 code has been
generated based on the available drawings, processing the
geometry as well as metalic structures, environmental losses,
and surge line flow.
The following conclusions of the RELAP5/MOD2 post-test
simulation may be emphasized:
- - Pressure simulation is overestimated in case the wall
effect and environmental losses are not simulated. A
code malfunction with sudden pressure decrease whenever
the level goes just from one node to the next one has
been detected (fig. A.2).
- A.3 -

- Steam temperature simulation is very deficient in case
the instrumentation time delay constant is not
simulated (fig. A.3).
- The response is very sensitive to the conductivity and
specific heat of the steel wall.
- The evolution of the liquid, steam and wall
temperatures are correct, both at the lower and upper
part of the pressurizer vessel (fig. A.4 y A.5).
- Final pressure simulation has been satisfactorily
calculated (fig. A.6).
- It becomes necessary to provide the model with a
sufficient number of nodes in the liquid phase, to
allow for a correct simulation of the coolant thermal
stratification and axial gradient.
After the appropriate simulation of the MIT-A experiment,
it may be concluded that RELAP5/MOD2 correctly predicts the
liquid thermal stratification, the steam compression due to
the filling of the pressurizer, the condensation in the wall
and in the steam-liquid interphase, and the environmental
losses, thus generating satisfactory evolutions -of level,
temperatures and pressure in pressurizer slow filling
transients.
- A.4 -
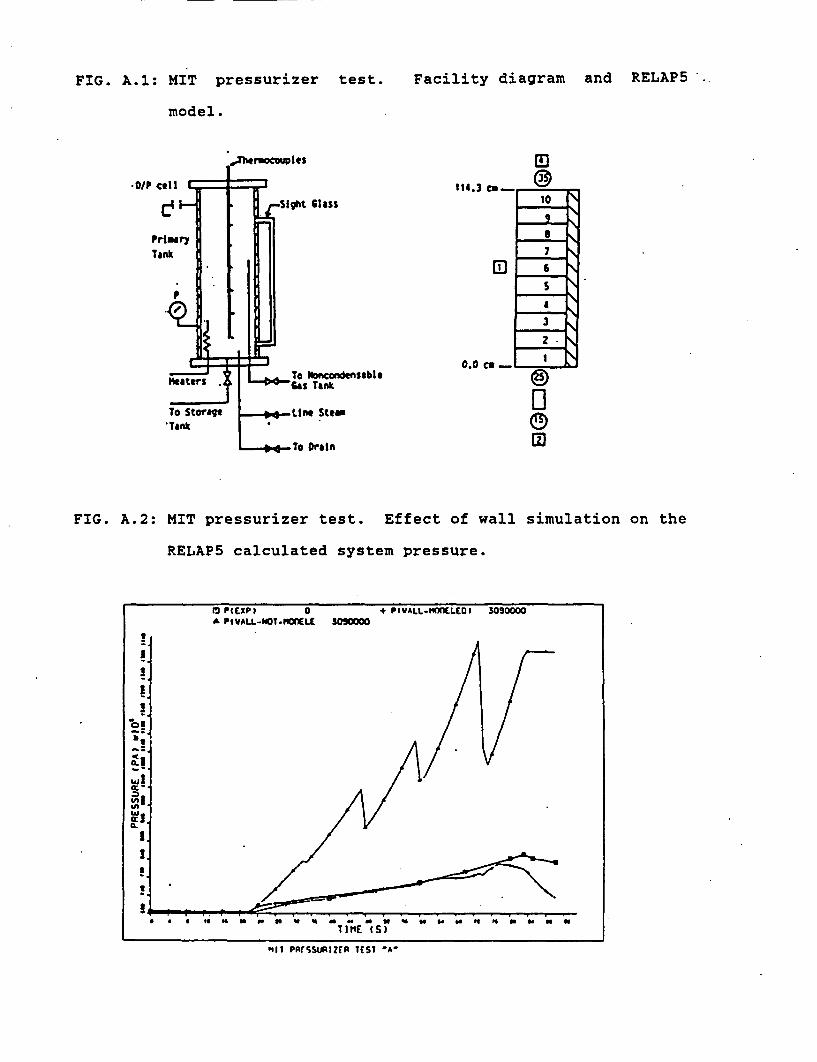
FIG. A.l: MIT pressurizer test.
model.
Facility diagram and RELAP5
*0/P tllI 114.3 cO,
class
E)
0.0 Cm -To N1onconde sable'Gas Tank
.Line SteaU0.To Drain
FIG. A.2: MIT pressurizer test. Effect of wall simulation on the
RELAP5 calculated system pressure.
TIME (S
smn P~irssmuIrp it *A

FIG. A.3: MIT. Effect of the steam temperature instrumentation
lag on the RELAP5 calculated steam temperature.
NIT In•S$MIZElt TEST 'A'
FIG. A.4: MIT. RELAP5 simulation of the wall and liquid
temperature in the lower part of the pressurizer.
O T-4*ELAPI 0 4 IV 4'IEIcP3A (99r M000 *1r1 HIP S10010
X N11IlEM 310010*7. 6,ITI 3090000
a
IIU
I
WI,
~I.4
Ua-a.U'-I~l.
NI
TIE tSi
m1!l PRE.SSuRIlR ISI 'A'

FIG. A.5: MIT. RELAP5 simulation of the wall and liquid
temperature in the upper part of the pressurizer.
0-1.3d6CXPI 0A LAG-1I9 3WS 1X 141ICMP 31INOO
+ 'V.3diCEXP3+ 0411(EW SIOOSIZ SATICP SOSCOMo
0
I
"I 'I ' t a so 'a N 'U a 'a 'a W ;0 'a 'a t SITIMF (S)
q41'P'SSU4k!ICR TET! 'A'
FIG. A.6: MIT. RELAP5 calculated system pressure.
U 4 P0 PI|XPI a * P 3090000
UII
Sit 04 n a a W a a - w a v U " t ""% a a UTIME (S)
MIT1 PRESSURtIZER9 7LS 'A'


2.- NEPTUNUS Y-05 EXPERIMENT SIMULATION.
The pressurizer has 1.26 m 3 of volume (fig. A.7), is
located at the Delft University (Holland) and operates at
conditions similar to those in an actual power reactor. The
Y-05 experiment started from a thermal saturated equilibrium
condition at a pressure of 126.0+5 Pa, an electrical heating
power of 17. Kw and a fixed level of 1.12 m.
The experiment consisted of successive filling and
emptying of the pressurizer as a result of cyclic oscillations
(fig. A.8) of the lower surge line make up flow rate at
constant temperature and of the upper spray flow rate at
variable temperature with the heating power kept constant.
Level oscillations with regard to the reference level
were observed, as well as pressure oscillations as a function
of the combined effect of the following trends:
- pressure increase due to steam volume decrease
associated to rising level.
- pressure increase due to heaters effect.
- pressure decrease due to steam volume increase
associated to dropping level.
- pressure decrease due to steam condensation in the wall
and in the water and spray interphases.
- A.5 -

A system model for the "RELAP5/MOD2 code has been
generated based on the available drawings, processing the
geometry as well as heaters, metalic structures, environmental
losses, and surge line and spray flow.
The following conclusions of the RELAP5/MOD2 post-test
simulation may be emphasized:
- Pressure and steam temperature increase rates are
predicted conservatively in excess during filling, with
amplification of pressure peaks (fig. A.9).
- Pressure decrease rate due to emptying is predicted in
excess, with satisfactory fitting of pressure valley
points (fig. A.9).
- A filling impact larger than the spray impact is
conservatively predicted, in opposition to what was
experimentally observed (fig. A.9).
- Presence of overheated steam in filling is correctly
predicted as well as saturated steam in emptying.
Experimentally observed level oscillations are
predicted as well (fig. A.10).
- The difference between calculated and measured pressure
peaks increases along the various transient cycles
(fig. A.9) due to the increasing delay between surge
line and spray flows (fig A.8).
- The heat transfer in the interphase with the subcooled
- A.6 -

spray is underestimated.* Predicted depressurization
rate due to spray condensation is lower than measured.
- It is convenient to fit the nodalization so that the
pressurizer average level is in a node center.
- Performance of RELAPS/MOD2 matches TRAC-PFl/MODl as
illustrated in NUREG/CR-3919.
After the NEPTUNUS Y-05 experiment simulation it may be
concluded that RELAP5/MOD2 satisfactorily predicts, with
conservative trend, the liquid thermal stratification, steam
compression due to pressurizer filling, wall, steam-liquid and
steam-spray interphase condensation, and environmental losses,
thus generating a satisfactory response to level, temperature
and pressure evolutions in pressurizer fast transients.
-A.7 -


FIG. A.7: NEPTUNUS Y-05 test. Facility diagram and RELAP5 model.
wal
.06
II
FIG. A.8: NEPTUNUS Y-05 test. RELAP5 simulation of the surge
line and spray mass flow rates.
0 L'OVJ I5OOnOOO + MFLOWJ 25000000
.NEPTUNUS PRESSLAIZEA IESY Y.05

FIG. A.9: NEPTUNUS Y-05 test. RELAP5 calculated system pressure.
a rouiof-.0%) 12050=o 4P.IpriP 0
* U- a a n to so em m In so so on In log e "an m tosoM71;k( (S;
14CPILWA PKSSULMIZER IEST Y-OC%
FIG. A.10: NEPTUNUS
level.
Y-05 test. RELAP5 calculated pressurizer
U1 s.I qVAR I
2
-j
Wit
W2
N(P7UWuS PRESSURIZER 7CS7 T-05

3.- ASSESSMENT CONCLUSIONS OF RELAPS/MOD2 WITH REGARD TO
PRESSURIZER SEPARTED EFFECTS TRANSIENTS.
Both studies of pressurizer separated effects, with
regard to the performance of RELAP5/MOD2 and its applications
to pressurizer pressure slow and fast transients in commercial
reactors, lead to the following conclusions:
- It is necessary a correct simulation of the thermal
properties of the wall material as well as the
environmental thermal losses.
- Simulation of the instrumentation time delay constant
is fundamental in order to compare steam temperature
calculated and measured values.
- Time steps of 0.05 seg. are adequate.
- Prediction of both liquid/wall and steam/wall heat
.transfer is correct.
- Prediction of axial thermal gradient in the wall as
well as in the water is correct.
- Condensation in the steam/spray interphase is
underestimated.
- Filling pressurization and emptying depressurization
rates are overestimated as a result of an
underestimation in processing condensation and
vaporization rates in the liquid-steam interphase.
- A.8 -
- RELAP5/MOD2 performance is iimilar to the observed in
TRAC-PFl/MODl simulation.
- Because
function
NEPTUNUS
in these
the real
the pressurizer interphases "importance"
is lower in JOSE CABRERA NPP than' in MIT and
experimental facilities, the observed impact
simulations will be reduced when applied to
plant case.
code
well
both
real
This set of conclusions positively qualifies RELAP5/MOD2
to be applied for pressurizer filling pressurization as
as for emptying and spray condensation depressurization
for slow and fast transients simulation in the case of a
nuclear power station.
- A.9 -

NRC FORM 335 U.S. NUCLEAR REGULATORY COMMISSION I. REPORT NUMBER(249) (Aalgned by NRC. Add Vol.. Bump. Rev..NRCM 1102. Wv Addendum Numborw. If ISY.)3201.3202 BIBLIOGRAPHIC DATA SHEET
(s-g i,,r.,etions, on, rho ,iv. verREsa)IA-01
2. TITLE AND SUBTITLE NUREG/IA-0124ICSP-JC-SPR-R
Assessment of RELAP5/MOD2 Against a Pressurizer Spray ValveInadverted Fully Opening Transient and Recovery by Natural Circulation 3. DATE REPORT PUBLISHED
in Jose Cabrera Nuclear Station JuNTH e 1 99ýJ^
4. FIN OR GRANT NUMBER
_,L22455. AUTHORISI 6. TYPE OF REPORT
R. Arroyo, L Rebollo Technical7. PERIOD COVERED lneduhe De*teut
8. PERFORMING ORGANIZATION - NAME AND ADDRESS (ii NRC.rovide Division. Ofice oe ReiWon. U.S. Nu kReRlatory Co==. end meakvm esO ll contructo, io.ovide
Union Electrica Fenosac/Capitan Haya 5328020 MadridSpain
9. SPO NSO R ING ORGA N IZATI ON -- NAM E A ND ADD0R ESS fit NA C. t.p* ý so &bovw" 0 co,,tractor. prvide NR•C Diviio,,. Office of Region. U.S. Nk•,ker Regtatwy Comhmkn.ot.,d mallfdd'I/
Office of Nuclear Regulatory ResearchU.S. Nuclear Regulatory CommissionWashington, DC 20555
10. SUPPLEMENTARY NOTES
1I. ABSTRACT 1200 -F or 1m)This document presents the comparison between the simulation results and the plant measurements of a real eventthat took place in Jose Cibrera nuclear power plant in August 30, 1984. The event was originated by the local,continuous and inadverted opening of the pressurizer spray valve PCV-400A.
Jose Cabrera power plant is a single loop. Westinghouse PWR belonging to UNION ELECITRICA FENOSA, S.A.(UNION FENOSA), a Spanish utility which participates in the International Code Assessment and ApplicationsProgram (ICAP) as a member of UNIDAD ELECTRICA, S.A. (UNESA). This is the second of its twocontributions to the Program: The first one was an application case and this is an assessment one. The simulationhas been performed using the RELAP5/MOD2 cycle 36.04 code, rinning on a CDC CYBER 180/830 computerunder NOS 2.5. operating system.
The main phenomena have been calculated correctly and some conclusions about the 3D characteristics of thecondensation due to the spray and its simulation with a ID tool have been got.
12. KEY WORDS/OESCR:PTORS (List word orprows that will tist fe~hars In 0ocadne th" Wol. J 13. AVAILABILIT'Y STATEMENT
ICAP, Jose Cabrera ,UnlimitedSpray, RELAP5 14. SECURITY CLASSIFICATION
Spra, REAP5(TMi PAPe)
UnclassifiedI'Thi ReponI
Unclassified15. NUMBER OF PAGES
16. PRICE
NRC FORM 335 12-191


I
Federal Recycling Program


UNITED STATESNUCLEAR REGULATORY COMMISSION
WASHINGTON, D.C. 20555-0001
SPECIAL FOURTH-CLASS RATEPOSTAGE AND FEES PAID
USNRCPERMIT NO. G-67
OFFICIAL BUSINESSPENALTY FOR PRIVATE USE, $300