nureg/ia-0458, "relap5/mod3.3 analysis of event with actuation
TRANSCRIPT

NUREG/IA-0458
International
Agreement Report
RELAP5/MOD3.3 Analysis of Event with Actuation of Safety Injection System at the Loss of External Power
Prepared by:
A. Prošek, M. Matkovič Jožef Stefan Institute Jamova cesta 39 Sl-1000 Ljubljana, Slovenia K. Tien, NRC Project Manager
Division of Systems Analysis Office of Nuclear Regulatory Research U.S. Nuclear Regulatory Commission Washington, DC 20555-0001
Manuscript Completed: November 2014 Date Published: December 2015 Prepared as part of The Agreement on Research Participation and Technical Exchange Under the Thermal-Hydraulic Code Applications and Maintenance Program (CAMP) Published by U.S. Nuclear Regulatory Commission

AVAILABILITY OF REFERENCE MATERIALSIN NRC PUBLICATIONS
NRC Reference Material
As of November 1999, you may electronically access NUREG-series publications and other NRC records at NRC’s Library at www.nrc.gov/reading-rm.html. Publicly released records include, to name a few, NUREG-series publications; Federal Register notices; applicant, licensee, and vendor documents and correspondence; NRC correspondence and internal memoranda; bulletins and information notices; inspection and investigative reports; licensee event reports; and Commission papers and their attachments.
NRC publications in the NUREG series, NRC regulations, and Title 10, “Energy,” in the Code of Federal Regulations may also be purchased from one of these two sources.
1. The Superintendent of Documents U.S. Government Publishing Office Mail Stop IDCC Washington, DC 20402-0001 Internet: bookstore.gpo.gov Telephone: (202) 512-1800 Fax: (202) 512-2104
2. The National Technical Information Service 5301 Shawnee Rd., Alexandria, VA 22312-0002 www.ntis.gov 1-800-553-6847 or, locally, (703) 605-6000
A single copy of each NRC draft report for comment isavailable free, to the extent of supply, upon writtenrequest as follows:
Address: U.S. Nuclear Regulatory Commission Office of Administration Publications Branch Washington, DC 20555-0001 E-mail: [email protected] Facsimile: (301) 415-2289
Some publications in the NUREG series that are posted at NRC’s Web site address www.nrc.gov/reading-rm/doc-collections/nuregs are updated periodically and may differ from the last printed version. Although references to material found on a Web site bear the date the material was accessed, the material available on the date cited may subsequently be removed from the site.
Non-NRC Reference Material
Documents available from public and special technical libraries include all open literature items, such as books, journal articles, transactions, Federal Register notices, Federal and State legislation, and congressional reports. Such documents as theses, dissertations, foreign reports and translations, and non-NRC conference proceedings may be purchased from their sponsoring organization.
Copies of industry codes and standards used in asubstantive manner in the NRC regulatory process are maintained at—
The NRC Technical LibraryTwo White Flint North11545 Rockville PikeRockville, MD 20852-2738
These standards are available in the library for reference use by the public. Codes and standards are usually copyrighted and may be purchased from the originating organization or, if they are American National Standards, from—
American National Standards Institute11 West 42nd StreetNew York, NY 10036-8002www.ansi.org(212) 642-4900
Legally binding regulatory requirements are stated only in laws; NRC regulations; licenses, including technical speci-fications; or orders, not in NUREG-series publications. The views expressed in contractor prepared publications in this series are not necessarily those of the NRC.
The NUREG series comprises (1) technical and adminis-trative reports and books prepared by the staff (NUREG–XXXX) or agency contractors (NUREG/CR–XXXX), (2) proceedings of conferences (NUREG/CP–XXXX), (3) reports resulting from international agreements (NUREG/IA–XXXX), (4) brochures (NUREG/BR–XXXX), and (5) compilations of legal decisions and orders of the Commission and Atomic and Safety Licensing Boards and of Directors’ decisions under Section 2.206 of NRC’s regulations (NUREG–0750).
DISCLAIMER: This report was prepared under an interna-tional cooperative agreement for the exchange of technical information. Neither the U.S. Government nor any agency thereof, nor any employee, makes any warranty, expressed or implied, or assumes any legal liability or responsibility for any third party’s use, or the results of such use, of any information, apparatus, product or process disclosed in this publication, or represents that its use by such third party would not infringe privately owned rights.

NUREG/IA-0458
International
Agreement Report
RELAP5/MOD3.3 Analysis of Event with Actuation of Safety Injection System at the Loss of External Power
Prepared by:
A. Prošek, M. Matkovič Jožef Stefan Institute Jamova cesta 39 Sl-1000 Ljubljana, Slovenia K. Tien, NRC Project Manager
Division of Systems Analysis Office of Nuclear Regulatory Research U.S. Nuclear Regulatory Commission Washington, DC 20555-0001
Manuscript Completed: November 2014 Date Published: December 2015 Prepared as part of The Agreement on Research Participation and Technical Exchange Under the Thermal-Hydraulic Code Applications and Maintenance Program (CAMP) Published by U.S. Nuclear Regulatory Commission


iii
ABSTRACT Measured plant data are of great importance for the assessment of thermal-hydraulic system codes. Namely, the integral effects facilities contain atypicalities and scaling distortions relative to full scale plants. On the other hand, the accidents in the plants are very rare and the plant specific data are generally available only for startup tests and operational events. However, the measured plant data may be limited for the full understanding of event. The purpose of this study was therefore both code assessment and better understanding of the plant response to abnormal event, which occurred on 23 March 2011 in Krško nuclear power plant (NPP). The abnormal event was called “Reactor trip and actuation of safety injection system at the loss of external power“. For the analysis the latest RELAP5/MOD3.3 Patch 04 best-estimate thermalhydraulic computer code and standard Krško NPP input deck for RELAP5 have been used. The results show good agreement between measured and simulated data, when all plant system responses and operator actions were considered. This suggests that the RELAP5 code using standard plant input deck is good representative of the plant and could be used for better understanding of the plant response when information on all physical phenomena and processes is not available by plant measured data.


v
CONTENTS --
Page
ABSTRACT ............................................................................................................................... iii
FIGURES .................................................................................................................................. vii
TABLES .................................................................................................................................... ix
EXECUTIVE SUMMARY ........................................................................................................... xi
ACKNOWLEDGMENTS .......................................................................................................... xiii
ABBREVIATIONS .................................................................................................................... xv
1. INTRODUCTION .................................................................................................................. 1
2. ABNORMAL EVENT DESCRIPTION .................................................................................. 3
3. RELAP5 INPUT MODEL AND SCENARIOS DESCRIPTION .............................................. 5 3.1 RELAP5 Input Model ............................................................................................... 5 3.2 RELAP5 Initial and Boundary Conditions ................................................................. 7 3.3 Scenarios Description .............................................................................................. 9
4. RESULTS ...........................................................................................................................13 4.1 Information Obtained from Measured Data .............................................................13 4.2 First Part of Transient .............................................................................................16 4.3 Second Part of Transient ........................................................................................22 4.4 Results Discussion..................................................................................................26
5. CONCLUSIONS ..................................................................................................................27
6. REFERENCES ....................................................................................................................29


vii
FIGURES Page
Figure 1 RELAP5 Krško NPP Hydraulic Components View ............................................... 5 Figure 2 RELAP5 Animation Mask of Steam Dump System For Krško NPP ..................... 7 Figure 3 Measured Turbine First Stage (impulse) Pressure............................................... 7 Figure 4 Measured Feedwater Flow to Steam Generator No. 1 And 2 .............................. 8 Figure 5 Measured Steamline No. 1 and Steamline No. 2 Steam Flow and Total Flow
(Summed Steamline Flows) ................................................................................ 8 Figure 6 Measured Turbine-Generator Rotor Speed ......................................................... 9 Figure 7 TRACE Model of the Input Part of Steam Dump Load Rejection Controller ........11 Figure 8 TRACE Model for Low Steamline Pressure Signal Compensation .....................11 Figure 9 Measured RCS Average and Reference Temperature Signal and the
Corresponding Compensated Signals ................................................................13 Figure 10 Measured Error Temperature Signal for Steam Dump Demand and the
Corresponding Difference Signal between RCS Average and Reference Temperature .......................................................................................................14
Figure 11 Turbine Governor Valve Position Indications ......................................................14 Figure 12 Steam Generators Pressures and Compensated Low Steamline Pressures ......15 Figure 13 Calculated Compensated Low Steamline Pressures as a Function of Lead
Constant .............................................................................................................16 Figure 14 Reactor Power – First Part .................................................................................17 Figure 15 Pressurizer Pressure – First Part ........................................................................17 Figure 16 Cold Leg No. 1 Temperature – First Part ............................................................17 Figure 17 Cold Leg No. 2 Temperature – First Part ............................................................18 Figure 18 Hot Leg No. 1 Temperature – First Part ..............................................................18 Figure 19 Hot Leg No. 2 Temperature – First Part ..............................................................18 Figure 20 RCS Loop No. 1 Average Temperature – First Part ............................................19 Figure 21 RCS Loop No. 2 Average Temperature – First Part ............................................19 Figure 22 Delta Temperature No. 1 – First Part ..................................................................19 Figure 23 Delta Temperature No. 2 – First Part ..................................................................20 Figure 24 Steam Generator No. 1 Pressure – First Part .....................................................20 Figure 25 Steam Generator No. 2 Pressure – First Part .....................................................20 Figure 26 Steam Generator No. 1 Narrow Range Level – First Part ...................................21 Figure 27 Steam Generator No. 2 Narrow Range Level – First Part ...................................21 Figure 28 LO-2 Steam Line No. 1 Pressure Signal – First Part ...........................................21 Figure 29 LO-2 Steam Line No. 2 Pressure Signal – First Part ...........................................22 Figure 30 Reactor Power – Second Part ............................................................................22 Figure 31 Pressurizer Pressure – Second Part ..................................................................23 Figure 32 Cold Leg No. 1 Temperature – Second Part .......................................................23 Figure 33 Cold Leg No. 2 Temperature – Second Part .......................................................23 Figure 34 Hot Leg No. 1 Temperature – Second Part ........................................................24 Figure 35 Hot Leg No. 2 Temperature – Second Part ........................................................24 Figure 36 RCS Loop No. 1 Average Temperature – Second Part ......................................24 Figure 37 RCS Loop No. 2 Average Temperature – Second Part ......................................25 Figure 38 Steam Generator No. 1 Pressure – Second Part ................................................25 Figure 39 Steam Generator No. 2 Pressure – Second Part ................................................25 Figure 40 Steam Generator No. 1 Narrow Range Level – Second Part ..............................26 Figure 41 Steam Generator No. 2 Narrow Range Level – Second Part ..............................26


ix
TABLES Page
Table 1 Reported Sequence of Events ............................................................................. 3 Table 2 Initial Conditions .................................................................................................. 9 Table 3 Scenarios Simulated by RELAP5 Till SI Injection Signal ....................................10 Table 4 TRACE Calculated Minimum Values of Low Pressure Compensated Signals for
Both Steamlines .................................................................................................15


xi
EXECUTIVE SUMMARY
Measured plant data are of great importance for the assessment of thermal-hydraulic system codes. Namely, the integral effects facilities contain atypicalities and scaling distortions relative to full scale plants. On the other hand, the accidents in the plants are very rare and only the plant specific data are generally available for startup tests and operational events. However, the measured plant data may be limited for the full understanding of event.
The purpose of this study was to analyze the abnormal event, which occurred on 23 March 2011 in Krško nuclear power plant (NPP). The abnormal event was called “Reactor trip and actuation of safety injection system at the loss of external power“. The objective was to validate the computer code and also to provide additional information on the time dependence of the values of parameters that are not directly available using the plant instrumentation.
For the analysis the latest RELAP5/MOD3.3 Patch 04 best-estimate thermalhydraulic computer code and standard Krško NPP input deck for RELAP5 have been used. The abnormal event started with spurious activation of 400 kV bus differential protection in the NPP’s 400 kV switchyard, followed by the disconnection of circuit breakers in the bays, resulting in loss of off-site load. Automatic stabilization at house load operation using the turbine control system and steam dump system was not successful to stabilize main steam line pressure. Safety injection actuation and reactor trip occurred on low pressure signal in steam generator no. 1 due to divergent oscillation of pressure in steam generators. The measured data were available for the first four minutes.
The results show good agreement between measured and simulated data, when all plant system responses and operator actions were considered (for example, emergency boration initiated by plant operator was not mentioned in international incident reporting system (IRS) report no. 8300).
It was shown that both before and after SI signal generation it is important to have available plant information about systems behavior. In the opposite the response may deviate. The analysis showed that in such transient when part of information is, the measured data may be used to reproduce some missing information. In the present study the steam dump demand signal was reproduced and the compensated low steam line pressure signals, which caused safety injection signal. When having this information available in addition to plant measurements, the transient could be better understood. The hypothesis done in internal plant analysis that operator manual main feedwater control did not help in secondary pressure stabilization was also confirmed. It seems that almost simultaneous request for opening and closing by turbine control and steam dump load rejection controller was the reason for two fast pressure decrease and consequential safety injection signal (SI) generation. Please note that automatic turbine control is in mode to control the speed of the turbine-generator.
This obtained calculated results suggests that the RELAP5 code using standard plant input deck is good representative of the plant and could be used for better understanding of the plant response when not all information on physical phenomena and processes is available from plant measured data.


xiii
ACKNOWLEDGMENTS
The authors acknowledge the financial support from Krško Nuclear Power Plant and Slovenian Nuclear Safety Administration within CAMP program (project no. POG-U3-KE-R4/104/12 – also NEK no.: 3120118) and from the state budget by the Slovenian Research Agency (program no. P2-0026).


xv
ABBREVIATIONS
ASCII American Standard Code for Information Interchange AC alternate current AFW auxiliary feedwater CVCS chemical and volume control system ECCS emergency core cooling system HPSI high pressure safety injection IAEA International Atomic Energy Agency JSI Jožef Stefan Institute LPSI low pressure safety injection MFW main feedwater MSIV main steam isolation valve NPP Nuclear Power Plant NRC Nuclear Regulatory Commission PORV power operated relief valve PRZ pressurizer RELAP Reactor Excursion and Leak Analysis Program RCP reactor coolant pump RCS reactor coolant system RPV reactor pressure vessel SG steam generator SL surge line SNAP Symbolic Nuclear Analysis Package SSG Specific Safety Guide TB turbine TRACE TRAC/RELAP Advanced Computational Engine


1
1. INTRODUCTION
Measured plant data are of great importance for thermal-hydraulic system code validation, because the integral effects facilities contain atypicalities and scaling distortions relative to full scale plants. Typically, real plant data are limited mostly to operational events. However, especially at unexpected event some plant data may be missing for full understanding besides the fact that the plant measured data are limited both in the number of parameters and number of measured data points (not all history available). Such missing information could be reconstructed provided that transient progression is well simulated, i.e. simulated and measured main plant parameters agree well. The purpose of this study was both validation and better understanding of the plant response to abnormal event. This is in agreement with IAEA SSG-2 (Ref. 1) that accident analyses may be used as a tool for obtaining a full understanding of events that occur during the operation of nuclear power plants and should form an integral part of the feedback from operating experience. According to IAEA SSG-2 (Ref. 1) the objective to analyze operational events may be also to provide additional information on the time dependence of the values of parameters that are not directly available using the plant instrumentation, to check whether the plant operators and plant systems performed as intended and to validate and adjust the models in the computer codes that are used for analyses. In the present work the RELAP5/MOD3.3 analysis of the abnormal event, which occurred on 23 March 2011 in Krško nuclear power plant (NPP) is presented. First the abnormal event is described, followed by standard RELAP5 input model of Krško and scenarios description. The simulated results are then presented and compared to measured data which were available. At the end discussion is given and conclusions.


3
2. ABNORMAL EVENT DESCRIPTION
The abnormal event, which occurred on 23 March 2011 in Krško NPP, started with spurious activation of 400 kV bus differential protection in the NPP’s 400 kV switchyard, followed by the disconnection of circuit breakers in the bays, resulting in loss of off-site load (Ref. 2). To protect the turbine generator, the turbine runback started to adjust to the house load power level. Automatic stabilization at house load operation using the turbine control system and steam dump system was not successful to stabilize main steam line pressure. Safety injection (SI) on low steamline pressure was actuated approximately after 2 minutes, which led to reactor trip and turbine trip. The reported sequence of events is shown in Table 1. The timing is based on measured data. At 10:55, an “unusual event” was declared according to the emergency response procedure classification criteria (loss of power 6.3 kV bus). At that time the power supply to safety buses has been established through the auxiliary transformer and after diesel generators were manually shut down and placed in standby mode. At 12:15, the plant transferred to a “hot standby” mode and the termination of “unusual event” was declared.
The measured data received were available only until time 10:31 what means only first four minutes (or less in case of some parameters). The measured parameters available were reference temperature, turbine first stage impulse pressure, pressurizer pressure, nuclear power, rod position, delta temperatures, overpower and overtemperature delta temperature, hot leg temperatures, cold leg temperatures, average RCS temperatures, turbine-generator rotor speed, turbine governor valves position, steam pressures, steam flows, feedwater flows and steam generator levels. However, there is no information on steam demand, steam dump open logic signals and steam dump flow. Also it was reported that operators in main control room switched feedwater flow control to manual mode with the intention of steam generator level stabilization, but the timing is not available. On the SI signal both diesel generators started and the safety systems loading sequence was performed normally.
Table 1 Reported Sequence of Events
Event Time (hh:mm:ss) loss of off-site load 10:27 turbine overspeed protection started (closure of turbine governor valves with steam dump valve opening)
10:27:01*
alarm ROD BANK LO-LO LIMIT 10:28:18 safety injection signal 10:29:02 “unusal event” was declared 10:55 diesel generator no. 1 (2) stopped 11:20 (11:34) reactor coolant pump no. 1 restarted 11:55 plant transited to a “hot standby” mode, the termination of “unusual event” was declared
12:15
* - estimated from measured data


5
3. RELAP5 INPUT MODEL AND SCENARIOS DESCRIPTION
3.1 RELAP5 Input Model
To perform the analyses, the base RELAP5 input model of Krško NPP has been used. This input model has been validated by plant transients (e.g. Ref. 3). It has been used for several safety analyses including reference calculations for Krško full scope simulator verification (Refs. 4 and 5). The base model consists of 469 control volumes, 497 junctions and 378 heat structures with 2107 radial mesh points. When imported ASCI file into SNAP, the following hydraulic components view has been generated semi automatically (hydraulic components with connections generated automatically, annotations and layout manually). In terms of SNAP this gives 304 hydraulic components and 108 heat structures. Hydraulic components in SNAP consist of both volumes and junctions, where pipe with more volumes is counted as one component. Each heat structure in SNAP connected to pipe is counted as one component in SNAP and not as many heat structures as pipe volumes like counted in RELAP5 output file. This explains the difference in numbers of heat structures in Figure.1 and that reported in RELAP5 output file.
Figure 1 RELAP5 Krško NPP Hydraulic Components View

6
Modeling of the primary side includes the reactor pressure vessel (RPV), both loops (LOOP 1 and 2), the pressurizer (PRZ) vessel, pressurizer surge line (SL), pressurizer spray lines and valves, two pressurizer power operated relief valves (PORVs) and two pressurizer safety valves, chemical and volume control system (CVCS) charging and letdown flow, and reactor coolant pump (RCP) seal flow. The primary loop is represented by the hot leg, primary side of the steam generator (SG), intermediate leg with cold leg loop seal, and cold leg, separately for loop no. 1 and loop no. 2. Emergency core cooling system (ECCS) piping includes high pressure safety injection (HPSI) pumps, accumulators (ACCs), and low pressure safety injection (LPSI) pumps.
The secondary side consists of the SG secondary side, main steam line, main steam isolation valves (MSIVs), SG relief and safety valves, and main feedwater (MFW) piping. The turbine valve is modeled by the corresponding logic. The turbine is represented by time dependent volume. The MFW and AFW (auxiliary feedwater) pumps are modeled as time dependent junctions.
In order to accurately represent the Krško NPP behavior, a considerable number of control variables and general tables are part of the model. They represent protection, monitoring and simplified control systems used only during steady state initialization, as well as the following main plant control systems: (a) rod control system, (b) PRZ pressure control system, (c) PRZ level control system, (d) SG level control system, and (e) steam dump. It must be noted that rod control system has been modeled for point kinetics. The reactor protection system was based on trip logic. It includes reactor trip signal, safety injection signal, turbine trip signal, steam line isolation signal, MFW isolation signal, and AFW start signal. For the simulation of this transient is important steam dump system. During loss of load RCS average temperature control is used, and loss of load controller. There are 10 valves in four groups a, b, c and d and they open according to the temperature error. When fast opening is needed bistables open group a on HI-1 demand (20% capacity), group b on HI-2 demand (30% capacity), group c on HI-3 demand (20% capacity) and group d on HI-4 demand (30% capacity). The steam dump control system is schematically shown in Figure 2, where Krško NPP animation mask is animated with calculated data at time 0 s.

7
Figure 2 RELAP5 Animation Mask of Steam Dump System For Krško NPP
3.2 RELAP5 Initial and Boundary Conditions
Loss of external load has been modeled with artificial turbine control as external perturbation, which is provided in the standard input deck. The turbine external power function was determined from measured turbine first stage pressure (impulse pressure), shown in Figure 3. The turbine external power was needed as input into rod control and steam dump control system.
Figure 3 Measured turbine first stage (impulse) pressure
0
1
2
3
4
5
0 60 120 180 240
Pres
sure
(MPa
)
Time (s)
p-impulse

8
Due to manual operation of main feedwater the measured feedwater flow was used as boundary condition and it is shown in Figure 4. However, as was reported in plant event analysis report, this operator action did not help in secondary pressure stabilization and anyway the triggering of SI signal would be expected.
Figure 4 Measured Feedwater Flow to Steam Generator No. 1 And 2 Total steam flow was initially used as boundary condition because in the standard Krško NPP input deck the secondary side is modelled up to the turbine (see Figure 1) only what means that the RELAP5 model does not have the representative turbine model with turbine overspeed controller. The total flow shown in Figure 5 was obtained by summing the measured steamline no. 1 and steamline no. 2 steam flows.
Figure 5 Measured Steamline No. 1 and Steamline No. 2 Steam Flow and Total Flow (Summed Steamline Flows)
Finally, turbine-generator frequency was also considered for reactor coolant pump operation which is dependent on rotor speed shown in Figure 6. Also, it was the main target of automatic turbine control to maintain the frequency at 50 Hz (speed 1500 rpm).
0
100
200
300
400
500
600
0 60 120 180 240
Mas
s flo
w (k
g/s)
Time (s)
FW 1 flow
FW 2 flow
0
200
400
600
800
1000
1200
0 60 120 180 240
Mas
s flo
w (k
g/s)
Time (s)
total (sum)SL 1 flowSL 2 flow

9
Figure 6 Measured Turbine-Generator Rotor Speed The initial conditions for the simulations are shown in Table 2 and due to good match no additional steady-state calculation was performed.
Table 2 Initial Conditions
Variable Plant measured RELAP5 Reactor power (%) 100.3 100 RCS average temperature (K) 577.96 578.15 Hot leg temperature no. 1 / 2 (K) 596.87 / 596.92 596.79 / 596.79 Cold leg temperature no. 1 / 2 (K) 559.22 / 559.19 559.51 / 559.32 Pressurizer pressure (MPa) 15.509 15.513 Steam generator pressure no. 1 / 2 (MPa) 6.327/6.321 6.438/6.415 Feedwater flow no. 1 / 2 (kg/s) 550.4 / 549.6 541.34 / 544.47 Steam flow no. 1 / 2 (kg/s) 551.8 / 549.3 541.3 / 544.5 Feedwater temperature (K) N.A. 565.55 Steam generator narrow range level (%) 69.29 / 69.22 69.3 / 69.3 RCS boron concentration 1687 ppm 1704 ppm
3.3 Scenarios Description
The simulations were performed in two steps. In the first step the focus was given on transient progression till SI injection signal actuation and in the second step the focus was given on whole transient simulation lasting 4 minutes.
In the first step there were performed some sensitivity runs as shown in Table 3 for operator action and plant responses not mentioned in IRS report (Ref. 2).For example, the IRS 8300 report (Ref. 2) did not reported that operator performed emergency boration. This information was found in the internal plant report on analysis of the event. On the other hand, plant response has been suggested from measured data plots. For example, in the IRS report it was not reported pressurizer PORV opening. Also plant measured data suggested that pressurizer rate sensitive PORV did not open. Namely, in the plant some setpoints may drift, while this was not the case calculation with not disabling pressurizer rate sensitive PORV. Also turbine frequency change influences the reactor coolant pump operation, therefor case was run, when
1400
1450
1500
1550
1600
0 20 40 60 80 100 120
Spee
d (r
pm)
Time (s)
TG rotor

10
this is not considered. Finally, in the base case simulation the reactor power was fine tuned (by boron). Case was also run, if no boration is considered (case with emergency boration has not been performed as start time and the flowrate of injection was not known). It was already mentioned that operator manual main feedwater control did not help in secondary pressure stabilization. Therefore also one simulation case with main feedwater system in automatic was performed to verify this hypothesis.
Table 3 Scenarios Simulated by RELAP5 Till SI Injection Signal Scenario Name Base case (assuming above initial and boundary conditions) base Base case without assuming influence of turbine-generator frequency on RCP flow
w/o frequency
Base case with not disabled rate sensitive pressurizer PORV opening with PRZ PORV Base case without assuming any boration w/o boration Base case (assuming main feedwater system in automatic mode) w/o operator FW
For the whole transient simulation the base case scenario was used. In addition, scenario with assuming some assuming steam release after SI signal was performed as suggested by measured data. Namely, when there is low steam line pressure signal there is also steam line isolation, but measured steam slow at the exit of steam generators was non-zero (the validity sign for measured values was true), indicating that steam was released either through steam dump or the SG PORVs if main steam line isolation occurred (not reported) like suggested by simulation.
In the above calculations the total steam flow was used as boundary condition because both turbine and steam dump flow were not known. The purpose was first to show that if both primary (reactor power) and secondary power (i.e. total steam flow) are matched that the RELAP5 plant model is good representative of the plant response.
Finally, the simulation was performed in which total steam dump flow was predicted from measured signals and in this way the turbine flow was determined and used as input value. Namely, the plant measured average RCS temperature and reference temperature signals were sent through the steam dump load rejection controller to determine the temperature error of the lead-lag compensated signals. This part of load rejection steam dump controller model was built with TRACE as the RELAP5 code is limited by the number of data points for input signals. The TRACE model is shown in Figure 7. The inputs are shown in Figure 8, the highest RCS temperature (auctioneered) being Function 1 and the reference temperature (Tref) being Function 2.

11
Figure 7 TRACE Model of the Input Part of Steam Dump Load Rejection Controller
Similarly, signal for safety injection (SI) on low steamline pressure was also calculated from plant measured data. Again, due to the number of input data points, the TRACE model shown in Figure 8 has been used to calculate the lead-lag compensated signal. There are three channels per steamline and 2 out of 3 on either steamline generate the SI signal. Knowing the value of compensated signal helps in understanding the transient.
Figure 8 TRACE Model for Low Steamline Pressure Signal Compensation


13
4. RESULTS
4.1 Information Obtained from Measured Data
First the information available from the measured data was extracted. As has been already mentioned above, the information on steam dump demand is missing in the measured data. Figure 9 shows the input temperature signals into steam dump controller shown in Figure 7 and the corresponding output lead-lag compensated signals, which are used for load rejection temperature error signal, shown in Figure 10. For comparison, difference signal between RCS average and reference temperature is shown, as this is information normally available to operators. One may see that after first 40 seconds, the temperature error signal is very similar to temperature difference signal. At around 41 second the steam dump group d valves are fully closedclosed. The group c valves started to close at around 65 second. The information on the turbine governor valve position indication is also available, see Figure 11. One may see that before transient start the governor valve (GV) no. 4 was opened 12%, what is accordance with the plant (before modernization with plant uprate three out of four valves were sufficient for 100% turbine flow). After transient start the turbine control closes all four governor valves to prevent overspeed of turbine-generator. Once the speed of turbine-generator started to drop, the first two governor valves (controlled in pair) partially reopen, but after full steam dump operation the first two turbine governor valves started to close again after 17 seconds. However, once steam dump group d valves fully close, the governor valves open again after 41 second. As may be seen, the position of governor valves is then rather constant until 90 s (the first two governor valves are slightly closing and the last two governing valves are slightly opening). When looking steam flow in Figure 5, and steam demand in Figure 10, between 51 and 65 second the steam dump groups a, b and c were fully opened. Then group c started to gradually close. Finally, at around 95 second the governor valves no. 1 and 2 started to close and also slightly steam dump group c. After 100 seconds steam dump group a valves also started to close. These cause overheating and pressure increase. The first reacted turbine control and reopens the valves. Same happened due to steam demand with group b valves and there was pressure drop, and lead-lag compensated signal caused SI signal generation.
Figure 9 Measured RCS Average and Reference Temperature Signal and the Corresponding Compensated Signals
560
565
570
575
580
585
0 20 40 60 80 100 120
Tem
pera
ture
(K)
Time (s)
Tref Tref comp
Tavg Tavg comp

14
Figure 10 Measured Error Temperature Signal for Steam Dump Demand and the Corresponding Difference Signal between RCS Average and Reference
Temperature
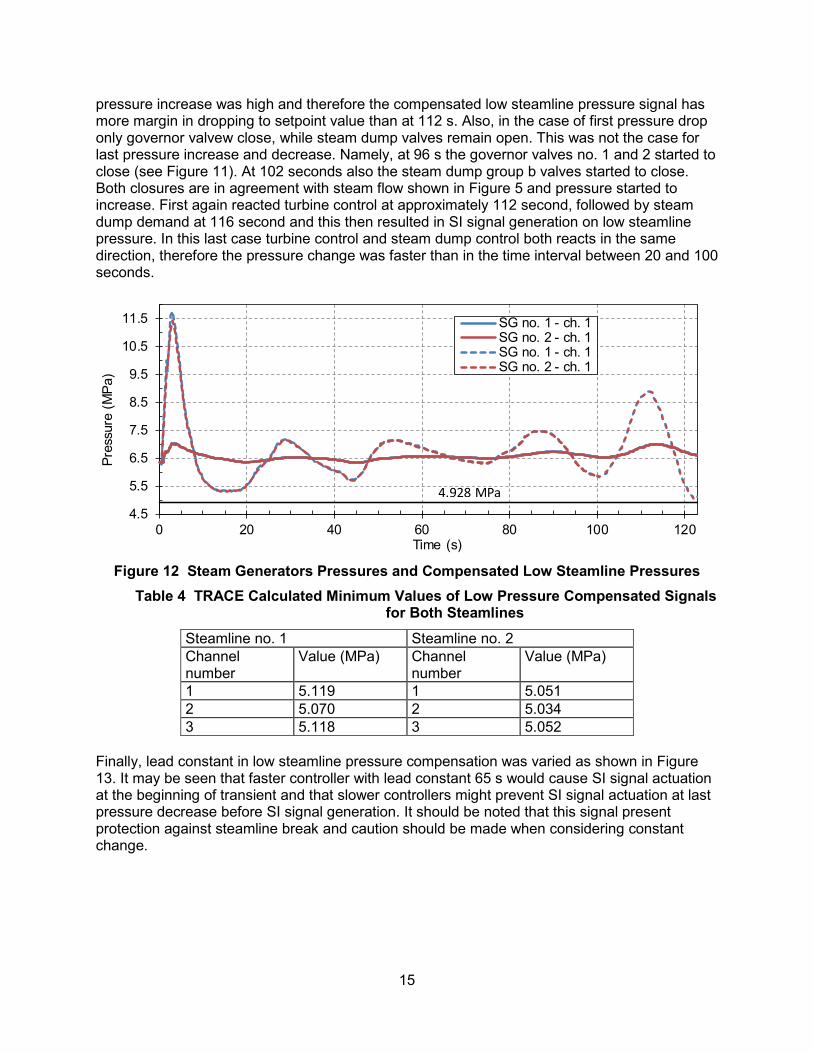
Figure 11 Turbine Governor Valve Position Indications Signal which triggers SI signal generation, is shown in Figure 12. It can be seen that steam generator pressures in both steam generators are very similar. Also, for each steam generator pressure the channel measurements are practically the same, therefore only channel one measurements are presented. The low pressure setpoint is 4.928 MPa. For actuating the SI signal, 2 out of 3 signals are needed. Therefore in Table 4 are shown the minimum values of low pressure steamline pressure compensated signal calculated with TRACE from measured input steam generator pressure signals. In the plant report it was stated that Si signal was triggered because of low pressure in steam generator no. 1. According to calculation, the absolute values of minimum low steamline pressures were higher for steamline no. 1 than steamline no. 2. The reason may be that the setpoint drifted or the real controllers perform slightly different. When comparing dropping rates at 5 seconds and at 112 seconds, it may be seen that drop was more step at 5 seconds, but the reason to not generate SI signal immediately was that initially due to the closure of all turbine governor valves the rate of
0
5
10
15
20
0 20 40 60 80 100 120
Tem
pera
ture
(K)
Time (s)
Tavg comp - Tref comp Tavg-TrefTerr HI-1 Terr HI-2Terr HI-3 Terr HI-4
0
2
4
6
8
10
12
14
0 20 40 60 80 100 120
Posi
tion
(%)
Time (s)
GV1GV2GV3GV4
15
pressure increase was high and therefore the compensated low steamline pressure signal has more margin in dropping to setpoint value than at 112 s. Also, in the case of first pressure drop only governor valvew close, while steam dump valves remain open. This was not the case for last pressure increase and decrease. Namely, at 96 s the governor valves no. 1 and 2 started to close (see Figure 11). At 102 seconds also the steam dump group b valves started to close. Both closures are in agreement with steam flow shown in Figure 5 and pressure started to increase. First again reacted turbine control at approximately 112 second, followed by steam dump demand at 116 second and this then resulted in SI signal generation on low steamline pressure. In this last case turbine control and steam dump control both reacts in the same direction, therefore the pressure change was faster than in the time interval between 20 and 100 seconds.
Figure 12 Steam Generators Pressures and Compensated Low Steamline Pressures Table 4 TRACE Calculated Minimum Values of Low Pressure Compensated Signals
for Both Steamlines
Steamline no. 1 Steamline no. 2 Channel number
Value (MPa) Channel number
Value (MPa)
1 5.119 1 5.051 2 5.070 2 5.034 3 5.118 3 5.052
Finally, lead constant in low steamline pressure compensation was varied as shown in Figure 13. It may be seen that faster controller with lead constant 65 s would cause SI signal actuationat the beginning of transient and that slower controllers might prevent SI signal actuation at last pressure decrease before SI signal generation. It should be noted that this signal present protection against steamline break and caution should be made when considering constant change.
4.5
5.5
6.5
7.5
8.5
9.5
10.5
11.5
0 20 40 60 80 100 120
Pres
sure
(MPa
)
Time (s)
SG no. 1 - ch. 1SG no. 2 - ch. 1SG no. 1 - ch. 1SG no. 2 - ch. 1
4.928 MPa

16
Figure 13 Calculated Compensated Low Steamline Pressures as a Function of Lead Constant
4.2 First Part of Transient
The results of first part simulation are shown in Figures 14 through 29. The comparison between measured and simulated data for scenarios in Table 3 is done. Figure 14 shows that in the simulated case without considering any boration (labelled w/o boration) the core power significantly deviates from the measured data, resulting in deviation of other parameters. Different simulated power influences also all other parameters, shown in Figures 15 through 29. The pressurizer pressure is higher, steam generator pressures are higher and therefore low steam line pressure signals are higher, not resulting in actuating SI signal. The alternate current (AC) frequency change due to changing frequency of the turbo-generator has major influence on power which increases in first few seconds (case w/o frequency). This increases also pressurizer pressure and steam generator pressures, but these increases are less significant than power increase. Base case calculation (labelled base) is performed considering both boration, changing AC frequency and disabling rate sensitive PRZ PORV no. 2. Opening of the PRZ PORV no. 1 and 2 was not reported in first few seconds and this can be seen also from measured pressurizer pressure signal shown in Figure 15. The modification rate sensitive PRZ PORV mainly influences the pressurizer pressure in the initial 13 seconds. It has no influence on the further transient progression. Nevertheless, it is important for deeper understanding of the transient. The simulated results indicate that the plant setpoint for PRZ PORV no. 1 was not challenged. One possible reason may be valve setpoint drift. When not disabling the PRZ PORV no. 2 in calculation (case with PRZ PORV), the pressure initially did not increase much (like in w/o frequency case). The hot leg, cold leg and average temperatures shown in Figures 16 through 21 agree well with measured data for all cases except in the case without boration and in the case when main feedwater pump was in automatic (expected because of different control than in the case of manual operator control). The secondary side plant parameters shown in Figures 24 through 29 are also in good agreement. This resulted that SI signal (see Figures 28 and 29) was generated in the base case calculation as was the case in the plant event.
4.5
5.5
6.5
7.5
8.5
9.5
10.5
11.5
12.5
13.5
0 20 40 60 80 100 120
Pres
sure
(MPa
)
Time (s)
lead constant 65 slead constant 50 slead constant 45 slead constant 40 s
4.928 MPa

17
Figure 14 Reactor Power – First Part
Figure 15 Pressurizer Pressure – First Part
Figure 16 Cold Leg No. 1 Temperature – First Part
50
60
70
80
90
100
110
0 20 40 60 80 100 120
Powe
r (%
)
Time (s)
measuredbasew/o frequencywith PRZ PORVw/o borationw/o operator FW
14.5
15.0
15.5
16.0
16.5
0 20 40 60 80 100 120
Pres
sure
(MPa
)
Time (s)
measuredbasew/o frequencywith PRZ PORVw/o borationw/o operator FW
556
558
560
562
564
566
568
0 20 40 60 80 100 120
Tem
pera
ture
(K)
Time (s)
measuredbasew/o frequencywith PRZ PORVw/o borationw/o operator FW

18
Figure 17 Cold Leg No. 2 Temperature – First Part
Figure 18 Hot Leg No. 1 Temperature – First Part
Figure 19 Hot Leg No. 2 Temperature – First Part
556
558
560
562
564
566
568
0 20 40 60 80 100 120
Tem
pera
ture
(K)
Time (s)
measuredbasew/o frequencywith PRZ PORVw/o borationw/o operator FW
585
588
591
594
597
600
0 20 40 60 80 100 120
Tem
pera
ture
(K)
Time (s)
measuredbasew/o frequencywith PRZ PORVw/o borationw/o operator FW
585
588
591
594
597
600
0 20 40 60 80 100 120
Tem
pera
ture
(K)
Time (s)
measuredbasew/o frequencywith PRZ PORVw/o borationw/o operator FW

19
Figure 20 RCS Loop No. 1 Average Temperature – First Part
Figure 21 RCS Loop No. 2 Average Temperature – First Part
Figure 22 Delta Temperature No. 1 – First Part
570
573
576
579
582
585
0 20 40 60 80 100 120
Tem
pera
ture
(K)
Time (s)
measuredbasew/o frequencywith PRZ PORVw/o borationw/o operator FW
570
573
576
579
582
585
0 20 40 60 80 100 120
Tem
pera
ture
(K)
Time (s)
measuredbasew/o frequencywith PRZ PORVw/o borationw/o operator FW
24
28
32
36
40
0 20 40 60 80 100 120
Tem
pera
ture
(K)
Time (s)
measuredbasew/o frequencywith PRZ PORVw/o borationw/o operator FW

20
Figure 23 Delta Temperature No. 2 – First Part
Figure 24 Steam Generator No. 1 Pressure – First Part
Figure 25 Steam Generator No. 2 Pressure – First Part
24
28
32
36
40
0 20 40 60 80 100 120
Tem
pera
ture
(K)
Time (s)
measuredbasew/o frequencywith PRZ PORVw/o borationw/o operator FW
6.0
6.5
7.0
7.5
8.0
0 20 40 60 80 100 120
Pres
sure
(MPa
)
Time (s)
measuredbasew/o frequencywith PRZ PORVw/o borationw/o operator FW
6.0
6.5
7.0
7.5
8.0
0 20 40 60 80 100 120
Pres
sure
(MPa
)
Time (s)
measuredbasew/o frequencywith PRZ PORVw/o borationw/o operator FW

21
Figure 26 Steam Generator No. 1 Narrow Range Level – First Part
Figure 27 Steam Generator No. 2 Narrow Range Level – First Part
Figure 28 LO-2 Steam Line No. 1 Pressure Signal – First Part
55
60
65
70
75
80
0 20 40 60 80 100 120
Leve
l (%
)
Time (s)
measuredbasew/o frequencywith PRZ PORVw/o borationw/o operator FW
55
60
65
70
75
80
0 20 40 60 80 100 120
Leve
l (%
)
Time (s)
measuredbasew/o frequencywith PRZ PORVw/o borationw/o operator FW
4.5
5.5
6.5
7.5
8.5
9.5
10.5
11.5
0 20 40 60 80 100 120
Pres
sure
(MPa
)
Time (s)
measured (reconstructed)basew/o frequencywith PRZ PORVw/o borationw/o operator FW
4.928 MPa

22
Figure 29 LO-2 Steam Line No. 2 Pressure Signal – First Part
4.3 Second Part of Transient
The results for second part are shown in Figures 30 through 41. Two new simulations were performed in addition to the base case. Besides base case also a case by simulating some steam flow after SI signal actuation (labeled with SG PORV) was performed. Namely, when there is low steam line pressure signal there is also steam line isolation in the calculated cases, but measured steam slow at the exit of steam generators was non-zero, indicating that steam may be released through the SG PORVs if main steam line isolation occurred like suggested by simulation or steam dump if main steamline isolation did not occur. The influence of simulating some steam flow after SI signal is on the cold leg temperatures shown in Figures 32 and 33 and on the steam generator pressures shown in Figures 38 and 39. However, the other primary side parameters were not improved. Finally, the calculation was also performed by specifying turbine flow only (i.e. steam flow was not boundary condition) and steam dump model in the simulation performed well. There is no big difference between base case and case “with TB flow”.
Figure 30 Reactor Power – Second Part
4.5
5.5
6.5
7.5
8.5
9.5
10.5
11.5
0 20 40 60 80 100 120
Pres
sure
(MPa
)
Time (s)
measured (reconstructed)basew/o frequencywith PRZ PORVw/o borationw/o operator FW
4.928 MPa
0
25
50
75
100
0 40 80 120 160 200 240
Powe
r (%
)
Time (s)
measured
base
with SG PORV
with TB flow

23
Figure 31 Pressurizer Pressure – Second Part
Figure 32 Cold Leg No. 1 Temperature – Second Part
Figure 33 Cold Leg No. 2 Temperature – Second Part
13.5
14.0
14.5
15.0
15.5
16.0
16.5
0 40 80 120 160 200 240
Pres
sure
(MPa
)
Time (s)
measured
base
with SG PORV
with TB flow
556
558
560
562
564
566
568
0 40 80 120 160 200 240
Tem
pera
ture
(K)
Time (s)
measured
base
with SG PORV
with PRZ PORV
556
558
560
562
564
566
568
0 40 80 120 160 200 240
Tem
pera
ture
(K)
Time (s)
measured
base
with SG PORV
with TB flow

24
Figure 34 Hot Leg No. 1 Temperature – Second Part
Figure 35 Hot Leg No. 2 Temperature – Second Part
Figure 36 RCS Loop No. 1 Average Temperature – Second Part
555
565
575
585
595
605
0 40 80 120 160 200 240
Tem
pera
ture
(K)
Time (s)
measured
base
with SG PORV
with TB flow
555
565
575
585
595
605
0 40 80 120 160 200 240
Tem
pera
ture
(K)
Time (s)
measured
base
with SG PORV
with PRZ PORV
555
560
565
570
575
580
585
0 40 80 120 160 200 240
Tem
pera
ture
(K)
Time (s)
measured
base
with SG PORV
with TB flow

25
Figure 37 RCS Loop No. 2 Average Temperature – Second Part
Figure 38 Steam Generator No. 1 Pressure – Second Part
Figure 39 Steam Generator No. 2 Pressure – Second Part
555
560
565
570
575
580
585
0 40 80 120 160 200 240
Tem
pera
ture
(K)
Time (s)
measured
base
with SG PORV
with TB flow
6.0
6.5
7.0
7.5
8.0
0 40 80 120 160 200 240
Pres
sure
(MPa
)
Time (s)
measured
base
with SG PORV
withTB flow
6.0
6.5
7.0
7.5
8.0
0 40 80 120 160 200 240
Pres
sure
(MPa
)
Time (s)
measured
base
with SG PORV
with TB FLOW

26
Figure 40 Steam Generator No. 1 Narrow Range Level – Second Part
Figure 41 Steam Generator No. 2 Narrow Range Level – Second Part
4.4 Results Discussion
It was shown that both before and after SI signal generation it is important to have available plant information about systems behavior. In the opposite the response may deviate. The analysis showed that in such transient when part of information is not available, the measured data may be used to reproduce some missing information. In the present study the steam dump demand signal was reproduced and the compensated low steam line pressure signals, which caused safety injection signal. When having this information available in addition to plant measurements, the transient could be better understood. The hypothesis done in internal plant analysis that operator manual main feedwater control did not help in secondary pressure stabilization was also confirmed. It seems that almost simultaneous request for opening and closing by turbine control and steam dump load rejection controller was the reason for two fast pressure decrease and consequential SI signal generation. Please note that automatic turbine control is in mode to control the speed of the turbine-generator.
20
40
60
80
0 40 80 120 160 200 240
Leve
l (%
)
Time (s)
measured
base
with SG PORV
with PRZ PORV
20
40
60
80
0 40 80 120 160 200 240
Leve
l (%
)
Time (s)
measured
base
with SG PORV
with TB flow

27
5. CONCLUSIONS The analysis the latest RELAP5/MOD3.3 Patch 04 best-estimate thermalhydraulic computer code has been performed for the abnormal event with loss of external load, following by safety injection actuation and reactor trip. Comparison of the calculated data with plant measured data suggests that RELAP5 code can accurately simulate such abnormal event. It has been also checked whether the plant operators and plant systems performed as intended. Information on the time dependence of the values of parameters that are not directly observable using the plant instrumentation has been provided. It has been shown how the pressure change influences the low steam pressure signal, which is compensated signal and actuates safety injection signal. The steam dump demand signal was also predicted from the measured data. The hypothesis done in the internal plant analysis that operator manual main feedwater control did not help in secondary pressure stabilization has been also confirmed. It can be concluded that such calculations of plant events provide valuable insights into the plant response.


29
6. REFERENCES
1. INTERNATIONAL ATOMIC ENERGY AGENCY, “Deterministic Safety Analysis forNuclear Power Plants”, Specific Safety Guide, SSG-2, IAEA, Vienna (2009).
2. INTERNATIONAL INCIDENT REPORTING SYSTEM (IRS), Reactor Trip and Actuationof Safety Injection System Caused by the Spurious Activation of Bus Protection in 400KV Switchyard, IRS no. 8300, December 2012.
3. A. Prošek, B. Mavko, “Reactor trip analysis at Krško Nuclear Power Plant”, Internationalagreement report NUREG/IA, 0221, Office of Nuclear Regulatory Research, U.S.Nuclear Regulatory Commission, Washington, 2010, pp. 1-57.
4. A. Prošek, I. Parzer, and B. Krajnc, “Simulation of hypothetical small-break loss-of-coolant accident in modernized nuclear power plant”, Electrotechnical Review, 71(4),2004, pp. 191-196.
5. I. Parzer, B. Mavko, and B. Krajnc, “Simulation of a hypothetical loss-of-feedwateraccident in a modernized nuclear power plant”, Journal of Mechanical Engineering,49(9), 2003, pp. 430-444.


NU
REG
/IA-0458
RELAP5/M
OD
3.3 Analysis of Event with Actuation of Safety Injection System
at the Loss of External Pow
er
Decem
ber 2015