nursing hours per patient day (nhppd) annual report
TRANSCRIPT

Nursing Hours per Patient Day (NHpPD) Annual Report
Nursing and Midwifery Office
1 July 2015 – 30 June 2016

1
Document History
Version # Version Date Author Description
1.0 15/09/2016 Regina Browne To be tabled at WA Health Nursing Workloads Consultative Process (NWCP) Committee
2.0 21/09/2016 Regina Browne
Amendments from WA Health Nursing Workloads Consultative Process (NWCP) Committee have been incorporated.
3.0 13/10/2016 Regina Browne
Inclusion of WACHS Small Hospital/Primary Health Care Centres (SHHC) tables with 2/2/2 roster by region
2
Executive Summary
In the 31st Nursing Hours per Patient Day (NHpPD) report for the period 1 July 2015 to the 30
June 2016, 17 Hospitals and health care facilities with 157 clinical areas across the state of
Western Australia (WA) have provided NHpPD data. Data has been automated from WebPAS
and RoStar to the NHpPD application for the Metropolitan Health Services (MHS) only. Overall
of the 157 reported clinical areas, 154 (98%) were on or above NHpPD target.
Western Australia Country Health Service (WACHS) in collaboration with site managers have
well-established processes in place to monitor nursing workloads and safe staffing within the
Regional Resource Centres (RRC) which include Albany, Broome, Bunbury, Geraldton,
Kalgoorlie and Port Hedland.
During the last reporting period the Integrated District Health Services (IDHS) and Small
Hospitals and Primary Health Care Centres (SHHC) with a 2/2/2 roster were monitored on a
regular basis in respect to workload management and safe staffing principles. There were no
issues raised and no workload grievances during the reporting period.
3
Table of Contents
Document History 1
Executive Summary 2
Introduction 4
Nursing Hours per Patient Day(NHpPD) Reporting 5
Metropolitan Health Service Data 6
WA Country Health Service 7
Regional Resource Centre Data 7
Small Hospital/Primary Health Care Centres 7
Emergency Departments 7
Metropolitan Health Service and Bunbury Emergency Departments 7
Regional Resource Centre Emergency Department 10
Benchmarks and Reclassification 11
Workforce Excellence 12
Undergraduate recruitment 12
Refresher pathway connect 12
Leading Great Care (LGC) 13
Scholarships 14
Nurse Practitioner (NPs) 15
Appendices 16
Appendix 1 - Metropolitan Health Services 16
North Metropolitan Health Service (NMHS) 16
Women and Newborn Health Service (WNHS) – King Edward Memorial Hospital 19
South Metropolitan Health Service (SMHS) 20
East Metropolitan Health Service (EMHS) 23
Child and Adolescent Health Services (CAHS) 25
Appendix 2 West Australian Country Health Service (WACHS) data by region 26
Appendix 3 - Variance reports 30
Appendix 4 – WACHS regional Reporting of Small Hospitals/Primary Health Care Centres (SHHC) with 2.2.2 sites 35
Appendix 5 - WACHS Small Hospitals/Primary Health Care Centres (SHHC) with 2/2/2 roster by region 36
4
Introduction
The Health Services Act 2016 (the Act) replaced the Hospitals and Health Services Act 1927 on
1 July 2016. The Act modernises the way WA Health is governed, structured and managed to
bring decision-making closer to patient care. Key changes under the Act include the
establishment of the Western Australian Department of Health (WA Health) as the System
Manager and health service providers as separate statutory authorities. East Metropolitan
Health Service (EMHS) was established on 1 July 2016 and will provide health services to the
growing communities in the east metropolitan corridor. The establishment of the EMHS, the
reconfiguration of the South Metropolitan Health Services (SMHS) in conjunction with existing
health services will provide a full and comprehensive care to the public of Western Australia
In consultation with the Minister for Health, the WA Health is committed to the ongoing
implementation and monitoring of the NHpPD model as the comprehensive workload
management system for nurses. This report provides a summary of the current workload of
nursing and midwifery staff within our public health care system, and is consistent with the WA
Health’s continued application of NHpPD principles as required by and in accordance with the
‘WA Health – Australian Nursing Federation – Registered Nurses, Midwives, Enrolled (Mental
Health) and Enrolled (Mothercraft) Nurses – Industrial Agreement 2013 at clause 9 and
Schedules A and B the WA Health United Voice – Enrolled Nurses, Assistants in Nursing,
Aboriginal and Ethnic Health Workers Industrial Agreement 2014 at Clause 12 and Schedules A
and B.
Data provided in the 31st report is for the period 1 July 2015 to the 30 June 2016. The report
represents NHpPD data from the following clinical areas:
MHS, inpatient areas
RRC, inpatient areas at, Albany, Broome, Bunbury, Geraldton, Kalgoorlie and Port
Hedland.
MHS Emergency Departments
RRC, Emergency Departments

5
Nursing Hours per Patient Day(NHpPD) Reporting
The NHpPD report provides information on the staffing of wards and units which have been allocated a benchmark target. The report is released 6 monthly to the Australian Nursing Federation (ANF) and United Voice Union by the Minister for Health. The report is designed to show progress against NHpPD targets and to report on areas that have not met their benchmark target. The report presents an overview of all wards in both MHS and RRC. Wards reporting 10% or more below their target nursing hours are tabled within the body of the report. Wards reporting above their target or less than 10% below are included within the appendices. Wards that have reported 10% or more below their target are required to provide a variance report explaining what action is being taken to relieve or alleviate the workload. All variance reports are contained within the appendices.
Table 1 demonstrates that there are 157 wards within the MHS and RRC with 154 wards reporting on or less than 10% below NHpPD target.
Table 1: NHpPD data across MHS and RRC.
Reporting period 1 July 2015 – 30 June 2016
NHpPD reporting
Number of Wards (also represented as total %)
MHS RRC
Above 10% 60 (48%) 26 (84%)
Above 5-10% 20 (16%) 5 (16%)
Above 0-5% 23 (18%) 0
Below 0-5% 11 (9%) 0
Below 5-10% 9 (7%) 0
Below 10% or more
3 (2%) 0
Total Wards 126 31

6
Graph 1 represents data from Table 1 in an alternative format
Graph 1: NHpPD data across MHS and RRC
Metropolitan Health Service Data
This section provides ward inpatient data for MHS hospitals that have reported 10% or more
below their allocated NHpPD target. Table 2 below reflects those wards that were 10% or more
below the set NHpPD target. The variance reports for these inpatient areas are included within
Appendix 3.
Table 2: MHS inpatient wards that are 10% or more below set NHpPD Targets
Hospital Ward
NHpPD reporting
Target YTD Variance between
Target & YTD
% Variance between
target and YTD
Royal Perth Hospital Ward 7A 6 5.24 -0.76 -12.74
Royal Perth Hospital Ward 9A 5.75 5.11 -0.64 -11.14
Royal Perth Hospital Ward 5G 6 5.35 -0.65 -10.86
0
10
20
30
40
50
60
70
80
90
Above 10% Above 5-10%
Above 0-5%
Below 0-5%
Below 5-10%
Tota
l Pe
rce
nta
ge %
NHpPD reporting
NHpPD data across MHS RRC
Metropolitan
Regional
7
WA Country Health Service
Regional Resource Centre Data
All reported inpatient data for RRC are provided in Appendix 2. RRC include Albany, Broome,
Bunbury, Geraldton, Port Hedland and Kalgoorlie Hospitals. All RRC, inpatient wards reported
to be on or above their NHpPD target.
Small Hospital/Primary Health Care Centres
Small Hospitals and Primary Health Care Centres (SHHC) with a 2/2/2 roster were monitored on
a regular basis in respect to workload management and safe staffing principles. There were no
issues raised and no workload grievances for SHHC during the reporting period.
Emergency Departments
Hospitals and Health Services have provided NHpPD data on MHS and RRC Emergency
Departments.
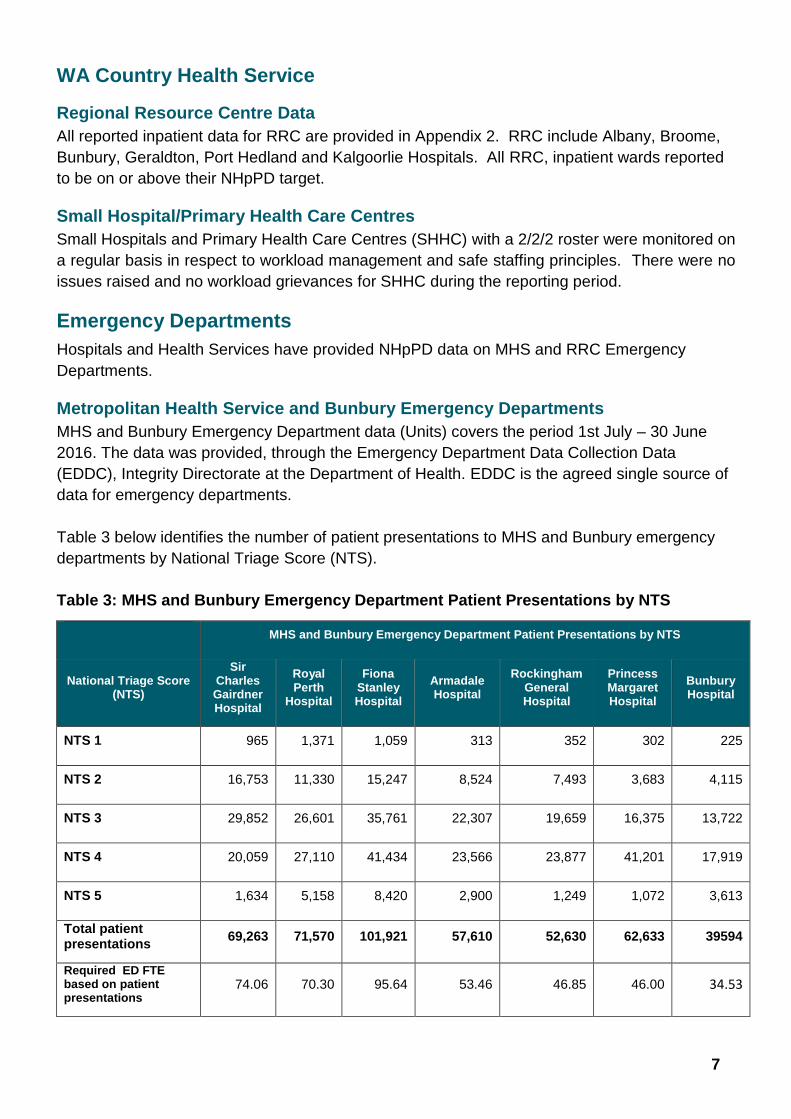
Metropolitan Health Service and Bunbury Emergency Departments
MHS and Bunbury Emergency Department data (Units) covers the period 1st July – 30 June
2016. The data was provided, through the Emergency Department Data Collection Data
(EDDC), Integrity Directorate at the Department of Health. EDDC is the agreed single source of
data for emergency departments.
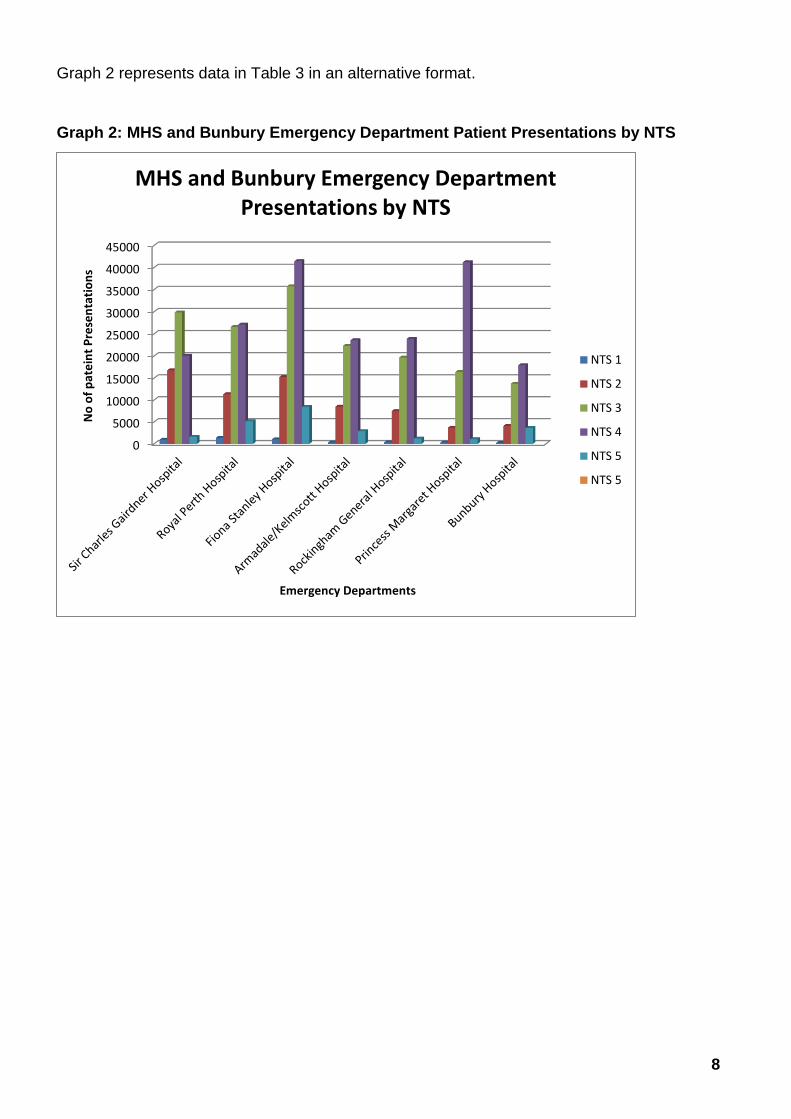
Table 3 below identifies the number of patient presentations to MHS and Bunbury emergency
departments by National Triage Score (NTS).
Table 3: MHS and Bunbury Emergency Department Patient Presentations by NTS
MHS and Bunbury Emergency Department Patient Presentations by NTS
National Triage Score (NTS)
Sir Charles Gairdner Hospital
Royal Perth
Hospital
Fiona Stanley Hospital
Armadale Hospital
Rockingham General Hospital
Princess Margaret Hospital
Bunbury Hospital
NTS 1 965 1,371 1,059 313 352 302 225
NTS 2 16,753 11,330 15,247 8,524 7,493 3,683 4,115
NTS 3 29,852 26,601 35,761 22,307 19,659 16,375 13,722
NTS 4 20,059 27,110 41,434 23,566 23,877 41,201 17,919
NTS 5 1,634 5,158 8,420 2,900 1,249 1,072 3,613
Total patient presentations
69,263 71,570 101,921 57,610 52,630 62,633 39594
Required ED FTE based on patient presentations
74.06 70.30 95.64 53.46 46.85 46.00 34.53
8
Graph 2 represents data in Table 3 in an alternative format.
Graph 2: MHS and Bunbury Emergency Department Patient Presentations by NTS
0
5000
10000
15000
20000
25000
30000
35000
40000
45000
No
of
pat
ein
t P
rese
nta
tio
ns
Emergency Departments
MHS and Bunbury Emergency Department Presentations by NTS
NTS 1
NTS 2
NTS 3
NTS 4
NTS 5
NTS 5
9
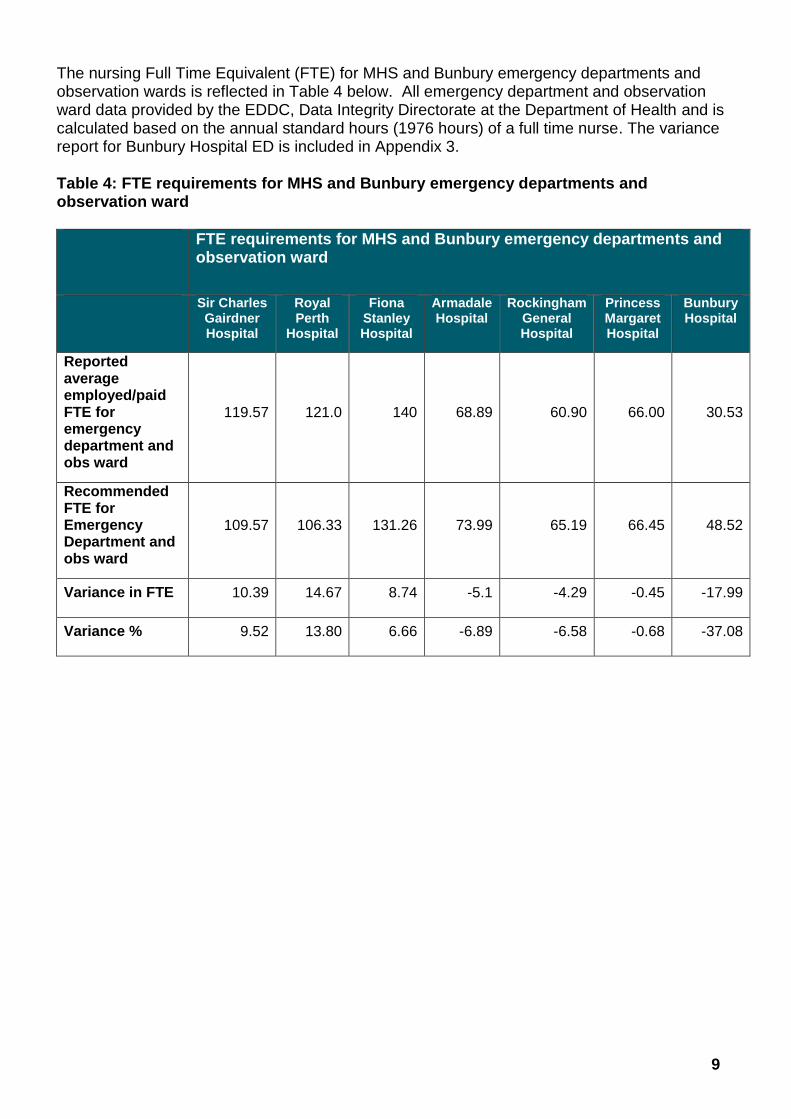
The nursing Full Time Equivalent (FTE) for MHS and Bunbury emergency departments and observation wards is reflected in Table 4 below. All emergency department and observation ward data provided by the EDDC, Data Integrity Directorate at the Department of Health and is calculated based on the annual standard hours (1976 hours) of a full time nurse. The variance report for Bunbury Hospital ED is included in Appendix 3. Table 4: FTE requirements for MHS and Bunbury emergency departments and observation ward
FTE requirements for MHS and Bunbury emergency departments and observation ward
Sir Charles Gairdner Hospital
Royal Perth
Hospital
Fiona Stanley Hospital
Armadale Hospital
Rockingham General Hospital
Princess Margaret Hospital
Bunbury Hospital
Reported average employed/paid FTE for emergency department and obs ward
119.57 121.0 140 68.89 60.90 66.00 30.53
Recommended FTE for Emergency Department and obs ward
109.57 106.33 131.26 73.99 65.19 66.45 48.52
Variance in FTE 10.39 14.67 8.74 -5.1 -4.29 -0.45 -17.99
Variance % 9.52 13.80 6.66 -6.89 -6.58 -0.68 -37.08
10
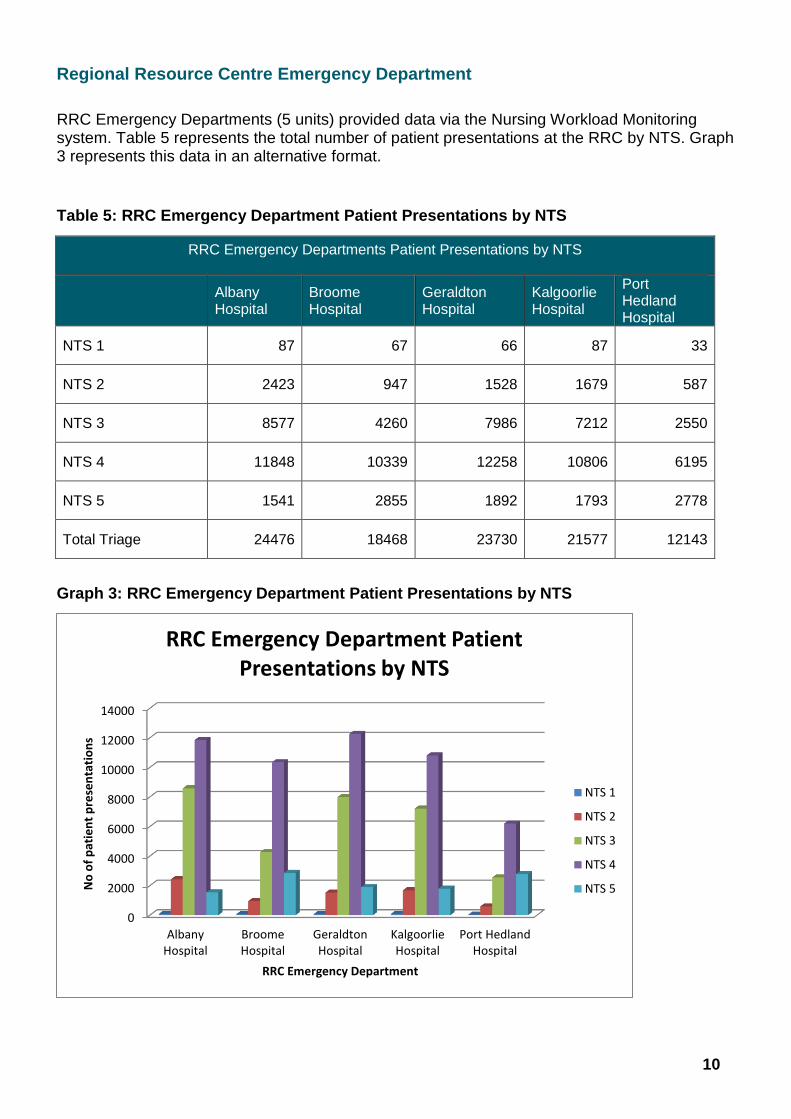
Regional Resource Centre Emergency Department
RRC Emergency Departments (5 units) provided data via the Nursing Workload Monitoring system. Table 5 represents the total number of patient presentations at the RRC by NTS. Graph 3 represents this data in an alternative format.
Table 5: RRC Emergency Department Patient Presentations by NTS
RRC Emergency Departments Patient Presentations by NTS
Albany Hospital
Broome Hospital
Geraldton Hospital
Kalgoorlie Hospital
Port Hedland Hospital
NTS 1 87 67 66 87 33
NTS 2 2423 947 1528 1679 587
NTS 3 8577 4260 7986 7212 2550
NTS 4 11848 10339 12258 10806 6195
NTS 5 1541 2855 1892 1793 2778
Total Triage 24476 18468 23730 21577 12143
Graph 3: RRC Emergency Department Patient Presentations by NTS
0
2000
4000
6000
8000
10000
12000
14000
AlbanyHospital
BroomeHospital
GeraldtonHospital
KalgoorlieHospital
Port HedlandHospital
No
of
pat
ien
t p
rese
nta
tio
ns
RRC Emergency Department
RRC Emergency Department Patient Presentations by NTS
NTS 1
NTS 2
NTS 3
NTS 4
NTS 5
11
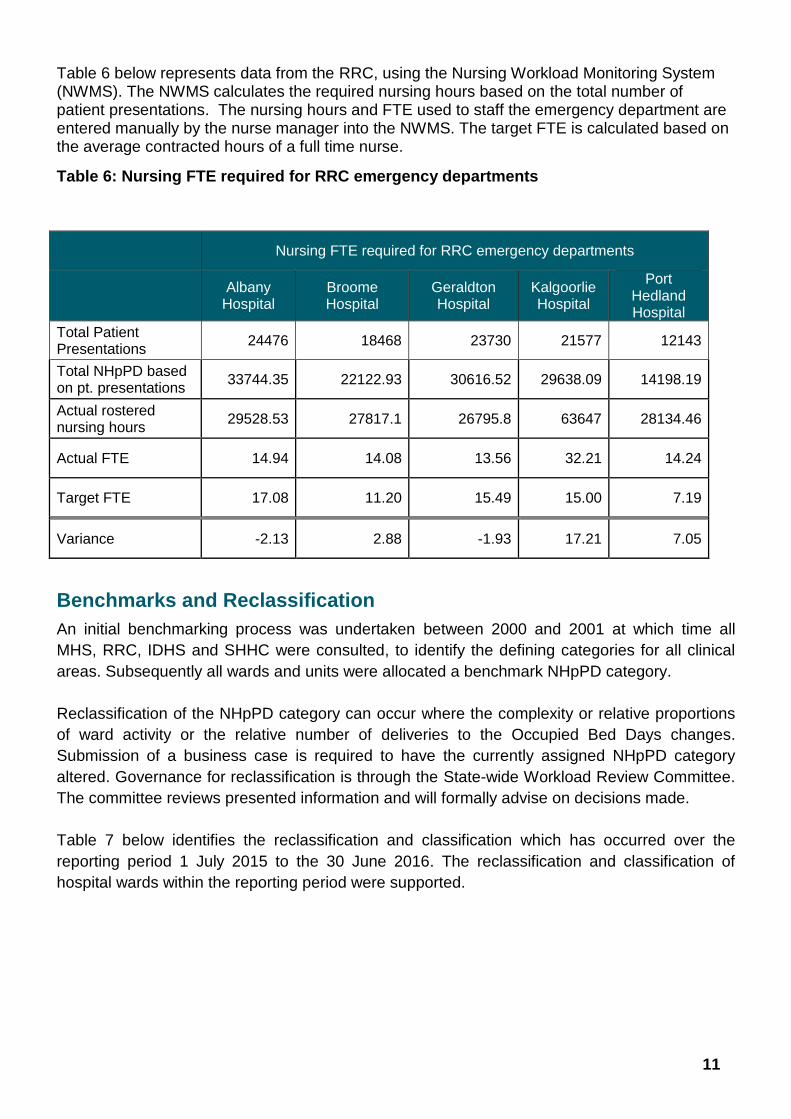
Table 6 below represents data from the RRC, using the Nursing Workload Monitoring System (NWMS). The NWMS calculates the required nursing hours based on the total number of patient presentations. The nursing hours and FTE used to staff the emergency department are entered manually by the nurse manager into the NWMS. The target FTE is calculated based on the average contracted hours of a full time nurse.
Table 6: Nursing FTE required for RRC emergency departments
Benchmarks and Reclassification
An initial benchmarking process was undertaken between 2000 and 2001 at which time all
MHS, RRC, IDHS and SHHC were consulted, to identify the defining categories for all clinical
areas. Subsequently all wards and units were allocated a benchmark NHpPD category.
Reclassification of the NHpPD category can occur where the complexity or relative proportions
of ward activity or the relative number of deliveries to the Occupied Bed Days changes.
Submission of a business case is required to have the currently assigned NHpPD category
altered. Governance for reclassification is through the State-wide Workload Review Committee.
The committee reviews presented information and will formally advise on decisions made.
Table 7 below identifies the reclassification and classification which has occurred over the
reporting period 1 July 2015 to the 30 June 2016. The reclassification and classification of
hospital wards within the reporting period were supported.
Nursing FTE required for RRC emergency departments
Albany Hospital
Broome Hospital
Geraldton Hospital
Kalgoorlie Hospital
Port Hedland Hospital
Total Patient Presentations
24476 18468 23730 21577 12143
Total NHpPD based on pt. presentations
33744.35 22122.93 30616.52 29638.09 14198.19
Actual rostered nursing hours
29528.53 27817.1 26795.8 63647 28134.46
Actual FTE 14.94 14.08 13.56 32.21 14.24
Target FTE 17.08 11.20 15.49 15.00 7.19
Variance -2.13 2.88 -1.93 17.21 7.05

12
Table 7: Hospital wards that have applied for reclassification
Hospital Ward Previous NHpPD
category Revised NHpPD
category
Armadale Hospital Maternity Unit 5.0 7.02
King Edward Memorial Hospital
Mother and Baby Unit
New classification 12.0
Workforce Excellence
Nursing and Midwifery Office (NMO) strategic commitment is to enable workforce excellence by extending the capacity and capabilities of nursing and midwifery to achieve and embed a culture of performance.
Undergraduate recruitment
GradConnect is the primary method of recruitment for nursing and midwifery graduates
within WA Health or participating private partner (Ramsey Healthcare) and is coordinated by
the NMO. Intakes of graduates occur in March and July each year. Table 8 reflects the total
number of graduate positions for 2017 within WA Health including private partner (Ramsey
Healthcare). Total number of graduate positions is determined by the Health Service
Providers (HSPs) on a calendar year basis.
Table 8: Total Number of graduate positions for 2017
*Total Number of graduate positions
Year Registered
Nurse
Enrolled
Nurse Midwife
2017 569 120 46
* Number of graduate positions may vary as HSPs are afforded to offer the most appropriate number of positions to meet the needs of the HSP
Refresher pathway connect
The NMO has an ongoing commitment to support refresher programs for enrolled nurses,
registered nurses and midwives who wish to return to the acute clinical setting. The
Refresher Pathway Connect (RPC) program is designed to enhance clinical skills and
knowledge for nurses and midwives, who are currently registered with the Nursing and
Midwifery Board of Australia but have not practiced clinically in the last 5 years and wish to
return to acute clinical area. RPC offers flexible options for refresher nurses or midwives in a
full time or part time capacity.
13
The RPC participant completes theoretical assessments via online learning modules prior to
commencing full-time or part-time employment, where they then undertake assessment of
clinical competencies, reflective practice with formative assessment and development over
three months. To be eligible to apply for a position applicants must be permanent Australian
resident and have no restrictions on their nursing/midwifery registration.
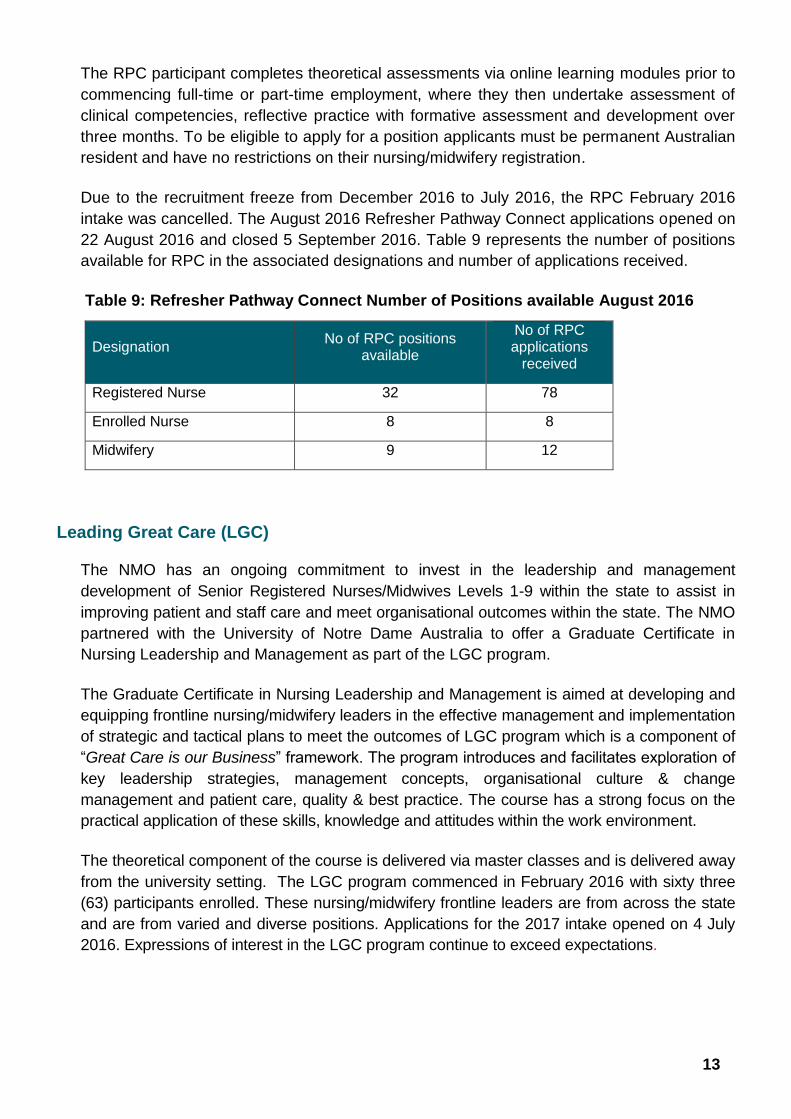
Due to the recruitment freeze from December 2016 to July 2016, the RPC February 2016
intake was cancelled. The August 2016 Refresher Pathway Connect applications opened on
22 August 2016 and closed 5 September 2016. Table 9 represents the number of positions
available for RPC in the associated designations and number of applications received.
Table 9: Refresher Pathway Connect Number of Positions available August 2016
Designation No of RPC positions
available
No of RPC applications
received
Registered Nurse 32 78
Enrolled Nurse 8 8
Midwifery 9 12
Leading Great Care (LGC)
The NMO has an ongoing commitment to invest in the leadership and management
development of Senior Registered Nurses/Midwives Levels 1-9 within the state to assist in
improving patient and staff care and meet organisational outcomes within the state. The NMO
partnered with the University of Notre Dame Australia to offer a Graduate Certificate in
Nursing Leadership and Management as part of the LGC program.
The Graduate Certificate in Nursing Leadership and Management is aimed at developing and
equipping frontline nursing/midwifery leaders in the effective management and implementation
of strategic and tactical plans to meet the outcomes of LGC program which is a component of
“Great Care is our Business” framework. The program introduces and facilitates exploration of
key leadership strategies, management concepts, organisational culture & change
management and patient care, quality & best practice. The course has a strong focus on the
practical application of these skills, knowledge and attitudes within the work environment.
The theoretical component of the course is delivered via master classes and is delivered away
from the university setting. The LGC program commenced in February 2016 with sixty three
(63) participants enrolled. These nursing/midwifery frontline leaders are from across the state
and are from varied and diverse positions. Applications for the 2017 intake opened on 4 July
2016. Expressions of interest in the LGC program continue to exceed expectations.
14
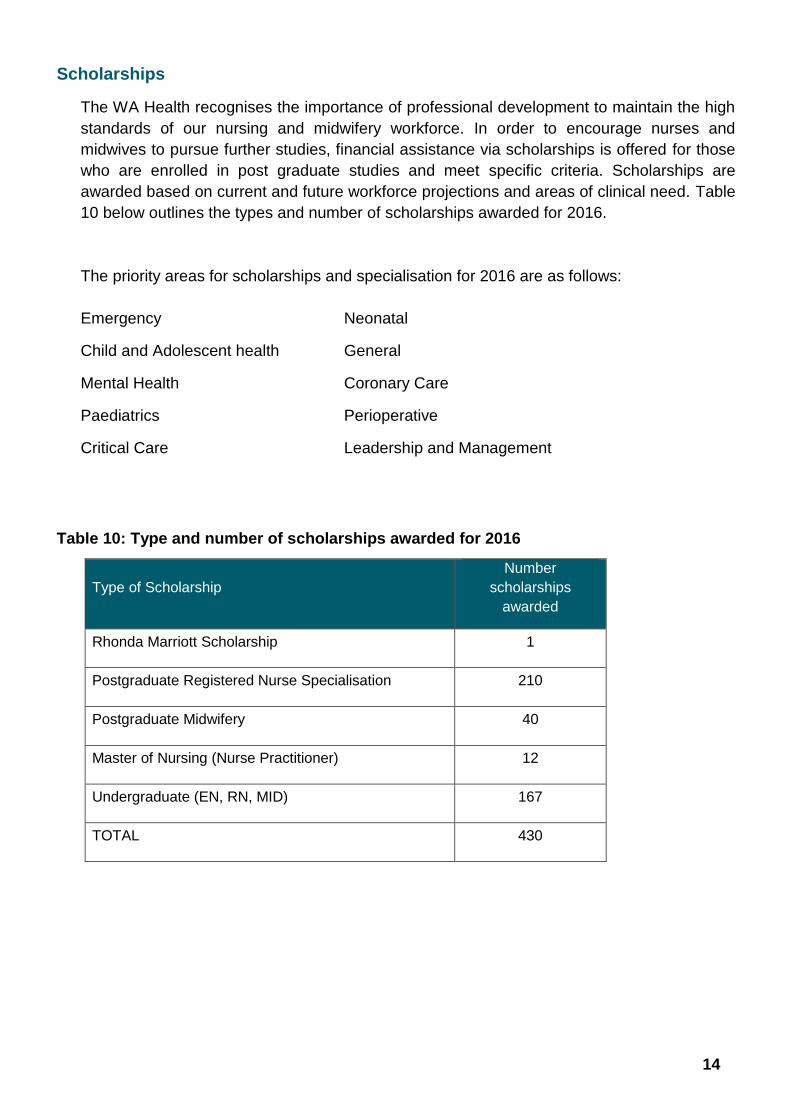
Scholarships
The WA Health recognises the importance of professional development to maintain the high
standards of our nursing and midwifery workforce. In order to encourage nurses and
midwives to pursue further studies, financial assistance via scholarships is offered for those
who are enrolled in post graduate studies and meet specific criteria. Scholarships are
awarded based on current and future workforce projections and areas of clinical need. Table
10 below outlines the types and number of scholarships awarded for 2016.
The priority areas for scholarships and specialisation for 2016 are as follows:
Emergency Neonatal
Child and Adolescent health General
Mental Health Coronary Care
Paediatrics Perioperative
Critical Care Leadership and Management
Table 10: Type and number of scholarships awarded for 2016
Type of Scholarship
Number
scholarships
awarded
Rhonda Marriott Scholarship 1
Postgraduate Registered Nurse Specialisation 210
Postgraduate Midwifery 40
Master of Nursing (Nurse Practitioner) 12
Undergraduate (EN, RN, MID) 167
TOTAL 430
15
Nurse Practitioner (NPs)
As of March 2016, 1380 Registered Nurses with NPs endorsement are registered with the
Nursing and Midwifery Board of Australia. Of these 232 identified WA as their place of
residency. WA has the fourth highest number of endorsed NPs behind Queensland, New
South Wales and Victoria.
In 2014 Credentialing and Defining Scope of Clinical Practice for Health Professionals
(Nursing and Midwifery) in WA Health Services – A Policy Handbook via OD 0505/14 was
introduced. WA Health agreed to support credentialing of eligible midwives and nurse
practitioners into public health facilities. The policy is intended to apply to all nurse
practitioners and eligible midwives working in the WA public health system and is to be used
in conjunction with existing organisational policies.
The aim is to ensure the provision of safe, high quality health care services within specific
organisational environments. A scope of clinical practice is part of the credentialing process
and defines the clinical practice that a health practitioner is permitted to conduct at a
particular health care facility.
16
Appendices
Appendix 1 - Metropolitan Health Services
North Metropolitan Health Service (NMHS)
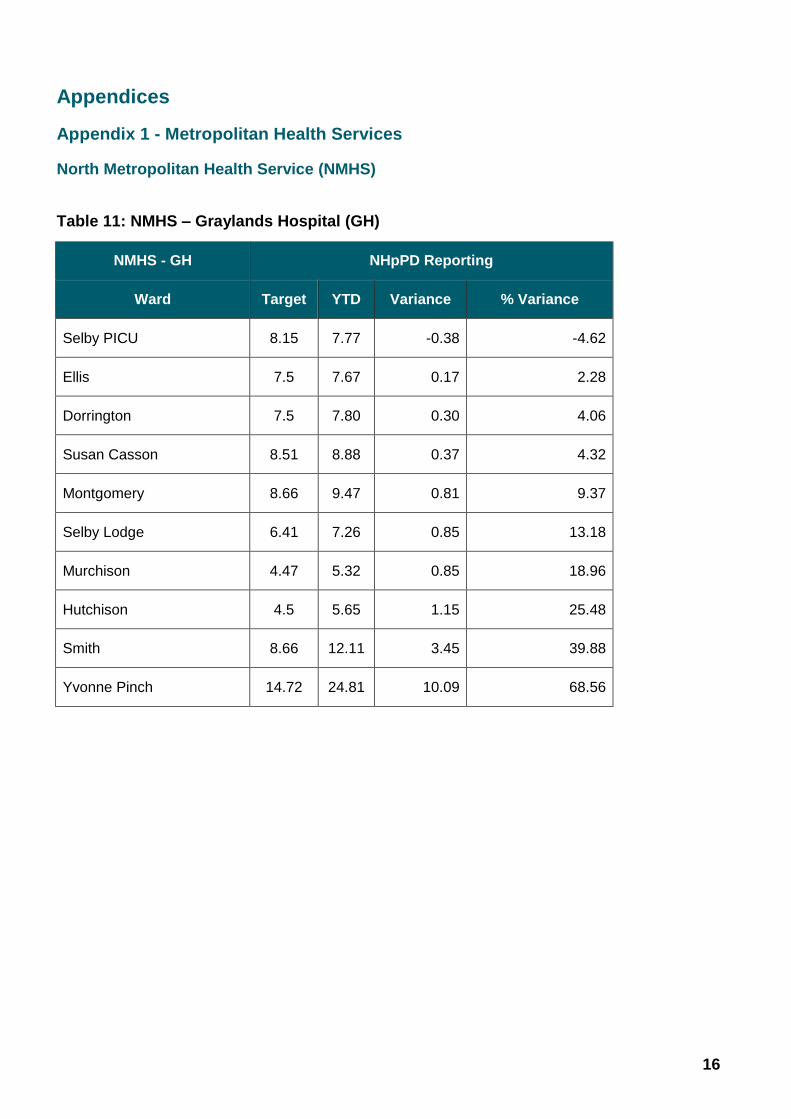
Table 11: NMHS – Graylands Hospital (GH)
NMHS - GH NHpPD Reporting
Ward Target YTD Variance % Variance
Selby PICU 8.15 7.77 -0.38 -4.62
Ellis 7.5 7.67 0.17 2.28
Dorrington 7.5 7.80 0.30 4.06
Susan Casson 8.51 8.88 0.37 4.32
Montgomery 8.66 9.47 0.81 9.37
Selby Lodge 6.41 7.26 0.85 13.18
Murchison 4.47 5.32 0.85 18.96
Hutchison 4.5 5.65 1.15 25.48
Smith 8.66 12.11 3.45 39.88
Yvonne Pinch 14.72 24.81 10.09 68.56

17
Table 12: NMHS – Osborne Park Hospital (OPH)
NMHS - OPH NHpPD Reporting
Ward Target YTD Variance % Variance
Ward 3 Aged Care & Rehab
5 4.89 -0.11 -2.18
Ward 4 Rehab 5.75 5.67 -0.08 -1.41
Ward 5 Aged Care & Rehab
5.33 5.28 -0.05 -0.98
Ward 6 Surgical 5.75 6.04 0.29 4.99
Maternity 8.97 9.74 0.77 8.59
18
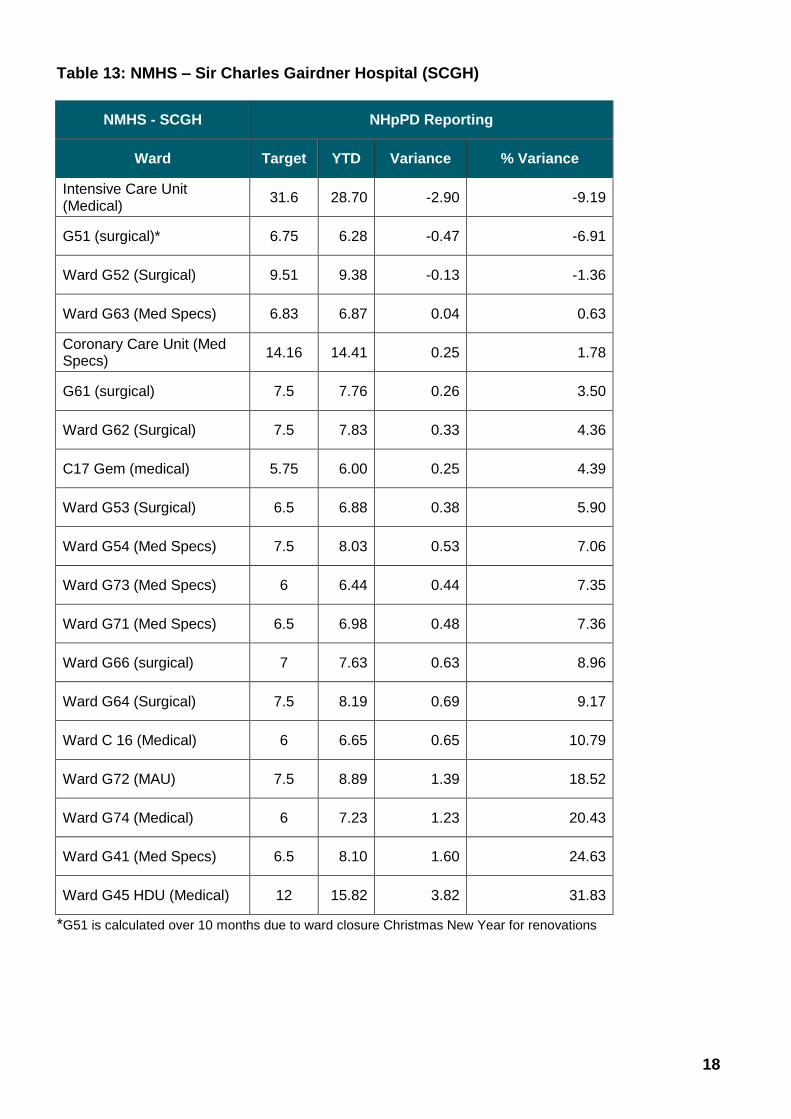
Table 13: NMHS – Sir Charles Gairdner Hospital (SCGH)
NMHS - SCGH NHpPD Reporting
Ward Target YTD Variance % Variance
Intensive Care Unit (Medical)
31.6 28.70 -2.90 -9.19
G51 (surgical)* 6.75 6.28 -0.47 -6.91
Ward G52 (Surgical) 9.51 9.38 -0.13 -1.36
Ward G63 (Med Specs) 6.83 6.87 0.04 0.63
Coronary Care Unit (Med Specs)
14.16 14.41 0.25 1.78
G61 (surgical) 7.5 7.76 0.26 3.50
Ward G62 (Surgical) 7.5 7.83 0.33 4.36
C17 Gem (medical) 5.75 6.00 0.25 4.39
Ward G53 (Surgical) 6.5 6.88 0.38 5.90
Ward G54 (Med Specs) 7.5 8.03 0.53 7.06
Ward G73 (Med Specs) 6 6.44 0.44 7.35
Ward G71 (Med Specs) 6.5 6.98 0.48 7.36
Ward G66 (surgical) 7 7.63 0.63 8.96
Ward G64 (Surgical) 7.5 8.19 0.69 9.17
Ward C 16 (Medical) 6 6.65 0.65 10.79
Ward G72 (MAU) 7.5 8.89 1.39 18.52
Ward G74 (Medical) 6 7.23 1.23 20.43
Ward G41 (Med Specs) 6.5 8.10 1.60 24.63
Ward G45 HDU (Medical) 12 15.82 3.82 31.83
*G51 is calculated over 10 months due to ward closure Christmas New Year for renovations

19
Women and Newborn Health Service (WNHS) – King Edward Memorial Hospital
Table 14: WNHS – King Edward Memorial Hospital (KEMH)
WNHS - KEMH NHpPD Reporting
Ward Target YTD Variance % Variance
Obstetrics Ward 3 6 6.86 0.86 14.33
Obstetrics Ward 5 6 6.97 0.97 16.13
Gynaecology Ward 6 6 7.84 1.84 30.72
Adult Special Care Unit 12 15.99 3.99 33.24
Mother Baby Unit 12 16.87 4.87 40.58
Obstetrics Ward 4 6 9.51 3.51 58.54

20
South Metropolitan Health Service (SMHS)
Table 15: SMHS - Fiona Stanley Hospital (FSH)
SMHS - FSH NHpPD Reporting
Ward Target YTD Variance % Variance
3B 12 10.89 -1.11 -9.28
5D +Resp HDU 7.95 7.30 -0.65 -8.23
4C 7.5 7.34 -0.16 -2.19
SRC - Ward B 6 6.01 0.01 0.15
SRC - Ward A 5.75 5.85 0.10 1.68
4D 7.5 7.70 0.20 2.70
7D + BMTU 6.61 6.83 0.22 3.39
SRC - Ward 2A 5.75 5.96 0.21 3.62
5C 6.5 6.77 0.27 4.13
MHU- Ward A 12 12.59 0.59 4.90
6D 6 6.38 0.38 6.38
7B ASU 7.5 7.99 0.49 6.57
7C 6 6.45 0.45 7.51
Coronary Care Unit 14.16 15.30 1.14 8.04
6A 6 6.86 0.86 14.40
6B 6 6.97 0.96 16.08
6C 6 6.99 0.99 16.44
4A 6 7.01 1.01 16.88
SRC - Ward 1A 7.5 8.82 1.32 17.53
Intensive Care Unit 31.6 37.66 6.06 19.19

21
Ward Target YTD Variance % Variance
7A 6 7.25 1.25 20.75
MHU - MBU 12 16.37 4.37 36.45
MHU - Ward B 12 20.01 8.01 66.75
3A 6 10.18 4.18 69.71
AMU 5A &B +HDU 9.18 18.18 9.00 97.98
3DS 6 17.13 11.13 185.53
Birth suite 10.56 37.45 26.89 254.63
Day Surgical Unit 4.37 64.80 60.43 1382.88

22
Table 16: SMHS - Fremantle Hospital (FH)
SMHS - FH NHpPD Reporting
Ward Target YTD Variance % Variance
Ward 5.1 (MH) 6 6.23 0.23 3.90
Ward V6 5.75 6.04 0.29 5.04
Ward 4.1 (MH) 11.2 11.78 0.58 5.14
Ward 4.2 (MH) 6 6.34 0.34 5.72
Restorative Unit 5.75 6.34 0.59 10.25
Ward B9S 5.75 6.56 0.81 14.07
Ward B7N 5.75 7.04 1.29 22.48
Ward B8S 5.75 7.05 1.30 22.52
Ward 4.3 (MH) 6 7.57 1.57 26.13
Intensive Care Unit 12 27.10 15.10 125.83
Table 17: SMHS - Rockingham General Hospital RGH)
SMHS – RGH NHpPD Reporting
Ward Target YTD Variance % Variance
Aged Care Rehab Unit 5.75 5.60 -0.15 -2.65
Intensive Care Unit 23.7 23.31 -0.39 -1.64
Medical 5.75 5.87 0.12 2.07
Multi Stay Surgical Unit 5.75 6.09 0.34 5.88
Obstetrics/Maternity 10.68 12.18 1.50 14.02
Medical Assessment Unit 6 10.42 4.42 73.60
Paediatrics Ward 6 15.04 9.04 150.69
Mental Health Adult (open) 6 17.67 11.67 194.46
23
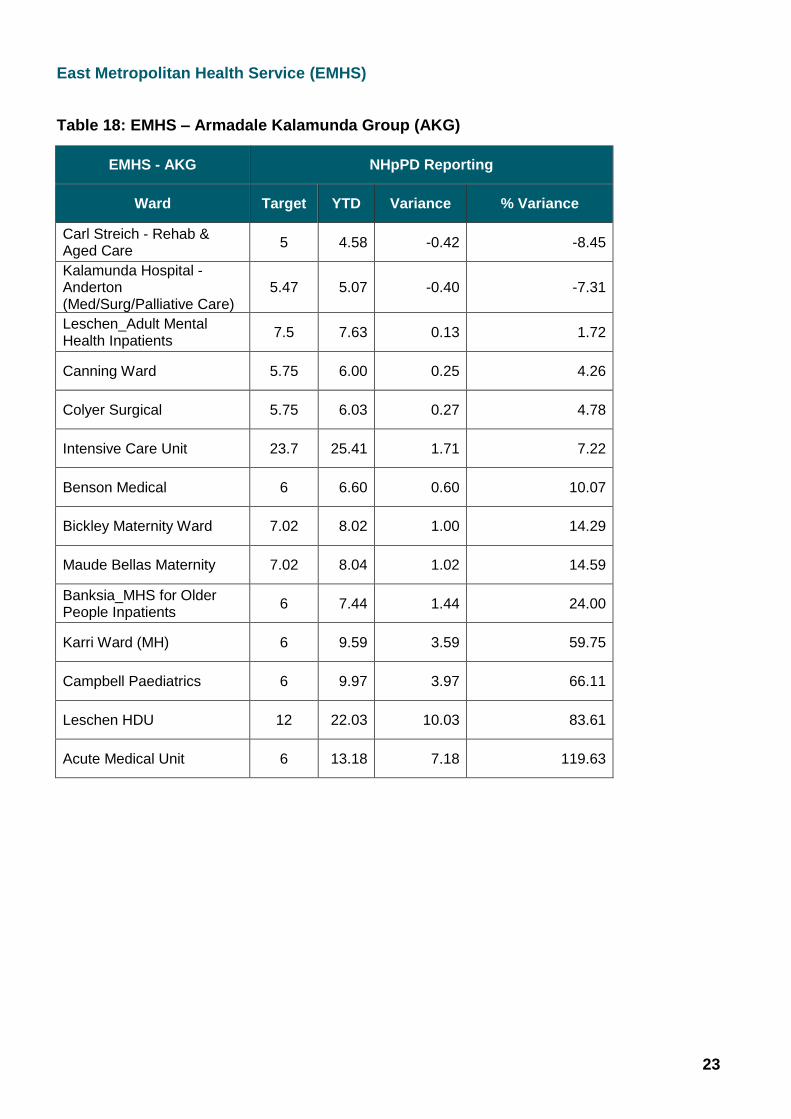
East Metropolitan Health Service (EMHS)
Table 18: EMHS – Armadale Kalamunda Group (AKG)
EMHS - AKG NHpPD Reporting
Ward Target YTD Variance % Variance
Carl Streich - Rehab & Aged Care
5 4.58 -0.42 -8.45
Kalamunda Hospital - Anderton (Med/Surg/Palliative Care)
5.47 5.07 -0.40 -7.31
Leschen_Adult Mental Health Inpatients
7.5 7.63 0.13 1.72
Canning Ward 5.75 6.00 0.25 4.26
Colyer Surgical 5.75 6.03 0.27 4.78
Intensive Care Unit 23.7 25.41 1.71 7.22
Benson Medical 6 6.60 0.60 10.07
Bickley Maternity Ward 7.02 8.02 1.00 14.29
Maude Bellas Maternity 7.02 8.04 1.02 14.59
Banksia_MHS for Older People Inpatients
6 7.44 1.44 24.00
Karri Ward (MH) 6 9.59 3.59 59.75
Campbell Paediatrics 6 9.97 3.97 66.11
Leschen HDU 12 22.03 10.03 83.61
Acute Medical Unit 6 13.18 7.18 119.63

24
Table 19: EMHS – Bentley Hospital (BH)
EMHS - BH NHpPD Reporting
Ward Target YTD Variance % Variance
Adult Acute Ward 7 6 5.49 -0.51 -8.43
Adult Acute Ward 8 6 6.04 0.04 0.69
Secure Unit Ward 6 11.2 11.80 0.60 5.34
Ward 4 5 5.59 0.59 11.85
Ward 3 Medical/ Surgical 5 7.55 2.55 51.00
Ward 2 Maternity 6.86 13.42 6.56 95.57
Table 20: EMHS – Royal Perth Hospital (RPH)
EMHS - RPH NHpPD Reporting
Ward Target YTD Variance % Variance
Ward 7A 6 5.24 -0.76 -12.74
Ward 9A 5.75 5.11 -0.64 -11.14
Ward 5G 6 5.35 -0.65 -10.86
Ward 2K 6 5.46 -0.54 -9.08
Ward 9C 6.85 6.32 -0.53 -7.73
Ward 5H 7.5 7.45 -0.05 -0.63
Ward 8A 6 5.98 -0.02 -0.35
Ward 10C 6 6.47 0.47 7.81
Ward 6G 6 6.79 0.79 13.15
Ward 10A 6 8.64 2.64 43.92
Ward 3H 5.75 8.71 2.96 51.51
25
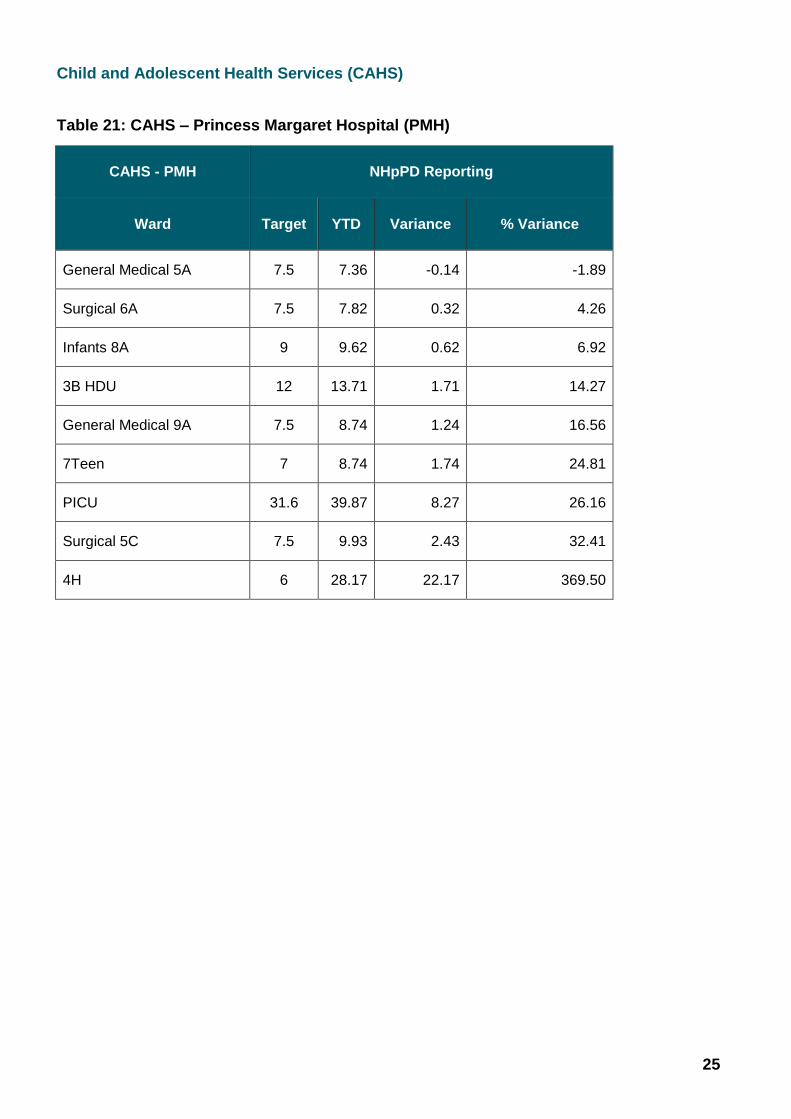
Child and Adolescent Health Services (CAHS)
Table 21: CAHS – Princess Margaret Hospital (PMH)
CAHS - PMH NHpPD Reporting
Ward Target YTD Variance % Variance
General Medical 5A 7.5 7.36 -0.14 -1.89
Surgical 6A 7.5 7.82 0.32 4.26
Infants 8A 9 9.62 0.62 6.92
3B HDU 12 13.71 1.71 14.27
General Medical 9A 7.5 8.74 1.24 16.56
7Teen 7 8.74 1.74 24.81
PICU 31.6 39.87 8.27 26.16
Surgical 5C 7.5 9.93 2.43 32.41
4H 6 28.17 22.17 369.50

26
Appendix 2 West Australian Country Health Service (WACHS) data by region
Table 22: WACHS- Great Southern
Albany Regional Hospital
NHpPD Reporting
Ward Category Target YTD Variance % Variance
Ward A Surgical C 5.75 6.00 1.04 18.13
Ward B Maternity D+Deliv (Albany)
9.95 10.90 1.10 11.01
Ward C Paediatric /Medical /Surgical
C&D (Albany)
5.5 5.30 0.96 17.51
Ward E Medical / General D 5 4.75 0.95 19.02
Ward G Mental Health A&C
(Albany) 6.28 8.83 1.41 22.39
High Dependency Unit HDU 12 15.05 1.25 10.45
Dialysis Unit Satellite Dialysis
2.18 2.36 1.08 49.57
27
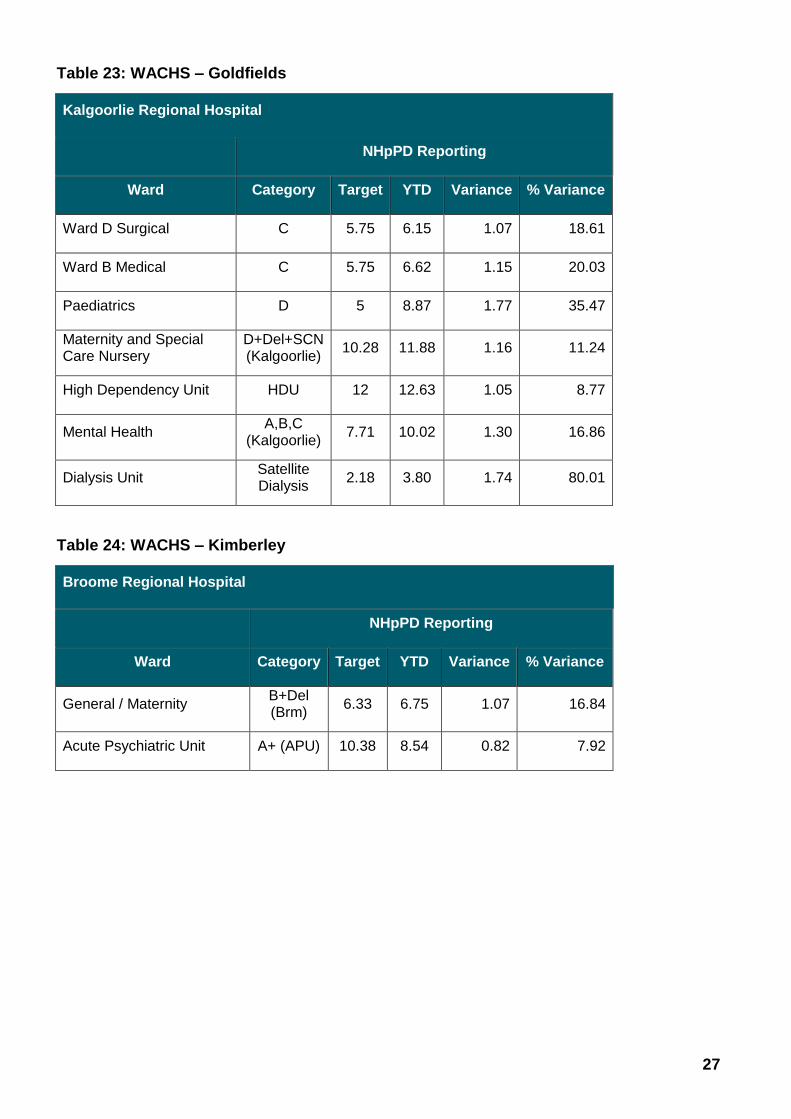
Table 23: WACHS – Goldfields
Kalgoorlie Regional Hospital
NHpPD Reporting
Ward Category Target YTD Variance % Variance
Ward D Surgical C 5.75 6.15 1.07 18.61
Ward B Medical C 5.75 6.62 1.15 20.03
Paediatrics D 5 8.87 1.77 35.47
Maternity and Special Care Nursery
D+Del+SCN (Kalgoorlie)
10.28 11.88 1.16 11.24
High Dependency Unit HDU 12 12.63 1.05 8.77
Mental Health A,B,C
(Kalgoorlie) 7.71 10.02 1.30 16.86
Dialysis Unit Satellite Dialysis
2.18 3.80 1.74 80.01
Table 24: WACHS – Kimberley
Broome Regional Hospital
NHpPD Reporting
Ward Category Target YTD Variance % Variance
General / Maternity B+Del (Brm)
6.33 6.75 1.07 16.84
Acute Psychiatric Unit A+ (APU) 10.38 8.54 0.82 7.92
28
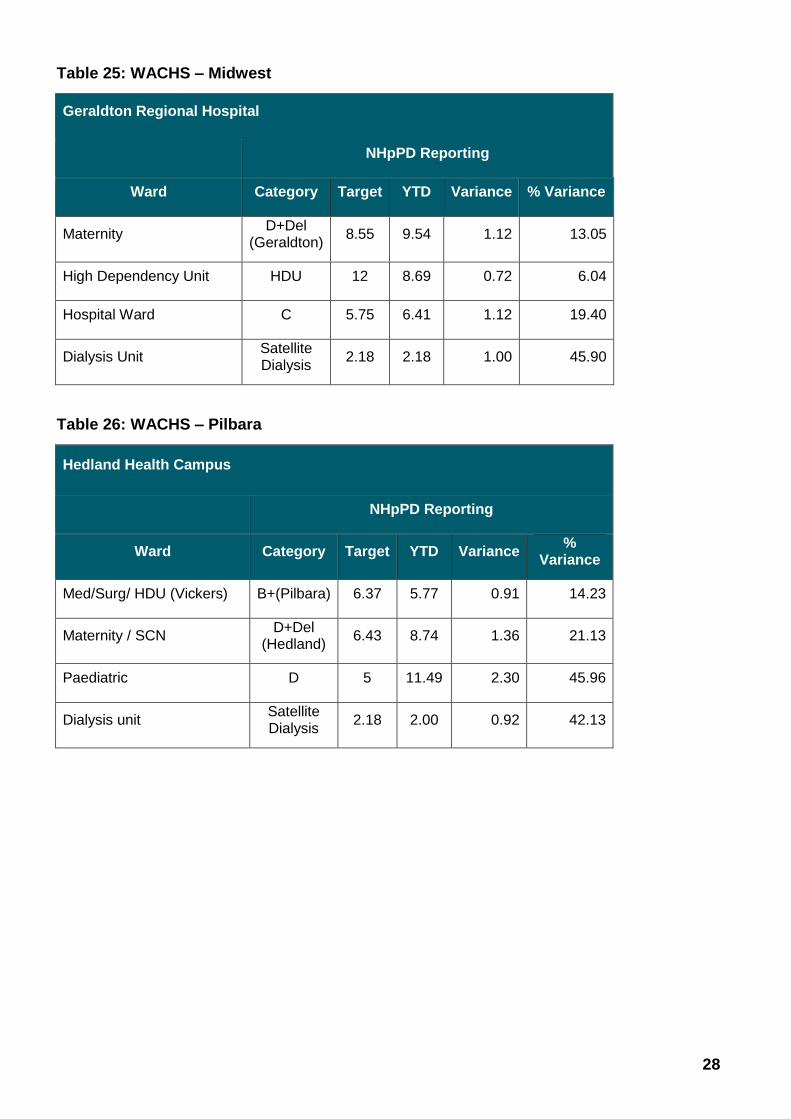
Table 25: WACHS – Midwest
Geraldton Regional Hospital
NHpPD Reporting
Ward Category Target YTD Variance % Variance
Maternity D+Del
(Geraldton) 8.55 9.54 1.12 13.05
High Dependency Unit HDU 12 8.69 0.72 6.04
Hospital Ward C 5.75 6.41 1.12 19.40
Dialysis Unit Satellite Dialysis
2.18 2.18 1.00 45.90
Table 26: WACHS – Pilbara
Hedland Health Campus
NHpPD Reporting
Ward Category Target YTD Variance %
Variance
Med/Surg/ HDU (Vickers) B+(Pilbara) 6.37 5.77 0.91 14.23
Maternity / SCN D+Del
(Hedland) 6.43 8.74 1.36 21.13
Paediatric D 5 11.49 2.30 45.96
Dialysis unit Satellite Dialysis
2.18 2.00 0.92 42.13

29
Table 27: WACHS – Southwest
Bunbury Regional Hospital
NHpPD Reporting
Ward Category Target YTD Variance % Variance
Surgical C 5.75 5.70 0.99 17.25
Medical C 5.75 5.57 0.97 16.85
Paediatrics B 6 6.77 1.13 18.81
Maternity D+Del
(Bunbury) 8.3 8.72 1.05 12.66
Mental Health C+
(BMH) 6.16 5.70 0.93 15.02
High Dependency Unit HDU 12 13.28 1.11 9.22
PICU (Psychiatric Intensive Care Unit)
A+ (PICU Bunbury)
12 13.62 1.13 9.46

30
Appendix 3 - Variance reports

31
Hospital: Royal Perth Hospital Target NHpPD: 6
Ward: 7A Reported NHpPD: 5.24 Variance: -0.76 Variance % - 12.74
Clause 7.2.2.2
Please detail the measures that this health site
has implemented, including specific steps, to
relieve the workload of nursing staff for this
clinical area.
With ongoing monitoring and reconfiguration of services at RPH Ward 7A was relocated and reduced from a 21 bed ward to a 17 bed ward.
Staff were transitioned from 7A to 4A with the service whereby DSU (4G) and DO23 (4B) are co-located with 7A (now 4A). 4ABG is managed by a single ward leader.
Staffing is reviewed daily by the ward leader (CNS) and weekly monitoring of activity and NHpPD
Increased staffing requirements due to sickness, nurse specials, acuity or escorts are identified and managed within the unit (reallocation of staff from 4BG) or extra staff requested from NRC or supernumerary resources used (CNS/SDN)
Clause 7.2.2.3
Provide information as to the progress achieved
in implementing these or other similar steps, or
to generally relieve or alleviate the workload of
nursing staff for this clinical area
Staffing requirements are monitored daily per shift and are adjusted for the patient activity and acuity requirements.
As the transition of this service is still new and staff skill mix is monitored an increase of the SDN to 1.5FTE across the floor has been introduced
There has been approval for an exemption to the recruitment freeze whereby recruitment is currently underway
Recording of staff correctly on RoStar if they are reallocated from 4BG to 4A is vital to capture correct hours being used. This is a new process so requires close monitoring to ensure it is capturing nursing hours correctly.
Clause 7.2.2.4
Outline this health sites future plans or
intentions in relation to proposals to address the
question of workloads of nursing staff for this
clinical area.
The staffing profile will continue to be monitored to ensure safe levels of staffing.
Ongoing monitoring of staffing skill mix and profile will continue, with every effort to replace nursing shortfall with appropriately skilled staff.
Recruitment is currently in progress

32
Hospital: Royal Perth Hospital Target NHpPD: 6
Ward: 5G Reported NHpPD: 5.35 Variance: -0.65 Variance % - 10.86
Clause 7.2.2.2
Please detail the measures that this health site
has implemented, including specific steps, to
relieve the workload of nursing staff for this
clinical area.
Ward 5G has significant staff shortages relating to reconfiguration and attrition. These have been exacerbated by the recruitment freeze that commenced in December 2015.
On a shift by shift basis casual and agency staff has been used to backfill the vacancy. When these resources are unavailable, nursing staff not included in the nursing hours per patient day, including the CNS and SDN are utilised for direct patient care and support of staff.
Occupancy of Ward 5G has sat at 91-98% for the 6 month period from February to July 2016. When possible, beds have been closed to lower occupancy and reduce the amount of nursing staff required.
A current recruitment process is underway where it is anticipated that all vacancies will be filled.
Clause 7.2.2.3
Provide information as to the progress achieved
in implementing these or other similar steps, or
to generally relieve or alleviate the workload of
nursing staff for this clinical area
Weekly monitoring of activity and NHpPD
Recruitment drive currently underway (completion Sept/Oct 2016)
Ongoing education into the importance of correct roster recording with a new Nursing Guideline published to ensure accurate recording of nursing hours
Monthly in-depth monitoring of FTE and leave allocation occurs at ward and executive level.
Clause 7.2.2.4
Outline this health sites future plans or
intentions in relation to proposals to address the
question of workloads of nursing staff for this
clinical area.
The staffing profile will continue to be monitored to ensure safe levels of staffing.
Ongoing monitoring of staffing skill mix and profile will continue, with every effort to replace nursing shortfall with appropriately skilled staff.
Recruitment is currently in progress
33
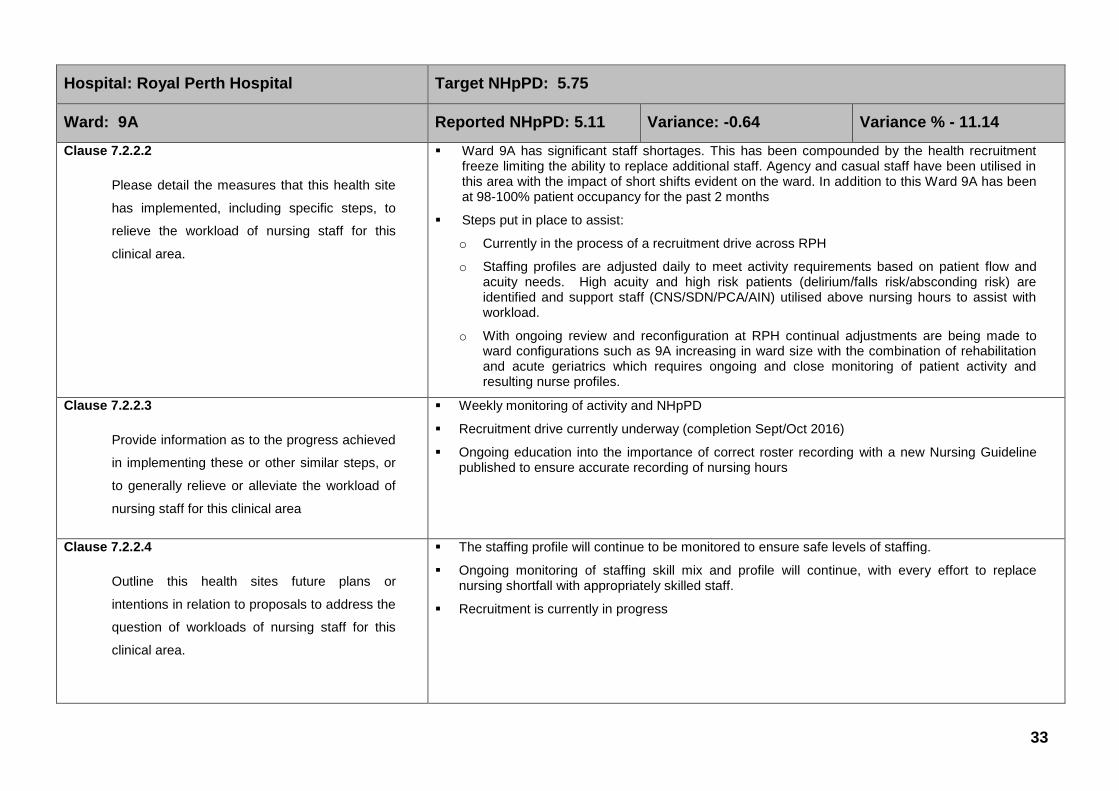
Hospital: Royal Perth Hospital Target NHpPD: 5.75
Ward: 9A Reported NHpPD: 5.11 Variance: -0.64 Variance % - 11.14
Clause 7.2.2.2
Please detail the measures that this health site
has implemented, including specific steps, to
relieve the workload of nursing staff for this
clinical area.
Ward 9A has significant staff shortages. This has been compounded by the health recruitment freeze limiting the ability to replace additional staff. Agency and casual staff have been utilised in this area with the impact of short shifts evident on the ward. In addition to this Ward 9A has been at 98-100% patient occupancy for the past 2 months
Steps put in place to assist:
o Currently in the process of a recruitment drive across RPH
o Staffing profiles are adjusted daily to meet activity requirements based on patient flow and acuity needs. High acuity and high risk patients (delirium/falls risk/absconding risk) are identified and support staff (CNS/SDN/PCA/AIN) utilised above nursing hours to assist with workload.
o With ongoing review and reconfiguration at RPH continual adjustments are being made to ward configurations such as 9A increasing in ward size with the combination of rehabilitation and acute geriatrics which requires ongoing and close monitoring of patient activity and resulting nurse profiles.
Clause 7.2.2.3
Provide information as to the progress achieved
in implementing these or other similar steps, or
to generally relieve or alleviate the workload of
nursing staff for this clinical area
Weekly monitoring of activity and NHpPD
Recruitment drive currently underway (completion Sept/Oct 2016)
Ongoing education into the importance of correct roster recording with a new Nursing Guideline published to ensure accurate recording of nursing hours
Clause 7.2.2.4
Outline this health sites future plans or
intentions in relation to proposals to address the
question of workloads of nursing staff for this
clinical area.
The staffing profile will continue to be monitored to ensure safe levels of staffing.
Ongoing monitoring of staffing skill mix and profile will continue, with every effort to replace nursing shortfall with appropriately skilled staff.
Recruitment is currently in progress
34
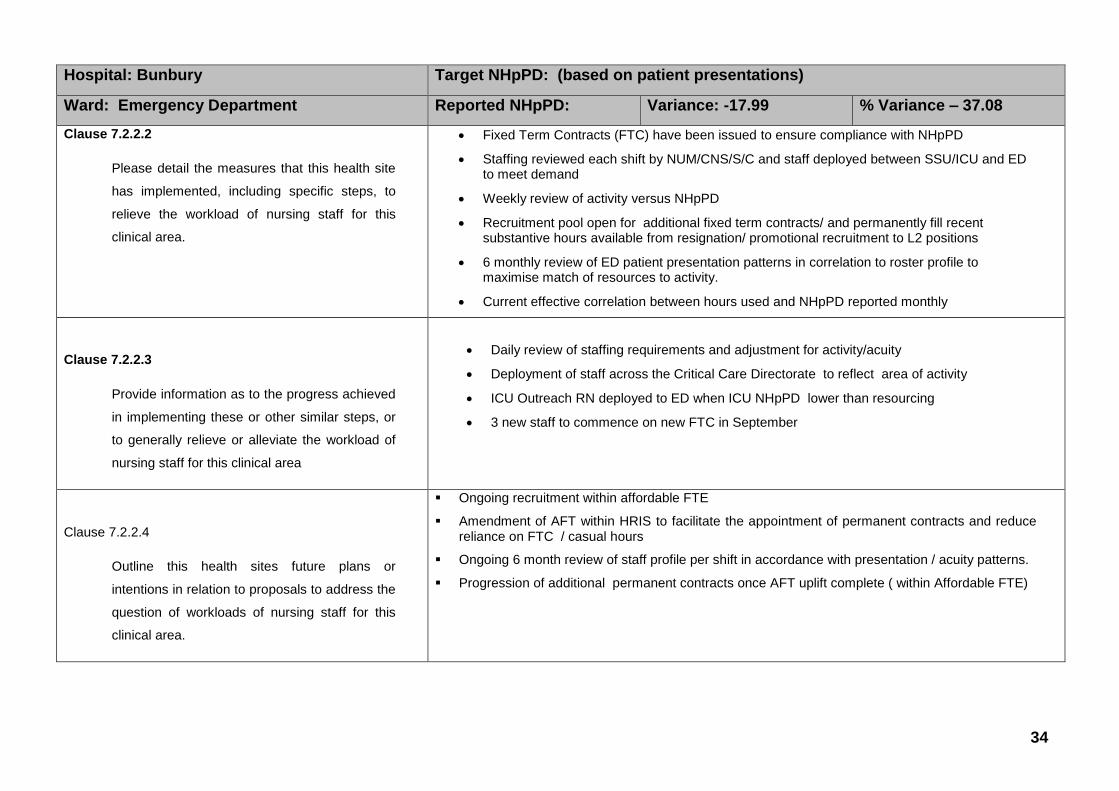
Hospital: Bunbury Target NHpPD: (based on patient presentations)
Ward: Emergency Department Reported NHpPD: Variance: -17.99 % Variance – 37.08
Clause 7.2.2.2
Please detail the measures that this health site
has implemented, including specific steps, to
relieve the workload of nursing staff for this
clinical area.
Fixed Term Contracts (FTC) have been issued to ensure compliance with NHpPD
Staffing reviewed each shift by NUM/CNS/S/C and staff deployed between SSU/ICU and ED to meet demand
Weekly review of activity versus NHpPD
Recruitment pool open for additional fixed term contracts/ and permanently fill recent substantive hours available from resignation/ promotional recruitment to L2 positions
6 monthly review of ED patient presentation patterns in correlation to roster profile to maximise match of resources to activity.
Current effective correlation between hours used and NHpPD reported monthly
Clause 7.2.2.3
Provide information as to the progress achieved
in implementing these or other similar steps, or
to generally relieve or alleviate the workload of
nursing staff for this clinical area
Daily review of staffing requirements and adjustment for activity/acuity
Deployment of staff across the Critical Care Directorate to reflect area of activity
ICU Outreach RN deployed to ED when ICU NHpPD lower than resourcing
3 new staff to commence on new FTC in September
Clause 7.2.2.4
Outline this health sites future plans or
intentions in relation to proposals to address the
question of workloads of nursing staff for this
clinical area.
Ongoing recruitment within affordable FTE
Amendment of AFT within HRIS to facilitate the appointment of permanent contracts and reduce reliance on FTC / casual hours
Ongoing 6 month review of staff profile per shift in accordance with presentation / acuity patterns.
Progression of additional permanent contracts once AFT uplift complete ( within Affordable FTE)

35
Appendix 4 – WACHS regional Reporting of Small Hospitals/Primary Health Care Centres (SHHC) with 2.2.2 sites
Hospital Additional
Staff required
Reason
Additional Staff
supplied Yes/No
If NO – reason Workload Grievance submitted
Any other comments / actions

36
Appendix 5 - WACHS Small Hospitals/Primary Health Care Centres (SHHC) with 2/2/2 roster by region
Table 28: WACHS - Goldfields
Region Health Site
Goldfields
Laverton
Leonora
Norseman
Table 29: WACHS – Great Southern
Region Health Site
Great Southern
Gnowangerup
Kojonup
Ravensthorpe
Table 30: WACHS – Pilbara
Region Health Site
Pilbara
Newman (IDHS)*
Onslow
Roebourne
Tom Price
Table 31: WACHS – Mid-West
Region Health Site
Mid-West
Dongara
Exmouth
Kalbarri
Meekatharra
Morawa
Mullewa
Northampton
Three Springs
37
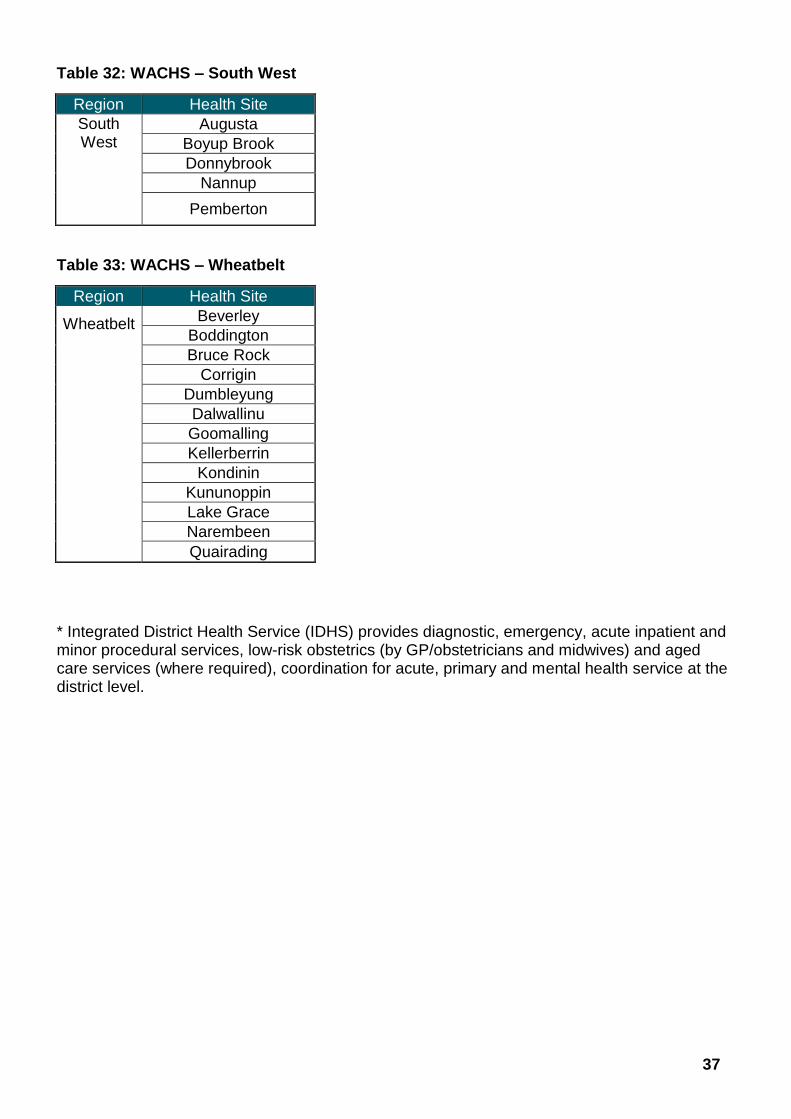
Table 32: WACHS – South West
Region Health Site
South West
Augusta
Boyup Brook
Donnybrook
Nannup
Pemberton
Table 33: WACHS – Wheatbelt
Region Health Site
Wheatbelt
Beverley
Boddington
Bruce Rock
Corrigin
Dumbleyung
Dalwallinu
Goomalling
Kellerberrin
Kondinin
Kununoppin
Lake Grace
Narembeen
Quairading
* Integrated District Health Service (IDHS) provides diagnostic, emergency, acute inpatient and minor procedural services, low-risk obstetrics (by GP/obstetricians and midwives) and aged care services (where required), coordination for acute, primary and mental health service at the district level.

This document can be made available in alternative formats on request for a person with a disability.
© Department of Health 2016
Copyright to this material is vested in the State of Western Australia unless otherwise indicated. Apart from any fair dealing for the purposes of private study, research, criticism or review, as permitted under the provisions of the Copyright Act 1968, no part may be reproduced or re-used for any purposes whatsoever without written permission of the State of Western Australia.