nurturing data visualization
TRANSCRIPT
Nurturing Data Visualization as a personal skill & organizational value Amanda Makulec, MPH Visual Analytics Advisor John Snow Inc. Presented 8 March 2017 HC3 Innovation Webinar 15: Data Visualization

M y s t o r y
( a n d w h a t I ’ v e l e a r n e d )
O r g a n i z a t i o n s h a v e
c o m p l e x e c o s y s t e m s .
T h e Tr e e s (Building your own skills.)
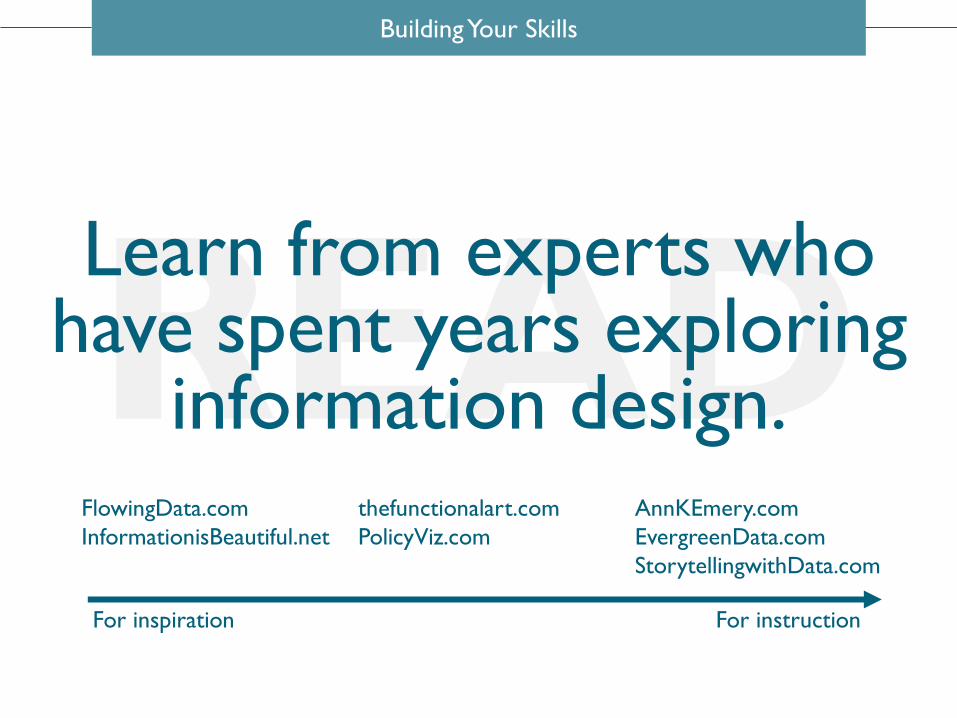
Building Your Skills
READ FlowingData.com
InformationisBeautiful.net
thefunctionalart.com
PolicyViz.com
AnnKEmery.com
EvergreenData.com
StorytellingwithData.com
For inspiration For instruction
Learn from experts who have spent years exploring
information design.
Building Your Skills
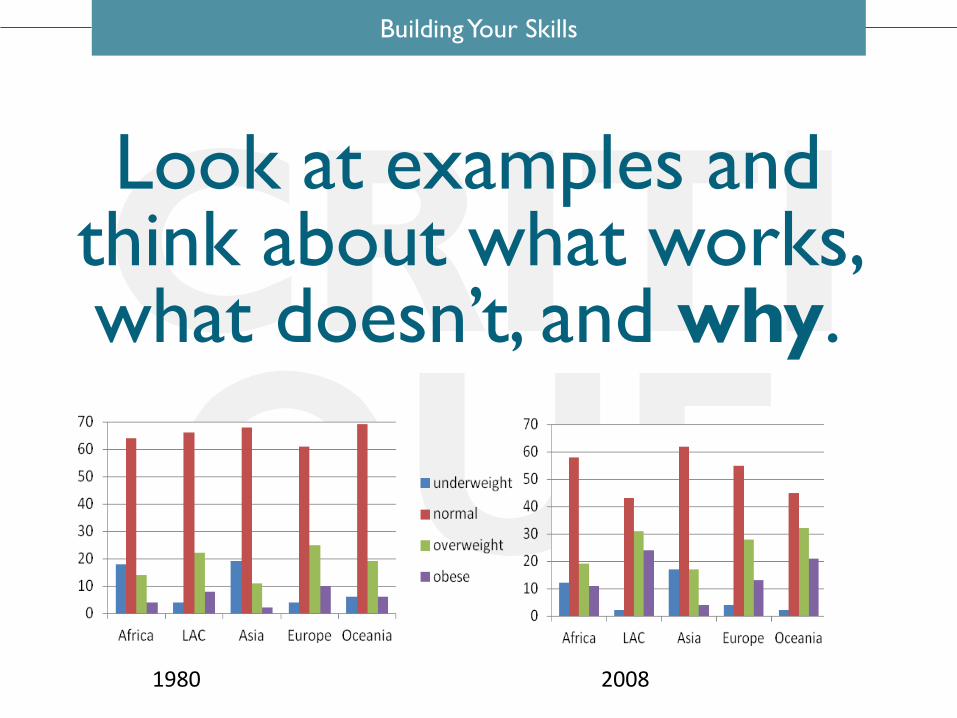
CRITIQUE
Look at examples and think about what works, what doesn’t, and why.
1980 2008
Building Your Skills
PRACTICE
Find opportunities to practice your design skills
at work or for fun.
Building Your Skills
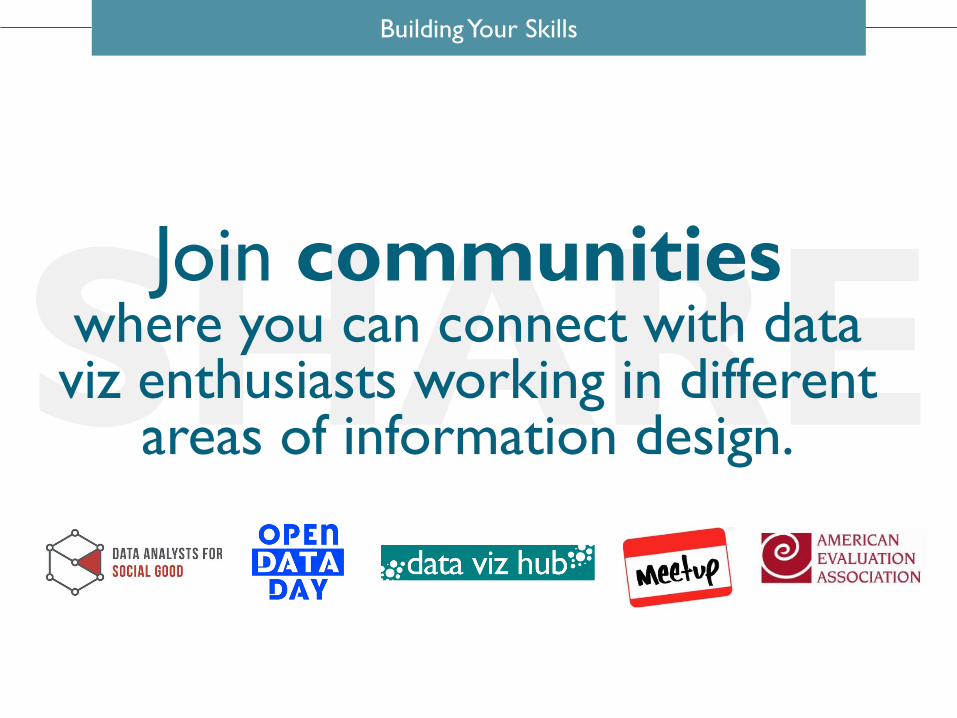
SHARE Join communities
where you can connect with data viz enthusiasts working in different
areas of information design.
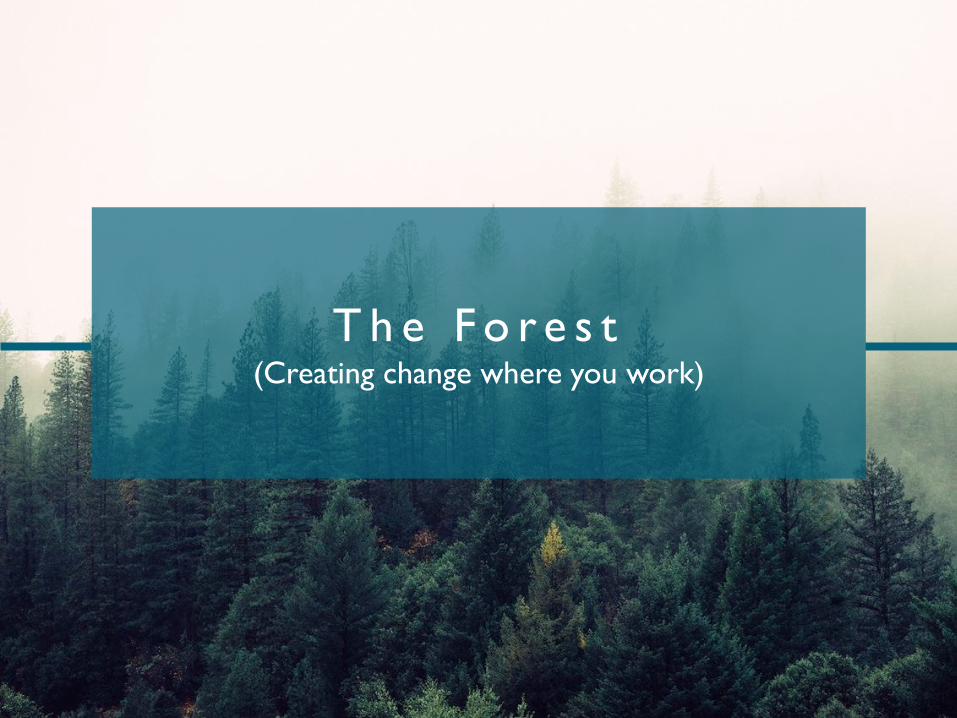
T h e F o r e s t (Creating change where you work)
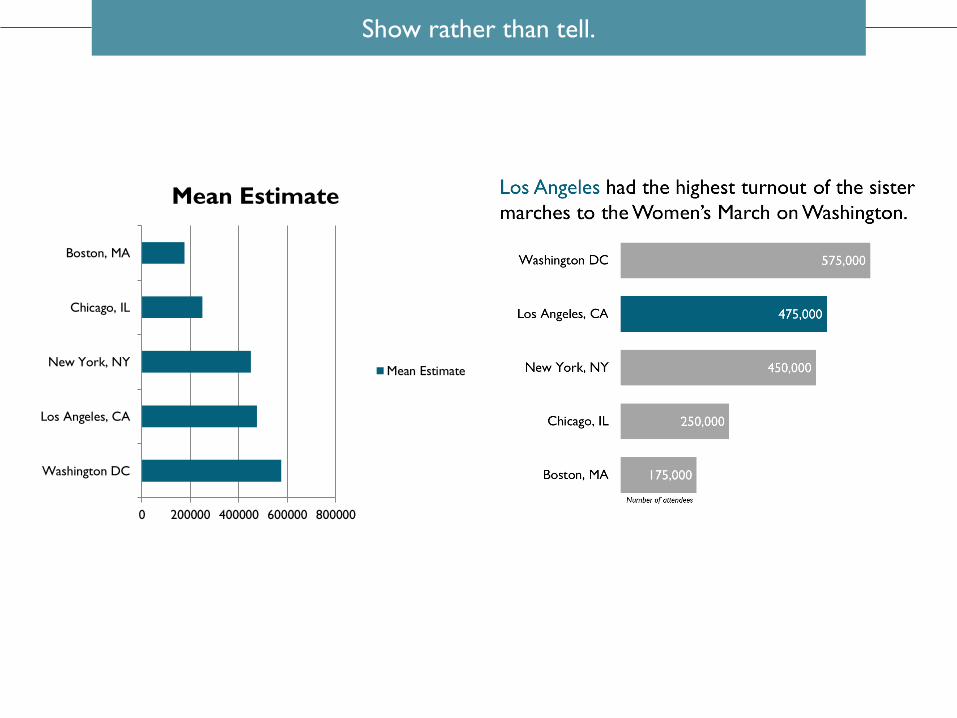
Show rather than tell.
0 200000 400000 600000 800000
Washington DC
Los Angeles, CA
New York, NY
Chicago, IL
Boston, MA
Mean Estimate
Mean Estimate
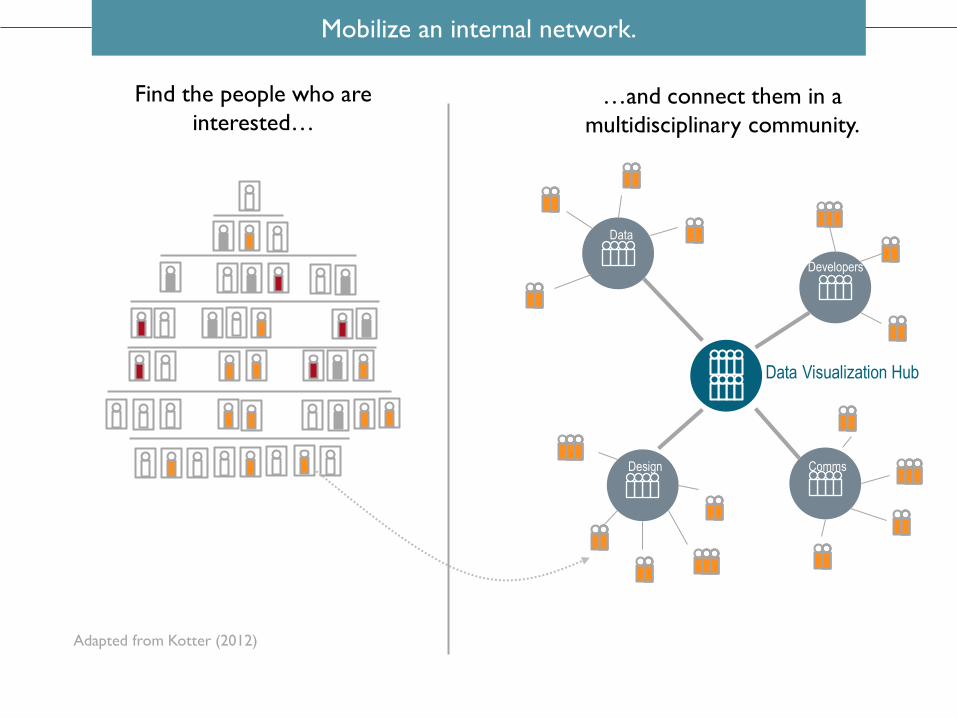
Data Visualization Hub
Find the people who are
interested… …and connect them in a
multidisciplinary community.
Mobilize an internal network.
Data
Developers
Comms Design
Adapted from Kotter (2012)
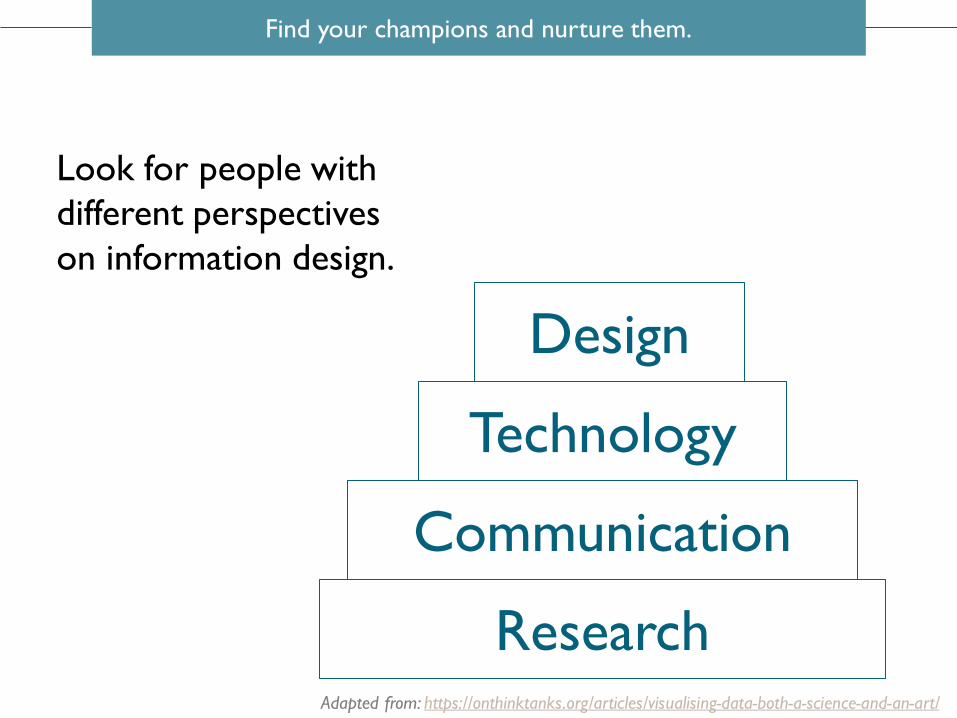
Find your champions and nurture them.
Research
Technology
Design
Communication
Adapted from: https://onthinktanks.org/articles/visualising-data-both-a-science-and-an-art/
Look for people with
different perspectives
on information design.

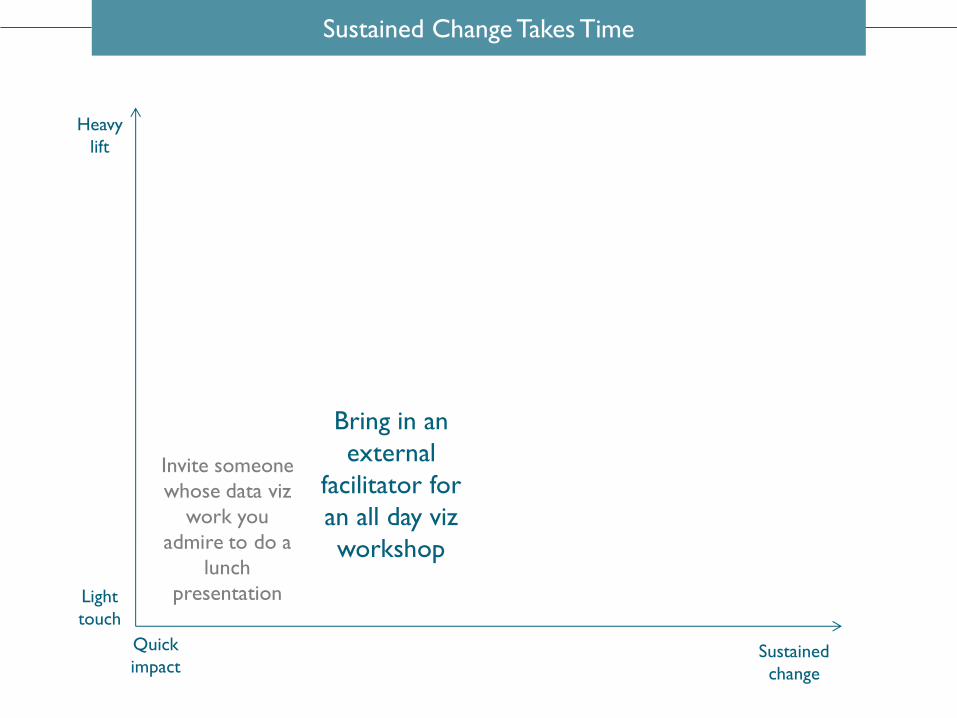
Heavy
lift
Light
touch
Quick
impact Sustained
change
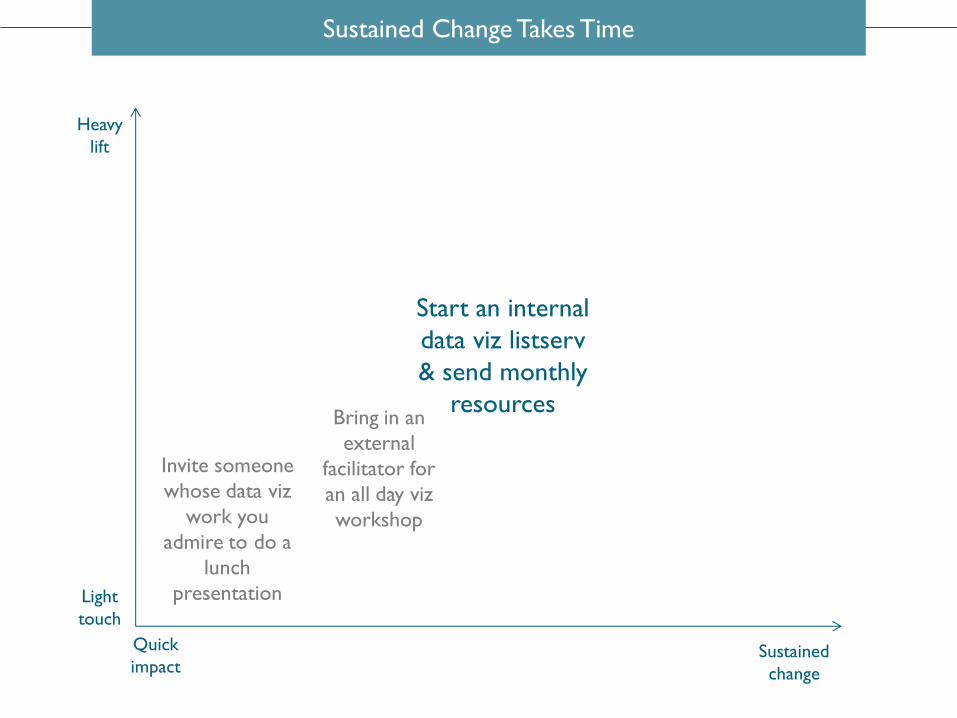
Sustained Change Takes Time
Invite someone
whose data viz
work you admire
to do a lunch
presentation
Heavy
lift
Light
touch
Quick
impact Sustained
change
Sustained Change Takes Time
Bring in an
external
facilitator for
an all day viz
workshop
Invite someone
whose data viz
work you
admire to do a
lunch
presentation
Heavy
lift
Light
touch
Quick
impact Sustained
change
Sustained Change Takes Time
Bring in an
external
facilitator for
an all day viz
workshop
Start an internal
data viz listserv
& send monthly
resources
Invite someone
whose data viz
work you
admire to do a
lunch
presentation
Heavy
lift
Light
touch
Quick
impact Sustained
change
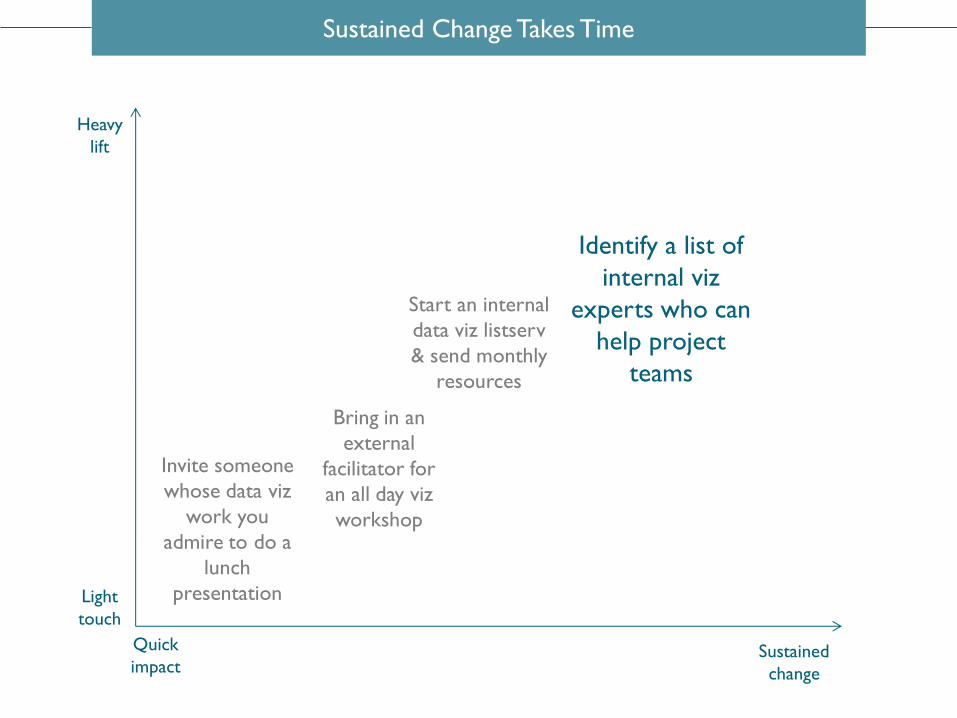
Sustained Change Takes Time
Bring in an
external
facilitator for
an all day viz
workshop
Identify a list of
internal viz
experts who can
help project
teams
Start an internal
data viz listserv
& send monthly
resources
Invite someone
whose data viz
work you
admire to do a
lunch
presentation
Heavy
lift
Light
touch
Quick
impact Sustained
change
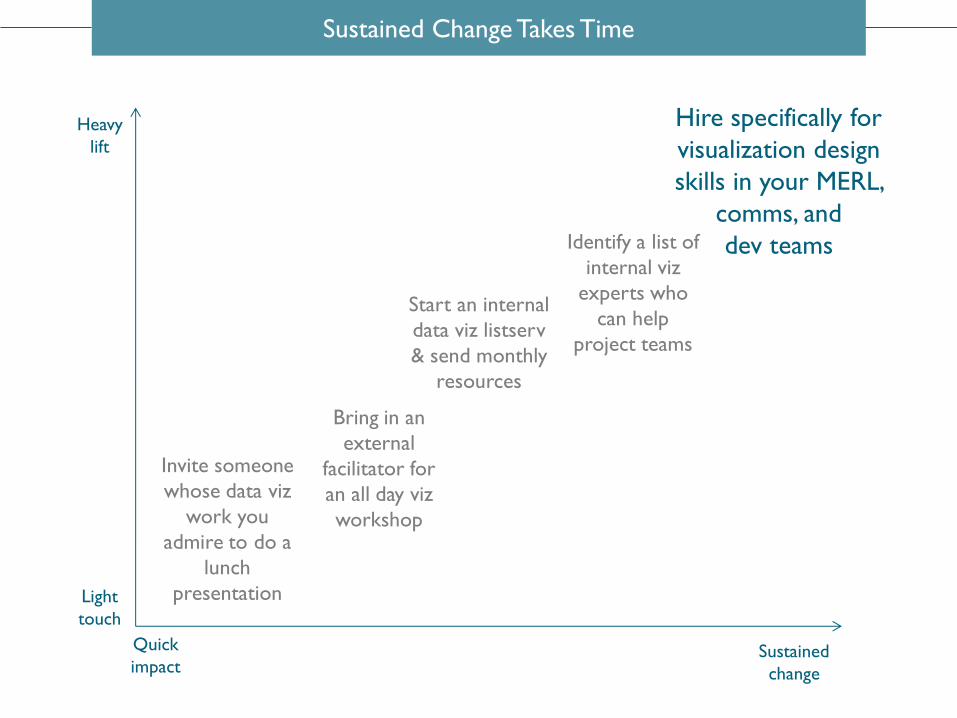
Sustained Change Takes Time
Bring in an
external
facilitator for
an all day viz
workshop
Identify a list of
internal viz
experts who
can help
project teams
Start an internal
data viz listserv
& send monthly
resources
Hire specifically for
visualization design
skills in your MERL,
comms, and
dev teams
Invite someone
whose data viz
work you
admire to do a
lunch
presentation
A T h r i v i n g E c o s y s t e m 5 Tips for Success in Data Viz Collaborations
Speak the same language.
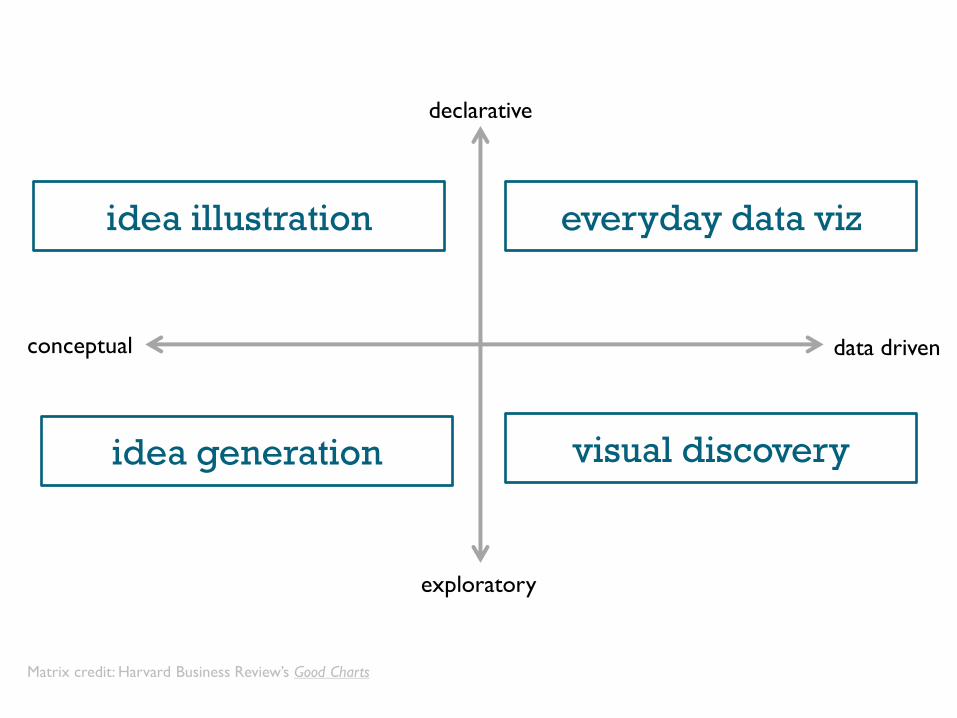
conceptual data driven
declarative
exploratory
idea illustration everyday data viz
idea generation visual discovery
Matrix credit: Harvard Business Review’s Good Charts
Ask lots of questions.

Measure twice,
cut once.
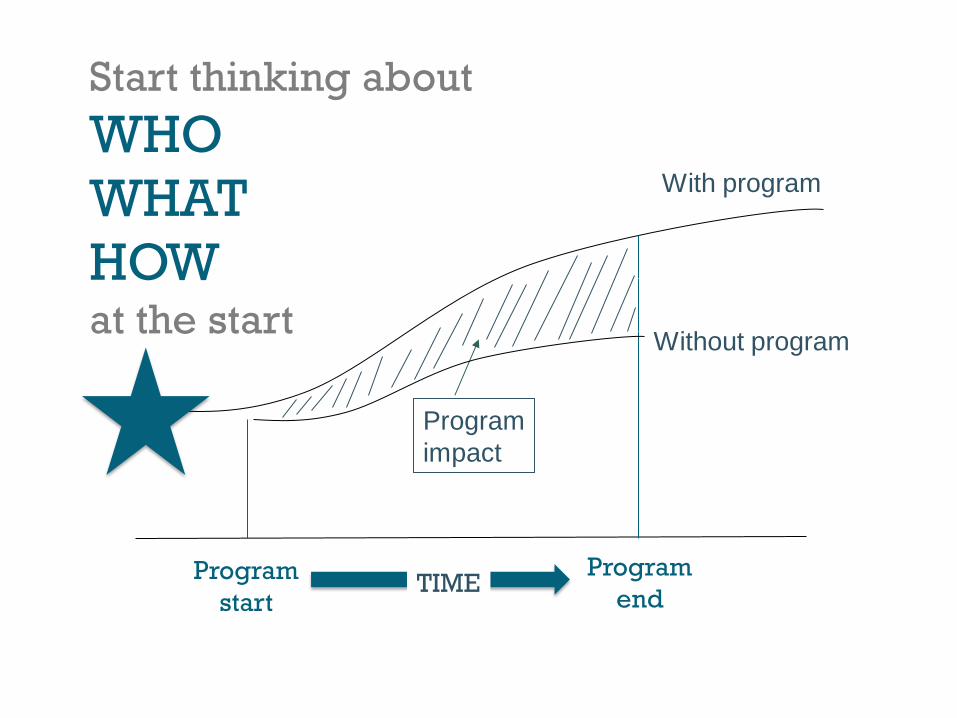
Program
start
Program
end TIME
With program
Without program
Start thinking about
WHO
WHAT
HOW at the start
Program
impact

Understand your audience.

Put yourself
in their shoes.

Not just
job titles
stakeholder groups
organization names
Focus on the human side of
your data viz audience.

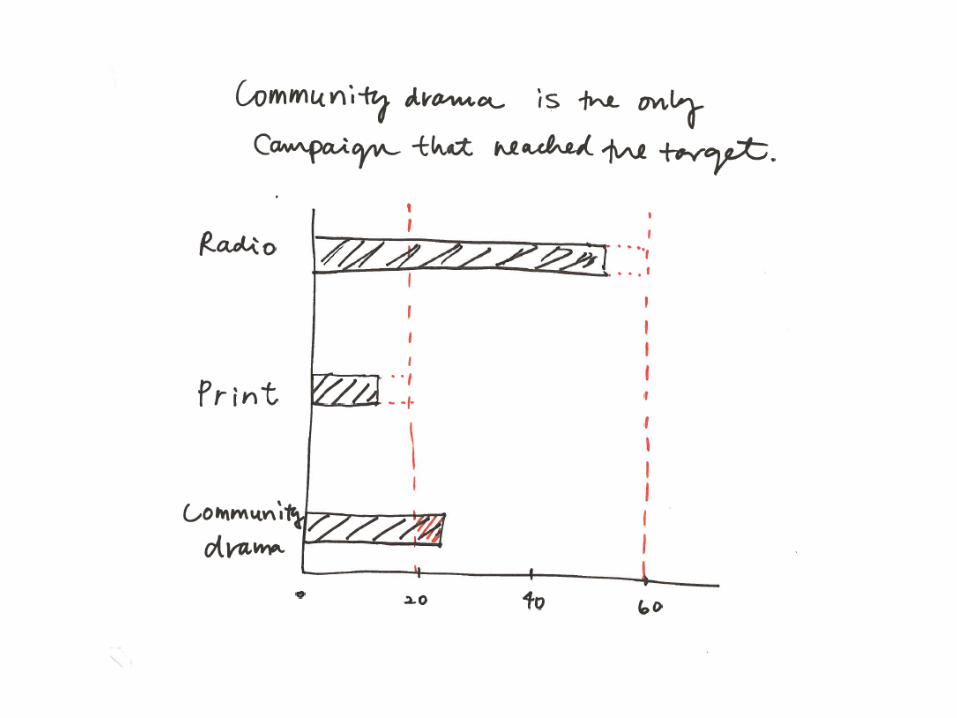
Sketch first.
Be realistic with deadlines. (especially when you’re first honing your design skills)
Amanda Makulec, MPH John Snow Inc.
Visual Analytics Advisor
@abmakulec