nus real estate news - national university of singapore nus real estate news may also be accessed on...
TRANSCRIPT
1
NUS Real Estate News A QUARTERLY e-NEWSLETTER OF DEPARTMENT OF REAL ESTATE (DRE) AND
INSTITUTE OF REAL ESTATE STUDIES (IRES)
26 February 2015 (Issue No. 1)
Market Updates _____________________________________
Singapore Residential Price index (SRPI)
The NUS SRPI flash overall value weighted index and two sub-indices are staying
in the falling trend in December, except for the small units sub-index that rose
slightly from November. The overall NUS SRPI was down by 1.2 percent from the
previous month and the sub-indices for central and non-central region were down
by 1.7 percent and 0.8 percent respectively. Read more…
NUS-REDAS Real Estate Sentiment Index (RESI)
The 4Q14 NUS-REDAS Real Estate Sentiment Index (RESI) Survey shows that the Composite Sentiment Index,
a derived indicator for the overall real estate market sentiment in Singapore, went down to 3.4 from 3.7 in 3Q14.
The Current Sentiment Index declined to 3.6 from 3.7 in 3Q14; and the Future Sentiment Index declined to 3.2
from 3.6 in 3Q14. Read more…
NUS/Wharton/Tsinghua Chinese Residential Land Price Indexes (CRLPI)
The NUS/Wharton/Tsinghua Chinese Residential Land Price Indexes (CRLPI) reports series on real constant quality land prices across 35 major markets in China. See our white paper for more information on the
underlying data and technical issues in the creation of the index. The NUS/Wharton/Tsinghua Chinese
Residential Land Price Index appreciated by nearly 11% during the fourth quarter of 2014, more than recovering
from the 6.8% drop in the previous quarter. Read more…
Research Highlights / Articles ______________________________________
Property Price Upsurge in Singapore’s Mass Market – How the Role of
Foreign Capital Affects You
The inflow of foreign money into the central region of Singapore’s private property market does not only spark
an uptick of prices in this core region, but also brings about a ‘ripple effect’ that affects prices in the non-central
regions. This ‘ripple effect’ could account for as much as 25% of the fluctuations in house price growth in these
regions. Read more…
Selectivity, Spatial Autocorrelation, and the Valuation of Transit
Accessibility
Urban rail transit has been widely considered an efficient and environment-friendly mode of transport to address
deteriorating urban transportation conditions. However, in recent years, the increasing development, operation
and maintenance costs of urban rail transit have imposed significant challenges on governments and transit
agencies worldwide. Read more…

2
Events ______________________________________
AREUEA-ASSA Annual Conference
Prof Deng’s AREUEA presidential speech, titled “Disparities in the Geographic Focus of Real Estate and Urban
Economics Publications,” reveals that even as more authors from leading Asian universities/research institutions
continue to contribute to the top-tier journal publications in the fields of real estate finance and urban economics
over the years, authors affiliated with Singaporean universities contribute about 40% of this growing trend.
Read more…
Listen to his speech…
5th Annual Conference of Real Estate Industry in China
The Annual Conference was attended by some of the major players in China’s property market, for example,
Vanke, Greenland and Sino-Ocean Land. The conference was held from 14th – 16th January 2015 and provided a platform for industry players to review the current status of China’s real estate market, discuss the challenges
faced in moving on to the “silver times” of China’s property market. Read more…
What’s Coming Up? ______________________________________
NUS-IRES Public Lecture
"What is behind the disappointing growth worldwide after the Financial Crisis?" By Professor Kiyohiko G. Nishimura
Read more…
Faculty / Student News ______________________________________
Faculty Achievements Read more…
Student Achievements Read more…

3
Preface ______________________________________
The NUS Real Estate News is a quarterly publication of the Department of Real Estate and
the Institute of Real Estate Studies. It documents data releases and analyses through market
updates of the Singapore Residential Price Index (SRPI), the NUS-REDAS Real Estate
Sentiment Index (RESI) and the NUS/Wharton/Tsinghua Chinese Residential Land Price
Indexes (CRLPI). It also provides highlights on market relevant research and disseminates
information on industry activities which the NUS Real Estate either organizes or participates
in.
The production of the NUS Real Estate News is coordinated by the Institute of Real Estate
Studies under the general direction of Professor Deng Yongheng (Provost’s Chair Professor,
Director of Institute of Real Estate Studies and Head of Department of Real Estate).
Get Connected!
To be placed on our distribution list and to stay
connected to NUS Real Estate, drop us an email stating
your name, company and contact information to:
[email protected]. Subscription to the NUS Real Estate
News is free of charge.
You may also wish to forward this email to interested
friends and colleagues.
Your feedback and comments are most welcome.
The NUS Real Estate News may also be accessed on the
website of the NUS Department of Real Estate:
http://www.rst.nus.edu.sg/newsreal/index.html
To unsubscribe, simply reply to this email with the message “Unsubscribe”.
4
Market Updates _________________________________________________________
Singapore Residential Price Index (SRPI)
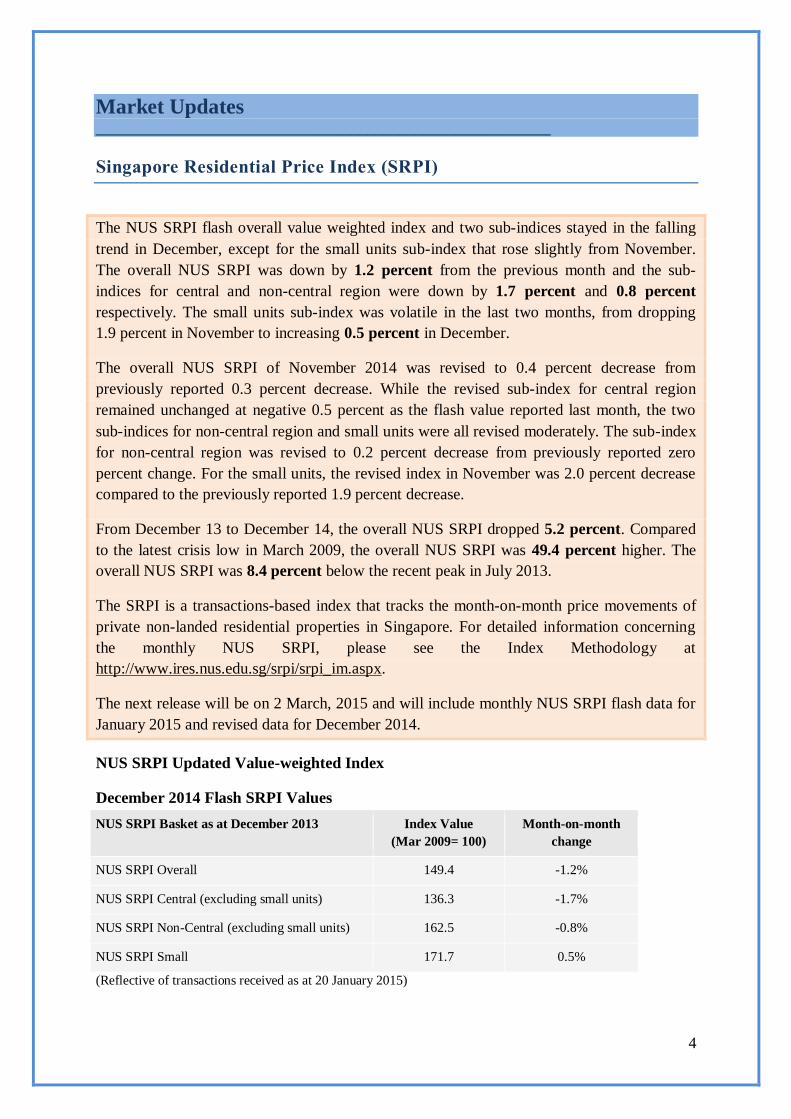
The NUS SRPI flash overall value weighted index and two sub-indices stayed in the falling
trend in December, except for the small units sub-index that rose slightly from November.
The overall NUS SRPI was down by 1.2 percent from the previous month and the sub-
indices for central and non-central region were down by 1.7 percent and 0.8 percent
respectively. The small units sub-index was volatile in the last two months, from dropping
1.9 percent in November to increasing 0.5 percent in December.
The overall NUS SRPI of November 2014 was revised to 0.4 percent decrease from
previously reported 0.3 percent decrease. While the revised sub-index for central region
remained unchanged at negative 0.5 percent as the flash value reported last month, the two
sub-indices for non-central region and small units were all revised moderately. The sub-index
for non-central region was revised to 0.2 percent decrease from previously reported zero
percent change. For the small units, the revised index in November was 2.0 percent decrease
compared to the previously reported 1.9 percent decrease.
From December 13 to December 14, the overall NUS SRPI dropped 5.2 percent. Compared
to the latest crisis low in March 2009, the overall NUS SRPI was 49.4 percent higher. The
overall NUS SRPI was 8.4 percent below the recent peak in July 2013.
The SRPI is a transactions-based index that tracks the month-on-month price movements of
private non-landed residential properties in Singapore. For detailed information concerning
the monthly NUS SRPI, please see the Index Methodology at
http://www.ires.nus.edu.sg/srpi/srpi_im.aspx.
The next release will be on 2 March, 2015 and will include monthly NUS SRPI flash data for
January 2015 and revised data for December 2014.
NUS SRPI Updated Value-weighted Index
December 2014 Flash SRPI Values
(Reflective of transactions received as at 20 January 2015)
NUS SRPI Basket as at December 2013 Index Value
(Mar 2009= 100)
Month-on-month
change
NUS SRPI Overall 149.4 -1.2%
NUS SRPI Central (excluding small units) 136.3 -1.7%
NUS SRPI Non-Central (excluding small units) 162.5 -0.8%
NUS SRPI Small 171.7 0.5%
5
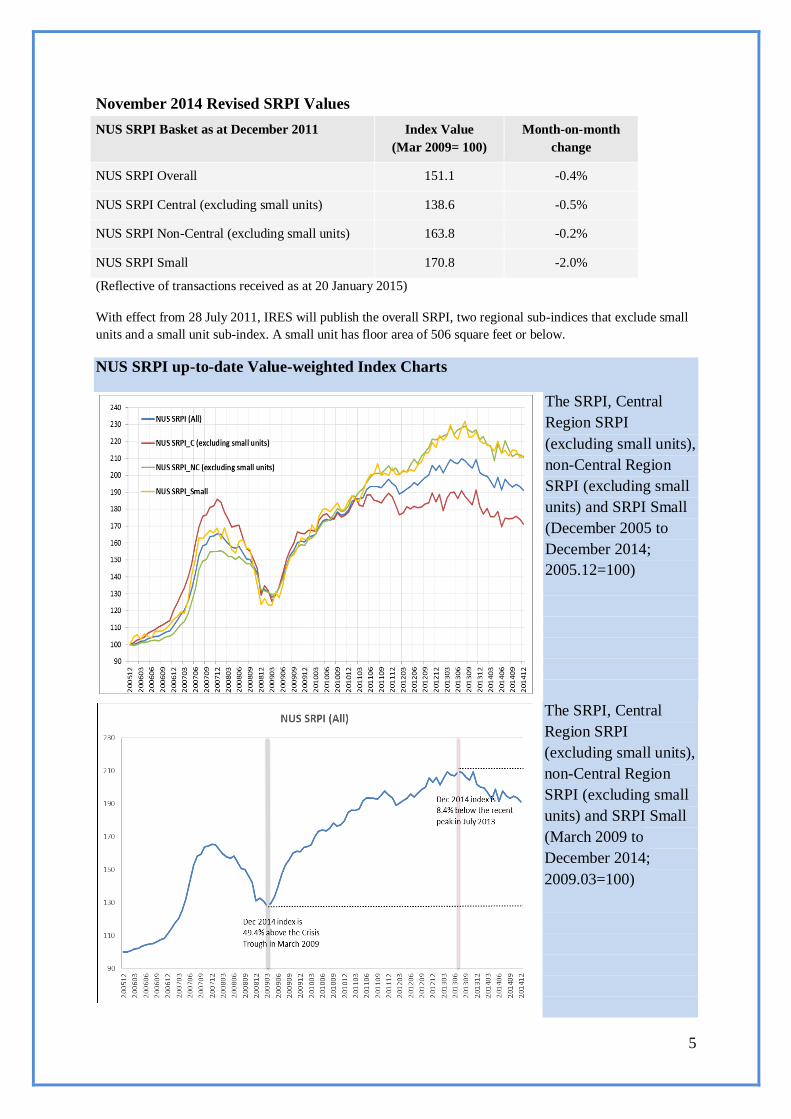
November 2014 Revised SRPI Values
(Reflective of transactions received as at 20 January 2015)
With effect from 28 July 2011, IRES will publish the overall SRPI, two regional sub-indices that exclude small
units and a small unit sub-index. A small unit has floor area of 506 square feet or below.
NUS SRPI up-to-date Value-weighted Index Charts
The SRPI, Central
Region SRPI
(excluding small units),
non-Central Region
SRPI (excluding small
units) and SRPI Small
(December 2005 to
December 2014;
2005.12=100)
The SRPI, Central
Region SRPI
(excluding small units),
non-Central Region
SRPI (excluding small
units) and SRPI Small
(March 2009 to
December 2014;
2009.03=100)
NUS SRPI Basket as at December 2011 Index Value
(Mar 2009= 100)
Month-on-month
change
NUS SRPI Overall 151.1 -0.4%
NUS SRPI Central (excluding small units) 138.6 -0.5%
NUS SRPI Non-Central (excluding small units) 163.8 -0.2%
NUS SRPI Small 170.8 -2.0%
6
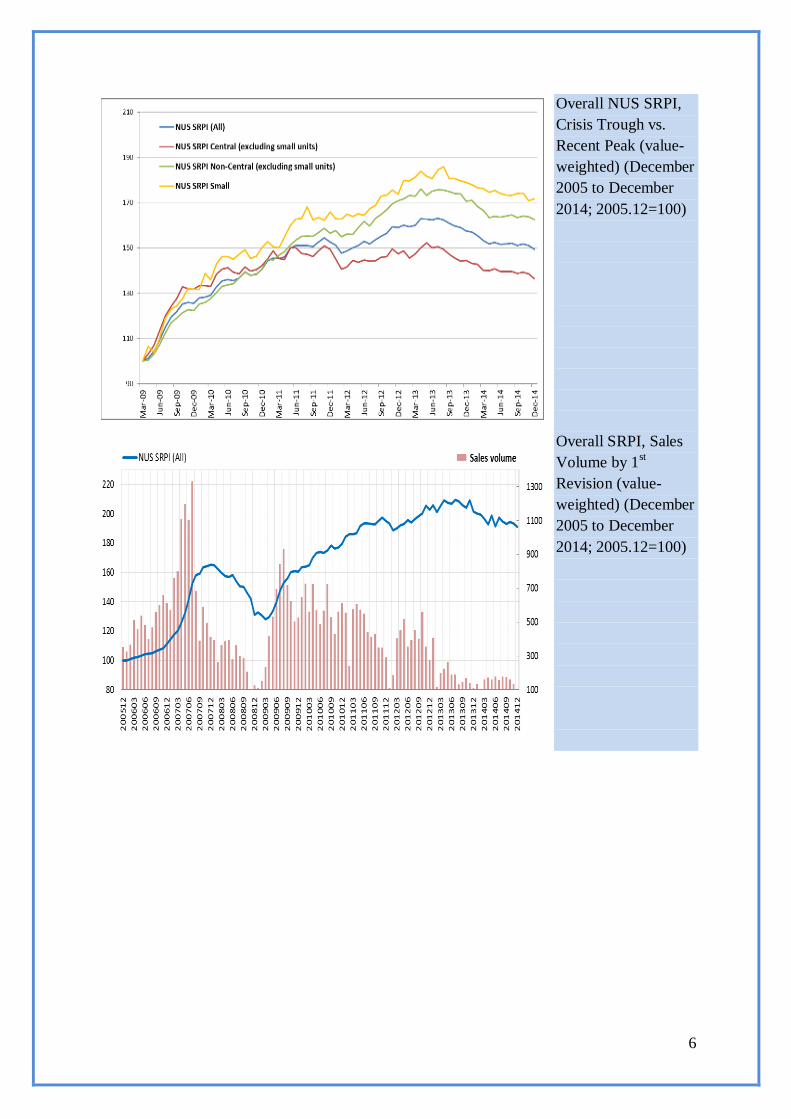
Overall NUS SRPI,
Crisis Trough vs.
Recent Peak (value-
weighted) (December
2005 to December
2014; 2005.12=100)
Overall SRPI, Sales
Volume by 1st
Revision (value-
weighted) (December
2005 to December
2014; 2005.12=100)
7
NUS-REDAS Real Estate Sentiment Index (RESI)
Developer sentiment remains weak
The 4Q14 NUS-REDAS Real Estate Sentiment Index (RESI) Survey shows that the
Composite Sentiment Index, a derived indicator for the overall real estate market sentiment in
Singapore, went down to 3.4 from 3.7 in 3Q14. The Current Sentiment Index declined to 3.6
from 3.7 in 3Q14; and the Future Sentiment Index declined to 3.2 from 3.6 in 3Q14. A score
under five indicates deteriorating market conditions, while scores above five indicate
improving conditions.
The worst performing sector in the 4Q14 is the residential sector, whereas the best
performing sector in 4Q14 is the office sector. The prime residential sector showed a current
net balance of -59% and a future net balance of -61%; while the suburban residential sector
showed a current net balance of -52% and a future net balance of -65% in 3Q14. The office
sector had a current net balance of +38% and a future net balance of +38%.
A “current and future net balance percentage” is used to indicate current and future
sentiments about real estate development and market conditions in Singapore. It is the
difference between the proportion of respondents who have selected the positive options
(“better” and “increase”) and the proportion of respondents who have selected the negative
options (“worse” and “decease”).
More than 67% of the respondents surveyed in 4Q14 anticipate that slowing down in the
global economy and rises in inflation and interest rates will adversely impact market
sentiment in the next 6 months. 65.6% of them indicate that property market will face
excessive supply from new launches.
35.1% of the developers surveyed in 4Q14 expect new property launches to hold at the same
level in the next six months. 32.4% of the developers expect moderately more launches.
16.2% of them indicate that they will launch moderately less units, down from 12% reported
in the last quarter. On price changes, 70.3% of the developers anticipate a moderate decrease
in residential property prices in the next six months. In 4Q14, 24.3% of them expect price to
hold, a slight decrease by 1.7% from the number reported in the last quarter.
“One respondent commented that pricing of new residential launches in the next 6 months is
expected to be lower by about 10% because of TDSR; and after Chinese New Year in 2015,
developers are likely to load off their stocks and to re-launch existing units. Developers do
not foresee the Government to relax any measures soon.”
More than 70% of the respondents project that property prices will decrease by 5% to 10%
and new sales transaction volume will drop by 15% to 20% in 2015.
“The continual weakening of the market sentiment in this quarter was mainly driven by
poor performance in the residential sectors. ‘Feel-good’ factors that will lift up the
residential property market sentiment are not on the horizon.”
- Associate Professor Sing Tien Foo of NUS’ Department of Real Estate
8
43.5% of the respondents wish that the government will be able to review the Additional
Buyer’s Stamp Duty (ABSD), Seller’s Stamp Duty (SSD) and Total Debt Servicing Ratio
(TDSR) in 2015.
For Full Report: Please click here
NUS/Wharton/Tsinghua Chinese Residential Land Price Indexes
(CRLPI)
Prof Yongheng Deng Institute of Real Estate Studies National University of Singapore
Prof Joseph Gyourko The Wharton School University of Pennsylvania
A/Prof Jing Wu Hang Lung Center for Real Estate Tsinghua University
The NUS/Wharton/Tsinghua Chinese Residential Land Price Indexes (CRLPI) reports series
on real constant quality land prices across 35 major markets in China. See our white paper for
more information on the underlying data and technical issues in the creation of the index.
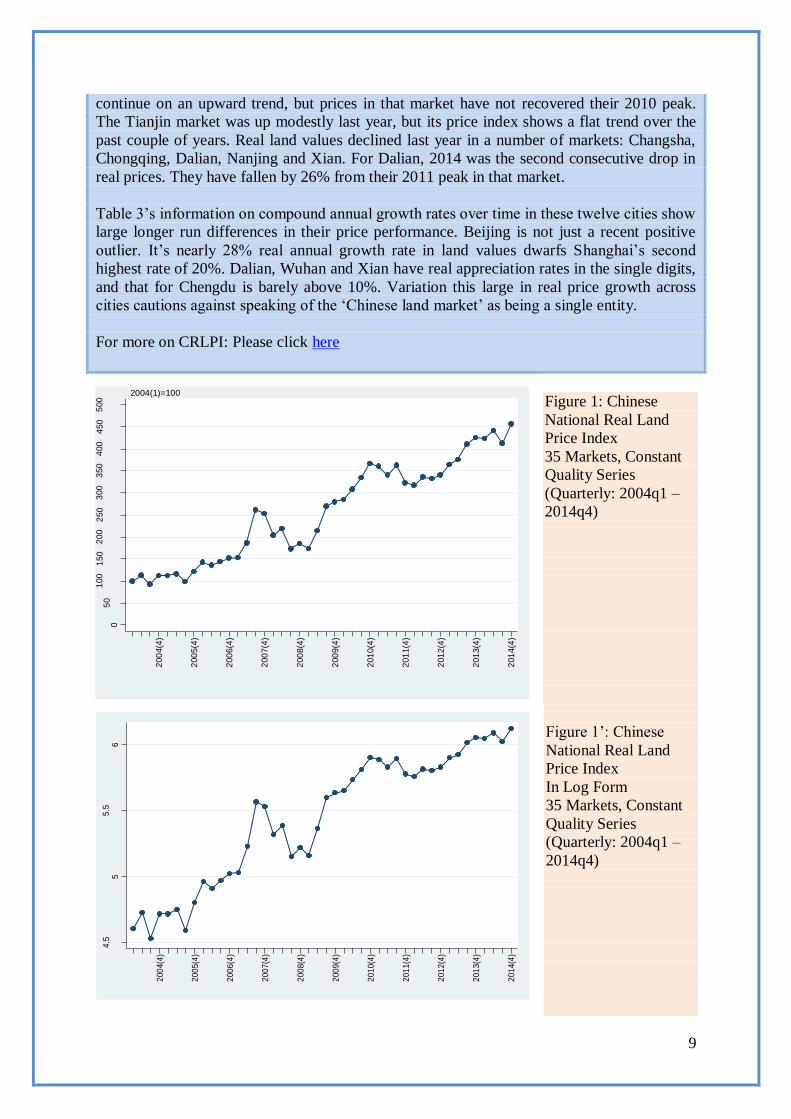
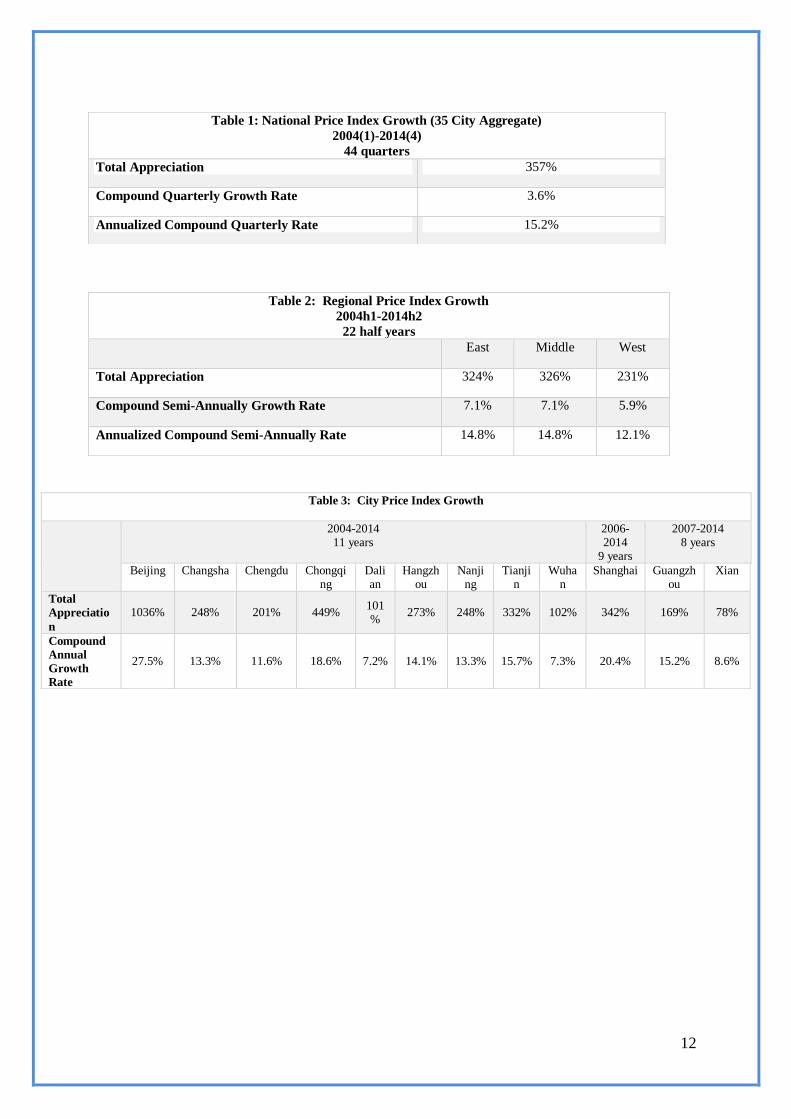
The NUS/Wharton/Tsinghua Chinese Residential Land Price Index appreciated by nearly
11% during the fourth quarter of 2014, more than recovering from the 6.8% drop in the
previous quarter. Figure 1’s plot of the aggregate index still shows that growth in Chinese
land markets has begun to slow on average, with two of the last four quarters showing real
declines in values. Calendar year 2014 saw the aggregate index rise by 7.1%, which still
leaves the real annual compound appreciation rate over the past eleven years at 15.2% (see
Table 1 below).
Even though real land prices recovered in aggregate, transactions volumes did not. Figure 2’s
plot of the number of vacant land parcels sold across the 35 major markets shows on 277
sales occurred in 2014(4)). This is 56% of the sales volume from a year earlier in 2013(4) and
only 40% of the number sold two years earlier in 2012(4). The last three quarters of data
show sales volumes not seen since the global financial crisis.
The end of the year also allows us to update our regional indexes in Figure 3. Two of the
three regions saw price declines in the second half of 2014. The Middle region index declined
by 3%, following a robust appreciation of 11% during the last two quarters. The decline in
the West region index also by 3%, was the second in a row for that region. Its land values fell
by over 12% on the year. Real growth in the East region remains positive, although it slowed
a bit, to 4% in the second half of 2014 from 6% in the first half.
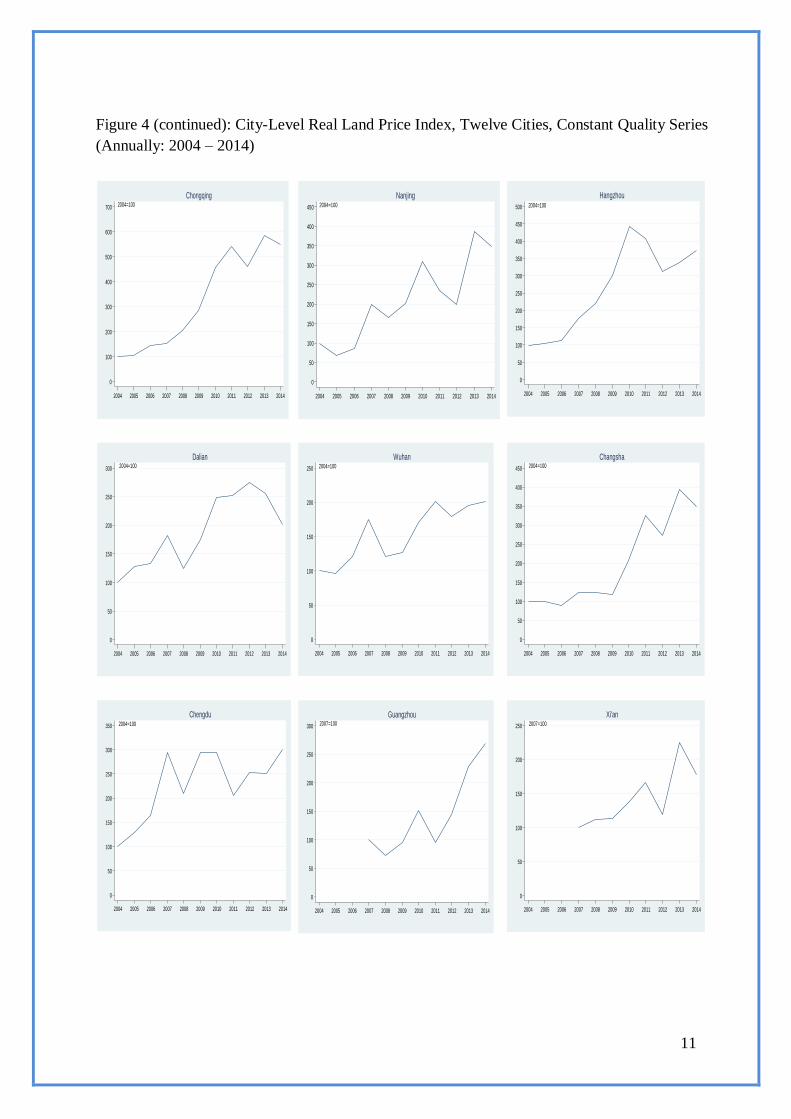
Clearly, recent growth in the aggregate index is being driven by cities in the East region of
China. Table 2 reports data on long-run growth rates in each region. Figure 4 plots land price
indexes for the dozen markets for which we have enough land sales to estimate constant
quality prices annually. Some markets such as Beijing remain remarkably robust. After a very
strong 47% real price growth in 2013, Beijing’s land price index grew by an even higher 54%
in 2014.
Over the decade-long period for which we have data on the Chinese capital, real land values
have increased by 1,036 percent. Hangzhou, Guangzhou, Shanghai and Wuhan also have
experienced two consecutive years of real price growth. However, none has seen aggregate
growth over time that approaches that for Beijing. And, the positive trend in the Guangzhou
and Shanghai markets is stronger than Hangzhou and Wuhan. Hangzhou’s land values also
9
continue on an upward trend, but prices in that market have not recovered their 2010 peak.
The Tianjin market was up modestly last year, but its price index shows a flat trend over the
past couple of years. Real land values declined last year in a number of markets: Changsha,
Chongqing, Dalian, Nanjing and Xian. For Dalian, 2014 was the second consecutive drop in
real prices. They have fallen by 26% from their 2011 peak in that market.
Table 3’s information on compound annual growth rates over time in these twelve cities show
large longer run differences in their price performance. Beijing is not just a recent positive
outlier. It’s nearly 28% real annual growth rate in land values dwarfs Shanghai’s second
highest rate of 20%. Dalian, Wuhan and Xian have real appreciation rates in the single digits,
and that for Chengdu is barely above 10%. Variation this large in real price growth across
cities cautions against speaking of the ‘Chinese land market’ as being a single entity.
For more on CRLPI: Please click here
Figure 1: Chinese
National Real Land
Price Index
35 Markets, Constant
Quality Series
(Quarterly: 2004q1 –
2014q4)
Figure 1’: Chinese
National Real Land
Price Index
In Log Form
35 Markets, Constant
Quality Series
(Quarterly: 2004q1 –
2014q4)
4.5
55
.56
200
4(4
)
200
5(4
)
200
6(4
)
200
7(4
)
200
8(4
)
200
9(4
)
201
0(4
)
201
1(4
)
201
2(4
)
201
3(4
)
201
4(4
)
05
01
00
150
200
250
300
350
400
450
500
200
4(4
)
200
5(4
)
200
6(4
)
200
7(4
)
200
8(4
)
200
9(4
)
201
0(4
)
201
1(4
)
201
2(4
)
201
3(4
)
201
4(4
)
2004(1)=100

10
Figure 2: Number of
Parcels Sold
35 Markets (Quarterly:
2004q1 – 2014q4)
Figure 3: Chinese
Regional Real Land
Price Index
East, Middle and West
Regions, Constant
Quality Series
(Semi-annually:
2004h1 – 2014h2)
Figure 4: City-Level Real Land Price Index, Twelve Cities, Constant Quality Series
(Annually: 2004 – 2014)
0
100
200
300
400
500
600
700
200
3(4
)
200
4(4
)
200
5(4
)
200
6(4
)
200
7(4
)
200
8(4
)
200
9(4
)
201
0(4
)
201
1(4
)
201
2(4
)
201
3(4
)
201
4(4
)
100
200
300
400
500
2004h2 2005h2 2006h2 2007h2 2008h2 2009h2 2010h2 2011h2 2012h2 2013h2 2014h2
East Middle West
2004h1=100
0
100
200
300
400
500
600
700
800
900
1000
1100
2004 2005 2006 2007 2008 2009 2010 2011 2012 2013 2014
2004=100
Beijing
0
50
100
150
200
250
300
350
400
450
500
2004 2005 2006 2007 2008 2009 2010 2011 2012 2013 2014
2004=100
Tianjin
0
50
100
150
200
250
300
350
400
450
2004 2005 2006 2007 2008 2009 2010 2011 2012 2013 2014
2006=100
Shanghai
11
Figure 4 (continued): City-Level Real Land Price Index, Twelve Cities, Constant Quality Series
(Annually: 2004 – 2014)
0
100
200
300
400
500
600
700
2004 2005 2006 2007 2008 2009 2010 2011 2012 2013 2014
2004=100
Chongqing
0
50
100
150
200
250
300
350
400
450
2004 2005 2006 2007 2008 2009 2010 2011 2012 2013 2014
2004=100
Nanjing
0
50
100
150
200
250
300
350
400
450
500
2004 2005 2006 2007 2008 2009 2010 2011 2012 2013 2014
2004=100
Hangzhou
0
50
100
150
200
250
300
2004 2005 2006 2007 2008 2009 2010 2011 2012 2013 2014
2004=100
Dalian
0
50
100
150
200
250
2004 2005 2006 2007 2008 2009 2010 2011 2012 2013 2014
2004=100
Wuhan
0
50
100
150
200
250
300
350
400
450
2004 2005 2006 2007 2008 2009 2010 2011 2012 2013 2014
2004=100
Changsha
0
50
100
150
200
250
300
350
2004 2005 2006 2007 2008 2009 2010 2011 2012 2013 2014
2004=100
Chengdu
0
50
100
150
200
250
300
2004 2005 2006 2007 2008 2009 2010 2011 2012 2013 2014
2007=100
Guangzhou
0
50
100
150
200
250
2004 2005 2006 2007 2008 2009 2010 2011 2012 2013 2014
2007=100
Xi'an
12
Table 1: National Price Index Growth (35 City Aggregate)
2004(1)-2014(4)
44 quarters
Total Appreciation 357%
Compound Quarterly Growth Rate 3.6%
Annualized Compound Quarterly Rate 15.2%
Table 2: Regional Price Index Growth
2004h1-2014h2
22 half years
East Middle West
Total Appreciation 324% 326% 231%
Compound Semi-Annually Growth Rate 7.1% 7.1% 5.9%
Annualized Compound Semi-Annually Rate 14.8% 14.8% 12.1%
Table 3: City Price Index Growth
2004-2014 11 years
2006-2014
9 years
2007-2014 8 years
Beijing Changsha Chengdu Chongqing
Dalian
Hangzhou
Nanjing
Tianjin
Wuhan
Shanghai Guangzhou
Xian
Total
Appreciatio
n
1036% 248% 201% 449% 101%
273% 248% 332% 102% 342% 169% 78%
Compound
Annual
Growth
Rate
27.5% 13.3% 11.6% 18.6% 7.2% 14.1% 13.3% 15.7% 7.3% 20.4% 15.2% 8.6%
13
Research Highlights / Articles _________________________________________________________
Property Price Upsurge in Singapore’s Mass Market – How the Role of
Foreign Capital Affects You
View the original research paper here:
Authors: A/Prof. Wen-Chi Liao | Dr. Daxuan Zhao | Ms. Li Ping Lim | Dr. Grace Khei Mie Wong
Article contribution by: Mr. Edwin Heng
Engage in conversation with any resident and the proverbial property ogre would invariably
rear its head, sneaking its way into even the most casual of banter topics. Whether we gripe
or cheer, there is recognition that the perennial talk of the town in Singapore revolves largely
around housing.
Indeed, regardless of creed or social standing, with home ownership on the island state
hovering around the 90% mark, housing related issues remain close to our hearts.
To be sure, depending on what you are angling from the market, the property ogre can be
perceived either way – friend or fiend. As recent as four years ago, during the period 2010-11,
strong global economic tailwinds seemed to have provided the ogre with a pair of wings.
Housing prices headed north rapidly and surged past the previous peak last seen in 1998,
before the onset of the Asian Financial Crisis. This came on the back of Asia’s surging
growth, an expanding middle income populace in the region, China’s fast swelling affluent
class and a global economy awash with liquidity. Correspondingly, the issue of affordability
surfaced. Fingers were frantically pointing, searching for a convenient scapegoat to reproach.
This article does not dispute the possibility that a confluence of each of these or more factors
may be involved in bolstering the growth of real estate prices in Singapore. Neither is this
article a debate about the culpability of any of these factors. Rather, it takes a close and hard
look at the extent to which foreign liquidity in general may have played in influencing price
movements in the local real estate market.
So, what’s the upshot of this?
Simply put, the inflow of foreign money into the central region of Singapore’s private
property market does not only spark an uptick of prices in the core regions, but also brings
about a ‘ripple effect’ that affects prices in the non-central regions. This ‘ripple effect’ could
account for as much as 25% of the fluctuations in house price growth in these regions. This
may extend further outwards and invariably affect public housing prices as well, a segment
where foreigners’ participation is less active and where over 80% of the population resides.
An understanding of how foreign money affects the price dynamics and how the transmission
mechanism operates on our local shores would therefore allow for more informed policy
decision making. This is especially pertinent since home ownership in Singapore forms the
cornerstone of our public housing programme. In Singapore, the government attempts to
influence the flow of foreign liquidity in part to stabilize the nation’s real estate market. It
14
does so by adjusting its regulations on foreign investment - easing them in a dull market and
tightening them when the market is looking to overheat.
Before we become all edgy, let’s take a quick look back at how regulations shaped the
housing landscape.
Regulations on foreign buyers’ home purchases go back a long way, to 1973. To ensure
affordable and sufficient housing for Singaporeans, the Residential Property Act imposed
restrictions on foreign ownership of private residential property, namely, that foreigners
could only acquire apartments in buildings higher than 6 stories or in approved condominium
developments.
Let’s fast forward to the 21st century when the market has already developed a certain
buoyancy on the back of sustained economic growth.
Unfortunately, several events during this period placed a dampener on the housing market,
namely, the bust of the Dot-Com bubble and the outbreak of the Severe Acute Respiratory
Syndrome (SARS) epidemic. The housing market took a hit. Its continued sluggishness was
not something to be welcomed given that housing asset in Singapore holds the largest store of
household wealth for many. This could pose severe financial hardship for a large number of
people if not properly managed.
Against this backdrop of what may be described as a somewhat languid, or dismal as what
others may term, housing market, a calibrated scaling back on foreign ownership restrictions
was initiated:
In 2004, foreigners were allowed to buy land parcels and completed homes at Sentosa
Cove.
In 2005, the government removed the restriction for foreigners in owning apartments
below 6 stories, raised the loan-to-value limit and reduced the cash down payment.
The result?
The percentage of foreign buyers rose from 6% to 10% within 2 quarters and the presale
segment increased from 6% to 17%, after the first slew of measures in 2004. From 2005 to
2007, foreign buyers accounted for 10% and 15% sales in the entire private residential market
and the presale segment, respectively. Compare that to the period 2000-04 when total sales
made to foreigners accounted for only 6%. Overall, between the period 2004 and 2011,
private property purchases by foreigners, excluding permanent residents, constituted a share
of approximately 11% of all property transactions in Singapore.
As you would have rightly guessed, there is uneven distribution geographically.
Sales to foreigners on average constituted 14% of total sales in the central region, but only
5% in the North-East and North regions. Perhaps due to the low concentration of foreign
purchases in the suburban areas, the growth of foreigners’ acquisitions in these non-central
regions display a smaller price impact on overall property prices in these regions, relative to
the more significant price impact in the central region created by the higher concentration of
foreign purchases in the central.
15
That is not all. As mentioned earlier, what is more interesting is that in addition to the direct
price impact to the non-central regions created by foreign purchases in these regions, property
prices in the non-central regions were also affected by the upsurge of prices in the central
regions – the ‘ripple effect’.
Presumably, the reverse holds true and we can imagine the pricing dynamics working in
reverse order when converse conditions prevail, setting in motion the property wheels which
would again cause some to gripe and others to cheer.
This article attempts to take a crack at examining the hard but real issue of how and the extent
to which foreign liquidity can exert upward pressure on asset prices in Singapore. Even as it
aims to inform the public, it recognizes that the government has been handed the most
unenviable and challenging task of managing people’s expectations, yet treading a fine line of
ensuring that its citizenry’s store of wealth in property is maintained, or better still,
appreciating year-on-year, and still having to contain possible run-away prices that would
rouse the affordability beast.
_______________________________________________
Selectivity, Spatial Autocorrelation, and the Valuation of Transit
Accessibility
Principal Investigator: Dr. Mi Diao
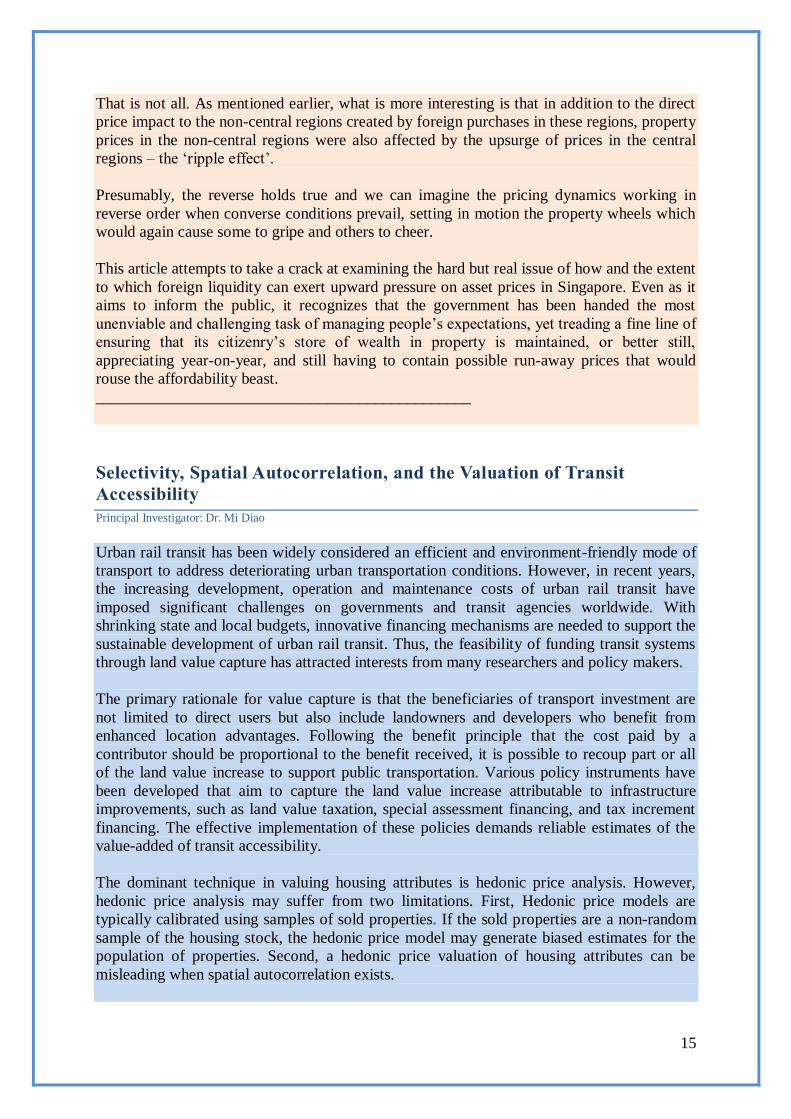
Urban rail transit has been widely considered an efficient and environment-friendly mode of
transport to address deteriorating urban transportation conditions. However, in recent years,
the increasing development, operation and maintenance costs of urban rail transit have
imposed significant challenges on governments and transit agencies worldwide. With
shrinking state and local budgets, innovative financing mechanisms are needed to support the
sustainable development of urban rail transit. Thus, the feasibility of funding transit systems
through land value capture has attracted interests from many researchers and policy makers.
The primary rationale for value capture is that the beneficiaries of transport investment are
not limited to direct users but also include landowners and developers who benefit from
enhanced location advantages. Following the benefit principle that the cost paid by a
contributor should be proportional to the benefit received, it is possible to recoup part or all
of the land value increase to support public transportation. Various policy instruments have
been developed that aim to capture the land value increase attributable to infrastructure
improvements, such as land value taxation, special assessment financing, and tax increment
financing. The effective implementation of these policies demands reliable estimates of the
value-added of transit accessibility.
The dominant technique in valuing housing attributes is hedonic price analysis. However,
hedonic price analysis may suffer from two limitations. First, Hedonic price models are
typically calibrated using samples of sold properties. If the sold properties are a non-random
sample of the housing stock, the hedonic price model may generate biased estimates for the
population of properties. Second, a hedonic price valuation of housing attributes can be
misleading when spatial autocorrelation exists.
16
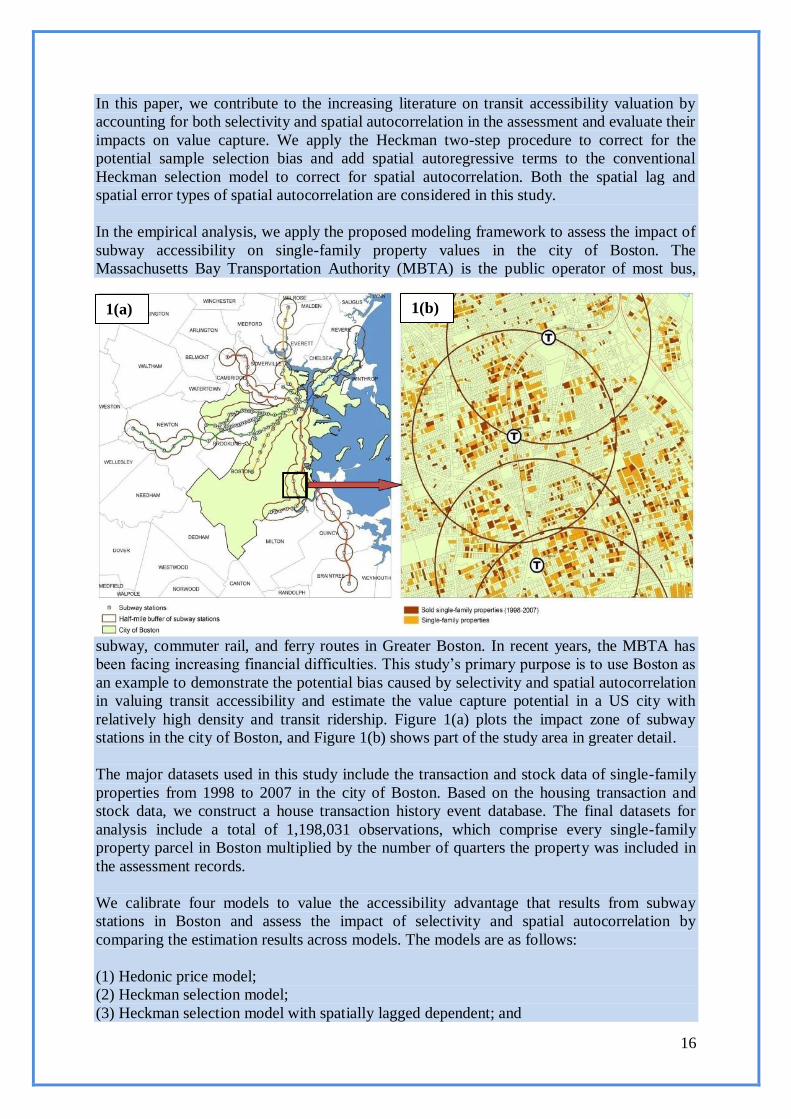
In this paper, we contribute to the increasing literature on transit accessibility valuation by
accounting for both selectivity and spatial autocorrelation in the assessment and evaluate their
impacts on value capture. We apply the Heckman two-step procedure to correct for the
potential sample selection bias and add spatial autoregressive terms to the conventional
Heckman selection model to correct for spatial autocorrelation. Both the spatial lag and
spatial error types of spatial autocorrelation are considered in this study.
In the empirical analysis, we apply the proposed modeling framework to assess the impact of
subway accessibility on single-family property values in the city of Boston. The
Massachusetts Bay Transportation Authority (MBTA) is the public operator of most bus,
subway, commuter rail, and ferry routes in Greater Boston. In recent years, the MBTA has
been facing increasing financial difficulties. This study’s primary purpose is to use Boston as
an example to demonstrate the potential bias caused by selectivity and spatial autocorrelation
in valuing transit accessibility and estimate the value capture potential in a US city with
relatively high density and transit ridership. Figure 1(a) plots the impact zone of subway
stations in the city of Boston, and Figure 1(b) shows part of the study area in greater detail.
The major datasets used in this study include the transaction and stock data of single-family
properties from 1998 to 2007 in the city of Boston. Based on the housing transaction and
stock data, we construct a house transaction history event database. The final datasets for
analysis include a total of 1,198,031 observations, which comprise every single-family
property parcel in Boston multiplied by the number of quarters the property was included in
the assessment records.
We calibrate four models to value the accessibility advantage that results from subway
stations in Boston and assess the impact of selectivity and spatial autocorrelation by
comparing the estimation results across models. The models are as follows:
(1) Hedonic price model;
(2) Heckman selection model;
(3) Heckman selection model with spatially lagged dependent; and
1(b) 1(a)
17
(4) Heckman selection model with spatially lagged error term.
The estimation results suggest that the sample of sold properties is a non-random sample of
the population of single-family properties. Exclusive reliance on the sample of sold properties
in the assessment tends to produce biased inference for the entire housing stock. The price
model exhibits significant spatial dependence in the form of both spatial lag and spatial error.
After controlling for the structural, neighborhood socioeconomic, and built-environment
variables and the transaction quarter, we find that households in Boston pay a premium for
living within one-half mile of a subway station, as reflected by the positive and significant
coefficients of the proximity to a subway station variable in the four models.
The willingness-to-pay (WTP) for subway accessibility is computed for a property priced at
325.0 thousand dollars (the mean sale price of the sold sample). The WTP estimates differ
across the four models significantly, which suggests that selectivity and spatial
autocorrelation play a significant role in valuing subway accessibility. Based on the result of
the conventional hedonic price model, the WTP for subway accessibility is 19.1 thousand
dollars for a property valued at the mean transaction price of 325.0 thousand dollars.
However, the amount decreases to 10.0 thousand dollars when selectivity and spatial-error
type autocorrelation are controlled. The related bias is approximately 91.0%. A bias of such
magnitude could misinform relevant policy designs on value capture program.
Based on the assessment records for 2005, the aggregate assessed value for single-family
properties in the impact zone of subway stations is 3.6 billion dollars. If we apply the
estimation result of the Heckman selection model with spatial error to the assessed value of
single-family properties in the impact zone, the total value-added of subway stations is 109.9
million dollars, which is approximately 3.05% of the total assessed value. However, single-
family properties represent only a small portion of residential properties. The value-added of
the MBTA subway system could be even higher if we consider other types of residential
properties and commercial properties in the impact zone. This initial assessment reveals the
substantial potential of value capture that is available for the MBTA. However, under a
hypothetical property tax reassignment scenario, the annual revenue from value capture is
small compared with the transit fare revenue and the operating deficit of the MBTA. Without
an additional tax burden on the residents, property-tax-based value capture programs are
unlikely to contribute significantly in reducing the MBTA’s deficit.
18
Events _________________________________________________________
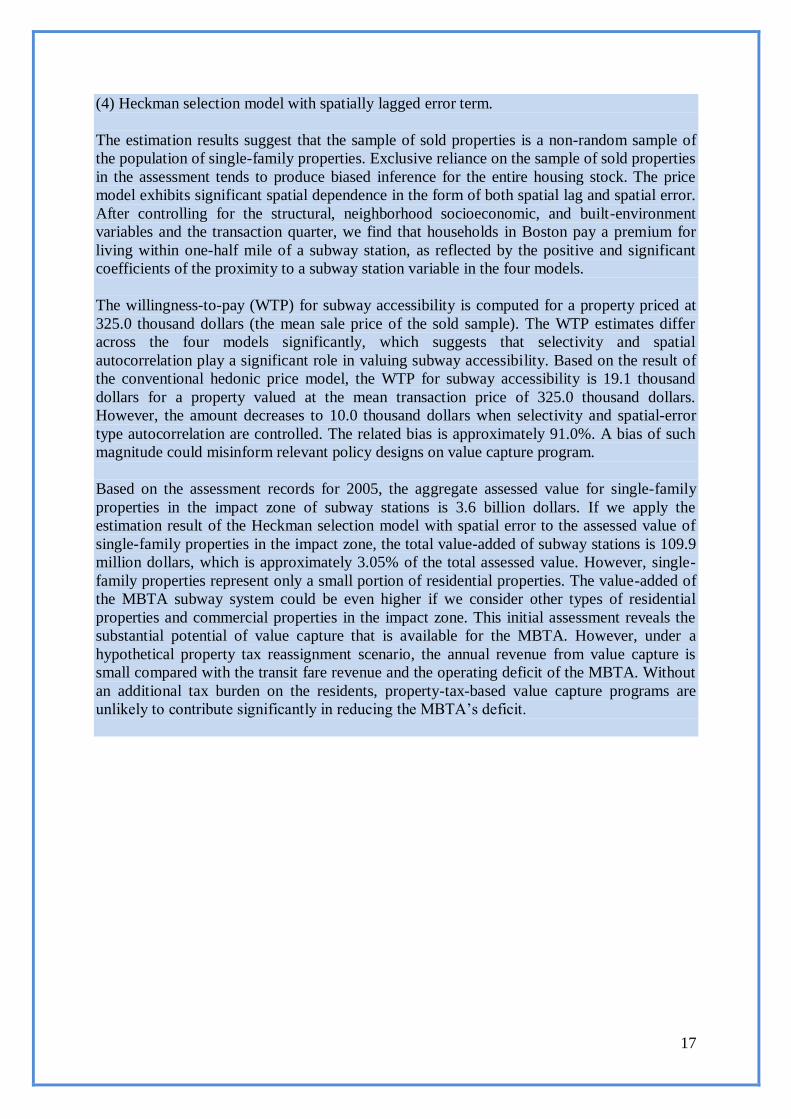
AREUEA-ASSA Annual Conference
Prof Deng Yongheng,
Provost’s Chair and Director
of NUS Institute of Real
Estate Studies, and Head of
Department of Real Estate,
has delivered the AREUEA
Presidential Speech to
members and friends of the
American Real Estate and
Urban Economics Association
(AREUEA) at the AREUEA-
ASSA Annual Conference in
Boston, on 4th January 2015.
Established 50 years ago with 20 academics from the United States, AREUEA has since
grown and now boasts a strong base of 800 members hailing from leading universities all
around the world.
Prof Deng is the first academic of Asian background to be elected as President of this
prestigious academic association in the field of real estate finance and urban economics over
the half century history of AREUEA. Along with its growing academic clout that has
extended beyond the shores of the western hemisphere in recent years, this is also a solid
Yongheng Deng Provost’s Chair Professor, Director of
Institute of Real Estate Studies and Head of
Department of Real Estate at the National University of Singapore.
50th President of the American Real Estate &
Urban Economics Association
“Singapore contributed about 40% of the rising (trend)
in Asia research …” - referring to the share of authors from each country/region
out of the total number of authors from Asian
universities/institutions

19
reflection and testament on how interest in real
estate finance and urban economic research has
steadily been shifting towards Asia.
Prof Deng’s AREUEA presidential speech,
titled “Disparities in the Geographic Focus of
Real Estate and Urban Economics
Publications,” is most apt in revealing this
emerging trend. It demonstrates that while
research papers centred around U.S. topics are
more likely to appear in top-tier Economics,
Finance, and Real Estate journals, in recent
years, we have been witnessing a rising trend of
publications on Asian topics in these top-tier academic journals.
His research also shows that even as more authors from leading Asian universities/research
institutions continue to contribute to the top-tier journal publications in the fields of real
estate finance and urban economics over the years, authors affiliated with Singaporean
universities contribute about 40% of this growing trend.
Click to watch …
20
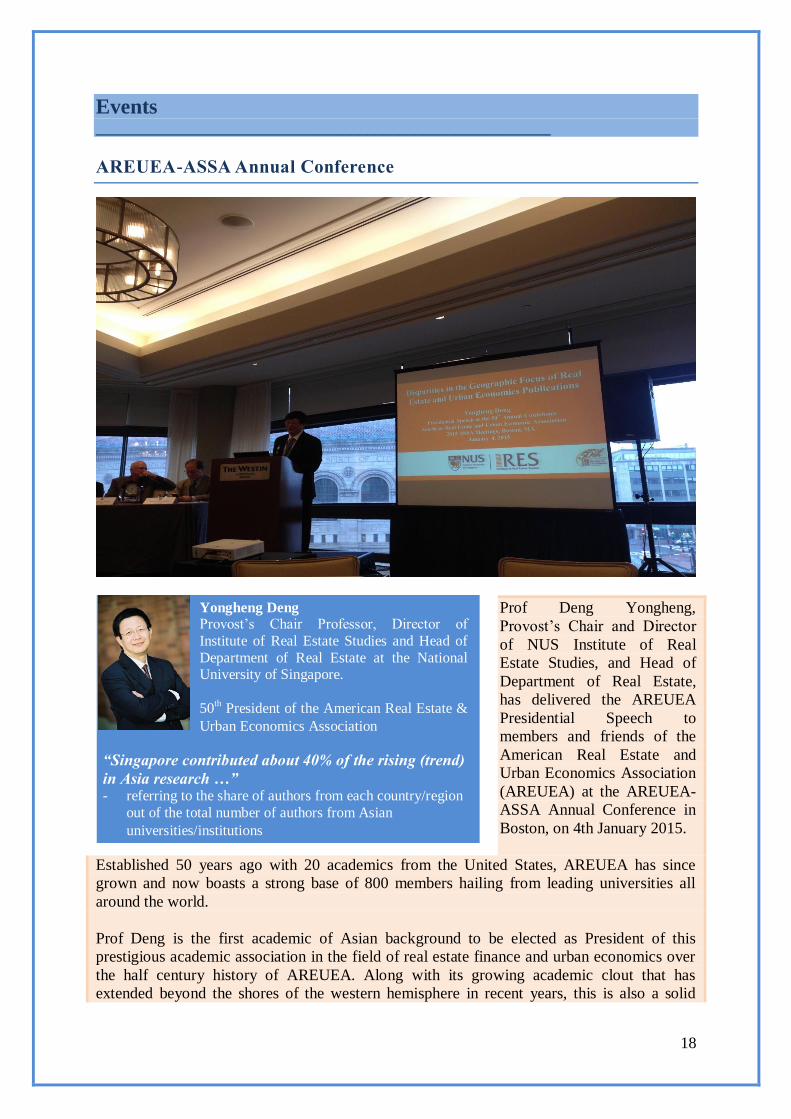
5th Annual Conference of Real Estate Industry in China
IRES Director, Professor Deng Yongheng, was invited to
give the keynote speech at the 5th Annual Conference of
Real Estate Industry in China, held in Sanya City, Hainan
Island, China. The theme of the conference focuses on
China’s urbanization process: the challenges and
opportunities arising from China’s inflection point in the
current property cycle towards a slower but steadier long-
term growth.
Professor Deng spoke on the “fission, survival, integration”
of the property and financial markets in China, the trend of
the imbalance in the Chinese local government’s budget,
the securitization of real estate assets - touching on
mortgage backed securities and the creation of real estate
investment trusts (REITs).
The Annual Conference was attended by some of the major players in China’s property
market, for example, Vanke, Greenland and Sino-Ocean Land. The conference was held
from 14th – 16
th January 2015 and provided a platform for industry players to review the
current status of China’s real estate market, discuss the challenges faced in moving on to the
“silver times” of China’s property market including the use of social media marketing and big
data, and brainstorm on solutions to overcome these problems.

21
What’s Coming Up? _________________________________________________________
NUS-IRES Public Lecture
"WHAT IS BEHIND THE DISAPPOINTING GROWTH WORLDWIDE AFTER
THE FINANCIAL CRISIS?"
Professor Kiyohiko G. Nishimura
Dean of the Graduate School of Economics &
Chairman of the Faculty of Economics, University of Tokyo
Date: 17 March (Tuesday)
Time: 12:00pm – 2:00pm
Venue: Seminar Room Level 1,
I3 Building, NUS
21 Heng Mui Keng Terrace, Singapore 119613
Abstract:
What is behind the disappointing growth worldwide after the Financial Crisis? It is the
composite effect of three simultaneous global "seismic" shifts: (a) a persistent fallout from
the "great property bubbles/busts" (b) employment-unfriendly technological change of ICT,
and (c) a shift from the demographic bonus phase to the onus phase of aging population in
many economies.
This lecture discusses their macroeconomic implications both in the short run and long run, in
particular in developed economies. The focus is on the role of monetary policy in this new
environment.
Guest Speaker Biography:
Kiyohiko G. Nishimura is Dean of the Graduate School of Economics and Chairman of the
Faculty of Economics at the University of Tokyo. Before returning to academia, he was
Deputy Governor for five years until March 19, 2013, one of the most turbulent periods in the
history of the world economy and central banking. He has been particularly influential in the
debates over macro-prudential policies, especially in pointing out the critical importance of
demographic factors on property bubbles and financial crisis. His work and speeches on
demography and economic policy have been cited widely and policy makers around the
world have increasingly been recognizing the urgency of the problem. He received his B.A.
(1975) and M.A. (1977) from the University of Tokyo, and Ph. D. (1982) from Yale
University. He was an Arthur M. Okun Research Fellow (1981-1982) at the Brookings
Institution in Washington, D.C., before joining the Faculty of Economics at the University of
Tokyo in 1993 where he was Associate Professor (1983-1994) and Professor (1994-2005).
He was jointly appointed as Executive Research Fellow of the Economic and Social Research
Institute of the Cabinet Office of the Government of Japan between 2003 and 2005, before
Click here to register
Program
12:00 – 12:15 Registration 12:15 – 13:00 Public Lecture
13:00 – 13:15 Q&A
13:15 – 14:00 Networking Lunch

22
joining the Bank of Japan as its Member of the Policy Board (2005-2008), and then as
Deputy Governor (2008-2013). Since February 2014, he is Chairman of the Statistical
Commission of the Government of Japan, which oversees the official statistics in Japan.
He is now a senior advisor of the Asian Economic Panel and a member of the editorial board
of several international academic journals in economics and management sciences. He also
held business positions before joining the Bank of Japan: he sat on the Advisory Board of the
Fujitsu Research Institute (Japan) and he was an academic advisor of Recruit Ltd. (Japan) and
Investment Property Databank (U.K.). Since July 2014, he is a non-executive director of
COOKPAD Inc., a global IT company managing the world’s largest recipe-exchange site on
the smartphone platform. Since December 2014, he is a member of the MNI Connect
Advisory Board of Market News International, a leading provider of news and intelligence
for the global foreign exchange and fixed income markets.
Faculty / Student News _________________________________________________________
Faculty Achievements
Professor Liow Kim Hiang
Professor Liow Kim Hiang's paper with Schindler, Felix, entitled "Linkages
and Volatility Spillover Effects Between Office Markets in Europe" had
won the DTZ Research Institute Award for Academic Innovation 2014.
Professor Ong Seow Eng
ARES Manuscript Prize was awarded to Professor Ong Seow Eng, Deng
Xiaoying (PhD student) and Dr Qian Meijun (NUS Business School) for
their joint paper "Real Estate Risk, Corporate Investment and Financing
Choice". The paper was presented at ARES Meeting held from 1-5 April
2014 in California, USA.
Prof Ong was also awarded a School Teaching Excellence Award for
AY2013/2014.
Dr Malone-Lee Lai Choo
Dr Malone-Lee Lai Choo has been invited to join the International
Advisory Board of the Graduate Program in Sustainability Science-Global
Leadership Initiative (GPSS-GLI) of the University of Tokyo in December
2014.

23
The following faculty members were awarded the School
Teaching Excellence Award for AY2013/2014.
(Clockwise from top left: Assoc. Prof. Alice Christudason,
Dr. Chow Yuen Leng, Dr. Seah Kiat Ying, Dr. Masaki Mori)
Student Achievements
4th Year student, Deborah Cheok, did us proud when she won the annual
English Economic Essay Contest (International category) organized by
The Korea Times (English Version) for university students around the
world.
Her award-winning essay centred on the topic: “How can Korea have
Samsung- or Hyundai-like global players in the financial sector?" It was
published on 19 November 2014 as part of the 64th
anniversary celebration
of The Korea Times.
Department of Real Estate
School of Design and Environment
National University of Singapore
4 Architecture Drive
Singapore 117566
Institute of Real Estate Studies
National University of Singapore
21 Heng Mui Keng Terrace
#04-02 I-Cube Building
Singapore 119613
Get Connected!
Go back to the top
The NUS Real Estate News may also be accessed on the website of
the NUS Department of Real Estate:
http://www.rst.nus.edu.sg/newsreal/index.html