nutrient criteria development in maine coastal waters: review of existing data … · ·...
TRANSCRIPT
1
NUTRIENT CRITERIA DEVELOPMENT IN MAINE COASTAL WATERS:
REVIEW OF EXISTING DATA AND PRELIMINARY STATISTICAL ANALYSES
Background and Purpose
The Clean Water Act (CWA) directs the U.S. Environmental Protection Agency (EPA) to restore and
maintain the chemical, physical, and biological integrity of the Nation‟s waters. Under the CWA, EPA
has established a Water Quality Standards Program to help achieve this objective, and EPA Region 1 has
worked closely with the New England states over the past decade to develop and incorporate nutrient
criteria into state water quality standards. While good progress has been made by states like Maine
towards establishing freshwater criteria, little progress has been made in establishing nutrient criteria for
marine waters. EPA Region 1 retained a contractor to assist the Region in working with the Maine
Department of Environmental Protection (ME DEP) and other stakeholders to plan the nutrient criteria
development process for marine waters in Maine, as well as to prepare a report that summarizes data
availability and preliminary analyses to support nutrient criteria development in Maine coastal waters.
This report is based, in part, on a revision of the draft conceptual plan that was prepared by Battelle
(2008). Specifically, this plan incorporates the analytical results of the additional water quality surveys
that took place in 2009 and provides recommendations for developing nutrient criteria and additional
future work. This plan also reviews preliminary statistical analyses (e.g., correlations, distributions, and
regressions) associated with the key causal variable (nitrogen concentration) and a series of water quality
and ecosystem indicators, some of which are response variables (chlorophyll a, dissolved oxygen, water
clarity).
Three technical meetings were held in the ME DEP Portland offices over the course of this task. These
meetings served to openly communicate ME DEP‟s short- and long-term goals for nutrient criteria
development in coastal waters. They also provided a forum for technical discussions on nutrient
enrichment in coastal waters and how criteria development would need to be driven. Lastly, these
meetings aided the planning of the 2009 coastal surveys.
Additional background to nutrient criteria development is provided below. This is followed by a
summary of data collected, preliminary statistical analyses of these data, and a set of analyses based on
the 2009 field surveys. Recommendations for future work are also provided.
Section 1.0 Introduction
EPA published a National Nutrient Strategy (EPA 1998), which describes the approach for adopting
nutrient criteria to meet the goals of the Clean Water Action Plan. The establishment of nutrient criteria
is critical to the process of managing our water resources. Nutrients are essential for aquatic ecosystems,
but they are also a major factor in the environmental degradation of our rivers, streams, lakes, ponds,
estuaries and coastal waters. Geographically, there are large variations in the natural physical, chemical,
and biological characteristics of water resources (and adjacent lands) that influence how a particular water
body responds to changes in nutrient loads. In order to take these variations into account, nutrient criteria
must be established on appropriate spatial scales and not merely dictated on a national scale. Therefore,
the major focus of the National Nutrient Strategy has been the development of technical guidance
documents for specific water body types (i.e., lakes/reservoirs, rivers/streams, estuarine/coastal waters).
Temporal scales may also be considered as nutrient dynamics can change seasonally.
Nutrients are important drivers of production in coastal ecosystems. Nutrient inputs, like fertilizers in
terrestrial systems, enhance rates of primary production in the water column and in the benthos (sea

2
bottom). Increases in nutrient loads to coastal systems correspond to increases in the production of
organic matter (phytoplankton, microalgae, macroalgae) and changes in the flow of energy throughout
associated food chains (animals, bacteria, etc.). Typical undesirable results of nutrient over-enrichment is
an increased demand for dissolved oxygen as organic matter is metabolized, decreased light availability
throughout the water column and to the benthos, and the cumulative effect of these processes on changes
to various components of coastal ecosystems. These changes include species composition and physical
conditions. In marine systems in the northeast United States, nitrogen is usually the nutrient that limits
rates of primary production. Therefore, the control of nitrogen enrichment is of primary interest to coastal
managers in order to prevent undesirable conditions or to improve degraded systems. The purpose of
developing nutrient criteria for coastal systems is to achieve these management goals through the
establishment of thresholds in nutrient loads and/or system indicators.
A technical guidance manual for developing nutrient criteria in estuarine and coastal marine waters was
published in 2001 (EPA 2001). The guidance manual provides an in-depth review of nutrient issues
facing US coastal waters including eutrophication, red tides, hypoxia, and loss of seagrass and other
benthic habitats. The guidance focuses on causal (nitrogen and phosphorus) and response (chlorophyll,
dissolved oxygen, and water clarity) variables, but highlights the importance of N as the limiting nutrient
in most coastal marine waters. The document also specifies a variety of approaches that could be used to
develop criteria and noted that other approaches may also be appropriate given the dynamic nature of
estuarine and other near shore marine waters. Whereas the guidance acknowledges that nutrient
management plans need to be economically feasible, and practical and acceptable to the communities
involved, the nutrient criteria themselves “must be based on sound scientific rationale and must contain
sufficient parameters or constituents to protect the designated use. For waters with multiple use
designations, the criteria shall support the most sensitive use.” [40 CFR Sec. 131.11] for the data
examination, examples, discussion, and recommendations contained in this report, the most sensitive use
is assumed to be protection of aquatic life uses.
This report focuses on existing coastal data for the State of Maine collected by a variety of sources and
the result of recent surveys taken under this task order. This report provides preliminary data analyses in
the form of data distributions of nitrogen and associated response variables and a series of linear
regressions. The results of these analyses describe current levels of nutrients and other key water quality
parameters in Maine coastal waters and are presented as an example of how nutrient criteria may be
developed in context with other states and regions (e.g., Oregon, New Hampshire). The focus of this
work is on near coastal water bodies within Maine‟s 3-mile zone of jurisdiction. While the influences
associated with systems that extend beyond this boundary may exist, this effort is concentrated on what
Maine DEP would consider Maine‟s coastal waters.
Section 1.1 Development Process
Maine, like many states, has been focused on the development of nutrient criteria in freshwater systems
(lakes/reservoirs and rivers/streams). These systems represent clearly defined water bodies that have been
monitored by ME DEP over the past few decades. The development of nutrient criteria for Maine‟s
estuaries and coastal waters has taken a back seat until recently. This has also been the case on the
national level as only a few states have developed estuarine nutrient criteria for N, P or response
parameters (HI, MD, DE, VA, CT, and NY). The Maryland, Delaware and Virginia criteria were
developed as part of the Chesapeake Bay criteria effort (EPA 2003) and the Connecticut and New York
criteria are only for dissolved oxygen in Long Island Sound. The difficulty in developing estuarine and
coastal criteria was understood by EPA and evident in the order in which EPA published the technical
guidance manuals for nutrient criteria development. The lakes/reservoirs and rivers/streams manuals
were published in April and July 2000, respectively (EPA 2000a and 2000b), while the estuary/coastal
manual was published a year and a half later (EPA 2001).
3
In Maine, the process of developing estuarine and coastal water nutrient criteria was pushed forward in
2007 with passage of LD 12971 by the 123
rd Maine State Legislature. Work Assignment 4-53 was
supported by EPA Region 1 to assist ME DEP in their efforts to comply with LD 1297 and this report
serves as an initial step in the development of a conceptual plan for establishing estuarine and coastal
nutrient criteria in Maine.
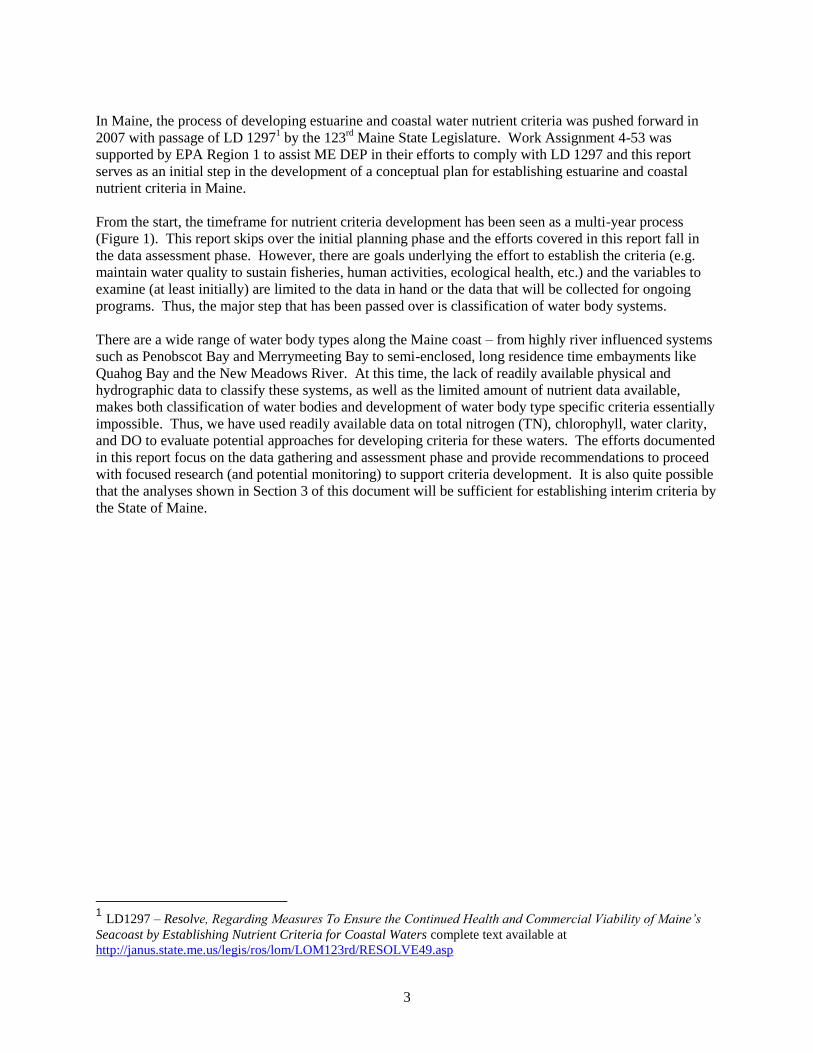
From the start, the timeframe for nutrient criteria development has been seen as a multi-year process
(Figure 1). This report skips over the initial planning phase and the efforts covered in this report fall in
the data assessment phase. However, there are goals underlying the effort to establish the criteria (e.g.
maintain water quality to sustain fisheries, human activities, ecological health, etc.) and the variables to
examine (at least initially) are limited to the data in hand or the data that will be collected for ongoing
programs. Thus, the major step that has been passed over is classification of water body systems.
There are a wide range of water body types along the Maine coast – from highly river influenced systems
such as Penobscot Bay and Merrymeeting Bay to semi-enclosed, long residence time embayments like
Quahog Bay and the New Meadows River. At this time, the lack of readily available physical and
hydrographic data to classify these systems, as well as the limited amount of nutrient data available,
makes both classification of water bodies and development of water body type specific criteria essentially
impossible. Thus, we have used readily available data on total nitrogen (TN), chlorophyll, water clarity,
and DO to evaluate potential approaches for developing criteria for these waters. The efforts documented
in this report focus on the data gathering and assessment phase and provide recommendations to proceed
with focused research (and potential monitoring) to support criteria development. It is also quite possible
that the analyses shown in Section 3 of this document will be sufficient for establishing interim criteria by
the State of Maine.
1 LD1297 – Resolve, Regarding Measures To Ensure the Continued Health and Commercial Viability of Maine’s
Seacoast by Establishing Nutrient Criteria for Coastal Waters complete text available at
http://janus.state.me.us/legis/ros/lom/LOM123rd/RESOLVE49.asp
4
Figure 1. Nutrient criteria development process timeline (EPA 2001).
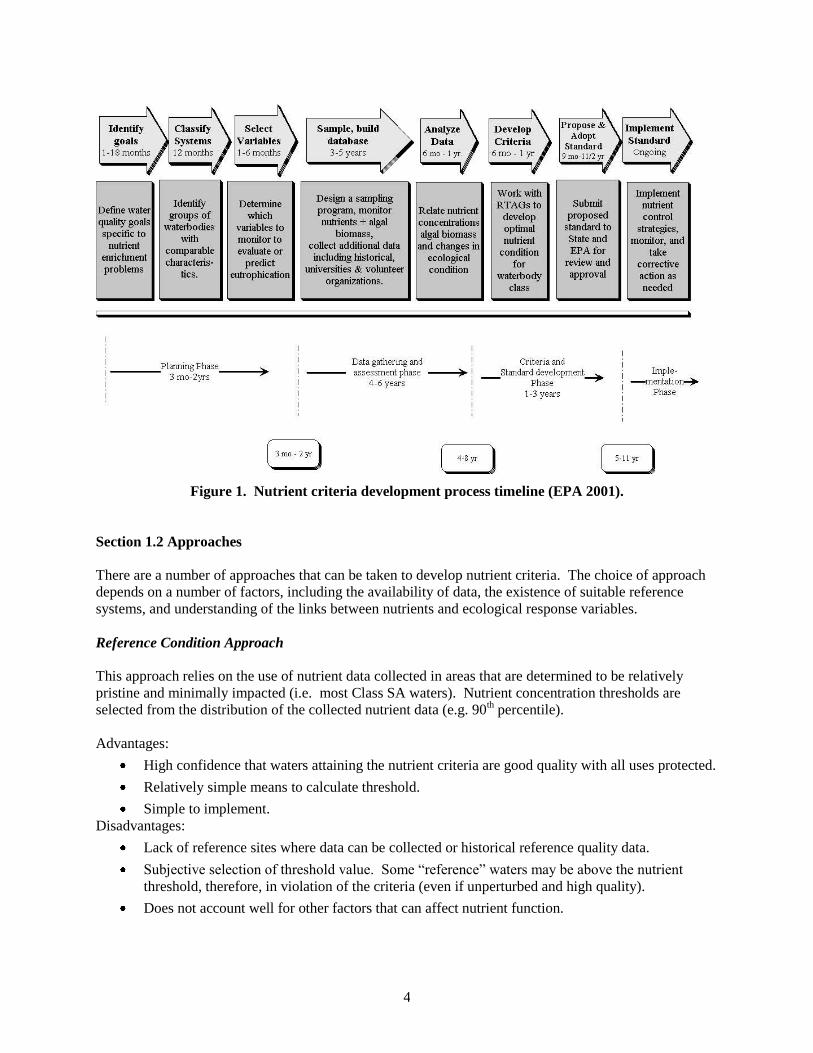
Section 1.2 Approaches
There are a number of approaches that can be taken to develop nutrient criteria. The choice of approach
depends on a number of factors, including the availability of data, the existence of suitable reference
systems, and understanding of the links between nutrients and ecological response variables.
Reference Condition Approach
This approach relies on the use of nutrient data collected in areas that are determined to be relatively
pristine and minimally impacted (i.e. most Class SA waters). Nutrient concentration thresholds are
selected from the distribution of the collected nutrient data (e.g. 90th percentile).
Advantages:
High confidence that waters attaining the nutrient criteria are good quality with all uses protected.
Relatively simple means to calculate threshold.
Simple to implement.
Disadvantages:
Lack of reference sites where data can be collected or historical reference quality data.
Subjective selection of threshold value. Some “reference” waters may be above the nutrient
threshold, therefore, in violation of the criteria (even if unperturbed and high quality).
Does not account well for other factors that can affect nutrient function.
5
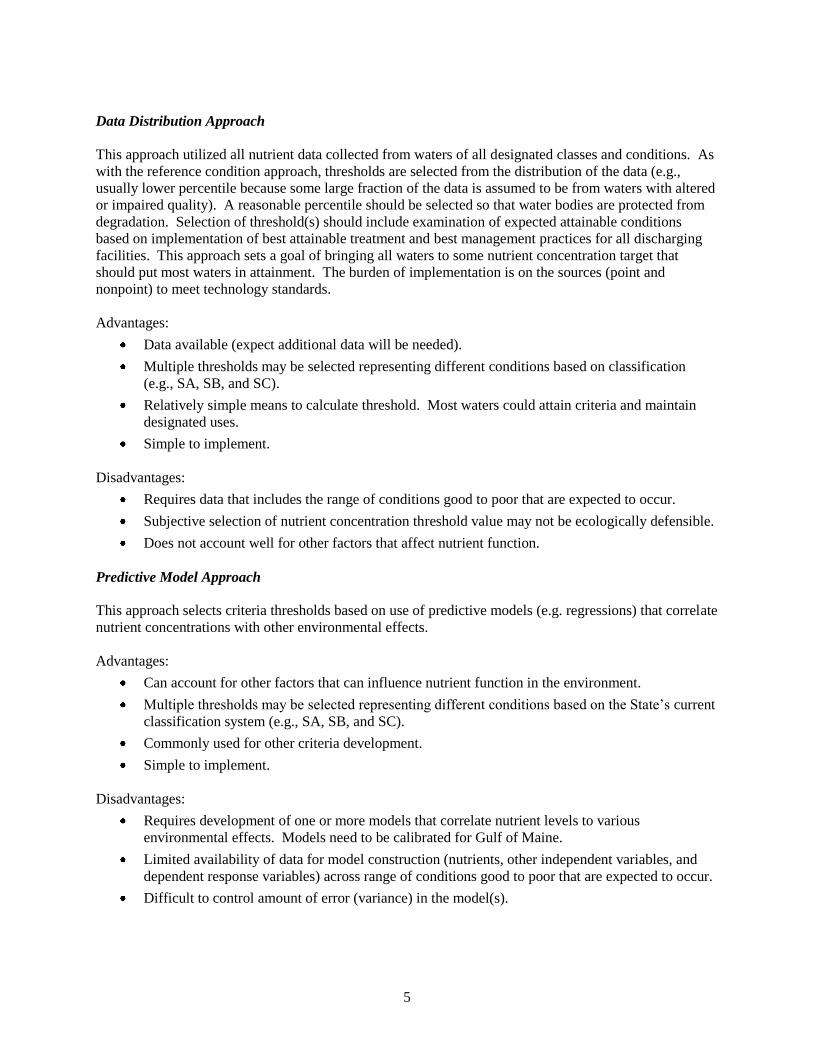
Data Distribution Approach
This approach utilized all nutrient data collected from waters of all designated classes and conditions. As
with the reference condition approach, thresholds are selected from the distribution of the data (e.g.,
usually lower percentile because some large fraction of the data is assumed to be from waters with altered
or impaired quality). A reasonable percentile should be selected so that water bodies are protected from
degradation. Selection of threshold(s) should include examination of expected attainable conditions
based on implementation of best attainable treatment and best management practices for all discharging
facilities. This approach sets a goal of bringing all waters to some nutrient concentration target that
should put most waters in attainment. The burden of implementation is on the sources (point and
nonpoint) to meet technology standards.
Advantages:
Data available (expect additional data will be needed).
Multiple thresholds may be selected representing different conditions based on classification
(e.g., SA, SB, and SC).
Relatively simple means to calculate threshold. Most waters could attain criteria and maintain
designated uses.
Simple to implement.
Disadvantages:
Requires data that includes the range of conditions good to poor that are expected to occur.
Subjective selection of nutrient concentration threshold value may not be ecologically defensible.
Does not account well for other factors that affect nutrient function.
Predictive Model Approach
This approach selects criteria thresholds based on use of predictive models (e.g. regressions) that correlate
nutrient concentrations with other environmental effects.
Advantages:
Can account for other factors that can influence nutrient function in the environment.
Multiple thresholds may be selected representing different conditions based on the State‟s current
classification system (e.g., SA, SB, and SC).
Commonly used for other criteria development.
Simple to implement.
Disadvantages:
Requires development of one or more models that correlate nutrient levels to various
environmental effects. Models need to be calibrated for Gulf of Maine.
Limited availability of data for model construction (nutrients, other independent variables, and
dependent response variables) across range of conditions good to poor that are expected to occur.
Difficult to control amount of error (variance) in the model(s).
6
Effects-based Approach
This approach establishes a correlation between the concentration of nutrients (stressor or causal variable)
and the measured effect in the environment (response variable). Appropriate response criteria need to be
established (e.g. oxygen, chlorophyll, cell counts, marine life, etc.). The screening thresholds for nutrient
concentrations are developed by one of the above approaches.
Advantages:
High confidence that designated uses are attained (direct measurement of designated use).
Attainment is based on response criteria (actual detection of negative effects in the ecosystem).
Takes into account other variables that affect nutrient function.
Multiple thresholds may be selected representing different conditions based on classification
(e.g., SA, SB, and SC).
Opportunity for site-specific criteria.
Disadvantages:
Lack of data on suitable response criteria (preferably already existing in statute or rule, e.g.,
oxygen). Limited set currently available for marine waters.
Need to develop relationship of nutrients to response criteria.
Several response criteria are required to assess water quality condition and designated uses that
could be affected by nutrients.
Two data types required to make an assessment (nutrient and response criteria).
Increased monitoring cost.
Implementation is complex. Results not always clear if nutrients are low and response criteria are
violated or, conversely, the measured nutrients are high and there is no violation of response
criteria.
Previous work by Battelle (2008) compiled and evaluated three sets of nutrient data. Under this project,
the existing database was augmented with new field survey data, and conducted additional statistical
analyses, included data distribution and regression approaches. Technical meetings with the EPA, Maine
DEP, and other scientists and stakeholders provided some guidance towards what kinds of approaches
would support Maine‟s short-term goals. These included the data distribution and predictive model
approaches. However, the expectation was that more data and additional supporting information (e.g.,
new classification schemes) would be necessary to move beyond some basic limitations associated with
the predictive model and effects-based approaches. Given these limitations and keeping in mind that
nutrient criteria must be scientifically defensible, we used the augmented database to expand upon
previous methods that Battelle termed “a hybrid of the Reference Condition/Data Distribution
approaches”. We also ran some regression models on the entire dataset and also on a series of specific
data associated with a smaller number of estuarine systems (see Section 3 below). The following sections
describe the additional data acquired and the results of these analyses.
Section 2.0 Data Acquisition and Manipulation
This section describes the data sources that have been identified, what data were selected, and how they
were collected and stored.
7
Section 2.1 Data Sources
The existing project database was previously prepared by Battelle (2008) and was based on three sources
of data: Friends of Casco Bay, EPA National Coastal Assessment (NCA) Program, and EPA Coastal
Marine Program data. The data for FOCB were obtained directly from the organization. The EPA NCA
data were downloaded from the NCA Northeast Region data pages2. The Casco Bay Estuary Partnership
(CBEP) provided the EPA Coastal Marine Program data.
The FOCB monitoring program has been ongoing since 1993. The program is carried out with the aid of
volunteers who sample at more than 80 shore-based stations and assist FOCB staff at 11 profile stations
located throughout Casco Bay. The parameters measured include standard oceanographic parameters of
temperature, salinity, pH, Secchi depth, dissolved oxygen, plus ancillary air and water measurements.
The program was expanded to include measurements for dissolved inorganic nutrients in 2001 and
chlorophyll and total kjeldahl nitrogen (TKN) in 2007 as a subset of stations. The FOCB stations were
sampled for nutrient parameters on a monthly basis over the summer. Additional MS Excel files were
provided by FOCB for 2005-2008 data (April through October). 2009 FOCB data is anticipated to be
available in the near future.
Additional data were collected from Maine DEP (J. Sowles)6 and included 1996 results of a field
monitoring project aimed at DO responses to nutrient inputs. Parameters include: temperature, salinity,
DO concentration, DO % saturation, chlorophyll, N and P species, and particulate C and P.
Wells National Estuarine Research Reserve (NERR)7 data were collected for the years 2002 through 2006
from three monitoring stations. Parameters include chlorophyll, N and P species, and silicate.
The University of Maine (D. Townsend)8 provided temperature, salinity, N and P, and chlorophyll data
from a large number of stations, primarily in the offshore Gulf of Maine. The period covers 1966 through
2009.
The 2009 field surveys (Cadmus 2009) conducted under this project provided temperature, salinity, DO,
N and P, Secchi depth, silicate, and turbidity from 8 coastal systems in the Penobscot area. The two
surveys were conducted in early August and early September.
The EPA NCA program data were available for 2001-2004. The data included a range of standard
oceanographic parameters and nutrients though not all parameters were available for each of the years nor
was the same set of data available for each state for each of the years. In general, dissolved inorganic
nutrients, dissolved oxygen and chlorophyll data were available for MA in 2000 and 2001, NH in 2001,
2002 and 2003, and in ME for all five years. Total nitrogen and total phosphorus were only available for
MA and NH in 2003 and in ME for 2003 and 2004. EPA NCA station locations are redistributed each
year. The NCA stations were sampled only once per year during the summer. All of the NCA data were
directly downloaded from the internet as MS Excel files by Battelle during the previous phase of this
project.9
2 http://www.epa.gov/emap/nca/html/regions/northeast.html
6 Field surveys conducted in 1995 and 1996 focused on dissolved oxygen. Project partners included the Casco Bay
Estuary Project, Wells NERR, and the Maine DEP. Data for 1996 only made available. 7 http://cdmo.baruch.sc.edu/
8 http://grampus.umeoce.maine.edu/nutrients/#Data
9 http://www.epa.gov/emap/nca/html/data/
8
The EPA Coastal Marine program data were collected in 2004 and 2005 at twenty nine stations extending
from the Canadian border to south of Cape Cod. Data were collected for in situ parameters, chlorophyll
a, TN, and TP. Both of these surveys were conducted during the month of June. Note that this dataset is
referred to as the “Gibson” data (George Gibson led the effort and the name took on a life of its own
during database development and analyses). The Gibson data were provided to Battelle by CBEP in a
single MS Excel file.
Data from the Wells National Estuarine Research Reserve (NERR) were downloaded from the NERRS
Centralized Data Management Office website for the years 2002 through 2006. Analyses of these
monthly grab samples include nitrate, nitrite, ammonium, phosphate, silicate and chlorophyll a.
Maine DEP data (Kelly and Libby 1996; Kelly 1997) from the 1996 field survey (reported in “Dissolved
Oxygen in Maine Estuaries and Embayments: 1996 Results and Analyses”) were provided by J. Sowles
(retired). Data from the similar work in 1995 have not been collected. Sixteen coastal systems were
sampled twice in 1996. Data collected include temperature, salinity, dissolved oxygen, chlorophyll a,
particulate carbon, particulate nitrogen, nitrate+nitrate, ammonium, phosphate, dissolved organic
nitrogen, and dissolved organic phosphorus.
Under this project, two surveys were conducted over the summer of 2009 that covered 8 coastal systems
(see Table 9). Surveys took place during peak water temperature periods (August and September). Data
collected included temperature, salinity, dissolved oxygen, chlorophyll a, nitrate+nitrate, ammonium,
phosphate, and dissolved organic nitrogen.
Table 1. Sources of data obtained for this project.
Data Set/Description Source
FOCB pre-2005 Friends of Casco Bay
FOCB 2008 Friends of Casco Bay
Sowles 1996 ME DEP
Wells Nutrients 2002-2006 Wells NERR
Cadmus 2009 The Cadmus Group/Saquish Scientific
NCA National Coastal Assessment
Gulf of Maine University of Maine10
EPA/Gibson EPA Coastal Marine Program
EPA EPA Region 1
Section 2.2 Database Development
The project database is an updated and augmented version of the FOCB MS Access database that was
previously developed for the Maine Nutrient Criteria database. New data from the sources described in
Section 2.1 were obtained as excel files and were imported into the database.
Section 2.3 Data Selection
A set of variables associated with this study have been previously defined and data have been collected in
support of this project. The primary variables are consistent with those identified by EPA (2001) and
Battelle (2008) and include the following:
10
http://grampus.umeoce.maine.edu/nutrients/#Data
9
Nitrogen (TN, DIN, NH4, NO3+NO2)
Phosphorus (TP)
Chlorophyll-a
Dissolved Oxygen (and % Saturation if available11
)
Secchi Depth
Additional data on eelgrass (SAV) distribution have been collected statewide.
We have included the following variables to the study as they are critical in understanding physical and
biogeochemical boundaries and biological rate processes:
Salinity
Temperature
The project database includes the capacity for additional information such as additional nutrients and
water quality parameters. However, the project focus is on collecting and analyzing the primary variables
listed above.
Section 2.4 Data Analyses
The project‟s technical group of scientists, managers, and stakeholders prepared a series of suggested
action items associated with preliminary analysis of the data. The purpose of these suggested analyses is
to determine how successful the data distribution and predictive model approaches might be at this point
in time. Another purpose is to determine the need for additional data analysis and field monitoring to
accomplish Maine DEP‟s short- and long-term nutrient criteria goals. These action items stem from a
number of telephone conferences, three technical meetings in Portland, ME, and other technical
correspondence among EPA, Maine DEP, and the Cadmus project group.
The following sections describe the analyses that have been conducted to support the development of
nutrient criteria in Maine.
Section 2.4.1 Comparison Among Existing State Classifications (SA, SB, and SC)
Maine‟s designated use and classification system consists of three classes: SA, SB, and SC (Table 2).
Currently there are three types of water quality criteria associated with these three classes. Dissolved
oxygen is one of them. Based on the project‟s technical team‟s suggestions, percentile values of the
proposed causal and response variables were calculated by state class and among different groups of
classes. Although most of Maine‟s classified waters fall within Class SB, it was of interest to determine
whether there are consistent water quality patterns within the classification system. However, designated
uses drive the determination of these classes and, to a lesser extent, existing water quality conditions.
The results of these analyses are shown in Sections 3.1.1 and 3.1.2.
11
DO % saturation was calculated in cases where DO concentration, temperature, and salinity were available. The
method was based on Weiss, R.F. 1970. The solubility of nitrogen, oxygen and argon in water and seawater. Deep
Sea Research 17:721-735.

10
Table 2. Designated Uses and Criteria for Maine Marine Classifications.
Regression analyses were also applied to these data in two ways. First, all data among the state classes
were pooled to determine whether relationships might be found between TN (causal) and a series of
response variables. Then two specific studies were selected as case studies to determine potential
relationships, at the system-scale, between TN and response variables. Initial comparisons were made
with regard to the presence and absence of SAV habitat among these systems. The studies applied in this
series of analyses were the Maine DEP dissolved oxygen surveys conducted in 1996 and the more recent
EPA/Maine DEP nutrient criteria surveys conducted by Cadmus in 2009.
Section 2.4.2 Comparisons Based on Salinity Zones
Salinity has been used to classify, or separate, estuarine systems in efforts to establish nutrient criteria.
Classification of estuarine systems is important because several physical estuarine characteristics
influence system response to nutrient inputs. Characteristics such as salinity, depth, and water residence
time have been used in attempts to group coastal systems for analysis and comparison. Salinity is often
used because it is related to both freshwater input and flushing, or residence time. Salinity also helps
coastal scientists and managers to determine physical and ecological boundaries of systems of interest.
Examples include Pensacola Bay (FL) and Yaquina Estuary (OR) among others. In these two examples
different classes were applied based on the site-specific conditions of each system (salinity, tidal
amplitude, offshore conditions). Hagy et al. (2008) selected three zones based on a balance between
representativeness and sufficient data in each zone. Brown et al. (2007) selected two zones for the
Yaquina Estuary case study. These zones were based on a boundary of influence between offshore, or the
ocean-dominated section inward from the mouth (Zone 1), and the inner tidal area where terrestrial
influences dominate system characteristics (Zone 2). The method to determine this boundary was based
on stable isotope studies in green macroalgae (data analysis and transport modeling). The boundary was
found to exist along the section of the estuary with a median salinity of 26 psu. Coincidentally, this is
virtually the same distinction established by NOAA‟s Coastal Assessment Framework (CAF) where the
distinction between ocean-dominated and mixing zones is 25 psu (tidal freshwater ranges between 0 and
0.5 psu). The NOAA 3-zone salinity geographies represent the average annual salinity found in certain
11
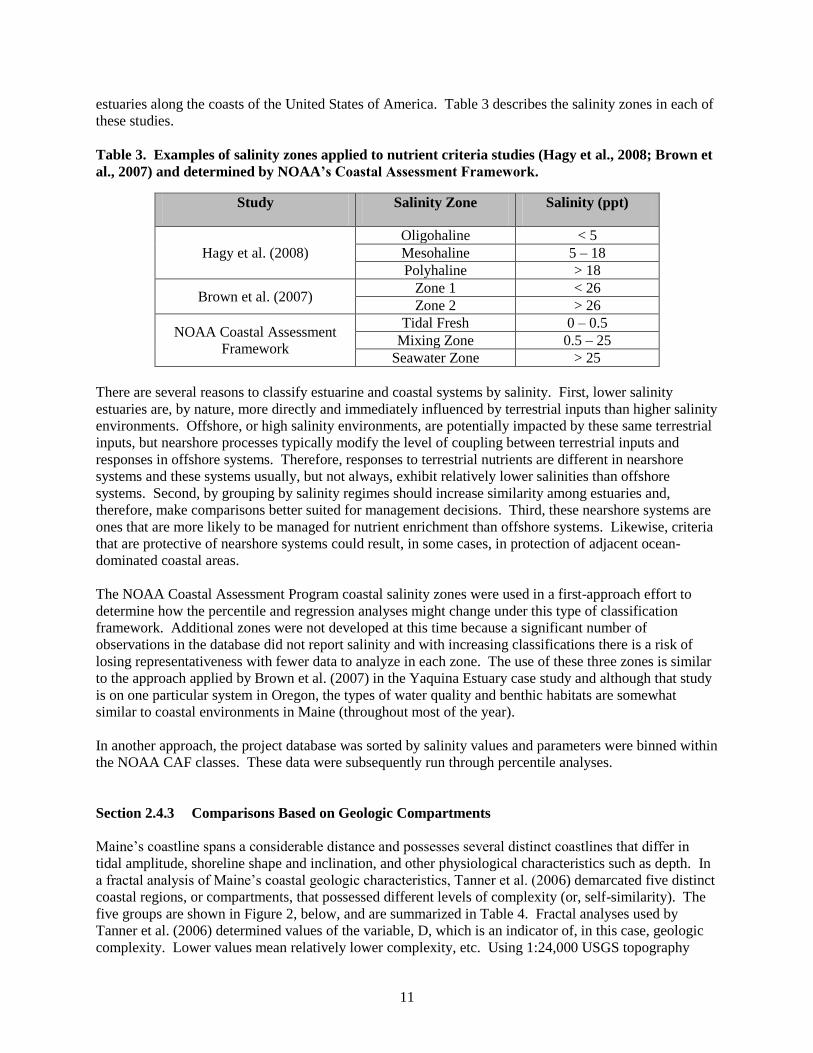
estuaries along the coasts of the United States of America. Table 3 describes the salinity zones in each of
these studies.
Table 3. Examples of salinity zones applied to nutrient criteria studies (Hagy et al., 2008; Brown et
al., 2007) and determined by NOAA’s Coastal Assessment Framework.
Study Salinity Zone Salinity (ppt)
Hagy et al. (2008)
Oligohaline < 5
Mesohaline 5 – 18
Polyhaline > 18
Brown et al. (2007) Zone 1 < 26
Zone 2 > 26
NOAA Coastal Assessment
Framework
Tidal Fresh 0 – 0.5
Mixing Zone 0.5 – 25
Seawater Zone > 25
There are several reasons to classify estuarine and coastal systems by salinity. First, lower salinity
estuaries are, by nature, more directly and immediately influenced by terrestrial inputs than higher salinity
environments. Offshore, or high salinity environments, are potentially impacted by these same terrestrial
inputs, but nearshore processes typically modify the level of coupling between terrestrial inputs and
responses in offshore systems. Therefore, responses to terrestrial nutrients are different in nearshore
systems and these systems usually, but not always, exhibit relatively lower salinities than offshore
systems. Second, by grouping by salinity regimes should increase similarity among estuaries and,
therefore, make comparisons better suited for management decisions. Third, these nearshore systems are
ones that are more likely to be managed for nutrient enrichment than offshore systems. Likewise, criteria
that are protective of nearshore systems could result, in some cases, in protection of adjacent ocean-
dominated coastal areas.
The NOAA Coastal Assessment Program coastal salinity zones were used in a first-approach effort to
determine how the percentile and regression analyses might change under this type of classification
framework. Additional zones were not developed at this time because a significant number of
observations in the database did not report salinity and with increasing classifications there is a risk of
losing representativeness with fewer data to analyze in each zone. The use of these three zones is similar
to the approach applied by Brown et al. (2007) in the Yaquina Estuary case study and although that study
is on one particular system in Oregon, the types of water quality and benthic habitats are somewhat
similar to coastal environments in Maine (throughout most of the year).
In another approach, the project database was sorted by salinity values and parameters were binned within
the NOAA CAF classes. These data were subsequently run through percentile analyses.
Section 2.4.3 Comparisons Based on Geologic Compartments
Maine‟s coastline spans a considerable distance and possesses several distinct coastlines that differ in
tidal amplitude, shoreline shape and inclination, and other physiological characteristics such as depth. In
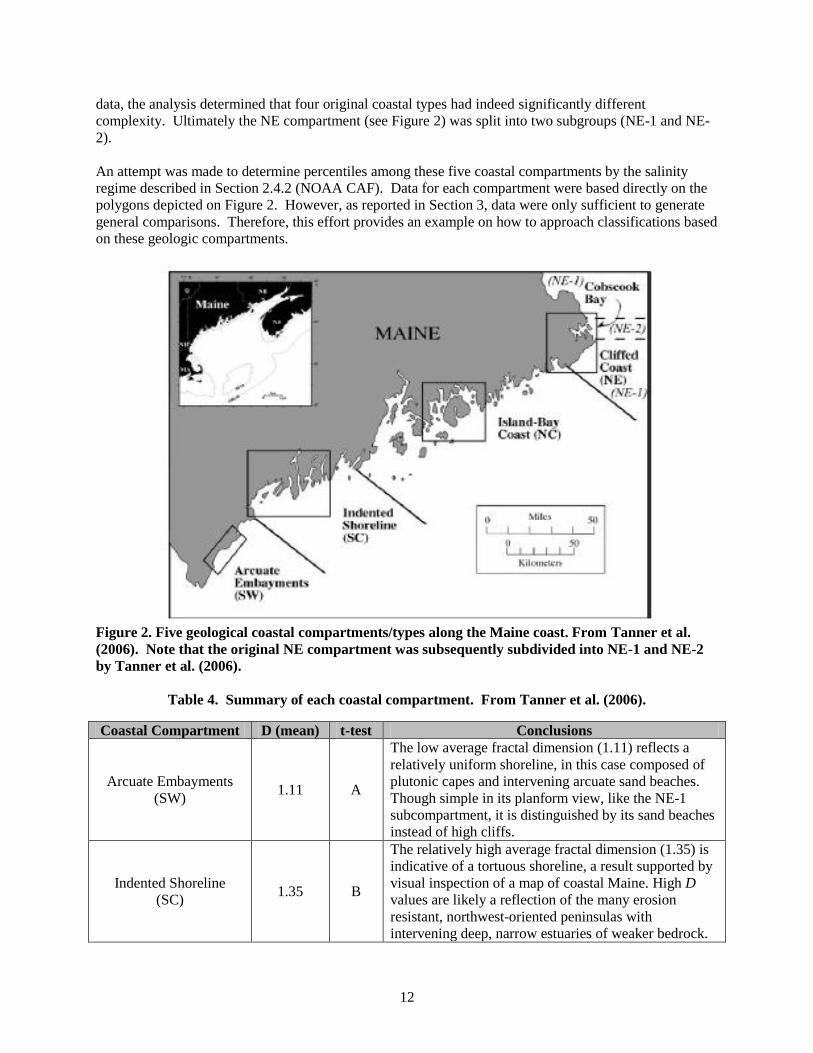
a fractal analysis of Maine‟s coastal geologic characteristics, Tanner et al. (2006) demarcated five distinct
coastal regions, or compartments, that possessed different levels of complexity (or, self-similarity). The
five groups are shown in Figure 2, below, and are summarized in Table 4. Fractal analyses used by
Tanner et al. (2006) determined values of the variable, D, which is an indicator of, in this case, geologic
complexity. Lower values mean relatively lower complexity, etc. Using 1:24,000 USGS topography
12
data, the analysis determined that four original coastal types had indeed significantly different
complexity. Ultimately the NE compartment (see Figure 2) was split into two subgroups (NE-1 and NE-
2).
An attempt was made to determine percentiles among these five coastal compartments by the salinity
regime described in Section 2.4.2 (NOAA CAF). Data for each compartment were based directly on the
polygons depicted on Figure 2. However, as reported in Section 3, data were only sufficient to generate
general comparisons. Therefore, this effort provides an example on how to approach classifications based
on these geologic compartments.
Figure 2. Five geological coastal compartments/types along the Maine coast. From Tanner et al.
(2006). Note that the original NE compartment was subsequently subdivided into NE-1 and NE-2
by Tanner et al. (2006).
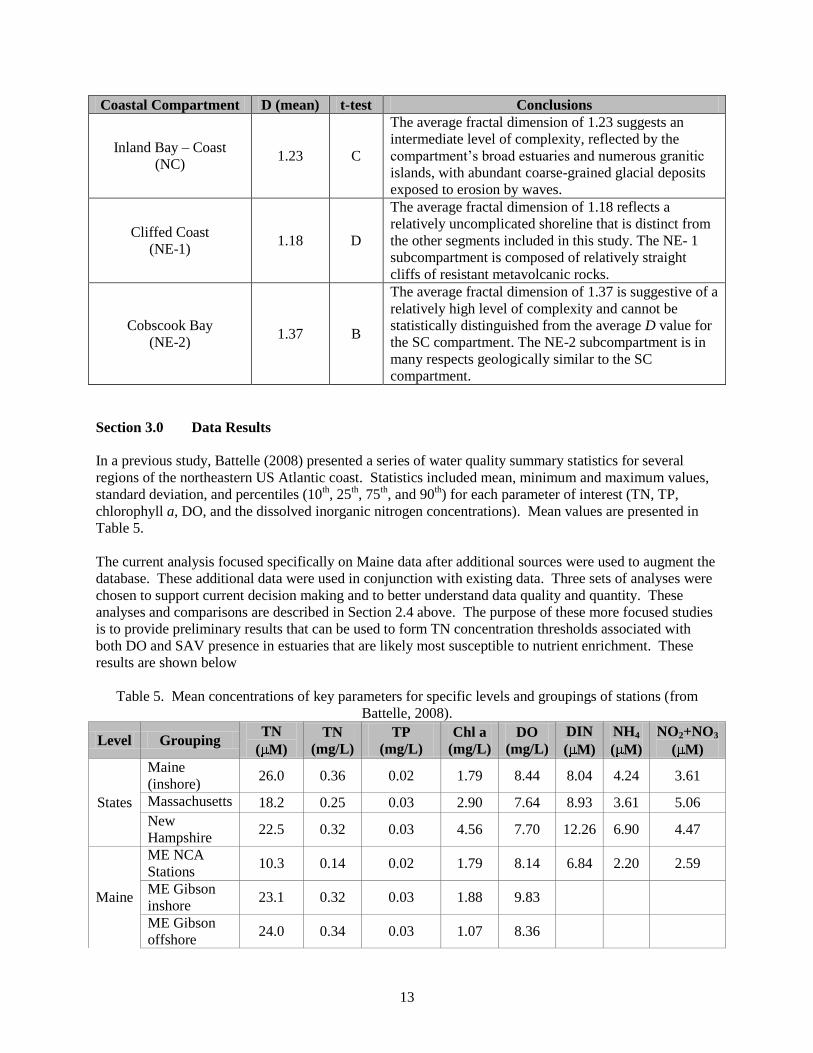
Table 4. Summary of each coastal compartment. From Tanner et al. (2006).
Coastal Compartment D (mean) t-test Conclusions
Arcuate Embayments
(SW) 1.11 A
The low average fractal dimension (1.11) reflects a
relatively uniform shoreline, in this case composed of
plutonic capes and intervening arcuate sand beaches.
Though simple in its planform view, like the NE-1
subcompartment, it is distinguished by its sand beaches
instead of high cliffs.
Indented Shoreline
(SC) 1.35 B
The relatively high average fractal dimension (1.35) is
indicative of a tortuous shoreline, a result supported by
visual inspection of a map of coastal Maine. High D
values are likely a reflection of the many erosion
resistant, northwest-oriented peninsulas with
intervening deep, narrow estuaries of weaker bedrock.
13
Coastal Compartment D (mean) t-test Conclusions
Inland Bay – Coast
(NC) 1.23 C
The average fractal dimension of 1.23 suggests an
intermediate level of complexity, reflected by the
compartment‟s broad estuaries and numerous granitic
islands, with abundant coarse-grained glacial deposits
exposed to erosion by waves.
Cliffed Coast
(NE-1) 1.18 D
The average fractal dimension of 1.18 reflects a
relatively uncomplicated shoreline that is distinct from
the other segments included in this study. The NE- 1
subcompartment is composed of relatively straight
cliffs of resistant metavolcanic rocks.
Cobscook Bay
(NE-2) 1.37 B
The average fractal dimension of 1.37 is suggestive of a
relatively high level of complexity and cannot be
statistically distinguished from the average D value for
the SC compartment. The NE-2 subcompartment is in
many respects geologically similar to the SC
compartment.
Section 3.0 Data Results
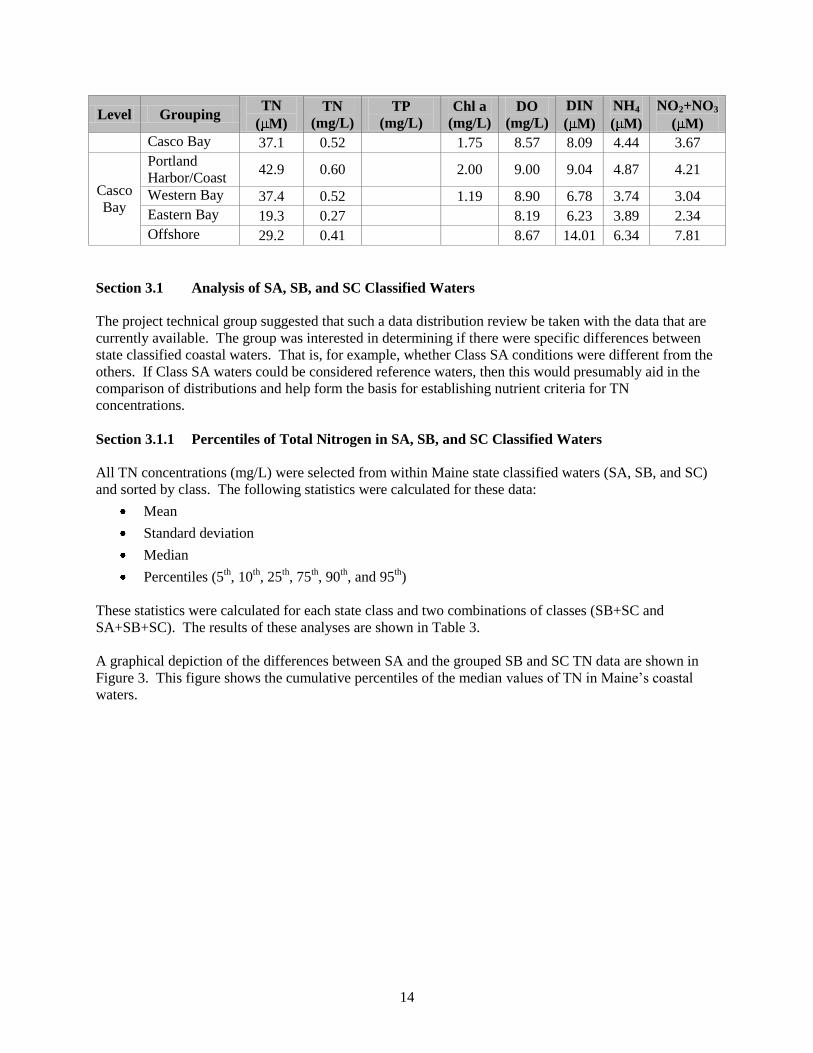
In a previous study, Battelle (2008) presented a series of water quality summary statistics for several
regions of the northeastern US Atlantic coast. Statistics included mean, minimum and maximum values,
standard deviation, and percentiles (10th, 25
th, 75
th, and 90
th) for each parameter of interest (TN, TP,
chlorophyll a, DO, and the dissolved inorganic nitrogen concentrations). Mean values are presented in
Table 5.
The current analysis focused specifically on Maine data after additional sources were used to augment the
database. These additional data were used in conjunction with existing data. Three sets of analyses were
chosen to support current decision making and to better understand data quality and quantity. These
analyses and comparisons are described in Section 2.4 above. The purpose of these more focused studies
is to provide preliminary results that can be used to form TN concentration thresholds associated with
both DO and SAV presence in estuaries that are likely most susceptible to nutrient enrichment. These
results are shown below
Table 5. Mean concentrations of key parameters for specific levels and groupings of stations (from
Battelle, 2008).
Level Grouping TN
( M)
TN
(mg/L)
TP
(mg/L)
Chl a
(mg/L)
DO
(mg/L)
DIN
( M)
NH4
( M)
NO2+NO3
( M)
States
Maine
(inshore) 26.0 0.36 0.02 1.79 8.44 8.04 4.24 3.61
Massachusetts 18.2 0.25 0.03 2.90 7.64 8.93 3.61 5.06
New
Hampshire 22.5 0.32 0.03 4.56 7.70 12.26 6.90 4.47
Maine
ME NCA
Stations 10.3 0.14 0.02 1.79 8.14 6.84 2.20 2.59
ME Gibson
inshore 23.1 0.32 0.03 1.88 9.83
ME Gibson
offshore 24.0 0.34 0.03 1.07 8.36
14
Level Grouping TN
( M)
TN
(mg/L)
TP
(mg/L)
Chl a
(mg/L)
DO
(mg/L)
DIN
( M)
NH4
( M)
NO2+NO3
( M)
Casco Bay 37.1 0.52 1.75 8.57 8.09 4.44 3.67
Casco
Bay
Portland
Harbor/Coast 42.9 0.60 2.00 9.00 9.04 4.87 4.21
Western Bay 37.4 0.52 1.19 8.90 6.78 3.74 3.04
Eastern Bay 19.3 0.27 8.19 6.23 3.89 2.34
Offshore 29.2 0.41 8.67 14.01 6.34 7.81
Section 3.1 Analysis of SA, SB, and SC Classified Waters
The project technical group suggested that such a data distribution review be taken with the data that are
currently available. The group was interested in determining if there were specific differences between
state classified coastal waters. That is, for example, whether Class SA conditions were different from the
others. If Class SA waters could be considered reference waters, then this would presumably aid in the
comparison of distributions and help form the basis for establishing nutrient criteria for TN
concentrations.
Section 3.1.1 Percentiles of Total Nitrogen in SA, SB, and SC Classified Waters
All TN concentrations (mg/L) were selected from within Maine state classified waters (SA, SB, and SC)
and sorted by class. The following statistics were calculated for these data:
Mean
Standard deviation
Median
Percentiles (5th, 10
th, 25
th, 75
th, 90
th, and 95
th)
These statistics were calculated for each state class and two combinations of classes (SB+SC and
SA+SB+SC). The results of these analyses are shown in Table 3.
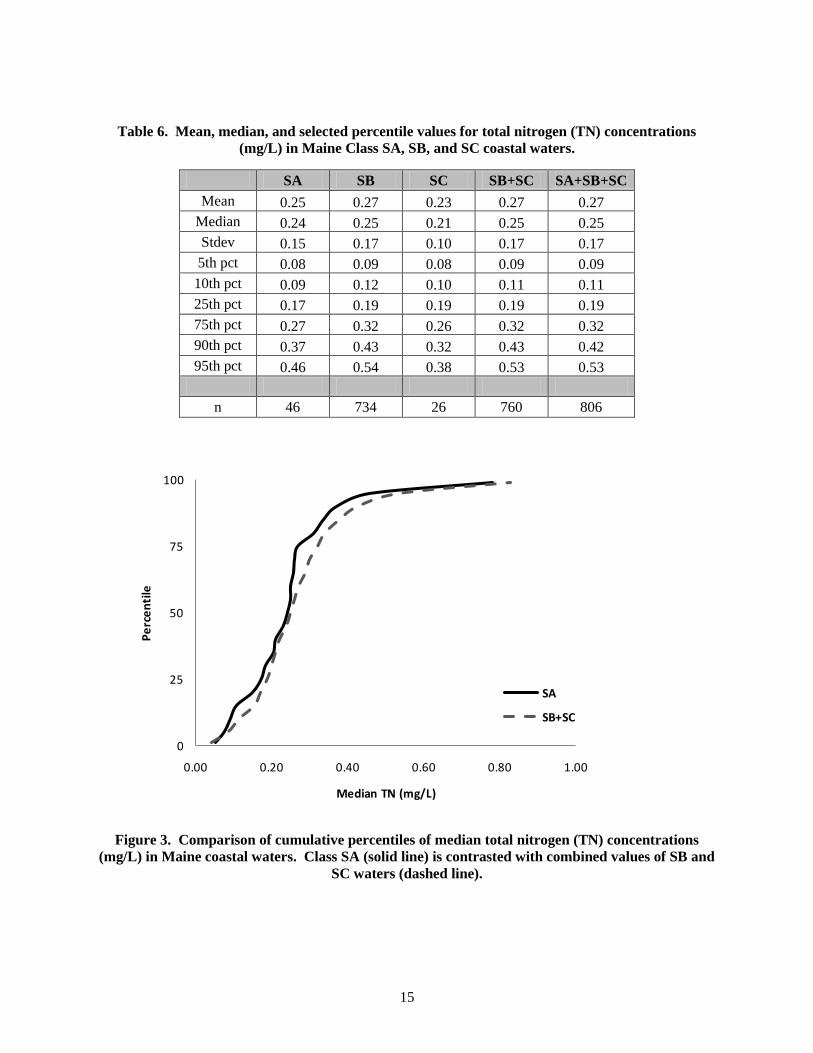
A graphical depiction of the differences between SA and the grouped SB and SC TN data are shown in
Figure 3. This figure shows the cumulative percentiles of the median values of TN in Maine‟s coastal
waters.
15
Table 6. Mean, median, and selected percentile values for total nitrogen (TN) concentrations
(mg/L) in Maine Class SA, SB, and SC coastal waters.
SA SB SC SB+SC SA+SB+SC
Mean 0.25 0.27 0.23 0.27 0.27
Median 0.24 0.25 0.21 0.25 0.25
Stdev 0.15 0.17 0.10 0.17 0.17
5th pct 0.08 0.09 0.08 0.09 0.09
10th pct 0.09 0.12 0.10 0.11 0.11
25th pct 0.17 0.19 0.19 0.19 0.19
75th pct 0.27 0.32 0.26 0.32 0.32
90th pct 0.37 0.43 0.32 0.43 0.42
95th pct 0.46 0.54 0.38 0.53 0.53
n 46 734 26 760 806
0
25
50
75
100
0.00 0.20 0.40 0.60 0.80 1.00
Pe
rce
nti
le
Median TN (mg/L)
SA
SB+SC
Figure 3. Comparison of cumulative percentiles of median total nitrogen (TN) concentrations
(mg/L) in Maine coastal waters. Class SA (solid line) is contrasted with combined values of SB and
SC waters (dashed line).
16
Section 3.1.2 Percentiles of Dissolved Oxygen Percent Saturation in SA, SB, and SC Classified
Waters
Dissolved oxygen data distributions were also calculated in a manner consistent with that described above
for TN concentrations (Table 7). Maine‟s dissolved oxygen (DO) criteria for estuarine and marine waters
range from “as naturally occurs” in Class SA waters, to “not less than 70% of saturation” in Class SC
waters. Most of Maine‟s estuarine and marine waters are classified as SB waters, and the DO content
“must not be less than 85% of saturation”. [38 MRSA Sec. 465-B]
Table 7. Mean, median, and percentile values of dissolved oxygen (DO) saturation (%) in Maine
Class SA, SB, and SC coastal waters.
SA SB SC SB+SC SA+SB+SC
Mean 101 102 102 102 102
Median 102 102 101 102 102
Stdev 12 12 10 12 12
5th pct 81 83 87 84 83
10th pct 85 88 90 88 88
25th pct 92 94 95 94 94
75th pct 110 110 109 110 110
90th pct 117 117 114 116 116
95th pct 120 121 117 121 121
n 2,683 21,437 2,696 24,133 26,816
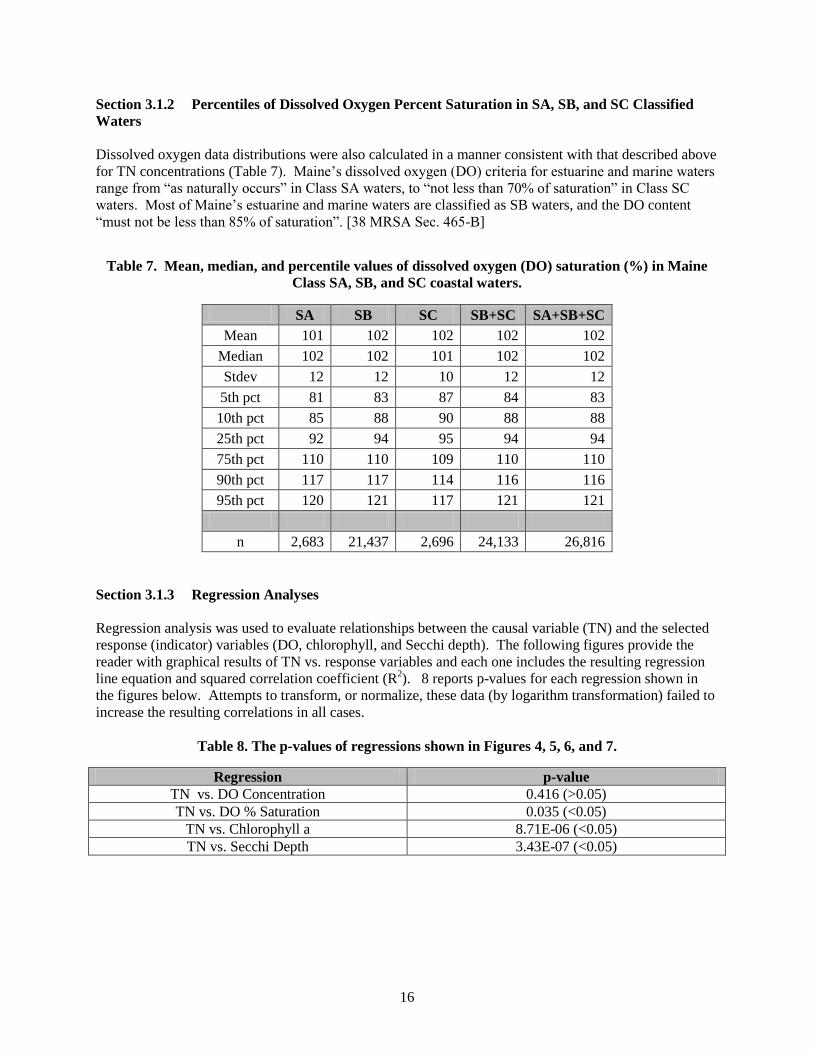
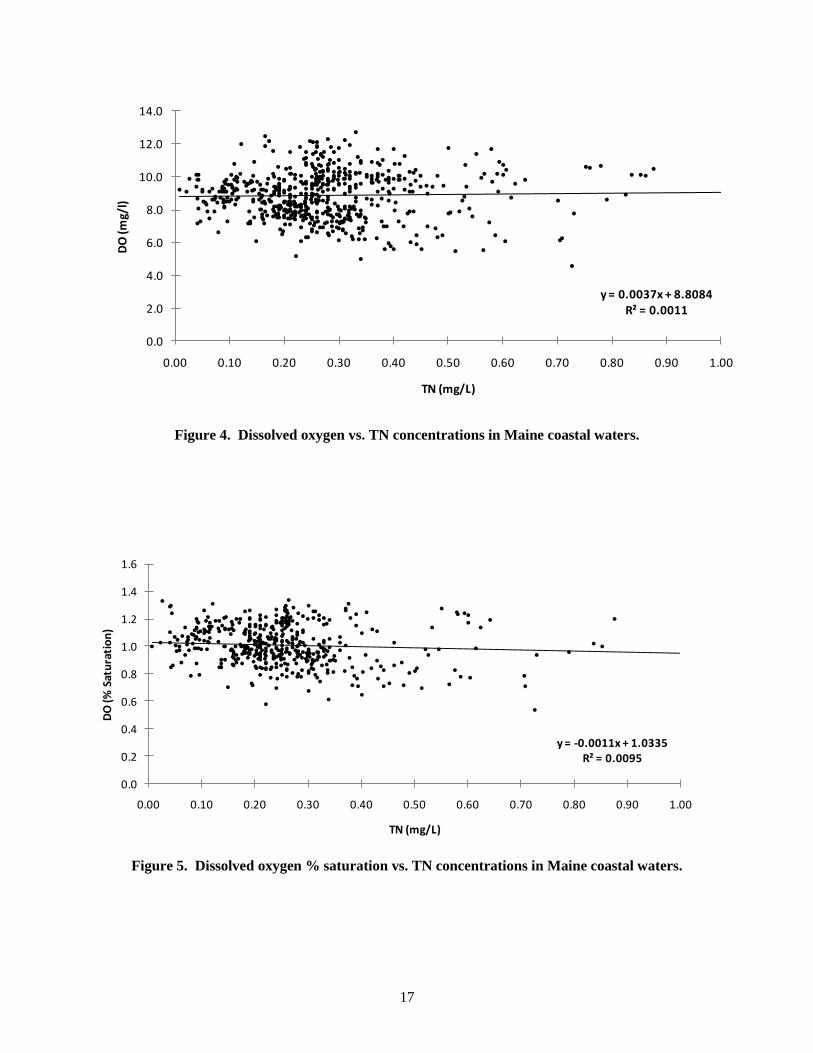
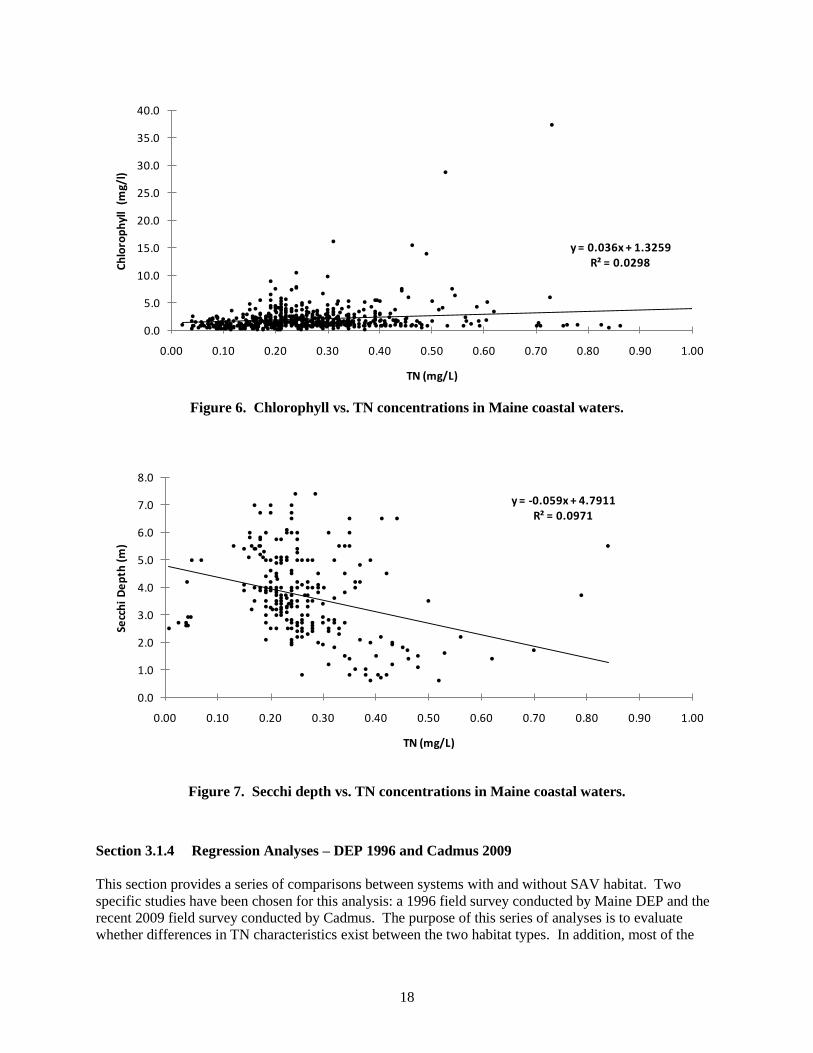
Section 3.1.3 Regression Analyses
Regression analysis was used to evaluate relationships between the causal variable (TN) and the selected
response (indicator) variables (DO, chlorophyll, and Secchi depth). The following figures provide the
reader with graphical results of TN vs. response variables and each one includes the resulting regression
line equation and squared correlation coefficient (R2). 8 reports p-values for each regression shown in
the figures below. Attempts to transform, or normalize, these data (by logarithm transformation) failed to
increase the resulting correlations in all cases.
Table 8. The p-values of regressions shown in Figures 4, 5, 6, and 7.
Regression p-value
TN vs. DO Concentration 0.416 (>0.05)
TN vs. DO % Saturation 0.035 (<0.05)
TN vs. Chlorophyll a 8.71E-06 (<0.05)
TN vs. Secchi Depth 3.43E-07 (<0.05)
17
y = 0.0037x + 8.8084R² = 0.0011
0.0
2.0
4.0
6.0
8.0
10.0
12.0
14.0
0.00 0.10 0.20 0.30 0.40 0.50 0.60 0.70 0.80 0.90 1.00
DO
(mg/
l)
TN (mg/L)
Figure 4. Dissolved oxygen vs. TN concentrations in Maine coastal waters.
y = -0.0011x + 1.0335R² = 0.0095
0.0
0.2
0.4
0.6
0.8
1.0
1.2
1.4
1.6
0.00 0.10 0.20 0.30 0.40 0.50 0.60 0.70 0.80 0.90 1.00
DO
(% S
atu
rati
on
)
TN (mg/L)
Figure 5. Dissolved oxygen % saturation vs. TN concentrations in Maine coastal waters.
18
y = 0.036x + 1.3259R² = 0.0298
0.0
5.0
10.0
15.0
20.0
25.0
30.0
35.0
40.0
0.00 0.10 0.20 0.30 0.40 0.50 0.60 0.70 0.80 0.90 1.00
Ch
loro
ph
yll
(m
g/l)
TN (mg/L)
Figure 6. Chlorophyll vs. TN concentrations in Maine coastal waters.
y = -0.059x + 4.7911R² = 0.0971
0.0
1.0
2.0
3.0
4.0
5.0
6.0
7.0
8.0
0.00 0.10 0.20 0.30 0.40 0.50 0.60 0.70 0.80 0.90 1.00
Secc
hi
De
pth
(m
)
TN (mg/L)
Figure 7. Secchi depth vs. TN concentrations in Maine coastal waters.
Section 3.1.4 Regression Analyses – DEP 1996 and Cadmus 2009
This section provides a series of comparisons between systems with and without SAV habitat. Two
specific studies have been chosen for this analysis: a 1996 field survey conducted by Maine DEP and the
recent 2009 field survey conducted by Cadmus. The purpose of this series of analyses is to evaluate
whether differences in TN characteristics exist between the two habitat types. In addition, most of the

19
estuarine systems in both studies are typical of relatively shallow estuaries that are likely to be more
immediately sensitive to nutrient enrichment. The presumption is that nutrient criteria established for
these types of systems will ultimately be universally protective; however, they may also be unrealistically
protective for some water body classifications. It is also an attempt to determine whether nutrient criteria
based on DO would be suitable for SAV habitats. However, more research is necessary to definitively
answer this question.
The regressions (Figures 8 and 9) were conducted on the means and medians from each estuary surveyed
by Maine DEP (1996) and Cadmus (2009) (as summarized in Tables 9 and 10).
Table 9. Summary of 2009 Cadmus field survey data: eelgrass presence (yes, no), mean and median
TN concentrations, and mean DO (mg/l and % saturation), Secchi depth (m), and chlorophyll a
(ug/l).
Estuary Eelgrass
Present n
Mean TN
(mg/L)
Median
TN
(mg/L)
Mean
DO
(mg/l)
Mean
DO %
Sat
Mean
Secchi
(m)
Mean
Chl a
( g/L)
Belfast Y 10 0.30 0.27 8.44 99 2.34 5.16
Benjamin Y 11 0.24 0.22 9.08 110 3.36 4.42
Blue Hill N 12 0.22 0.22 8.24 100 3.82 2.57
Camden Y 7 0.24 0.24 9.23 112 3.44 4.56
Herrick Y 9 0.23 0.23 8.96 107 3.56 3.04
Jordan Y 18 0.26 0.25 7.58 90 3.34 1.99
Raccoon Y 30 0.24 0.22 7.86 94 3.63 2.21
Rockland Y 11 0.22 0.21 8.66 103 4.66 2.84
Table 10. Summary of 1996 Maine DEP field survey data:12
eelgrass presence (yes, no), mean and
median TN concentrations, and mean DO (mg/l and % saturation), Secchi depth (m), and
chlorophyll a (ug/l). See footnote.
Estuary Eelgrass
Present
Mean TN
(mg/L)
Median
TN
(mg/L)
Mean
DO mg/l
Mean DO
% Sat
Mean
Secchi
Mean
Chl a
Spruce N 0.29 N/A 7.09 89 N/A N/A
York N 0.34 N/A 6.83 86 N/A N/A
Webhannet N 0.39 N/A 7.14 88 N/A N/A
Little N 0.39 N/A 7.6 89 N/A N/A
Kennebunk N 0.31 N/A 7.31 89 N/A N/A
Batson N 0.37 N/A 7.88 96 N/A N/A
Spurwink N 0.42 N/A 6.51 79 N/A N/A
Cousins N 0.36 N/A 7.31 84 N/A N/A
Harraseeket Y 0.26 N/A 7.48 92 N/A N/A
Maquoit Y 0.23 N/A 7.76 95 N/A N/A
Quahog N 0.26 N/A 7.48 91 N/A N/A
Damariscotta N 0.19 N/A 7.5 92 N/A N/A
Johns N 0.19 N/A 7.22 86 N/A N/A
12
Median TN, mean Secchi, and mean chlorophyll are listed as not available (N/A) because of discrepancies
between published report summaries and actual data made available.
20
Estuary Eelgrass
Present
Mean TN
(mg/L)
Median
TN
(mg/L)
Mean
DO mg/l
Mean DO
% Sat
Mean
Secchi
Mean
Chl a
St. George Y 0.36 N/A 7.36 87 N/A N/A
Belfast Y 0.25 N/A 8.12 96 N/A N/A
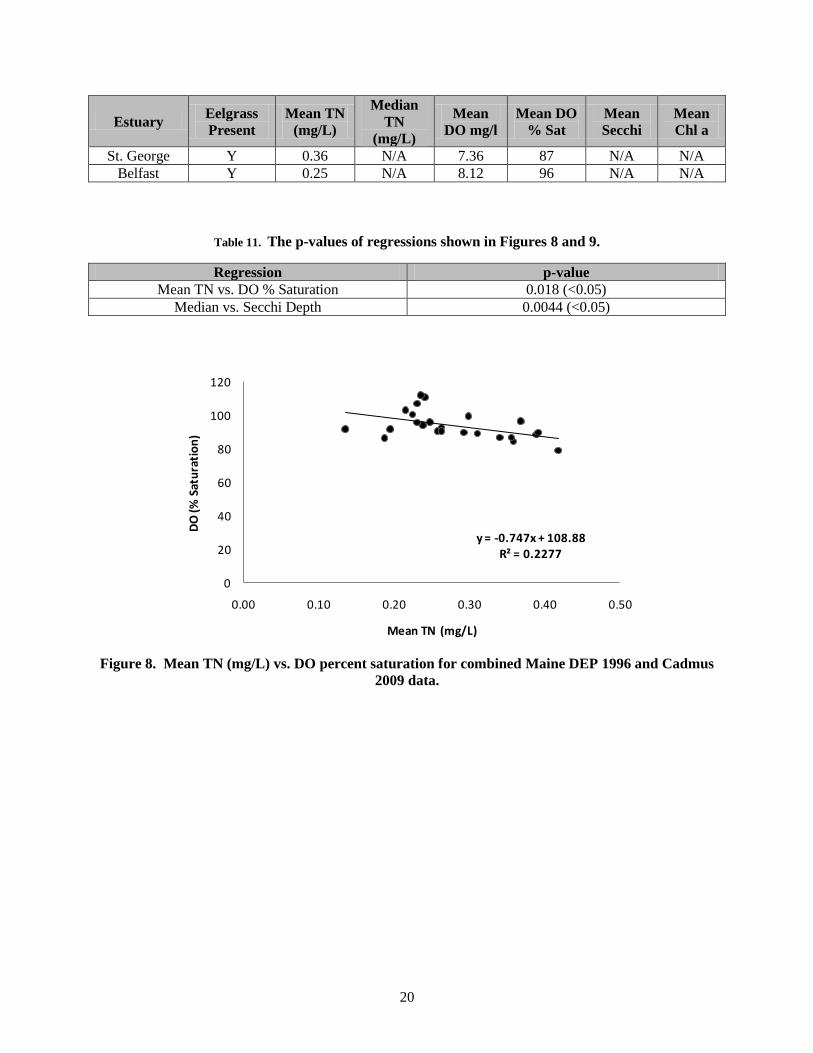
Table 11. The p-values of regressions shown in Figures 8 and 9.
Regression p-value
Mean TN vs. DO % Saturation 0.018 (<0.05)
Median vs. Secchi Depth 0.0044 (<0.05)
y = -0.747x + 108.88R² = 0.2277
0
20
40
60
80
100
120
0.00 0.10 0.20 0.30 0.40 0.50
DO
(% S
atu
rati
on
)
Mean TN (mg/L)
Figure 8. Mean TN (mg/L) vs. DO percent saturation for combined Maine DEP 1996 and Cadmus
2009 data.
21
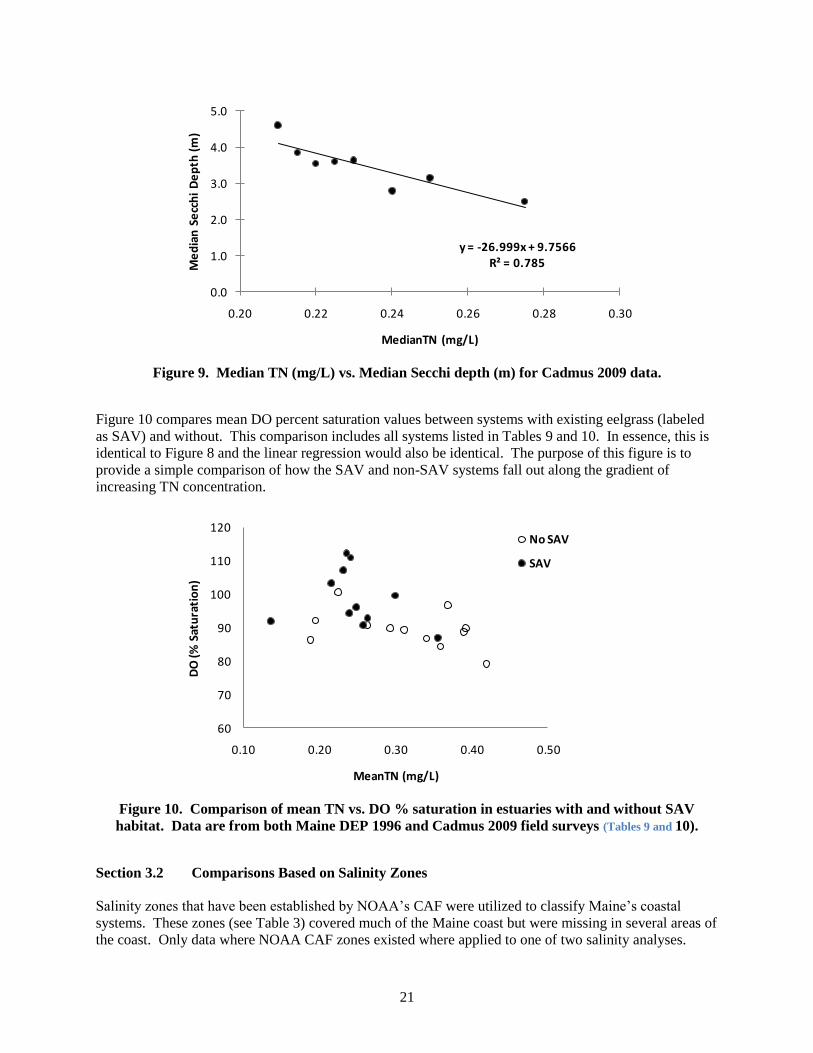
y = -26.999x + 9.7566R² = 0.785
0.0
1.0
2.0
3.0
4.0
5.0
0.20 0.22 0.24 0.26 0.28 0.30
Me
dia
n S
ecc
hi
De
pth
(m
)
MedianTN (mg/L)
Figure 9. Median TN (mg/L) vs. Median Secchi depth (m) for Cadmus 2009 data.
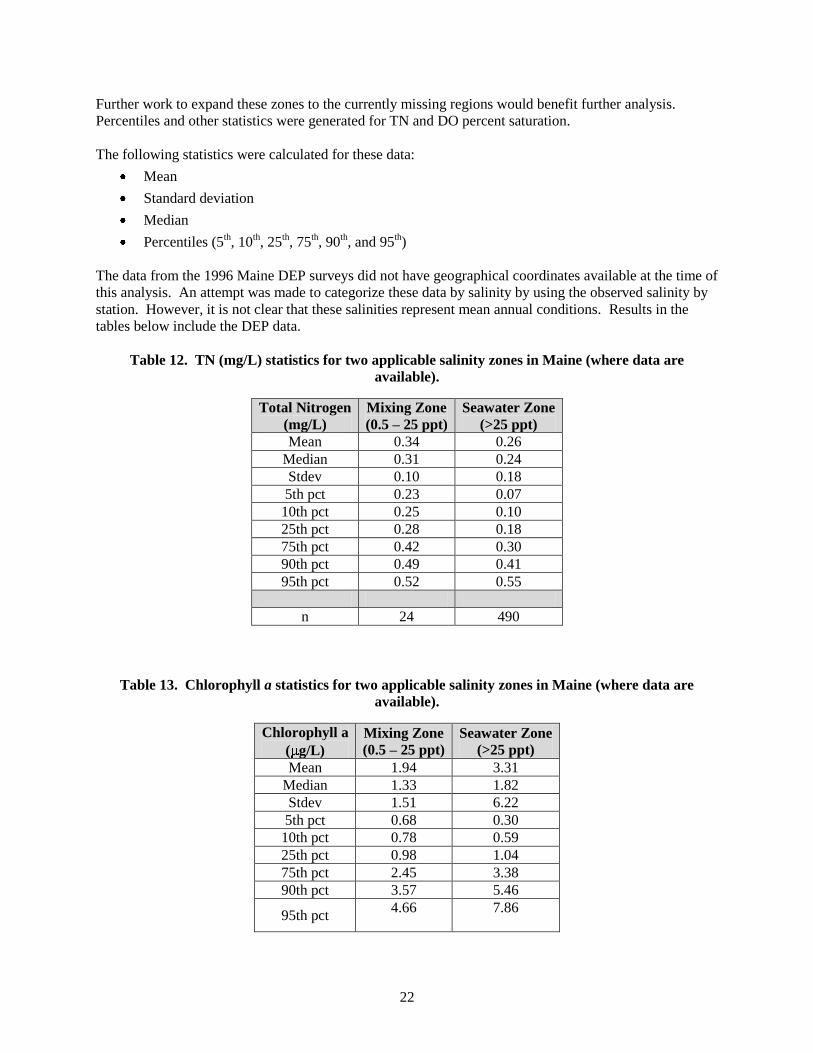
Figure 10 compares mean DO percent saturation values between systems with existing eelgrass (labeled
as SAV) and without. This comparison includes all systems listed in Tables 9 and 10. In essence, this is
identical to Figure 8 and the linear regression would also be identical. The purpose of this figure is to
provide a simple comparison of how the SAV and non-SAV systems fall out along the gradient of
increasing TN concentration.
60
70
80
90
100
110
120
0.10 0.20 0.30 0.40 0.50
DO
(% S
atu
rati
on
)
MeanTN (mg/L)
No SAV
SAV
Figure 10. Comparison of mean TN vs. DO % saturation in estuaries with and without SAV
habitat. Data are from both Maine DEP 1996 and Cadmus 2009 field surveys (Tables 9 and 10).
Section 3.2 Comparisons Based on Salinity Zones
Salinity zones that have been established by NOAA‟s CAF were utilized to classify Maine‟s coastal
systems. These zones (see Table 3) covered much of the Maine coast but were missing in several areas of
the coast. Only data where NOAA CAF zones existed where applied to one of two salinity analyses.
22
Further work to expand these zones to the currently missing regions would benefit further analysis.
Percentiles and other statistics were generated for TN and DO percent saturation.
The following statistics were calculated for these data:
Mean
Standard deviation
Median
Percentiles (5th, 10
th, 25
th, 75
th, 90
th, and 95
th)
The data from the 1996 Maine DEP surveys did not have geographical coordinates available at the time of
this analysis. An attempt was made to categorize these data by salinity by using the observed salinity by
station. However, it is not clear that these salinities represent mean annual conditions. Results in the
tables below include the DEP data.
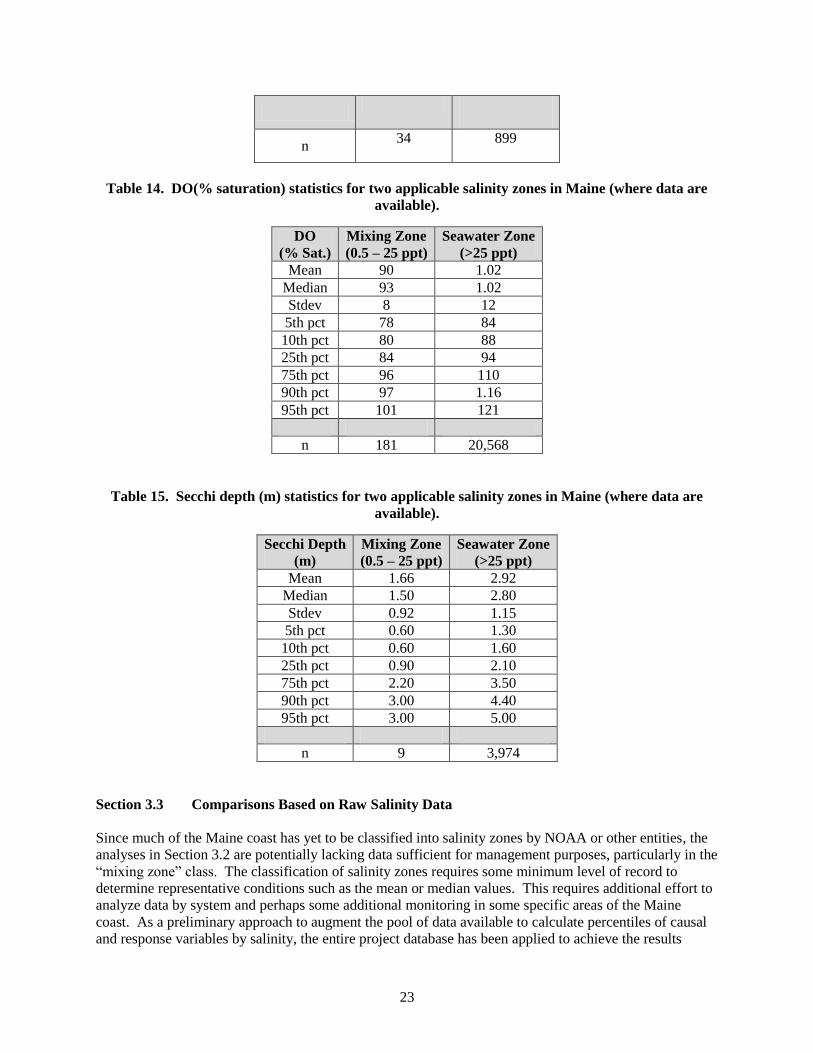
Table 12. TN (mg/L) statistics for two applicable salinity zones in Maine (where data are
available).
Total Nitrogen
(mg/L)
Mixing Zone
(0.5 – 25 ppt)
Seawater Zone
(>25 ppt)
Mean 0.34 0.26
Median 0.31 0.24
Stdev 0.10 0.18
5th pct 0.23 0.07
10th pct 0.25 0.10
25th pct 0.28 0.18
75th pct 0.42 0.30
90th pct 0.49 0.41
95th pct 0.52 0.55
n 24 490
Table 13. Chlorophyll a statistics for two applicable salinity zones in Maine (where data are
available).
Chlorophyll a
( g/L)
Mixing Zone
(0.5 – 25 ppt)
Seawater Zone
(>25 ppt)
Mean 1.94 3.31
Median 1.33 1.82
Stdev 1.51 6.22
5th pct 0.68 0.30
10th pct 0.78 0.59
25th pct 0.98 1.04
75th pct 2.45 3.38
90th pct 3.57 5.46
95th pct 4.66 7.86
23
n 34 899
Table 14. DO(% saturation) statistics for two applicable salinity zones in Maine (where data are
available).
DO
(% Sat.)
Mixing Zone
(0.5 – 25 ppt)
Seawater Zone
(>25 ppt)
Mean 90 1.02
Median 93 1.02
Stdev 8 12
5th pct 78 84
10th pct 80 88
25th pct 84 94
75th pct 96 110
90th pct 97 1.16
95th pct 101 121
n 181 20,568
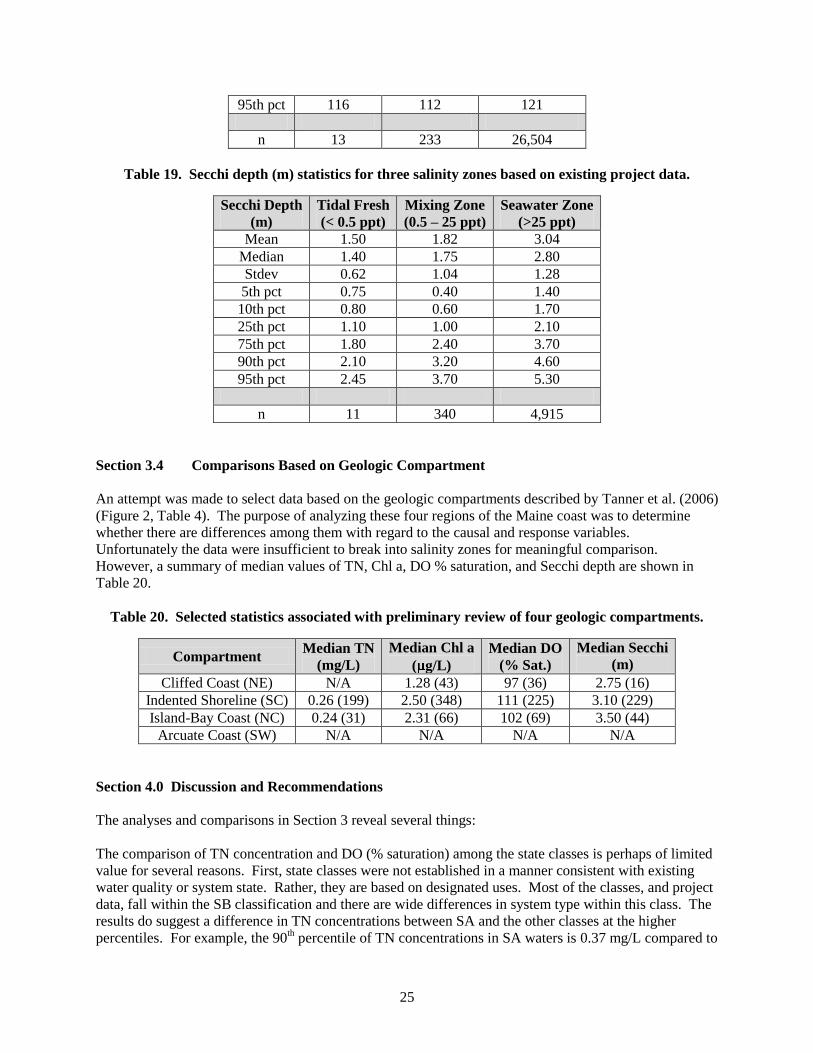
Table 15. Secchi depth (m) statistics for two applicable salinity zones in Maine (where data are
available).
Secchi Depth
(m)
Mixing Zone
(0.5 – 25 ppt)
Seawater Zone
(>25 ppt)
Mean 1.66 2.92
Median 1.50 2.80
Stdev 0.92 1.15
5th pct 0.60 1.30
10th pct 0.60 1.60
25th pct 0.90 2.10
75th pct 2.20 3.50
90th pct 3.00 4.40
95th pct 3.00 5.00
n 9 3,974
Section 3.3 Comparisons Based on Raw Salinity Data
Since much of the Maine coast has yet to be classified into salinity zones by NOAA or other entities, the
analyses in Section 3.2 are potentially lacking data sufficient for management purposes, particularly in the
“mixing zone” class. The classification of salinity zones requires some minimum level of record to
determine representative conditions such as the mean or median values. This requires additional effort to
analyze data by system and perhaps some additional monitoring in some specific areas of the Maine
coast. As a preliminary approach to augment the pool of data available to calculate percentiles of causal
and response variables by salinity, the entire project database has been applied to achieve the results

24
shown below. The database was filtered based on salinity. Although these corresponding data may not
truly represent mean annual salinity regimes for these stations, it is a worthwhile preliminary exercise to
determine these percentiles until further work is completed on establishing more complete salinity zones
across the state.
Table 16. Total nitrogen (mg/L) statistics for three salinity zones based on existing project data.
Total Nitrogen
(mg/L)
Tidal Fresh
(< 0.5 ppt)
Mixing Zone
(0.5 – 25 ppt)
Seawater Zone
(>25 ppt)
Mean 0.30 0.41 0.25
Median 0.35 0.39 0.24
Stdev 0.20 0.17 0.18
5th pct 0.01 0.23 0.07
10th pct 0.01 0.26 0.10
25th pct 0.16 0.33 0.17
75th pct 0.40 0.47 0.29
90th pct 0.45 0.53 0.38
95th pct 0.53 0.70 0.57
n 15 83 470
Table 17. Chlorophyll a ( g/L) statistics for three salinity zones based on existing project data.
Chlorophyll a
( g/L)
Tidal Fresh
(< 0.5 ppt)
Mixing Zone
(0.5 – 25 ppt)
Seawater Zone
(>25 ppt)
Mean 1.24 2.55 2.32
Median 0.85 1.69 1.26
Stdev 0.58 3.50 3.47
5th pct 0.85 0.85 0.18
10th pct 0.85 0.85 0.28
25th pct 0.85 0.85 0.57
75th pct 1.69 3.07 2.80
90th pct 1.69 4.04 5.35
95th pct 2.12 5.96 7.85
n 11 88 5,720
Table 18. Dissolved oxygen (% saturation) statistics for three salinity zones based on existing
project data.
DO
(% Sat.)
Tidal Fresh
(< 0.5 ppt)
Mixing Zone
(0.5 – 25 ppt)
Seawater Zone
(>25 ppt)
Mean 109 93 102
Median 108 93 102
Stdev 5 11 12
5th pct 103 75 84
10th pct 104 80 88
25th pct 105 85 94
75th pct 114 102 110
90th pct 115 107 116
25
95th pct 116 112 121
n 13 233 26,504
Table 19. Secchi depth (m) statistics for three salinity zones based on existing project data.
Secchi Depth
(m)
Tidal Fresh
(< 0.5 ppt)
Mixing Zone
(0.5 – 25 ppt)
Seawater Zone
(>25 ppt)
Mean 1.50 1.82 3.04
Median 1.40 1.75 2.80
Stdev 0.62 1.04 1.28
5th pct 0.75 0.40 1.40
10th pct 0.80 0.60 1.70
25th pct 1.10 1.00 2.10
75th pct 1.80 2.40 3.70
90th pct 2.10 3.20 4.60
95th pct 2.45 3.70 5.30
n 11 340 4,915
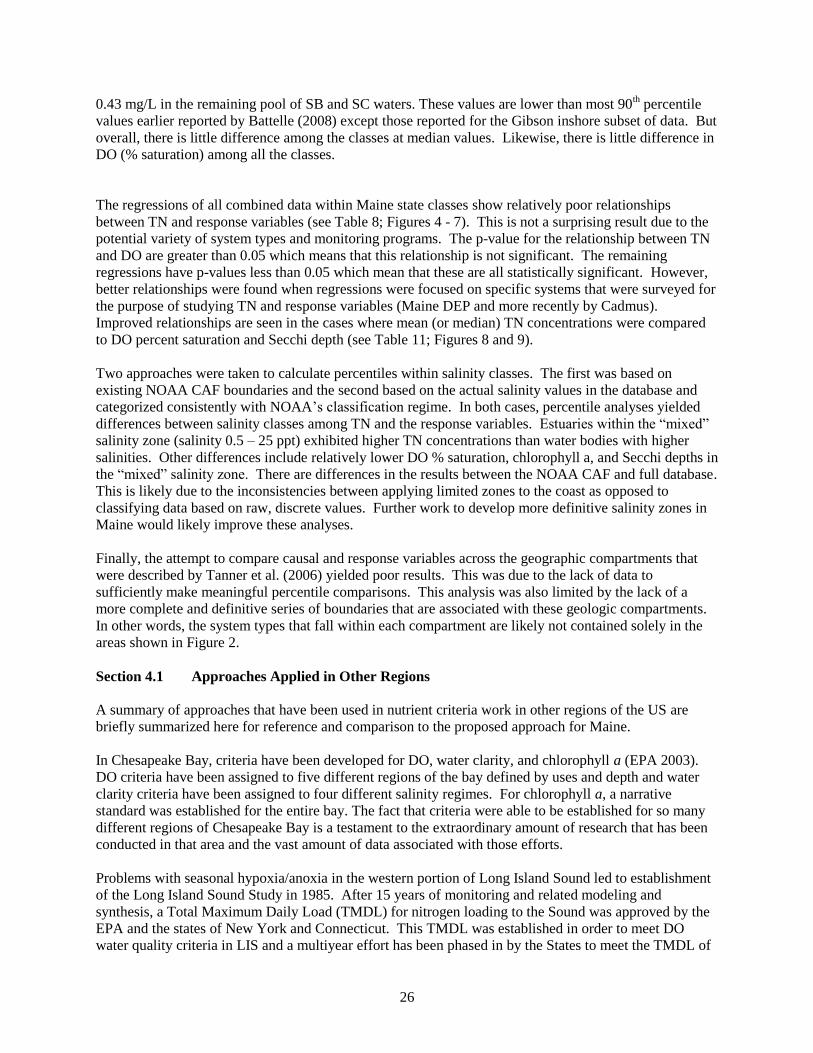
Section 3.4 Comparisons Based on Geologic Compartment
An attempt was made to select data based on the geologic compartments described by Tanner et al. (2006)
(Figure 2, Table 4). The purpose of analyzing these four regions of the Maine coast was to determine
whether there are differences among them with regard to the causal and response variables.
Unfortunately the data were insufficient to break into salinity zones for meaningful comparison.
However, a summary of median values of TN, Chl a, DO % saturation, and Secchi depth are shown in
Table 20.
Table 20. Selected statistics associated with preliminary review of four geologic compartments.
Compartment Median TN
(mg/L)
Median Chl a
( g/L)
Median DO
(% Sat.)
Median Secchi
(m)
Cliffed Coast (NE) N/A 1.28 (43) 97 (36) 2.75 (16)
Indented Shoreline (SC) 0.26 (199) 2.50 (348) 111 (225) 3.10 (229)
Island-Bay Coast (NC) 0.24 (31) 2.31 (66) 102 (69) 3.50 (44)
Arcuate Coast (SW) N/A N/A N/A N/A
Section 4.0 Discussion and Recommendations
The analyses and comparisons in Section 3 reveal several things:
The comparison of TN concentration and DO (% saturation) among the state classes is perhaps of limited
value for several reasons. First, state classes were not established in a manner consistent with existing
water quality or system state. Rather, they are based on designated uses. Most of the classes, and project
data, fall within the SB classification and there are wide differences in system type within this class. The
results do suggest a difference in TN concentrations between SA and the other classes at the higher
percentiles. For example, the 90th percentile of TN concentrations in SA waters is 0.37 mg/L compared to
26
0.43 mg/L in the remaining pool of SB and SC waters. These values are lower than most 90th percentile
values earlier reported by Battelle (2008) except those reported for the Gibson inshore subset of data. But
overall, there is little difference among the classes at median values. Likewise, there is little difference in
DO (% saturation) among all the classes.
The regressions of all combined data within Maine state classes show relatively poor relationships
between TN and response variables (see Table 8; Figures 4 - 7). This is not a surprising result due to the
potential variety of system types and monitoring programs. The p-value for the relationship between TN
and DO are greater than 0.05 which means that this relationship is not significant. The remaining
regressions have p-values less than 0.05 which mean that these are all statistically significant. However,
better relationships were found when regressions were focused on specific systems that were surveyed for
the purpose of studying TN and response variables (Maine DEP and more recently by Cadmus).
Improved relationships are seen in the cases where mean (or median) TN concentrations were compared
to DO percent saturation and Secchi depth (see Table 11; Figures 8 and 9).
Two approaches were taken to calculate percentiles within salinity classes. The first was based on
existing NOAA CAF boundaries and the second based on the actual salinity values in the database and
categorized consistently with NOAA‟s classification regime. In both cases, percentile analyses yielded
differences between salinity classes among TN and the response variables. Estuaries within the “mixed”
salinity zone (salinity 0.5 – 25 ppt) exhibited higher TN concentrations than water bodies with higher
salinities. Other differences include relatively lower DO % saturation, chlorophyll a, and Secchi depths in
the “mixed” salinity zone. There are differences in the results between the NOAA CAF and full database.
This is likely due to the inconsistencies between applying limited zones to the coast as opposed to
classifying data based on raw, discrete values. Further work to develop more definitive salinity zones in
Maine would likely improve these analyses.
Finally, the attempt to compare causal and response variables across the geographic compartments that
were described by Tanner et al. (2006) yielded poor results. This was due to the lack of data to
sufficiently make meaningful percentile comparisons. This analysis was also limited by the lack of a
more complete and definitive series of boundaries that are associated with these geologic compartments.
In other words, the system types that fall within each compartment are likely not contained solely in the
areas shown in Figure 2.
Section 4.1 Approaches Applied in Other Regions
A summary of approaches that have been used in nutrient criteria work in other regions of the US are
briefly summarized here for reference and comparison to the proposed approach for Maine.
In Chesapeake Bay, criteria have been developed for DO, water clarity, and chlorophyll a (EPA 2003).
DO criteria have been assigned to five different regions of the bay defined by uses and depth and water
clarity criteria have been assigned to four different salinity regimes. For chlorophyll a, a narrative
standard was established for the entire bay. The fact that criteria were able to be established for so many
different regions of Chesapeake Bay is a testament to the extraordinary amount of research that has been
conducted in that area and the vast amount of data associated with those efforts.
Problems with seasonal hypoxia/anoxia in the western portion of Long Island Sound led to establishment
of the Long Island Sound Study in 1985. After 15 years of monitoring and related modeling and
synthesis, a Total Maximum Daily Load (TMDL) for nitrogen loading to the Sound was approved by the
EPA and the states of New York and Connecticut. This TMDL was established in order to meet DO
water quality criteria in LIS and a multiyear effort has been phased in by the States to meet the TMDL of
27
a 58.5% reduction in nitrogen loading by 201414
. As was the case with Chesapeake Bay, the LIS DO
criteria were established after many years of monitoring and data evaluation.
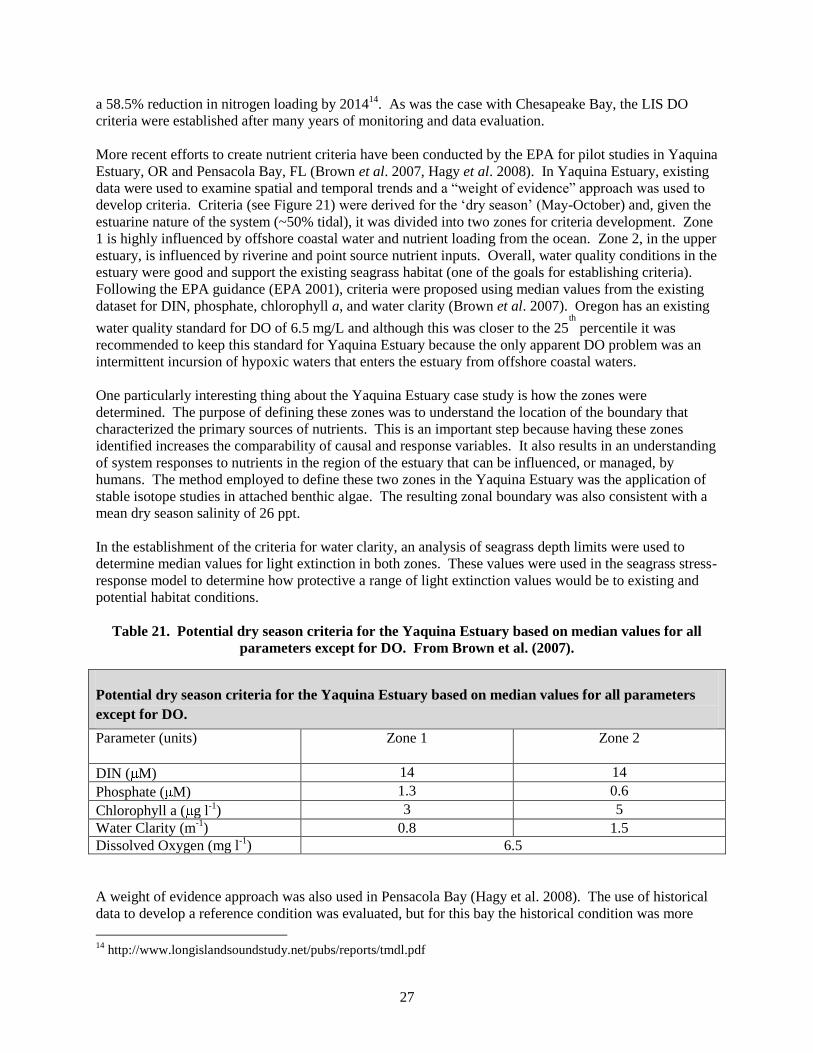
More recent efforts to create nutrient criteria have been conducted by the EPA for pilot studies in Yaquina
Estuary, OR and Pensacola Bay, FL (Brown et al. 2007, Hagy et al. 2008). In Yaquina Estuary, existing
data were used to examine spatial and temporal trends and a “weight of evidence” approach was used to
develop criteria. Criteria (see Figure 21) were derived for the „dry season‟ (May-October) and, given the
estuarine nature of the system (~50% tidal), it was divided into two zones for criteria development. Zone
1 is highly influenced by offshore coastal water and nutrient loading from the ocean. Zone 2, in the upper
estuary, is influenced by riverine and point source nutrient inputs. Overall, water quality conditions in the
estuary were good and support the existing seagrass habitat (one of the goals for establishing criteria).
Following the EPA guidance (EPA 2001), criteria were proposed using median values from the existing
dataset for DIN, phosphate, chlorophyll a, and water clarity (Brown et al. 2007). Oregon has an existing
water quality standard for DO of 6.5 mg/L and although this was closer to the 25th
percentile it was
recommended to keep this standard for Yaquina Estuary because the only apparent DO problem was an
intermittent incursion of hypoxic waters that enters the estuary from offshore coastal waters.
One particularly interesting thing about the Yaquina Estuary case study is how the zones were
determined. The purpose of defining these zones was to understand the location of the boundary that
characterized the primary sources of nutrients. This is an important step because having these zones
identified increases the comparability of causal and response variables. It also results in an understanding
of system responses to nutrients in the region of the estuary that can be influenced, or managed, by
humans. The method employed to define these two zones in the Yaquina Estuary was the application of
stable isotope studies in attached benthic algae. The resulting zonal boundary was also consistent with a
mean dry season salinity of 26 ppt.
In the establishment of the criteria for water clarity, an analysis of seagrass depth limits were used to
determine median values for light extinction in both zones. These values were used in the seagrass stress-
response model to determine how protective a range of light extinction values would be to existing and
potential habitat conditions.
Table 21. Potential dry season criteria for the Yaquina Estuary based on median values for all
parameters except for DO. From Brown et al. (2007).
Potential dry season criteria for the Yaquina Estuary based on median values for all parameters
except for DO.
Parameter (units) Zone 1
Zone 2
DIN ( M) 14 14
Phosphate ( M) 1.3 0.6
Chlorophyll a ( g l-1
) 3 5
Water Clarity (m-1
) 0.8 1.5
Dissolved Oxygen (mg l-1
) 6.5
A weight of evidence approach was also used in Pensacola Bay (Hagy et al. 2008). The use of historical
data to develop a reference condition was evaluated, but for this bay the historical condition was more
14
http://www.longislandsoundstudy.net/pubs/reports/tmdl.pdf
28
enriched in nutrients than the current state. Nutrient loading to the system had decreased since 1980 and
present water quality was considered protective of the designated uses. Hypoxic conditions appear to be
the result of natural processes and a propensity toward low DO in the system and loss of seagrass in the
bay were related to pre-1980 degraded water quality. Their goal was to keep water quality at its current
levels and not to have it degrade as the region continues to grow. As in Oregon, criteria were proposed
for Pensacola Bay based on the relative freshwater and seawater influences along salinity gradients with
separate criteria for oligohaline (<5 PSU), mesohaline (5-18 PSU), and polyhaline (>18 PSU). The
summer median levels were proposed as criteria for chlorophyll a, Secchi depth, DIN, phosphate, TN
(<.50 mg/L), and TP (Hagy et al. 2008).
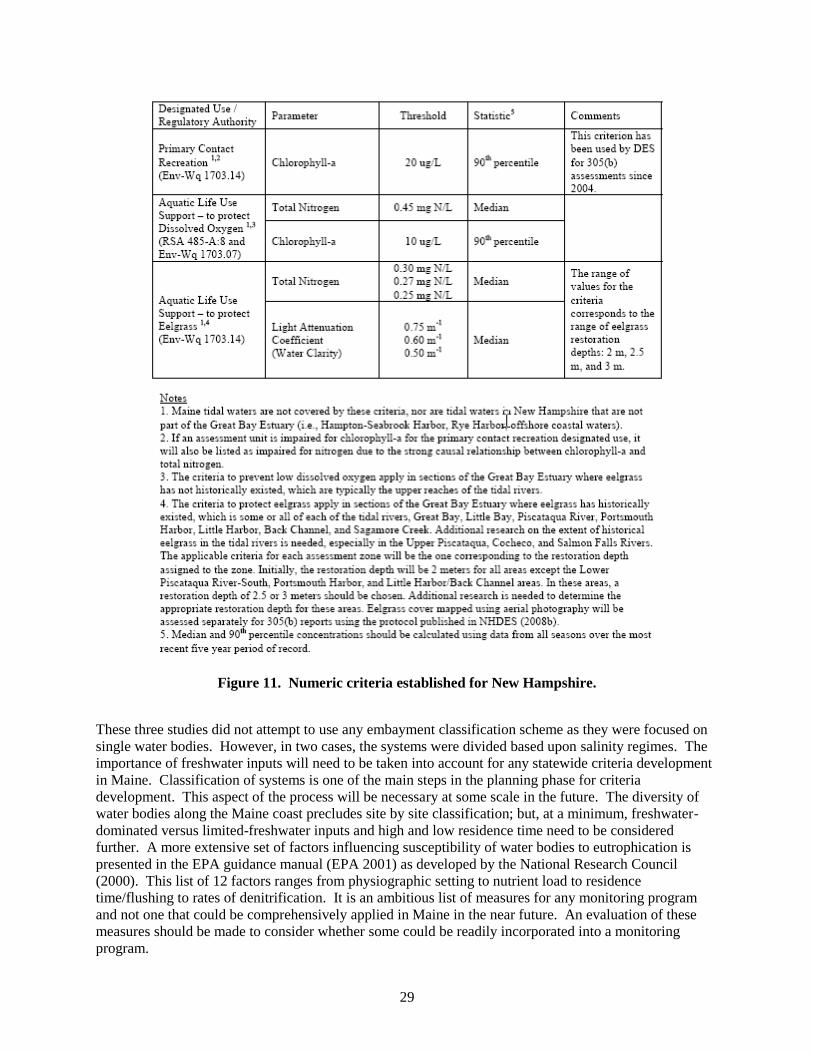
Most recently New Hampshire has developed numerical criteria for nutrients for its only true coastal
system: Great Bay (NHDES 2009). Their approach was based on delineating 22 subsegments of the
Great Bay system. A weight of evidence approach was applied through a series of linear regressions and
review of continuous monitoring data. New Hampshire set nutrient criteria based on two ecosystem
response variables: DO and SAV. The criteria for DO are associated with a maintaining instantaneous
dissolved oxygen concentrations greater than 5 mg/L and average daily concentrations greater than 75%
saturation. To support these conditions the annual median total nitrogen concentration should be less than
or equal to 0.45 mg N/L and the 90th percentile chlorophyll-a concentration should be less than or equal
to 10 ug/L. The protection of SAV was used to determine TN concentration and light attenuation criteria
based on information associated with restoration depth in Great Bay. The annual median total nitrogen
concentration should be less than or equal to 0.25-0.30 mg N/L and the annual median light attenuation
coefficient (a measure of water clarity) should be less than or equal to 0.5-0.75 m-1
(depending on the
eelgrass restoration depth). Figure 11 provides a summary of New Hampshire‟s numeric criteria.
The Great Bay system may be somewhat unique in character, yet it is along the southern border of Maine
and may be characteristic of some of Maine‟s estuarine systems in that region. Therefore, it is worth a
preliminary comparison of these numeric criteria to the linear regressions shown above in Section 3. For
illustrative purposes the linear regression between median TN concentration and mean Secchi depth
shown in Figure 9 can be applied to the range of New Hampshire‟s light attenuation criteria (0.5 to 0.75
m-1
). After converting light extinction coefficient to Secchi depth15
the resulting range is 0.85 to 1.275 m.
The associated median TN concentrations (based on the linear regression shown in Figure 8) then range
from 0.32 to 0.33 mg/l TN which is slightly higher than New Hampshire‟s protective criteria range of
0.25 to 0.30 mg/l TN. In Maine, this range associated with SAV falls near the 75th percentile of all Maine
classified waters (SA, SB, and SC), particularly state class SB alone which comprises the vast majority of
water bodies in the state.
The numeric criterion associated with DO concentration is 0.45 mg/l TN (annual median) in New
Hampshire. This is equivalent to about the 95th percentile of Maine state class SA waters and between the
90th and 95
th percentile of all state classified waters.
15
A conversion factor of 1.7 was applied: Kd * 1.7 = Secchi Depth (m). Based on several published reports that
reference R. W. Holmes, Limnol. Oceanogr. 15, 688 (1970).
29
Figure 11. Numeric criteria established for New Hampshire.
These three studies did not attempt to use any embayment classification scheme as they were focused on
single water bodies. However, in two cases, the systems were divided based upon salinity regimes. The
importance of freshwater inputs will need to be taken into account for any statewide criteria development
in Maine. Classification of systems is one of the main steps in the planning phase for criteria
development. This aspect of the process will be necessary at some scale in the future. The diversity of
water bodies along the Maine coast precludes site by site classification; but, at a minimum, freshwater-
dominated versus limited-freshwater inputs and high and low residence time need to be considered
further. A more extensive set of factors influencing susceptibility of water bodies to eutrophication is
presented in the EPA guidance manual (EPA 2001) as developed by the National Research Council
(2000). This list of 12 factors ranges from physiographic setting to nutrient load to residence
time/flushing to rates of denitrification. It is an ambitious list of measures for any monitoring program
and not one that could be comprehensively applied in Maine in the near future. An evaluation of these
measures should be made to consider whether some could be readily incorporated into a monitoring
program.
30
A different type of classification scheme has been presented in work by Dettmann and Kurtz (2006).
They propose using stressor-response relationships to group water bodies by how they respond to
nitrogen loading as the stressor. They focus on two separate responses – extent of eelgrass habitat and
phytoplankton biomass response (as measured by chlorophyll concentration). We have begun to explore
trends in TN with regard to eelgrass habitat, but more work is necessary to expand this effort and also
include additional factors such as the presence of macroalgae. Macroalgae may outcompete
phytoplankton for nutrients and rapidly accumulate standing stocks that can result in severe declines in
eelgrass habitat. Ambient concentrations of chlorophyll and TN were directly compared by Dettman and
Kurtz (2006) and the relationships between these two parameters were compared across ten
estuarine/coastal systems. There were clear year to year variations within and between systems, but when
average summer (June-August) data were examined from each system, the ten systems separated out into
two groupings – coastal embayments and riverine-dominated systems. In the four coastal embayments
examined (LIS, Boston Harbor, Tampa Bay, and Peconic Estuary), the slopes of the regressions for log
transformed chlorophyll vs. TN concentrations were statistically the same, while the intercepts were
statistically different. The differences in the intercepts were related to the level of total suspended solids
(TSS) in the system. It was concluded that there is a consistent phytoplankton response related to
ambient TN concentrations, but that other factors (water clarity in this case) may reduce the response
(lower light availability at higher TSS leads to lower production). The riverine-influenced systems had
similar relationships, but they were more complex given the wide range in TSS levels. This classification
approach provides two types of systems to examine and provides a possible mechanism for linking
ambient TN levels to the response variable chlorophyll. Even if this kind of stressor-response relationship
can be determined for Maine, the level of the stressor that is protective of water body uses still needs to be
determined.
Additional classification schemes are available and could be examined for applicability and ease of use
for Maine coastal waters. The Coastal and Marine Ecological Classification Standard (CMECS was
developed in conjunction with NOAA and it classifies habitats and ecological roles from head of tides in
estuaries, to the coast, and out into the oceans of North America (Madden et al. 2005). The EPA has
promoted the use of Level III ecoregions as a mechanism for classifying systems and is heavily involved
in the evaluation and development of additional classification approaches (Kurtz et al. 2006). The
National Estuaries Assessment and Management (NE) Project of Australia has made significant progress
in the development of an inventory of estuarine (or water body) type (classification) and condition. This
assessment includes 974 discrete systems throughout Australia and Tasmania. Their efforts are illustrated
on their web site, the “OzEstuaries Database” (www.ozestuaries.org). The Australian NE Project is based
on a geomorphic classification scheme which was developed by Harris et al. (2002).
The effort to classify all of Maine‟s coastal systems would be a significant one due to the vast extent and
variation of systems along the coast. Salinity and depth classifications are likely among the most
practical because data exist to support these. Water residence time is more difficult to accurately
calculate but can be roughly estimated through methods like tidal prism models. These types of
classifications may be necessary (at some scale) to determine the importance of geomorphic differences
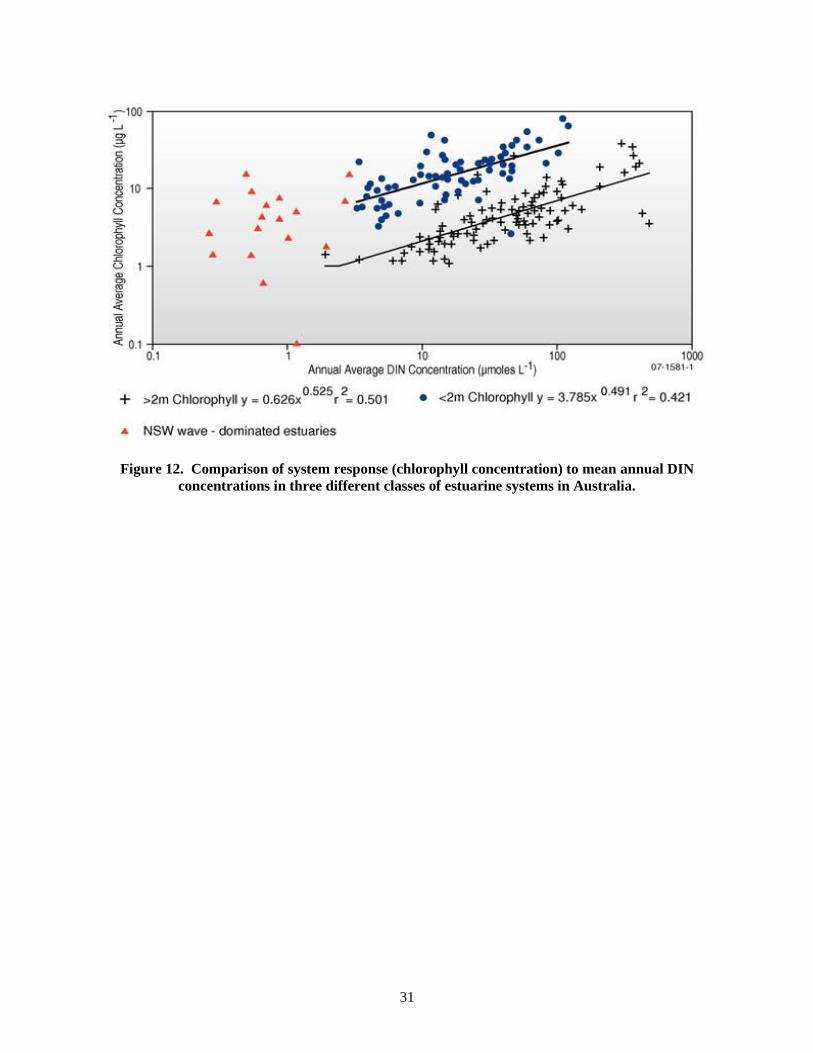
among Maine‟s coastal systems. Figure 12 is an example how three types of geomorphic classes
(primarily depth) can display quite different responses of chlorophyll to DIN concentrations (the slopes of
the two depth classes are an order of magnitude different). Figure 13 provides a hypothetical response of
producers to nutrient enrichment across water residence times.
31
Figure 12. Comparison of system response (chlorophyll concentration) to mean annual DIN
concentrations in three different classes of estuarine systems in Australia.

32
Figure 13. Conceptual scheme showing hypothetical pattern of change in the relative contribution
by three major groups of producers (phytoplankton-P; macroalgae-M; eelgrass-S) in response to
changes in nitrogen loading rate in shallow temperate estuaries with shorter and longer water
residence times. Taken from Valiela et al. (1997).
33
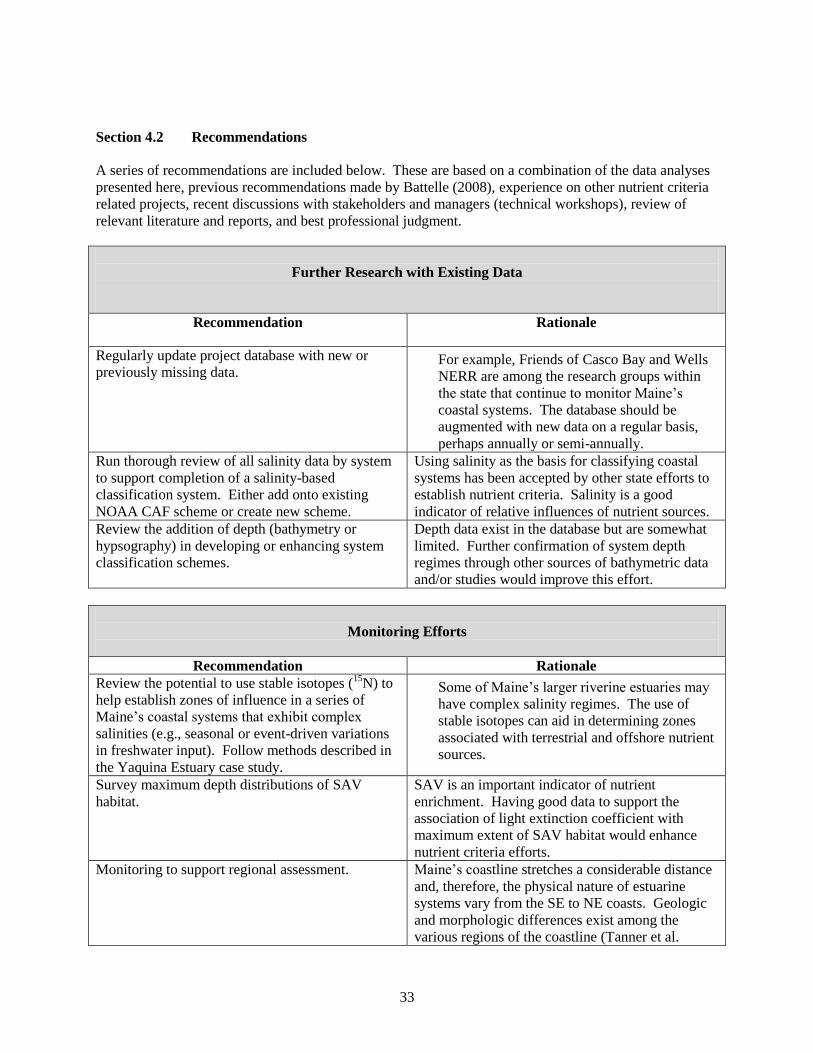
Section 4.2 Recommendations
A series of recommendations are included below. These are based on a combination of the data analyses
presented here, previous recommendations made by Battelle (2008), experience on other nutrient criteria
related projects, recent discussions with stakeholders and managers (technical workshops), review of
relevant literature and reports, and best professional judgment.
Further Research with Existing Data
Recommendation Rationale
Regularly update project database with new or
previously missing data. For example, Friends of Casco Bay and Wells
NERR are among the research groups within
the state that continue to monitor Maine‟s
coastal systems. The database should be
augmented with new data on a regular basis,
perhaps annually or semi-annually.
Run thorough review of all salinity data by system
to support completion of a salinity-based
classification system. Either add onto existing
NOAA CAF scheme or create new scheme.
Using salinity as the basis for classifying coastal
systems has been accepted by other state efforts to
establish nutrient criteria. Salinity is a good
indicator of relative influences of nutrient sources.
Review the addition of depth (bathymetry or
hypsography) in developing or enhancing system
classification schemes.
Depth data exist in the database but are somewhat
limited. Further confirmation of system depth
regimes through other sources of bathymetric data
and/or studies would improve this effort.
Monitoring Efforts
Recommendation Rationale
Review the potential to use stable isotopes (15
N) to
help establish zones of influence in a series of
Maine‟s coastal systems that exhibit complex
salinities (e.g., seasonal or event-driven variations
in freshwater input). Follow methods described in
the Yaquina Estuary case study.
Some of Maine‟s larger riverine estuaries may
have complex salinity regimes. The use of
stable isotopes can aid in determining zones
associated with terrestrial and offshore nutrient
sources.
Survey maximum depth distributions of SAV
habitat.
SAV is an important indicator of nutrient
enrichment. Having good data to support the
association of light extinction coefficient with
maximum extent of SAV habitat would enhance
nutrient criteria efforts.
Monitoring to support regional assessment. Maine‟s coastline stretches a considerable distance
and, therefore, the physical nature of estuarine
systems vary from the SE to NE coasts. Geologic
and morphologic differences exist among the
various regions of the coastline (Tanner et al.
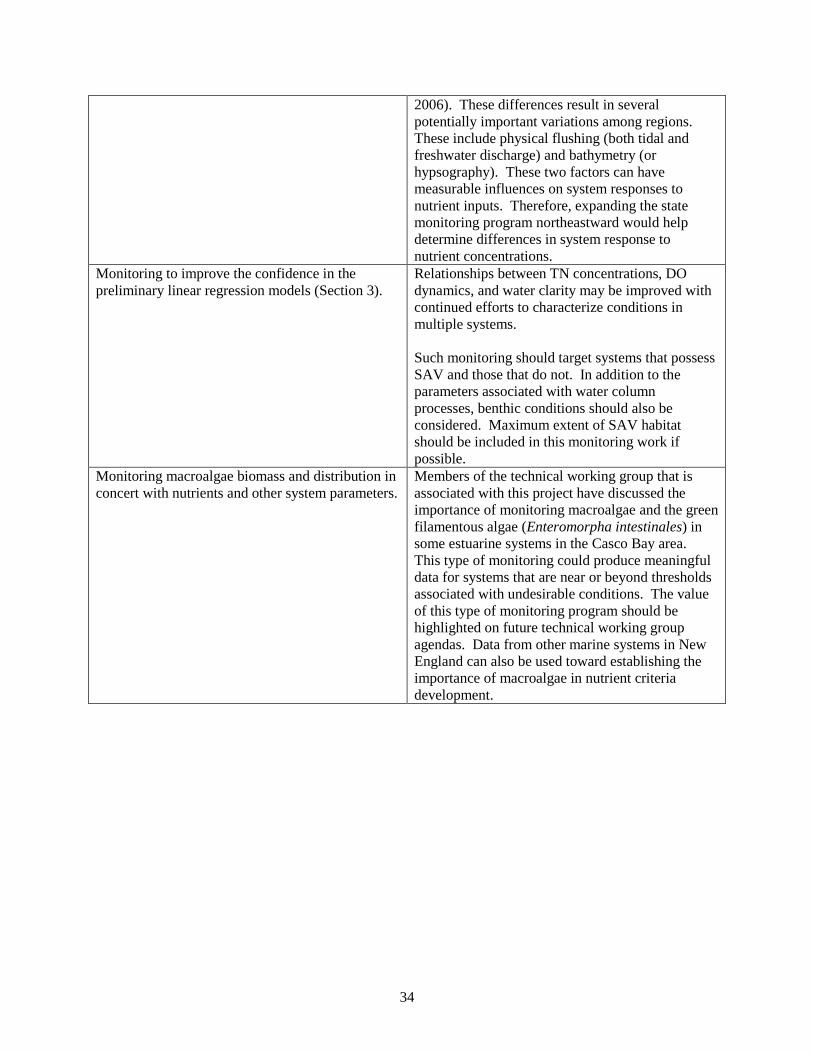
34
2006). These differences result in several
potentially important variations among regions.
These include physical flushing (both tidal and
freshwater discharge) and bathymetry (or
hypsography). These two factors can have
measurable influences on system responses to
nutrient inputs. Therefore, expanding the state
monitoring program northeastward would help
determine differences in system response to
nutrient concentrations.
Monitoring to improve the confidence in the
preliminary linear regression models (Section 3).
Relationships between TN concentrations, DO
dynamics, and water clarity may be improved with
continued efforts to characterize conditions in
multiple systems.
Such monitoring should target systems that possess
SAV and those that do not. In addition to the
parameters associated with water column
processes, benthic conditions should also be
considered. Maximum extent of SAV habitat
should be included in this monitoring work if
possible.
Monitoring macroalgae biomass and distribution in
concert with nutrients and other system parameters.
Members of the technical working group that is
associated with this project have discussed the
importance of monitoring macroalgae and the green
filamentous algae (Enteromorpha intestinales) in
some estuarine systems in the Casco Bay area.
This type of monitoring could produce meaningful
data for systems that are near or beyond thresholds
associated with undesirable conditions. The value
of this type of monitoring program should be
highlighted on future technical working group
agendas. Data from other marine systems in New
England can also be used toward establishing the
importance of macroalgae in nutrient criteria
development.
35
Section 5.0 References
Battelle. 2008. Conceptual plan for nutrient criteria development in Maine coastal waters. EPA Region 1.
Brown, C.A., W.G. Nelson, B.L. Boese, T.H. DeWitt, P.M. Eldridge, J.E. Kaldy, H. Lee II, J.H. Power
and D.R. Young. 2007. An Approach to Developing Nutrient Criteria for Pacific Northwest Estuaries: A
Case Study of Yaquina Estuary, Oregon. USEPA ORD, NHEERL, WED EPA/600/R-07/046
Dettmann, E.H. and J.C. Kurtz. Responses of Seagrass and Phytoplankton in Estuaries of the Eastern
United States to Nutrients: Implications for Classification. AED-06-102.
EPA. 1998. National strategy for the development of regional nutrient criteria. EPA 922-R-98-002.
United States Environmental Protection Agency, Washington, DC. 47 pp.
EPA. 2000a. Nutrient criteria technical guidance manual: Lakes and reservoirs. US Environmental
Protection Agency, Washington, DC EPA-822-B00-001.
EPA. 2000b. Nutrient criteria technical guidance manual: River and Streams. US Environmental
Protection Agency, Washington, DC EPA-822-B00-002.
EPA. 2001. Nutrient Criteria Technical Guidance Manual. Estuarine and Coastal Marine Waters. US
Environmental Protection Agency, Washington, DC. EPA-822-B-01-003.
EPA. 2003. Ambient Water Quality Criteria for Dissolved Oxygen, Water Clarity, and Chlorophyll a for
Chesapeake Bay and its Tidal Tributaries. EPA 903-R-03-002, Region III Chesapeake Bay Program
Office, Office of Water, Washington, DC.
Hagy, J.D., J.C. Kurtz, and R.M. Greene. 2008. An approach for developing numeric nutrient criteria for
a Gulf coast estuary. U.S. Environmental Protection Agency, Office of Research and Development,
National Health and Environmental Effects Research Laboratory, Research Triangle Park, NC. EPA
600R-08/004. 48 pp.
Harris, P. T., Heap, A. D., Bryce, S. M., Porter-Smith, R., Ryan, D. A., and Heggie, D. T., (2002)
Classification of Australian clastic coastal depositional environments based on a quantitative analysis of
wave, tide and river power. Journal of Sedimentary Research. 72 (6):858-870.
Kelly, J.R. and P.S. Libby, 1996. Dissolved Oxygen Levels in Select Maine Estuaries and Embayments –
Summer 1995. Final Report to Wells NERR. February 1996. 14++pp.
Kelly, J.R., 1997. Dissolved Oxygen in Maine Estuaries and Embayments – 1996 Results and Analyses.
Final Report to Wells NERR. August 1997. 18++pp.
Kurtz, J.C., N.D. Detenbeck, V.D. Engle, K. Ho, L.M. Smith, S.J. Jordan and D. Campbell. 2006.
Classifying Coastal Waters: Current Necessity and Historical Perspective. Estuaries and Coasts.
29(1):107-123.
Madden, Christopher J., Dennis H. Grossman, and Kathleen L. Goodin. 2005. Coastal and Marine
Systems of North America: Framework for an Ecological Classification Standard: Version II.
NatureServe, Arlington, Virginia.
36
New Hampshire Department of Environmental Services (NHDES). 2009. Numeric nutrient criteria for
the Great Bay Estuary. R-WD-09-12
Tanner, B.R.; Perfect, E., And Kelley, J.T., 2006. Fractal analysis of Maine‟s glaciated shoreline tests
established coastal classification scheme. Journal of Coastal Research, 22(5), 1300–1304.
Valiela, I., J. McClellan, J. Hauxwell, P.J. Behr, D. Hersh, and K. Foreman. 1997. Macroalgal blooms in
shallow estuaries: Controls and ecophysiological and ecosystem consequences. Limnology and
Oceanography 42:1105–1118.