nutrient losses by leaching and surface runoff in a banana
TRANSCRIPT

Date: 06/09/2017 Author: HF de Bie Supervisors: dr. ir. JJ Stoorvogel (WUR) dr. VF Bense (WUR) R Segura Mena MSc (CORBANA)
Nutrient losses by leaching and surface runoff in a banana plantation in the Atlantic Zone of
Costa Rica
WAGENINGEN UNIVERSITY
Soil geography and Landscape Group
Hydrology and quantitave water management group
~
CORBANA
Corporación bananera Nacional

1
Abstract High quantities of fertilizers are required for commercial banana production in the humid tropics, which is predominantly due to the high nutrient losses by leaching and surface runoff. In order to reduce these losses, and with that the amount of fertilizer costs, a better understanding of the effect of hydrological processes on the nutrient losses is essential. To reach this objective a field experiment has been conducted in the banana plantation “Finca San Pablo”, in the Atlantic Zone of Costa Rica. Groundwater levels and water levels in the drainage channels, were measured in three different plots. Next to that, lysimeters were placed to sample the nutrient concentrations in the soil water, and samples from the drainage channels were taken. The results show that the tertiary drainage channels collected surface runoff and groundwater, when groundwater levels were above the bottom of the channel. A clear distinction was found between nutrient concentrations in tertiary channel water during peak flows, and nutrient concentrations in the water during periods without rain that originated from groundwater. The nutrient concentrations during peak flows, originating from surface runoff water, were two and three (P and K respectively) times higher. The nutrient concentrations found in the soil moisture correlate with concentrations found in the channels during periods in which it solely collected groundwater. Based on the findings it is concluded that leaching water has lower nutrient concentrations than water lost by surface runoff. It was calculated that the distribution of the available water between surface runoff and leaching is ± 50/50, which implies, that the amount of nutrients lost by surface runoff are 2-3 times higher, for P and K respectively, than the amount of nutrients lost by leaching. The nutrient efficiency calculation based on the found average nutrient concentrations gave an underestimation of the amount of nutrient lost by surface runoff and leaching (surplus water) combined. This implies that actual nutrient concentrations have to be higher in the surplus water than the found nutrient concentrations. That these concentrations not have been found could be because rainfall intensities were low during the field study and maximum peak during the surface runoff events was not sampled. Overall, it can be concluded that in a banana plantation in the Atlantic Zone of Costa Rica most of the nutrients are lost by surface runoff. With this conclusion, it is recommended to implement measures, which reduce surface runoff, or incorporates fertilizers in the soil, in order to reduce nutrient losses.

2
Table of contents
Abstract ................................................................................................................................................... 1
Table of contents ..................................................................................................................................... 2
1. Introduction ..................................................................................................................................... 4
2. Conceptual Model ........................................................................................................................... 6
2.1 Hydrology ................................................................................................................................ 7
2.1.1 Precipitation .................................................................................................................... 7
2.1.2 Surface runoff .................................................................................................................. 8
2.1.3 Leaching ........................................................................................................................... 8
2.1.4 Evapotranspiration .......................................................................................................... 9
2.2 Nutrients .................................................................................................................................. 9
2.2.1 Fertilizer ........................................................................................................................... 9
2.2.2 Precipitation .................................................................................................................... 9
2.2.3 Harvested product ........................................................................................................... 9
2.2.4 Nitrogen Oxide Emissions .............................................................................................. 10
2.1.5 Losses by hydrological processes .................................................................................. 10
2.3 Unique processes for banana plantation .............................................................................. 10
2.4 Nutrient Balance .......................................................................................................................... 11
3. Materials and Methods ................................................................................................................. 12
3.1 Study area .................................................................................................................................... 12
3.2 Field selection .............................................................................................................................. 14
3.3 Hydrological measurements ........................................................................................................ 15
3.4 Water sampling ........................................................................................................................... 16
3.5 Analyses ................................................................................................................................. 17
4. Results ........................................................................................................................................... 19
4.1 Hydrologic system ................................................................................................................. 19
4.1.1 Rainfall ........................................................................................................................... 19
4.1.2 Water levels in the tertiary channels ............................................................................ 20
4.1.3 Groundwater levels ....................................................................................................... 22
4.1.4 Discharge ....................................................................................................................... 24
4.1.5 Surface runoff coefficient .............................................................................................. 24
4.2 Nutrient concentrations in drainage channels and soil water .............................................. 25
4.2.1 Drainage channels ......................................................................................................... 25
4.2.2 Soil moisture .................................................................................................................. 26

3
4.3 Nutrient efficiency ................................................................................................................. 26
5. Discussion ...................................................................................................................................... 28
Uncertainties ..................................................................................................................................... 30
Recommendations ............................................................................................................................ 30
6. Conclusions .................................................................................................................................... 31
References ............................................................................................................................................. 32
Acknowledgement ................................................................................................................................. 35

4
1. Introduction Commercial banana production in the humid tropics requires fertilizers with quantities up to 3000 t/ha/y (Gonçalves, 2014). These large quantities are required due to the naturally high nutrient demand of the banana plant, high production rates and the specific climatic condition, which stimulates nutrient losses by leaching and runoff. The latter causes a low nutrient efficiency in banana plantations in the humid tropics, and losses can be up to 90% of the applied fertilizers (Robinson et al., 2010). The fertilizers are expensive (yearly over $1000 per ha) and when the mentioned nutrient losses by leaching and surface runoff could be reduced this directly would increase profits.
Studies on the effect of fertilizer use on the ground and surface water quality in banana plantations have been conducted several times (Acón et al., 2013; Godefroy et al., 1970; Godefroy et al., 1975; Rosales et al., 1992). However, little is known about the quantity of nutrient lost over time after rainfall events and the distribution of losses between leaching and surface runoff.
Aims and objectives
The objective of this study is to understand the effect of surface runoff and leaching on nutrient distribution in a banana plantation in the Atlantic zone of Costa Rica. This knowledge could help find efficient methods to increase nutrient efficiency by reducing nutrient losses and therefor reduce fertilizer cost in banana plantations. To reach this objective a field experiment is conducted in the banana plantation “Finca San Pablo”, in the Atlantic Zone of Costa Rica. This banana producer is a subsidiary of Corporación Bananera Nacional (CORBANA), a non-governmental public institution. The research is conducted in collaboration with CORBANA and Wageningen UR.
The aim is to provide information about the processes that lead to nutrient losses by leaching and surface runoff and to quantify these losses. A quantitative comparison of the efficient methods of limiting nutrient losses by runoff or leaching lies beyond the scope of this research project. We want to reach the aim by answering the following question:
What is the effect of hydrological processes on the nutrients losses in a banana plantation in the Atlantic Zone of Costa Rica?
In order to answer this main research question the following sub-questions have been identified:
1. What is the conceptual model of the hydrologic system and the nutrient cycle of a banana plantation?
2. What is the origin of the collected water by drainage channels in the studied banana planation, and what influences this composition?
3. What is the distribution of nutrients in the surface runoff and leaching water in the studied banana plantation?
Methodology
In order to answer the stated questions a field study has been conducted in a banana plantation in the Atlantic Zone of Costa Rica. Hydrological measurements, like groundwater levels and water levels in the drainage channels, were taken in three different plots. Next to that, lysimeters were placed to sample the nutrient concentrations in the soil water, and water samples from the drainage channels were taken. Hydrological behaviour of the system and nutrient concentrations in the soil and drainage water are analysed and based on a created conceptual model the nutrient losses by leaching and surface runoff water were estimated.

5
Report outline
The report consists of six chapters of which the second chapter covers sub-question one by describing a conceptual model that explains the hydrological processes that effect nutrient losses in banana plantations. The following chapter describes the materials and methods used in this field study. Chapter 4 gives the results of the field study, divided into the results of the hydrologic measurements, nutrient concentrations found in the soils and channels, and the nutrient efficiency. In chapter five, the discussion drawn from the results is described. The last chapter gives the conclusion of this study.

6
2. Conceptual Model Before describing the materials and methods used in the field study, this chapter aims to provide a visual representation of the hydrologic and nutrient system of a banana plantation. This visual presentation, the conceptual model, is based on literature, and used as a guide for setting up the field study. Next to that, this conceptual model is used for estimating the nutrient efficiency (the percentage of fertilizer taken up by the harvested product) in chapter 4 and the nutrient balance. The figure below illustrates the conceptual model:
Figure 1 - Visualisation of the conceptual model, which includes; Evapotranspiration (ET), harvested product (H), precipitation (P), fertilizer (F), surface runoff (SR), infiltration (I), nitrogen emissions (N) and leaching (L). The redlined components represent the nutrient output of the system and the green-lined components represent nutrient input of the system. The black line represent the soil surface, and the blue arrows represent water and nutrient fluxes.
The above-visualised conceptual model is based on the balance method, a common used method for estimating nutrient losses in agricultural systems (i.a. Van Vosselen et al., 2005; Bindraban et al., 2000; Acón-Ho et al. ,2013; Sansoulet et al., 2007). The balance method is a statement of the law of conservation of mass, and reads in its simplest form:
𝐼𝐼𝐼𝐼𝐼𝐼𝐼𝐼𝐼𝐼𝐼𝐼 = 𝑂𝑂𝑂𝑂𝑂𝑂𝐼𝐼𝐼𝐼𝐼𝐼𝐼𝐼 + 𝐶𝐶ℎ𝑎𝑎𝐼𝐼𝑎𝑎𝑎𝑎 𝑖𝑖𝐼𝐼 𝑆𝑆𝑂𝑂𝐼𝐼𝑆𝑆𝑎𝑎𝑎𝑎𝑎𝑎

7
The advantages of the balance method is that it can be assessed for any size of area and for any period of time and it can calculate the one unknown of the balance equation (provided that the other components are known). The balance method simplifies the actual complex system in a banana plantation, which involves numerous processes, variables and constants. However with the balance method an representative estimation of the nutrient losses in a banana plantation can be given with relatively little input (Acón-Ho et al. ,2013; Sansoulet et al., 2007). Next to that, a high degree of complexity is not required because, first, it is not the aim to be able to calculate the nutrient losses with a high degree of accuracy, and secondly, input data for a more complex model is not available.
The amount of nutrient lost by surface runoff and leaching depends namely on the amount of water lost by surface runoff and leaching, and the nutrient concentrations in this water: both can be easily estimated using the balance method. The water balance used in the conceptual model:
𝑃𝑃 − 𝐸𝐸𝐸𝐸 = 𝑄𝑄 + 𝐿𝐿
In which:
− P = Precipitation (mm) − ET = Evaporation and transpiration (mm) − Q = Runoff − L = Leaching (mm)
With the use of the water balance method, the amount of leaching and surface runoff water can be calculated. These amounts are necessary to calculate the nutrients that are lost through these hydrological processes in the nutrient balance, which reads:
𝐹𝐹 + 𝑃𝑃 + 𝑁𝑁 −𝐻𝐻 = 𝑄𝑄 + 𝐿𝐿
In which:
− F = Fertilizer (kg/ha) − P = Precipitation (kg/ha) = Nutrient concentrations in precipitation (kg/l) x the amount of
precipitation (l/ha) − H = Harvested product; in this case fruit removal (kg/ha), − N = Nitrogen Oxide Emissions (kg/ha) − R = Runoff (kg/ha) = Nutrient concentration runoff water (kg/l) x the amount of surface
runoff (l/ha) − L = Leaching (kg/ha) = Nutrient concentration leaching water (kg/l) x the amount of leaching
water (l/ha)
In both the water and nutrient balance, the “change in storage” is ignored because the change in storage over longer periods equals zero. The terms of both the water and nutrient balance are described below.
2.1 Hydrology 2.1.1 Precipitation
The only input of water in the conceptual model is precipitation, from which a part reaches the soil directly but the banana plant canopy intercepts a major part. The intercepted water evaporates from the canopy or is redistributed by the banana plant and reaches the soil by stem flow and through fall. The distribution between the water fluxes runoff and leaching highly depends on the intensity of rainfall events (see subparagraphs 2.1.2 and 2.1.3). Climate data used in this study is obtained from
8
the by CORBANA managed meteorological station 28 Millas, which is located next to the plantation and ± one kilometre from the study fields.
2.1.2 Surface runoff The rainfall that reaches the soil infiltrates or contributes to the surface runoff or overland flow. The latter flushes away a part of the fertilizer from the surface towards the drain after which it is discharged outwards the banana plantation. In general, two types of surface runoff or overland flow can be distinguished (Te Chow, 1988):
1. Hortonian overland flow, occurs when rain intensity exceeds soil infiltration capacity. This implies that the soil is saturated from above by infiltration;
2. Saturated overland flow, which is produced when rain falls onto a saturated soil. This implies that the soil is saturated from below by subsurface flow, this often occurs at the bottom of hill slopes and near stream banks;
Sevenhuysen and Maebe (1995) stated that the infiltration capacity of the soils in the Atlantic Zone of Costa Rica exceeds observed rainfall intensities for all except the extreme rainfalls. And there for concluded that Hortonian overland flow will rarely occur and most of the surface runoff will be caused by saturated overland flow. However, the results of the study of Cattan et al. (2009) in banana plantations in the French West Indies suggested that the reason runoff occurred was because of Hortonian runoff processes. Which was supported by three main observations, first, from video monitoring they observed that runoff-contributing areas extended with an increase of rainfall intensity. Second, it was observed from runoff measurements that the runoff coefficient (percentage of rainfall which contributes to surface runoff) increased after an increase in rainfall intensity. Third, no evidence was found of saturation of the entire profile during the experiment, promoting a saturation excess process on the plot. A possible explanation for this is the rainfall distribution by the banana plant canopy, which is further explained in paragraph 2.3.
Next to the findings of Cattan et al. (2009) groundwater levels in banana plantations in the Atlantic Zone are kept low (700 to 1200 mm depth) by complex artificial drainage systems. Saturated overland flow is there for unlikely to occur, and Hortonian overland flow is expected to be the major runoff process.
2.1.3 Leaching The rainfall that reaches the soil and is not lost by surface runoff will infiltrate. When the infiltration capacity of the soil exceeds the rainfall intensity, the infiltration rate equals the rainfall intensity and there will be no surface runoff. When the rainfall intensity exceeds the infiltration capacity, surface runoff will occur and only a part of the fallen rain will infiltrate (Sevenhuysen and Maebe, 1995). The infiltration capacity depends on the soil type, Schosinsky (2006) states that texture has the most influence on infiltration amounts, and water content in the top layer of the soil.
The follow-up process of infiltration is the downward movement of the water from the soil water zone towards the groundwater. A part of this water will be taken up by the banana plant and transpire, a part stored in the soil (on the long term the amount of storage is equal to zero, and therefor ignored in this conceptual model) and a part will move towards the zone below the roots. When the water is beneath the root zone, the nutrients dissolved in the water are considered as lost, which is called leaching. The root zone is very shallow with about 40% of the root volume in the top 100 mm and 85% in the top 300 mm. The occasional primary root penetrates to below 600 mm (Draye et al. 2005, Araya 2003).

9
2.1.4 Evapotranspiration The total amount of evapotranspiration is divided by evaporation by soil, evaporation of intercepted water by the plant canopy and transpiration of the plant. It depends on existing atmospheric, soil and vegetation conditions. The actual rate of evapotranspiration in banana plantations is hard to determine. Carr (2009) stated that over the 40-50 years, many different methods have been used to determine the actual water use of the banana plant, including the water balance approach. In the tropics sap flow measurements suggest transpiration rates as low as 2-3 mm/d (Lu et al.,2002), water balance studies suggested actual evapotranspiration rates reaching 4-4.3 mm/d (Montenegro et al., 2008; Van Vosselen et al., 2005) and lysimeter studies indicated peak rates of transpiration rates as high as 8-10 mm/d (Meyer and Schoch, 1976). All the estimates made are subject to large errors and can be locally site specific due to, among other things, measurement methodology, plant density, and climate and farm management. Next to that, determinations of the water use in banana plantations are mostly made in irrigated systems, in which the exact water use is of greater importance.
Sevenhuysen and Maebe (1995), who analysed the drainage conditions in the Atlantic Zone of Costa Rica, used in their simulation of water table fluctuations fixed values for evapotranspiration: 3,5 mm/day for poorly drained soils and 3.1 mm/day for well-drained soils. Which both are in the same order of magnitude as evapotranspiration values stated above and equal to the average daily potential evapotranspiration. For the nutrient efficiency and balance calculation made in this study the evapotranspiration rate of 3.5 mm was used due to the poorly drained soils found in the study field (see chapter 3).
2.2 Nutrients 2.2.1 Fertilizer
In the Atlantic Zone of Costa Rica, nutrient management in commercial banana plantations is intensive and includes substantial applications of chemical fertilizers. The amount of fertilizers recommended can vary widely from 1500 to 2000 kg/ha/year of fertilizer, and may even reach up to three tons per hectare per year of fertilizers in bi-weekly applications (Gonçalves, 2014). These high quantities are required due to the naturally high nutrient demand of the banana plant, high production rates and the humid climatic conditions, which stimulates nutrient losses by hydrological processes (Robinson et al., 2010). The exact amounts and types of fertilizer applied are often available, and for this study Corbana provides the data.
2.2.2 Precipitation Next to the amount of nutrients in this model added by fertilizers, also the amount of nutrients in contributed by precipitation are concluded. Parker (1983) defines the latter as a function of the annual rainfall: 0.42 g nitrogen, 0.04 g phosphor and 1.35 g potassium per ha per mm of rainfall. With the high amounts of rainfall in the Atlantic Zone (on average 4000 mm/y) the amount of added nutrients can reach up to 1.68, 0.16 and 5.4 kg/ha of N, P and K respectively.
2.2.3 Harvested product Of the total of nutrients immobilized by the banana plant, one part returns to the soil through the harvest residues left on the soil surface, whereas the part that is removed by the fruit during the harvest must be replenished by fertilizers. The amount of nutrients removed by the fruit depends on the yield and the nutrient concentration of the fruit. Nutrient concentrations in the dry matter (20.4%) of bananas according to Costa Rican data (Stoorvogel et al., 2013) is 0.8, 0.1 and 2.07 % for N, P and K respectively. Corbana provides the yield data.
10
2.2.4 Nitrogen Oxide Emissions A part of the nitrogen from the applied fertilizers is lost by nitrogen oxide emissions. Veldkamp et al. (1997) measured N2O and NO fluxes from a fertilized banana plantation in the Atlantic Zone of Costa Rica, where 360 kg N/ha/y is applied. The percentages of applied fertilizer-N that are converted into nitrogen oxide are between 1.26 and 2.91% for N2O and between 5.09 and 5.66 % for NO depending on soil type; the sampled Andosol had greater emissions than the Inceptisol. This means a net loss of N-fertilizer between 23 and 31 kg/ha/y, considering a nitrogen fertilizer apply of 360 kg/ha/y. Because this study have been conducted on an Inceptisol, we assume 1.26 and 5.09% for N2O and NO respectively.
2.1.5 Losses by hydrological processes The amount of nutrients lost by surface runoff and leaching depends on the amount of nutrients dissolved in this water. This amount depends on the amounts of nutrients and water available at a certain time or place, which depends on the water and nutrients fluxes described above. Several studies have been conducted in rain fed banana plantations;
− Rosales (1992) collected water samples of the drainage water on a banana plantation located at the experimental station of ‘Los Diamantes’ in Guapiles (Atlantic Zone of Costa Rica), and found nutrient concentrations of on average 3.35 and 0.9 mg/L for K and N respectively.
− Sansoulet et al. (2007) did a field experiments in order to study nitrate and potassium transport in an andosol under a banana plantation in Guadeloupe, and found average K concentrations of 5.02 and 8.18 mg/L in runoff and leaching water, and N concentrations of 0.89 and 2.11 mg/L..
− De La Cruz et al. (2001) studied the effect of weed on the amount of nutrients in the soil and the soil solution in a banana plantation in the Atlantic Zone of Costa Rica. Average amounts of nutrients on 90 cm depth found where ± 5.5 and 4 mg/L for K, and N respectively.
− Aryal et al. (2012) monitored nitrogen and phosphorus concentrations from shallow wells (3-5 m depth) and primary drains in commercial banana plantations in a humid region of South East Mexico (3862 mm mean annual rainfall). A median total N concentration of 4 mg/L (ranging from 0 to 30 mg/L) and a median P concentration of 0.15 mg/L (ranging from 0 to 0.3 mg/L) were found in the primary drainage channels. The concentrations of N and P in the shallow wells had median value of 6 and 0.10 mg/L respectively.
2.3 Unique processes for banana plantation The processes described in the conceptual model above, are in banana plantations further affected by two other unique characteristics caused by plantation management practices and plant properties:
1. A common practice in banana plantations is to leave plant residues on the soil surface after harvest and during deleafing and desuckering (removing unwanted side shoots). In this way, nutrients from the plant residues are recycled, but this can also reduce soil erosion, slow down water runoff, and prevent surface sealing. Conservation tillage systems have often, but not always, increased infiltration and reduced runoff (Baker, 1987). Cattan et al. (2006) found in a banana plantation in the French West Indies that a dead plant cover reduces runoff rates by increasing water residence times in a field, since the crop residue hinders water movements, slowing down flow, creating retention zones and obstructing existing water pathways. This management practice therefor has to be taken into account;

11
2. The redistribution of rainfall by the banana plant is considerable because of the impluvium shape of their canopy (Bussiere, 1995), and it was found that his effect has two major influences on the conceptual model: − Due to the redistribution of rainfall, local rainfall intensities could exceed the soil
infiltration capacity, which favours surface runoff. According to a study of Cattan et al. (2007b), the main pathway for redistributed rainfall was stem flow (18-26% of the total rainfall) which caused rainfall intensities of 20- to 28-fold higher at the plant collar than the actual rainfall rate. Next to that, also through fall caused dripping points the middle of the inter row, providing locally high rainfall intensities up to five-fold higher that the incident rainfall. In 2009, Cattan et al. evidenced that rainfall distribution is an important factor in the runoff process in two ways. First, it was shown that the stem flow and the dripping contributed to the local saturation of top soil, and then to water pathways. Second, indirectly by analysing the infiltration rates. The same study suggests stem flow influences runoff mainly for small rainfall event or at the beginning of rainfall events, on the other hand Ruy et al. (2005) concludes that stem flow has no significant effect on runoff during moderate rainfall events (< 30 mm);
− The redistribution also enhances percolation fluxes in the soil (Cattan et al., 2007b; Sansoulet et al., 2007) and with that, fast leaching of nutrients occurred under the banana stem. Sansoulet et al. (2007) studied nitrate and potassium transport in an Andosol in a banana planation in the French West Indies and found that nitrate and potassium leaching under the banana stems were, respectively, 5 and 10 times greater than in the inter-row position (with uniformly spread fertilizer). Next to that, fertilizers are mostly applied at the base of banana plants, which will enhance the leaching rates due to the described hydrological behaviour of banana canopies.
The effects by rainfall distribution therefore has to be taken into account.
2.4 Nutrient Balance An average estimation of the expected nutrient concentration in the surplus water (precipitation minus evapotranspiration) was made using the water- and nutrient balance method described in the conceptual model. In the calculation an average evapotranspiration rate of 3,5 mm/day was used equally to Sevenhuyse and Maebe (1995). The nitrogen oxide emissions rates, nutrients brought by precipitation and the percentage of N, P and K in the harvested product used in the calculation are described in the previous paragraph. In the calculation, it is assumed that concentrations in the runoff and leaching water are the same, which is according to our results and that of Sansoulet et al. (2006) and Aryal et al. (2012) not the case; however, they are of the same magnitude. Next to that, we neglect the fact that runoff is generated from direct precipitation (without evapotranspiration). The database with 10-year (2005-2015) of data covering the amount harvested product, applied fertilizers and precipitation data of the San Pablo plantation over the years is used as input. Corbana supplied this data and the results of the balance calculation are shown below:
Table 1 - Nutrient concentrations in surplus water and nutrient efficiencies based on 10-year-average data for precipitation, harvested product and fertilizer supply.
The calculated nutrient concentrations are compared with the nutrient concentrations of the water samples taken in the field in chapter 4.
Nutrient K P Concentration (mg/l) 13.9 0.81Efficiency (%) 40% 35%

12
3. Materials and Methods 3.1 Study area The field experiment was conducted in the 254 hectares commercial banana plantation “Finca San Pablo” in the Atlantic Zone of Costa Rica (10°06'40.1"N 83°22'53.3"W). This specific plantation is chosen because the plantation is owned by Corbana, and therefor available for research purposes. Next to that, the required data (amount of harvest products, soil data etc.) for this study is freely accessible via Corbana. The plantation has a continues banana production throughout the year and exported in 2015 48,560 kg/ha (CORBANA, 2016). The banana plant is a Musa species of the family of Musaceae and is the largest herbaceous flowering plant. Bananas grow in a wide variety of soils; as long as the soil is at least 60 cm deep, has a good drainage and is not compacted. The minimum amount of water needed for good growth is 2000-2500 mm/year (Samson, 1980).
The Atlantic Zone of Costa Rica has a humid tropical climate and is characterized by an average rainfall of 4000 mm per year. The “dry” months February, March and September still have averages of 200 mm each. In the wet months, July and November, the rainfall exceeds 400 mm. The rainfall has a high temporarily variability and high rainfall intensities occur. Vahrson (1990) calculated for a number of weather stations in the Atlantic Zone of Costa Rica rainfall intensities with a return period of ten years, ranging from 226 mm/h for events lasting 5 minutes and 82 mm/h for events lasting 60 minutes. Climate data used in this study is obtained from the by CORBANA managed meteorological station 28 Millas, which is located next to the plantation and ± one kilometre from the study fields.
Figure 2 Hydrological system of the banana plantation. In the figure on the left two secondary channels are shown, which drain into the primary channel (not visible). The tertiary channels discharge on the secondary channels. The red square represents one the study fields, and the figure on the right.
The climatic conditions in the Atlantic Zone of Costa Rica make that water deficits are rare and that there is no need for irrigation. On the contrary, efficient drainage systems are required to remove excess water that accumulates in the root zone. This dense drainage network consists of primary, secondary and tertiary channels and is illustrated in Figure 2. The tertiary channels drain on the secondary channels, the secondary channels on the primary channels, and the primary channels drain on the adjacent river. All the channels are free draining. Most of the times the tertiary channels (with a depth of 1.6 to 2 m at the outlet) run dry; only during and just after rainfall events these channels contain water.
13
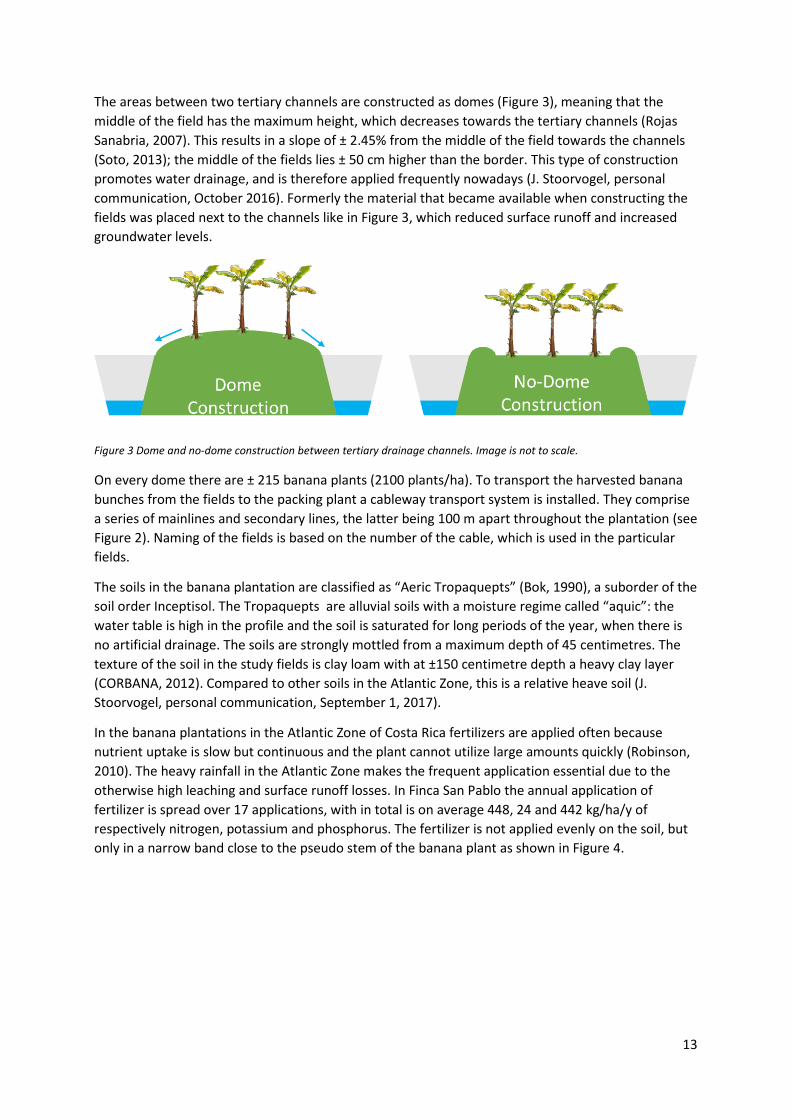
The areas between two tertiary channels are constructed as domes (Figure 3), meaning that the middle of the field has the maximum height, which decreases towards the tertiary channels (Rojas Sanabria, 2007). This results in a slope of ± 2.45% from the middle of the field towards the channels (Soto, 2013); the middle of the fields lies ± 50 cm higher than the border. This type of construction promotes water drainage, and is therefore applied frequently nowadays (J. Stoorvogel, personal communication, October 2016). Formerly the material that became available when constructing the fields was placed next to the channels like in Figure 3, which reduced surface runoff and increased groundwater levels.
Figure 3 Dome and no-dome construction between tertiary drainage channels. Image is not to scale.
On every dome there are ± 215 banana plants (2100 plants/ha). To transport the harvested banana bunches from the fields to the packing plant a cableway transport system is installed. They comprise a series of mainlines and secondary lines, the latter being 100 m apart throughout the plantation (see Figure 2). Naming of the fields is based on the number of the cable, which is used in the particular fields.
The soils in the banana plantation are classified as “Aeric Tropaquepts” (Bok, 1990), a suborder of the soil order Inceptisol. The Tropaquepts are alluvial soils with a moisture regime called “aquic”: the water table is high in the profile and the soil is saturated for long periods of the year, when there is no artificial drainage. The soils are strongly mottled from a maximum depth of 45 centimetres. The texture of the soil in the study fields is clay loam with at ±150 centimetre depth a heavy clay layer (CORBANA, 2012). Compared to other soils in the Atlantic Zone, this is a relative heave soil (J. Stoorvogel, personal communication, September 1, 2017).
In the banana plantations in the Atlantic Zone of Costa Rica fertilizers are applied often because nutrient uptake is slow but continuous and the plant cannot utilize large amounts quickly (Robinson, 2010). The heavy rainfall in the Atlantic Zone makes the frequent application essential due to the otherwise high leaching and surface runoff losses. In Finca San Pablo the annual application of fertilizer is spread over 17 applications, with in total is on average 448, 24 and 442 kg/ha/y of respectively nitrogen, potassium and phosphorus. The fertilizer is not applied evenly on the soil, but only in a narrow band close to the pseudo stem of the banana plant as shown in Figure 4.
14
Figure 4 Fertilizers are only applied in a narrow band close to the pseudo stem (Haifa-Group).
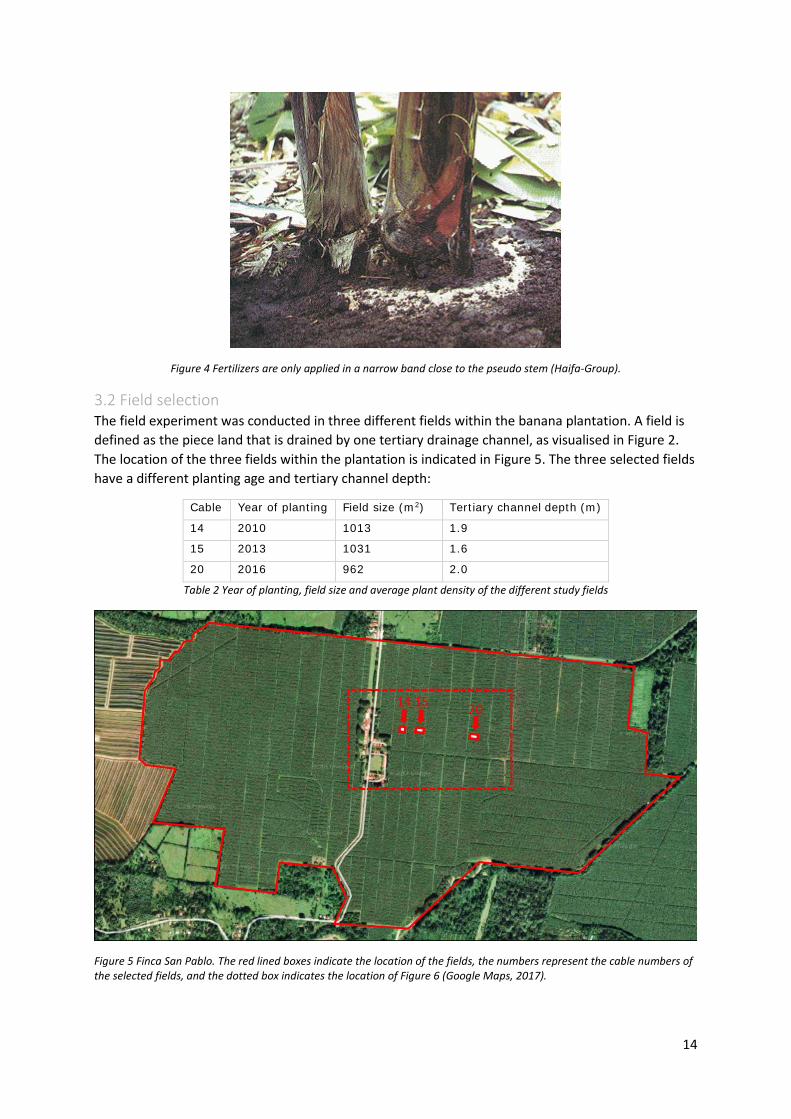
3.2 Field selection The field experiment was conducted in three different fields within the banana plantation. A field is defined as the piece land that is drained by one tertiary drainage channel, as visualised in Figure 2. The location of the three fields within the plantation is indicated in Figure 5. The three selected fields have a different planting age and tertiary channel depth:
Cable Year of planting Field size (m2) Tertiary channel depth (m)
14 2010 1013 1.9
15 2013 1031 1.6
20 2016 962 2.0
Table 2 Year of planting, field size and average plant density of the different study fields
Figure 5 Finca San Pablo. The red lined boxes indicate the location of the fields, the numbers represent the cable numbers of the selected fields, and the dotted box indicates the location of Figure 6 (Google Maps, 2017).

15
All three fields are planted with the same cultivar “Grand Naine” and roughly the same plant density of 2100 plants/ha. The selected fields for the experiment are classified in class 2 (Figure 6) according to the classification system by Jaramillo and Vázquez (1990) to determine suitability of land for banana cultivation. Class 2 means that the lands are suitable for cultivation but there are some limitations. In our case this is because of the slightly heavy soils, consisting of clay loam and heavy clay in the deeper layers below <150 cm (CORBANA, 2012), which negatively effects the drain ability of the soils.
Figure 6 Map of soil classes in which the blue colour is soil class 2. The black lines represent the cable transport system. The tertiary channels are not shown in this map. The dotted box indicates the location of the study fields. The numbers represent locations of soil boring conducted by Corbana (2012).
3.3 Hydrological measurements To gain insight in the described hydrological system of a field in the banana plantation a weir was placed at the outflow of tertiary channels in to the secondary channels (Figure 7Figure 6Figure 2). The location of the weir is visualised in Figure 2. Water level loggers were placed in front of the weirs on February the 10th 2017 and removed on March the 27th 2017. The channels in field 14 and 20 contained water when the water loggers were placed, the channel in field 15 did not. For barometric compensation, a barometer was installed in field 14. The total period of measurements is forty-six days with a time interval of three minutes. This particular interval was chosen because it was the smallest time interval without limiting the data storage of the diver. The data from the water level loggers was converted to water levels with the use of the barometric data.

16
Figure 7 A placed weir in the tertiary channel in one of the fields. In the metal tube, a water level logger is placed.
In the normal situation, without weirs, the collected water would immediately discharge into the secondary channels, when water levels in the secondary channels are low enough, but during the field study stagnated behind the weirs, which made it possible to measure water levels. Only when the crest level of the weirs was reached the tertiary channel was able to discharge on to the secondary channel. When the water level did not reach the crest level, the stagnated water infiltrated.
Next to the weirs, one piezometer per field was placed to monitor the groundwater fluctuations in the system. Groundwater levels where manually measured using a tapeline with irregular intervals. The location of the piezometers was approximately on 30 meters from the primary channel and 4 meter from the tertiary channel. This location was chosen because we assumed that it would result in the average groundwater level over the field.
3.4 Water sampling Water samples of 250 ml from the secondary channel and tertiary channel were taken irregular, and could only be taken when sufficient water was available. From the tertiary and secondary channel, respectively 20 and 14 samples were taken (see Table 3).
Per field, four lysimeters were placed with the aim to sample soil moisture. One set of two lysimeters (120 cm and 60 cm depth) were placed in the fertilizer band around the foot of the pseudo stem. The other set of two lysimeters (120 cm and 60 cm depth) were placed between two rows of banana plants. The two different positions were chosen to account of the heterogeneity in the rainfall distribution in the banana plantation, spatial variations in soil infiltrations due to agricultural practices (tillage, planting techniques, etc.) and the heterogeneity in the distribution of fertilizer application (Sansoulet et al. 2008; Cattan, 2006). Samples from the lysimeters were taken irregular. The total amount of samples taken can be found in Table 3.

17
Amount of samples taken
Field Secondary Tertiary Lysimeters 14 8 13 7 15 1 2 15
Table 3 Amount of water samples taken during the field study
The water samples were analysed the laboratory of CORBANA on the following characteristic and chemical elements:
• pH and conductivity (CE) with direct measuring methods; • Nitrogen (N) analysed with combustion in Elementar Rapid N analyser; • Calcium (Ca), magnesium (Mg), potassium (K), phosphor (P), sulfur (S), boron (B), iron (Fe),
copper (Cu), zinc (Zn), manganese (Mn), and aluminium (Al) were directly measured in ICP/OES Optima 7300 DV;
3.5 Analyses Water levels
The raw data from the water loggers in the tertiary channels was converted to water levels with the use of the barometric data. The water levels contained an inexplicable daily fluctuation over time. The fluctuation has a 24-hour repetition time, and is for all three water levels different. In field 14, 15 and 20 the average size of the water level fluctuation is 3.2, 10.3 and 8.9 centimetre respectively and sort of reversed in field 15 compared to field 14 and 20. Next to the fluctuation, the exact heights of the water levels are not trustworthy because the water loggers were not calibrated and a slight uplift of the water levels over time is visible. Notice the difference in Figure 10 between the average water levels in the channels in the dry period in February and the average water levels in the dry period of March. The channels in field 15 and 20 both did not contain water in these periods but the water levels still differ. This difference of water level over time would also imply that the water levels in the channel in field 14 would discharge implausible more water in March than it did in the beginning of February. Based on the above-mentioned errors in the water level data, the water levels are analysed based on the relative difference in water level over time during and after rainfall events.
Discharge
In order to calculate the discharge of the tertiary channels over the weirs in to the secondary channels, it was initially planned to produce a relation between in situ measured discharge and the water levels by the water loggers at that same moment. However, due to the lack of rainfall and irregular field visits only two discharge measurements in field 14 could be made. Instead of the Q-h relations, the Kindsvater-Shen equation for V-Notch weirs was used to calculate the discharge based on the water level above the crest and the notch angle of the weir (USBR, 1997). The equation is written as:
𝑄𝑄 = 4.28 𝐶𝐶𝑒𝑒 tan �𝜃𝜃2� (ℎ𝑡𝑡 + 𝑘𝑘ℎ)
52
Where:
- Q = Discharge over the weir (m3/s) - Ce = Effective discharge coefficient - ht = Head on the weir at a certain time (t) (m) - kh = Head correction factor, is a function of the angle - 𝜃𝜃 = Angle of the V-notch

18
The head correction factor (kh) and effective discharge coefficient (Ce) are both depended on the angle of the weir, and are calculated using equations from LMNO Engineering (2014). They are respectively 0.576 and 0.003. Because the Kindsvater-Shen equation is originally not intended for this type of construction and because the water levels are uncertain, the use of this equation is only an indication of the possible discharge.
Runoff Coefficient
The runoff coefficient is the percentage of the rainfall that is removed by surface runoff. The latter is based on the amount of rain collected from the fields by the drainage channels, which is calculated with the use of the relative increase in water level after a rainfall event and the channel dimensions. The rainfall which falls directly into the drainage channel is subtracted from the calculated amount of rainfall collected by the channels by surface runoff. The equation used for calculating the surface runoff coefficient:
𝑅𝑅𝐶𝐶 =(∆ℎ − 𝑃𝑃𝑑𝑑) ∗ 𝑊𝑊 ∗ 𝐿𝐿 ∗ 𝐴𝐴−1
𝑃𝑃
Where:
- RC = Runoff Coefficient (%) - ∆ℎ = Change in water level (mm) - 𝑃𝑃𝑑𝑑 = Precipitation which falls directly in the channel (mm) - W = Width channel (mm) - L = Length channel (mm) - A = Surface study field (mm3) - P = Precipitation during event (mm)

19
4. Results This chapter gives the results of the hydrological measurements, and the nutrient concentrations of the water sampled from the tertiary channel and lysimeters.
4.1 Hydrologic system This paragraph aims to give insight in the hydrologic functioning of a banana plantation, and covers the components illustrated in Figure 8.
Figure 8 Hydrological components covered in this paragraph; 1) rainfall, 2) water levels in tertiary drainage channel, 3) groundwater levels, 4) discharge of the tertiary channel into the secondary channel, and 5) surface runoff coefficients. The figure is not to scale.
4.1.1 Rainfall In total 232 mm of rainfall fell during the field study (9-2-2017 until 27-3-2017). The initial conditions of the fields, based on the climatic data from January and December, were normal for the time of the year. February was dry with only 115 mm of rainfall (compared to the average amount of 220 mm fallen in this month in 2005-2015), the month March was normal with 198 mm. The rainfall during the field study is shown in Figure 9. The study period includes a significant drier period in February. This period lasted from the last rainfall event on 10-02-2017 to 2-3-2017 and covers a period of twenty days. After this period, several rainfall events occurred within total 108 mm of rainfall in seven days. The following 10 days were again quite dry and after that, two precipitation events took place with in total 66.5 of rainfall in three days.

20
Figure 9 Precipitation (mm/h) and cumulative precipitation events (mm) during the field experiment
The maximum intensity of rainfall measured was 56.4 mm/h for events lasting 5 minutes and 10 mm/h for events lasting 60 minutes. Compared to the data of Vahrson (1990), who calculated for a number of weather stations in the Atlantic Zone, rainfall intensities with a return period of ten years, these rainfall intensities are very low. Vahrson (1990) found that in Batán (five kilometres from the fields) the intensities ranged from 224 mm/h for events lasting 5 minutes and 82 mm/h for events lasting 60 minutes.
4.1.2 Water levels in the tertiary channels The water levels in the tertiary drainage channels in the three fields are shown in Figure 10.

21
Figure 10 Water levels (cm) in the tertiary channels of the different fields and cumulative rainfall events (mm) during the field study. For the water levels a moving average window is used of minus twelve hours and plus twelve hours. The red box indicates the period of Figure 11.
In general, the channels all respond differently on rainfall. An example of a response in water level in the different fields after a rainfall event is given in Figure 11 and a general description per field is given below:
− The tertiary channel of field 14 was most of the times filled with water and is the only channel where we witnessed discharge over the weir. The channel contained and discharged water most of the time, but does dries up during the beginning of March after the dry period in February. The water levels responded fast (<15 min) on rainfall events, but the relative differences in water levels are small, except when the channel fills up in the beginning of March, due to the fact that the water level is constantly at crest level and the water is able to discharge over the weir. Due to the long periods of discharge into the secondary channel, it is assumed that in this field a groundwater flow towards the drain was present. Based on the fast response of the water level on rainfall events, it is assumed that during and just after rainfall events the channels also discharges surface runoff water;
− The tertiary channel of field 15 responded fast on rainfall events, on average within 45 minutes. After this fast response and reaching the maximum water level for a given rainfall, event the water levels immediately start to lower. The three times the channel dried up it was within a day. The water levels responded 13 times on rainfall events, with on average a net rise of 8.75 cm. Discharge over the weir was never witnessed in the channel, however some highly temporarily peaks (duration of maximum 2 hours) in the water levels could have been discharged. Based on the rapid response on rainfall events and the short dry up time of this channel it is assumed that the water collected originates just from surface runoff;

22
− The tertiary channel of field 20 responded the quickest on rainfall events, on average within 16 minutes, of which sometimes it even responded immediately. After this fast response and reaching the maximum water level for a given rainfall event, the water levels start to lower. The two times the channel dried up it was within five days, which indicates that not only surface runoff is collected. The water levels responded 14 times on rainfall events, with on average a net rise of 6.25 cm. Discharge over the weir was never witnessed in the channel, however some highly temporarily peaks (duration of maximum 2 hours) in the water levels could have been discharged. Based on the rapid response on rainfall events of this channel it is assumed that the water collected originates from surface runoff. However, the channel probably also collected a small amount of groundwater, due to the long dry up time in comparison to the dry up time of the channel in field 15;
Figure 11 Water level response of the tertiary channels on rainfall events. It is well visible that water levels in field 14 are relatively constant, while water levels in field 15 and 20 have a high and fast response, which are followed by an immediate lowering of the water level.
4.1.3 Groundwater levels The groundwater levels follow a similar pattern in all three fields (see Figure 12). The groundwater levels decrease in the drier periods, and are supplemented after rainfall events. During the dry period in February the groundwater levels became so deep that it was not possible to measure them (the placed piezometers were not deep enough).
Field 14 has on average the highest groundwater levels, the groundwater levels in field 20 were on average the deepest. Compared to groundwater levels with a maximum depth of 1.2 meters found by Bok (1990) and the first groundwater measurements in January, which was during a period with a normal amount of rainfall (not dry, not wet), the groundwater levels during the field study were low.

23
Figure 12 Groundwater levels (m) below surface. The red dots indicate that the groundwater levels were below the maximum depth of the piezometers.
- Groundwater levels in field 15 were during the field study below the drainage channel depth of 1.6 meter, and is most likely the reason why this channel dried up within a day, did not had a groundwater flow and only collected surface runoff (left situation in Figure 13).
- The greater depth of the channel in field 20 (2 meter) could explain the longer dry up time of the channel (five days versus one day in field 15). Groundwater levels in field 20 were after rainfall above the channel depth, which caused short periods of groundwater flow towards the channel (right situation in Figure 13). However, the groundwater levels probably reached a depth greater than 2 meters in drier periods, which made the channel dry up (left situation in Figure 13).
- The reason that the channel in field 14 did had a constant flow was because the groundwater levels were most of the time above the channel depth (1.9 meter). An exception is the small period in the beginning of March, which explains why during this period the channel did not contain water (Figure 10). The cause of the difference in groundwater level between field 20 and 14 was not found in soil or field characteristics (like field size or plant density).
Figure 13 Situation in field 15 (and 20 in dry periods) is represented by the left figure; the drainage channel collects only surface runoff. Situation in field 14 (and 20 during wet periods) is represented by the other figure: the drainage channel collects surface runoff and groundwater. During wetter periods with high ground water levels the situation in all fields would probably be like the right figure.
It is likely that during wetter periods with high ground water levels, the tertiary drainage channels in all the fields collect groundwater and more often contain and discharge water. This situation is represented by the right situation in Figure 13.
24
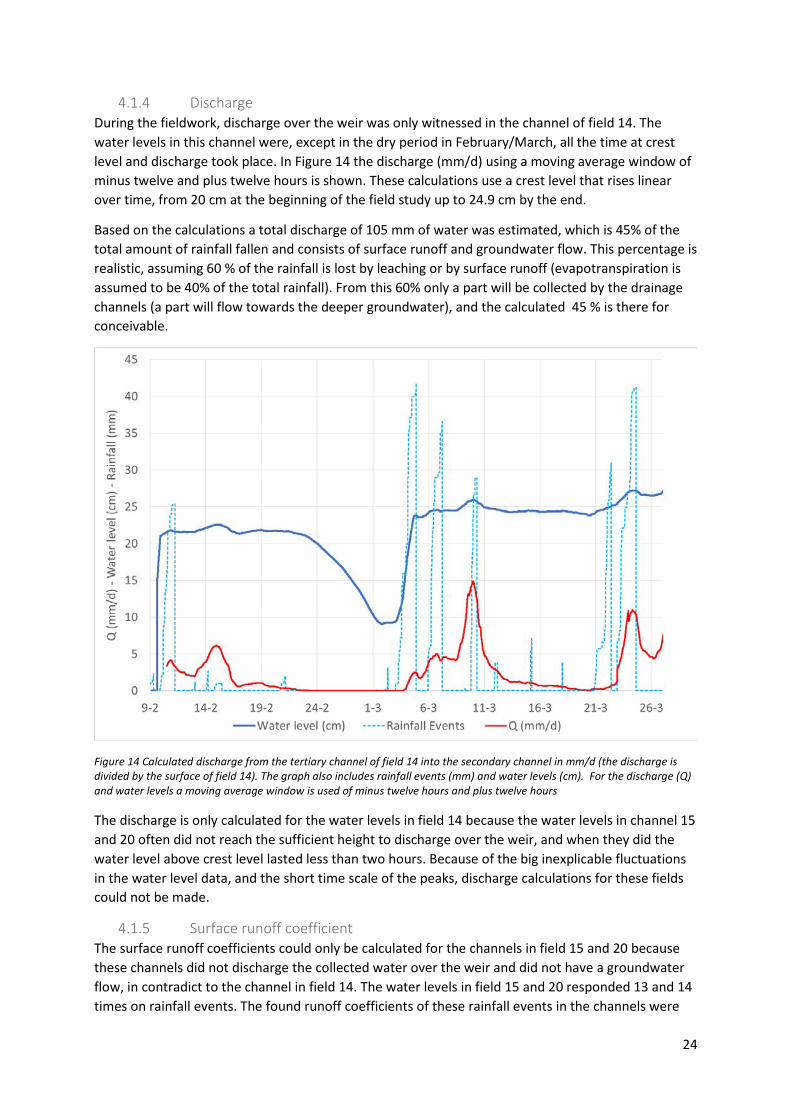
4.1.4 Discharge During the fieldwork, discharge over the weir was only witnessed in the channel of field 14. The water levels in this channel were, except in the dry period in February/March, all the time at crest level and discharge took place. In Figure 14 the discharge (mm/d) using a moving average window of minus twelve and plus twelve hours is shown. These calculations use a crest level that rises linear over time, from 20 cm at the beginning of the field study up to 24.9 cm by the end.
Based on the calculations a total discharge of 105 mm of water was estimated, which is 45% of the total amount of rainfall fallen and consists of surface runoff and groundwater flow. This percentage is realistic, assuming 60 % of the rainfall is lost by leaching or by surface runoff (evapotranspiration is assumed to be 40% of the total rainfall). From this 60% only a part will be collected by the drainage channels (a part will flow towards the deeper groundwater), and the calculated 45 % is there for conceivable.
Figure 14 Calculated discharge from the tertiary channel of field 14 into the secondary channel in mm/d (the discharge is divided by the surface of field 14). The graph also includes rainfall events (mm) and water levels (cm). For the discharge (Q) and water levels a moving average window is used of minus twelve hours and plus twelve hours
The discharge is only calculated for the water levels in field 14 because the water levels in channel 15 and 20 often did not reach the sufficient height to discharge over the weir, and when they did the water level above crest level lasted less than two hours. Because of the big inexplicable fluctuations in the water level data, and the short time scale of the peaks, discharge calculations for these fields could not be made.
4.1.5 Surface runoff coefficient The surface runoff coefficients could only be calculated for the channels in field 15 and 20 because these channels did not discharge the collected water over the weir and did not have a groundwater flow, in contradict to the channel in field 14. The water levels in field 15 and 20 responded 13 and 14 times on rainfall events. The found runoff coefficients of these rainfall events in the channels were
25
on average 32 and 19% (for field 15 and 20 respectively). These percentages are in the same range as runoff coefficients per event found in literature; Ruy et al. (2005) found runoff coefficients ranging from 8 to 42% and Cattan et al. (2006) found a mean runoff coefficient of 8% (with a standard deviation of 7%) and maximum of 30%. However, because of the high spatial variability of rainfall in the Atlantic Zone, the actual rainfall intensities and amount in the fields could be under- or overestimated compared to the data from the meteorological station (1 kilometre from the fields). This makes the resulting surface runoff coefficients unreliable. The inability to find an explanation (for example high rainfall intensities) why the water in the channels responded on certain rainfall event and not on other rainfall events confirms the unreliability of the found surface runoff coefficients.
4.2 Nutrient concentrations in drainage channels and soil water This paragraph aims to give insight in the nutrient distribution by the hydrologic functioning of the banana plantation, and covers the nutrient concentrations found in tertiary and secondary drainage channels as well as in the soil moisture.
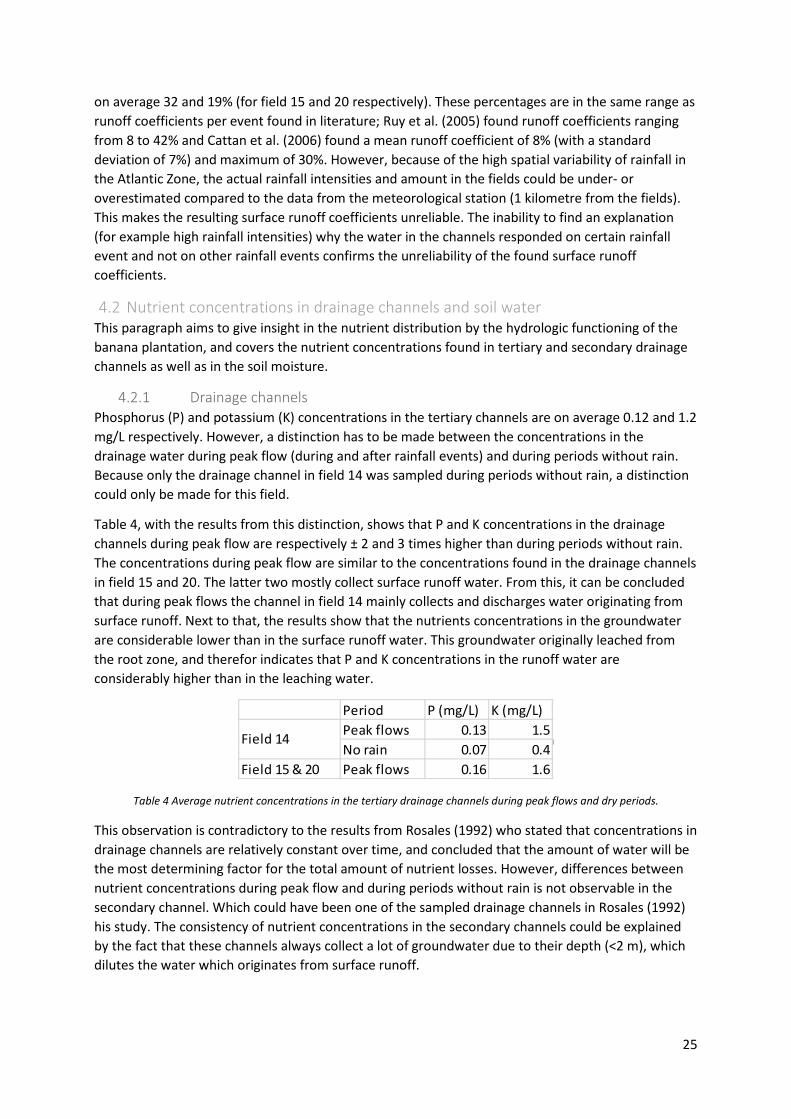
4.2.1 Drainage channels Phosphorus (P) and potassium (K) concentrations in the tertiary channels are on average 0.12 and 1.2 mg/L respectively. However, a distinction has to be made between the concentrations in the drainage water during peak flow (during and after rainfall events) and during periods without rain. Because only the drainage channel in field 14 was sampled during periods without rain, a distinction could only be made for this field.
Table 4, with the results from this distinction, shows that P and K concentrations in the drainage channels during peak flow are respectively ± 2 and 3 times higher than during periods without rain. The concentrations during peak flow are similar to the concentrations found in the drainage channels in field 15 and 20. The latter two mostly collect surface runoff water. From this, it can be concluded that during peak flows the channel in field 14 mainly collects and discharges water originating from surface runoff. Next to that, the results show that the nutrients concentrations in the groundwater are considerable lower than in the surface runoff water. This groundwater originally leached from the root zone, and therefor indicates that P and K concentrations in the runoff water are considerably higher than in the leaching water.
Table 4 Average nutrient concentrations in the tertiary drainage channels during peak flows and dry periods.
This observation is contradictory to the results from Rosales (1992) who stated that concentrations in drainage channels are relatively constant over time, and concluded that the amount of water will be the most determining factor for the total amount of nutrient losses. However, differences between nutrient concentrations during peak flow and during periods without rain is not observable in the secondary channel. Which could have been one of the sampled drainage channels in Rosales (1992) his study. The consistency of nutrient concentrations in the secondary channels could be explained by the fact that these channels always collect a lot of groundwater due to their depth (<2 m), which dilutes the water which originates from surface runoff.
Period P (mg/L) K (mg/L) Peak flows 0.13 1.5No rain 0.07 0.4
Field 15 & 20 Peak flows 0.16 1.6
Field 14

26
4.2.2 Soil moisture The average nutrient concentrations found in the water samples taken from soil moisture are shown in Table 5. Although standard deviations are high, the results show that in the band in which the fertilizers are applied the nutrient concentrations are highest. Next to that, increasing depth gives a decrease in nutrient concentrations, which is as expected due to the uptake of nutrients by the plants. This uptake is for K so strong that the nutrient concentrations at 120 cm depth in the inter row and band position are nearly the same. For P this effect is not significant.
Table 5 – Average nutrient concentrations from lysimeters at different positions and depth. The number between the brackets represents the standard variation.
Concentrations in the inter-row position on 120-centimetre depth are for all nutrients the lowest of all, which in compromise with the study of Sansoulet et al. (2006) who concluded that potassium and nitrate leaching under stems is respectively 10 and 5 times greater than in the inter-row positions.
In the inter row a small decrease of nutrient concentrations from the shallow lysimeters towards the deep lysimeters is found. Beneath the fertilizer band, the decrease of nutrient concentrations from the shallow towards the deep lysimeters is much higher. This means that the plants take up the nutrients, and the concentrations of nutrients in the leaching water are low.
4.3 Nutrient efficiency The nutrient concentrations calculated by the nutrient balance in chapter two are overrated (factor 8 for K and 6 for P) compared to the found nutrient concentrations. With the found nutrient concentrations in the soil and runoff water an indication of the nutrient efficiency is made by using a simplified calculation. For this we used a database with 10-year (2005-2015) of data covering the amount harvested product, applied fertilizers and precipitation data of the San Pablo plantation over the years. Corbana supplied this data and the results of the calculation are shown below:
Table 6 - Percentage of nutrient lost. Nutrient and water surplus are based on the nutrient and water balance method described in paragraph 4.4.
When assuming that the found average nutrient concentrations can be extrapolated over time, it is found that 7 and 11% of K and P respectively are lost by leaching and surface runoff. The actual nutrient losses are much higher (65 and 60% for P and K), so a lot more nutrients should be lost by hydrological processes. However, with the found nutrient concentrations, in the drainage channels
Depth Band Inter rowP (mg/L) 60 0.17 (0.24) 0.08 (0.09)
120 0.15 (0.13) 0.07 (0.05)K (mg/L) 60 4.3 (1.9) 0.8 (0.2)
120 0.8 (0.4) 0.5 (0.5)
K (mg/L) P (mg/L)Average concentration (mg/L) 1.5 0.14Annual Water Surplus (L/ha/y) 19515000 19515000Nutrients lost (Avg. Conc/Water Surplus; kg/ha/y) 29 3Applied fertlizer (kg/ha/y) 442 24Nutrient loss 7% 11%Rosales, 1992Sansoulet et al., 2007 32% -
20-30% of the nutrients in general

27
and soil moisture, and water availability these losses could not be reached; the estimated losses are with an order of four to eight times smaller than the actual loss. Water availability cannot compensate for such a difference (the amount of rainfall is a fixed value), so to reach this loss the nutrient concentrations have to be 8 and 2.5 times higher for K and P respectively: such kind of nutrient concentrations have not been sampled. Other studies did measured higher amounts of nutrients in the soil and runoff water, like Rosales (1992) with maximum concentrations of 8.56 mg/L of potassium in drainage channels and Sansoulet et al. (2007) with concentrations of 8.18 mg K/L for leached water. A realistic estimation of the amount of nutrient lost by leaching and surface runoff could not be made with the found data during the field study.

28
5. Discussion Based on the hydrological measurements, the tertiary channels collect solitary surface runoff water when the groundwater levels are beneath the bottom of the tertiary channels. When groundwater levels are higher (which is normal in the Atlantic Zone), the channels do collect groundwater. This observation is confirmed by the difference between nutrient concentrations found in the channels during rainfall and during dry periods. During dry periods, the nutrient concentrations in the channel are of the same order of magnitude as the nutrient concentrations found in the deep soil water (120 cm). This deep soil water is leached towards the groundwater, and due to the abundance of roots below 120 cm, the nutrient concentrations in the groundwater are assumed to be roughly the same as the deep soil water concentrations. From this, it can be concluded that the water collected by the channels in dry periods originates from groundwater. The nutrient concentrations in the channels during periods with rain, when predominantly surface runoff water is collected, are far higher.
The water levels in the tertiary channels responded fast on rainfall events (<15 min), and there for all three collected surface runoff. Based on the relative water level increase in the tertiary channels after rainfall events, an average runoff coefficient of 26% has been found. Assuming that the water lost by runoff and leaching is 60% of the total rainfall, the distribution between water loss by surface runoff and leaching is almost 50/50. However, the nutrient concentrations found in surface runoff water are with a factor 2 and 3 (for P and K respectively) higher than the nutrient concentrations found in leaching water (most of the nutrients in the soil water are taken up by the roots). Together this would imply that nutrient losses by surface runoff are far (2 and 3 times for P and K respectively) higher than the nutrient losses by leaching. The nutrient distribution in the banana plantation, including this assumption, is visualised below:
Figure 15 Illustration of the nutrient distribution in the soil water under the fertilizer band and in the inter row. Nutrient concentrations found in leaching water are low, while nutrient concentrations found in surface runoff water are high. Figure not to scale (Illustration banana from www.promusa.org)

29
The nutrient losses by surface runoff are probably strengthened by the dome construction in the banana plantation, which may have caused more surface runoff generation (Figure 16), and with that an increase of nutrient losses, compared to plantations without dome construction. Nowadays, the construction of domes in replanted fields or new plantations is the standard, but whether this is better for the nutrient losses is based on the results of this study questionable. However, perhaps lowering the groundwater with dome construction (see Figure 16), and thus higher yields (Avilán et al., 1979), outweighs the cost of additional fertilizers due to an increase of nutrient losses. Nonetheless, no research have been conducted which compares nutrient losses or hydrological functioning of fields with dome and no-dome construction and their yields. Based on the findings of this study more research is there for recommended.
Figure 16 Dome (left), with high surface runoff, and no-dome construction, with high groundwater levels. Illustration not to scale.
The rainfall distribution by the canopy of the banana plant results in stem flow, which causes rainfall intensities at the plant base to be 20- to 28- fold higher than the actual rainfall rate. These locally high rainfall intensities enhance surface runoff at the plant base, which is the place were fertilizers are applied. The high rainfall intensities and the high nutrients amounts at the plant base together most likely result in high nutrient losses, which is illustrated in Figure 17.
Figure 17 Stem flow at the plant base; the location were fertilizers are aplied.
The application of fertilizers at the plant base is, considering the high surface runoff rates at this location, not favourable. However, in the soil around the plant base, most of the roots are positioned, and uptake of nutrients in this zone is therefor probably maximum. The results from the soil water samples taken during this study confirm that the nutrient uptake in this part of the soil is high. Maintaining this position for the fertilizer application is there for favourable, but

30
measurements, like incorporating the fertilizer in to the soil, are recommended to reduce nutrient losses by surface runoff.
Uncertainties The surface runoff coefficient is far from certain due to the unreliable water level data, high spatial variability of rainfall in the Atlantic Zone of Costa Rica (rainfall data collected 1 km from the study fields), and heterogeneity in the ditch dimensions of the entire length of the ditch. To achieve more reliable runoff coefficient more research has to be conducted. Next to that, the heavy soils in the fields could have favoured surface runoff, and the low rainfall intensities could have reduced surface runoff. Research in other soils and climatic periods is there for recommended.
The average nutrient concentrations were used to calculate the nutrient efficiency of the banana plantation. This calculation showed that with the use of the found nutrient concentrations the nutrient efficiency was highly underestimated. This would imply that actual nutrient concentrations in the water have to be 8-10 times higher than the found ones. A reason for the fact that these concentrations have not been found could be that nutrient concentrations during the high peak flows, when most of the water is lost, are not measured. During this peaks the nutrient concentrations are likely to be much higher as according to several studies (Ceretta et al., 2010; Zong’an Liu et al., 2012; Goller et al., 2006). Next to that, high intensity rainfall events did not occur during the field study, which could be a reason that only low nutrient concentrations in the surface runoff water were found (Wang et al., 2013).
Recommendations The results indicate that most of the nutrients in the banana plantations are lost by surface runoff. In order to reduce these losses measures, which reduce surface runoff (like no-dome construction), or incorporate fertilizers into the soil, are recommended. Which actual measurements are possible and the most effective, have to be investigated.
The study is conducted in a relative dry period with low rainfall intensities and low groundwater levels, which effects the “normal” hydrological functioning of the fields. Higher rainfall intensities would probably cause higher amounts of surface runoff and affect the nutrient concentrations found in the surface runoff and leaching water. Next to that, higher groundwater levels results in more discharge via the tertiary channels and a field study during a wetter period with more intensive rainfall would be necessary to confirm whether the found results also imply in normal and wetter climatic situations.
During the field study, data from a meteorological station one kilometre from the fields was used as input of the analyses. Due to the high spatial variability of rainfall in the Atlantic Zone of Costa Rica the used data occasionally probably over- or underestimated the amount and intensity of the rainfall at the fields. In future studies a local rain gauge is there for recommended.
To give a more reliable picture of the nutrient concentrations in the drainage channels and in the soil moisture a higher sampling density, especially during peak flows, and longer study period is recommended.
31
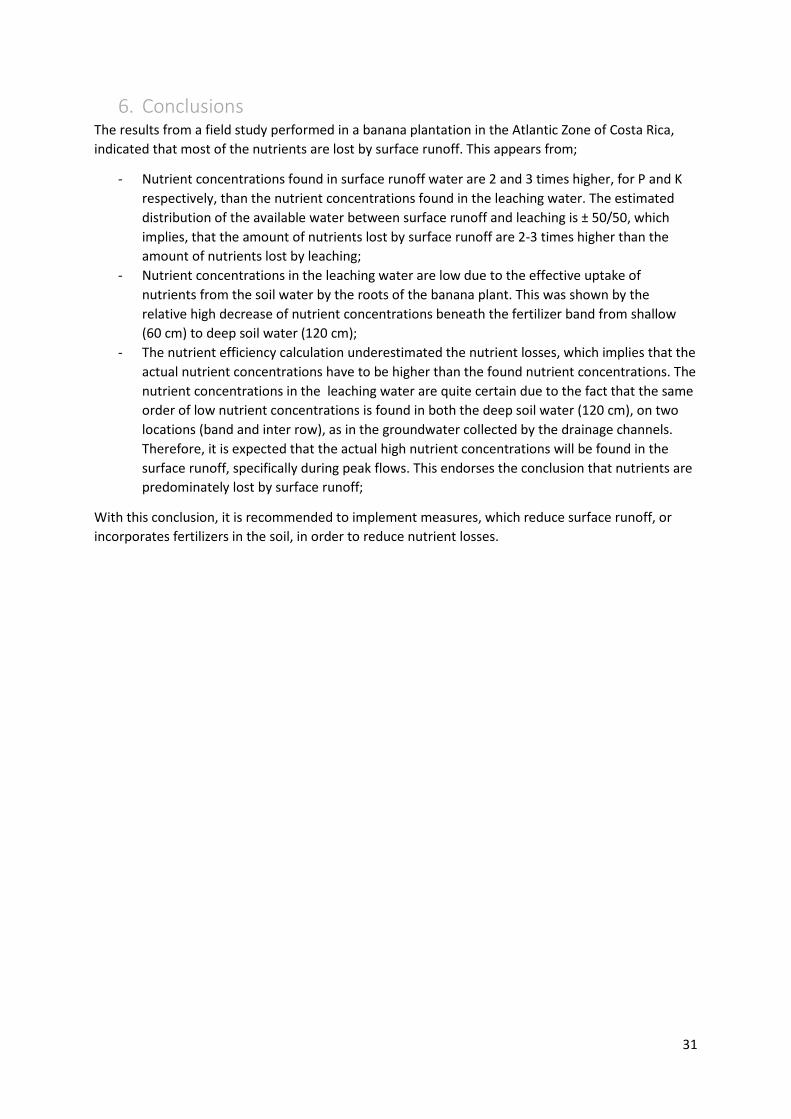
6. Conclusions The results from a field study performed in a banana plantation in the Atlantic Zone of Costa Rica, indicated that most of the nutrients are lost by surface runoff. This appears from;
- Nutrient concentrations found in surface runoff water are 2 and 3 times higher, for P and K respectively, than the nutrient concentrations found in the leaching water. The estimated distribution of the available water between surface runoff and leaching is ± 50/50, which implies, that the amount of nutrients lost by surface runoff are 2-3 times higher than the amount of nutrients lost by leaching;
- Nutrient concentrations in the leaching water are low due to the effective uptake of nutrients from the soil water by the roots of the banana plant. This was shown by the relative high decrease of nutrient concentrations beneath the fertilizer band from shallow (60 cm) to deep soil water (120 cm);
- The nutrient efficiency calculation underestimated the nutrient losses, which implies that the actual nutrient concentrations have to be higher than the found nutrient concentrations. The nutrient concentrations in the leaching water are quite certain due to the fact that the same order of low nutrient concentrations is found in both the deep soil water (120 cm), on two locations (band and inter row), as in the groundwater collected by the drainage channels. Therefore, it is expected that the actual high nutrient concentrations will be found in the surface runoff, specifically during peak flows. This endorses the conclusion that nutrients are predominately lost by surface runoff;
With this conclusion, it is recommended to implement measures, which reduce surface runoff, or incorporates fertilizers in the soil, in order to reduce nutrient losses.

32
References - Acón-Ho, Jorge, Luis Alpízar-Oses, and Rodolfo WingChing-Jones. "Percolación y lixiviación de
nutrimentos en suelos bananeros al este del río reventazón, Costa Rica." agronomía mesoamericana 24.2 (2013): 329-336.
- Araya, M. "Stratification and spatial distribution of the banana (Musa AAA, Cavendish subgroup, cvs' Valery'and'Grande naine') root system." Banana root system: towards a better understanding for its productive management. Proceedings of an International Symposium held in San José, Costa Rica on 3-5 November 2003. International Network for the Improvement of Banana and Plantain (INIBAP), 2005.
- Aryal, Deb R., et al. "Water quality under intensive banana production and extensive pastureland in tropical Mexico." Journal of Plant Nutrition and Soil Science 175.4 (2012): 553-559.
- Avilán, R. L., et al. "Distribution of the root system of banana cv. Pigneo Gigante under four soil management systems." Agronomia Tropical 29 (1979): 299-312.
- Baker, J. L. "Hydrologic effects of conservation tillage and their importance relative to water quality." (1987).
- Bindraban, P. S., et al. "Land quality indicators for sustainable land management: proposed method for yield gap and soil nutrient balance." Agriculture, Ecosystems & Environment 81.2 (2000): 103-112.
- Bok, Anne—Marie. Estudio del efecto de la aeración del suelo sobre la cosecha del banano en dos fincas de la Zona Atlántica. Agricultural University,(1990)
- Bussière, F. "Rainfall interception by plant canopies, consequences for water partioning in intercropping systems." (1995). In: Sinoquet, Hervé. Ecophysiology of tropical intercropping. Ed. Pablo Cruz. No. 04; SB111. A2, S5.. Paris: INRA, 1995.
- Carr, M. K. V. "The water relations and irrigation requirements of banana (Musa spp.)." Experimental Agriculture 45.3 (2009): 333-371.
- Cattan, Philippe, et al. "Effect on runoff of rainfall redistribution by the impluvium-shaped canopy of banana cultivated on an Andosol with a high infiltration rate." Journal of hydrology 368.1 (2009): 251-261.
- Cattan, Philippe, et al. "Effects of tillage and mulching on runoff under banana (Musa spp.) on a tropical Andosol." Soil and Tillage research 86.1 (2006): 38-51.
- Cattan, Philippe, et al. "Spatial and temporal variations in percolation fluxes in a tropical Andosol influenced by banana cropping patterns." Journal of hydrology335.1 (2007a): 157-169.
- Cattan, Philippe, François Bussière, and Alban Nouvellon. "Evidence of large rainfall partitioning patterns by banana and impact on surface runoff generation." Hydrological Processes 21.16 (2007b): 2196-2205.
- Ceretta, Carlos Alberto, et al. "Nutrient transfer by runoff under no tillage in a soil treated with successive applications of pig slurry." Agriculture, ecosystems & environment 139.4 (2010): 689-699.
- De La Cruz, Ramiro, et al. "El papel de las malezas en la reducción de la lixiviación de nutrimentos en cultivos de banano en el trópico húmedo." Manejo Integrado de Plagas 62 (2001): 29-37.
- Draye, Xavier, François Lecompte, and Loïc Pagès. "Distribution of banana roots in time and space: new tools for an old science." Banana Root System: towards a better understanding for its productive management: Proceedings of an international symposium/Sistema Radical

33
del Banano: hacia un mejor conocimiento para su manejo productivo: Memorias de un simposio internacional. 2005.
- Godefroy, J., E. J. Roose, and M. Muller. "Estimation des pertes par les eaux de ruissellement et de drainage des éléments fertilisants dans un sol de bananeraie de sud de la Côte d'Ivoire." Fruits (Paris) 30.4 (1975): 223-235.
- Godefroy, J., M. Muller, and E. J. Roose. "Estimation des pertes par lixiviation des éléments fertilisants dans un sol de bananeraie de Basse Côte d'Ivoire." Fruits 25.6 (1970): 403-423. Godefroy, J., E. J.
- Goller, Rainer, et al. "Dissolved nitrogen, phosphorus, and sulfur forms in the ecosystem fluxes of a montane forest in Ecuador." Biogeochemistry 77.1 (2006): 57-89.
- Gonçalves, André Luiz, and Jim R. Kernaghan. "Banana production methods." (2014). - Hey, Ellen, and Andre Nollkaemper. "Second International Water Tribunal, Th e."Envtl. Pol'y
& L. 22 (1992): 82. - Hilje, L., Custillo, L., Thruipp, L.A. El Use de Zos Plaguicidus en Costa Rica. Editorial
Universidad Estatal a Distancia, San Jose. (1987.) - Jaramillo, R., and A. Vásquez. "Manual de procedimientos para la presentación y realización
de estudios detallados de suelos y clasificación de tierras para el cultivo de banano." San José, Costa Rica, Corporación Bananera Nacional. 29pp (1990).
- La Corporación Bananera Nacional (CORBANA). “Caracteristicas texturales suelos finca San Pablo” (2012)
- Lu, Ping, Kam-Chau Woo, and Zhu-Tian Liu. "Estimation of whole-plant transpiration of bananas using sap flow measurements." Journal of Experimental Botany 53.375 (2002): 1771-1779.
- Meyer, Jean-Paul, and P. G. Schoch. "Besoin en eau du bananier aux Antilles. Mesure de l'evapotranspiration maximale." Fruits 31.1 (1976): 3-19.
- Montenegro, Afrânio ArleyTeles, et al. "Evapotranspiration and crop coefficient of banana in the coastal region of the state of Ceara, Brazil." Revista Ciência Agronômica 39.2 (2008): 203.
- Parker, G. G. "Throughfall and stemflow in the forest nutrient cycle." Advances in ecological research 13 (1983): 57-133.
- Robinson, John Charles, and Víctor Galán Saúco. Bananas and plantains. Vol. 19. Cabi, (2010.) - Rojas Sanabria, P., et al. "Caracterización y plan de acción para el desarrollo de la agrocadena
del cultivo de plátano en la Región Huetar Atlántica." (2007). - Rosales, Alban, Pascal Maebe, and Robert Sevenhuysen. "Determination of losses of
nutrients and nematicides on a banana plantation in the Atlantic zone." (1992). - Ruy, Stéphane, et al. "Redistribution de la pluie et fonctionnement hydrologique 3D du
système sol-bananier." (2005). - Samson, J. A. "Banana and plantain." Tropical Fruit. Longman Group, London(1980): 119-161. - Sansoulet, Julie, Yves-Marie Cabidoche, and Philippe Cattan. "Adsorption and transport of
nitrate and potassium in an Andosol under banana (Guadeloupe, French West Indies)." European journal of soil science 58.2 (2007): 478-489.
- Schosinsky, N. "Cálculo de la recarga potencial de acuíferos mediante un balance hídrico de suelos." Revista Geológica de América Central 34-35 (2006).
- Sevenhuysen, R., and P. Maebe. "Hydrology and drainage options Atlantic Zone of Costa Rica." (1995).
- Soto, M. “Producción sostenible de banano: Mejoramiento Genético, Seguridad Alimentaria, Manejo Agronómico y Carbono Neutralidad” Universidad Earth, Congreso Internacional de Banano. (2013)

34
- Stoorvogel,J., Segura R., Van Leeuwen, M., and Luts. F. “Calculation fertilization rate for stem only plantation”, Wageningen UR (2013)
- Te Chow, Ven. Applied hydrology. Tata McGraw-Hill Education, 1988. - U.S. Bureau of Reclamation. “Water Measurement Manual” 3rd ed., U.S. Government
Printing Office, Washington, DC 20402, pp. 8-1 to 8-63 (1997) - Vahrson G., W., and P. Dercksen. "Intensidades críticas de lluvia para el diseño de obras de
conservación de suelos en Costa Rica." Agronomía Costarricense (Costa Rica).(Jul-Dic 14.2 (1990): 141-150.
- Van Vosselen, A., Hubert Verplancke, and Eric Van Ranst. "Assessing water consumption of banana: traditional versus modelling approach." Agricultural water management 74.3 (2005): 201-218.
- Veldkamp, Edzo, and Michael Keller. "Nitrogen oxide emissions from a banana plantation in the humid tropics." Journal of Geophysical Research: Atmospheres102.D13 (1997): 15889-15898.
- Wang, Lingqing, Tao Liang, and Qian Zhang. "Laboratory experiments of phosphorus loss with surface runoff during simulated rainfall." Environmental earth sciences 70.6 (2013): 2839-2846.
- Yang, Jingping, Zhengchao Yang, and Junliang Zou. "Effects of rainfall and fertilizer types on nitrogen and phosphorus concentrations in surface runoff from subtropical tea fields in Zhejiang, China." Nutrient cycling in agroecosystems 93.3 (2012): 297-307.

35
Acknowledgement This study was made possible through the long-standing collaboration between Wageningen University and the Costa Rican corporation of banana producers Corbana. All research costs were covered by the Corbana, for which they are gratefully acknowledged.