nutrient recovery by biogas digestate processing
TRANSCRIPT
Nutrient Recovery by Biogas Digestate Processing
Bernhard DrosgWerner Fuchs
Teodorita Al SeadiMichael Madsen
Bernd Linke
SUMMARY
This report reviews various approaches for processing of biogas plant digestate for the purpose of nutrient recovery. It covers both established and emerging technologies and assesses technical performance and where possible economics. Techniques for nutrient recovery from digestate are developing rapidly and aim to improve nutrient management in agriculture and in waste treat-ment systems. The report is aimed at biogas plant developers and operators as well as agriculture policy makers and was produced by IEA Bioenergy Task 37. IEA Bioenergy Task 37 addresses challenges related to the economic and environmental sustainability of biogas production and utilisation.
Nutrient Recovery Table of Contents
Nutrient Recovery by Biogas Digestate Processing
Technical Brochure prepared by:Bernhard DroSgWerner FuchSTeodorita AL SEADIMichael MADSEnBernd LInkE
Edited by David BAxTEr
Published by IEA Bioenergy
DisclaimerIEA Bioenergy, also known as the Implementing Agreement for a Programme of Research, Development and Demonstration on Bioenergy, functions within a Framework created by the International Energy Agency (IEA). Views, findings and publications of IEA Bioenergy do not necessarily represent the views or policies of the IEA Secretariat or of its individual Member countries.
copyright © 2015 IEA Bioenergy. All rights reserved.First electronic edition produced in 2015 A catalogue record for this Technical Brochure is available from the British Library.ISBn 978-1-910154-16-8 (eBook electronic edition)ISBn 978-1-910154-15-1 (printed paper edition)
Table of contents6 Processing of the solid fraction 206.1 composting 20
6.2 Drying 20
7 Processing of the liquid fraction of digestate 217.1 nitrogen recovery 22
7.1.1 Ammonia stripping 28
7.1.2 Ion exchange 23
7.1.3 Struvite precipitation 23
7.2 nutrient concentration and water purification 24
7.2.1 Membrane technologies 24
7.2.2 Evaporation 26
7.2.3 residue management in nutrient recovery processes
28
8 Economics of digestate processing for nutrient recovery 298.1 Digestate land application costs 29
8.2 Detailed cost analysis of 6 digestate processing scenarios for a model biogas plant
29
8.3 general remarks to costs 31
9 Concluding remarks and recommendations 3210 References 3311 Glossary of terms and abbreviations 35
Nutrient Recovery Table of Contents
Executive Summary 41. Introduction 52. Digestate 52.1 What is digestate? 5
2.2 Digestate characteristics - relevant for its use as fertiliser
6
2.2.1 Total solids content (TS) 7
2.2.2 ph value 7
2.2.3 nitrogen content 7
2.2.4 Phosphorus content 7
2.2.5 Impurities and contaminants 8
3 Digestate processing for nutrient recovery 93.1 overview of digestate processing technologies 9
3.2 Applied processes at industrial scale 10
4 Drivers for digestate processing for nutrient recovery 114.1 Legal frameworks 11
4.2 resources management 11
4.3 Logistics 11
4.4 Product standardisation 11
4.5 other drivers 12
5 Solid–liquid separation – the first step in digestate processing 12
5.1 Screw press 13
5.2 Decanter centrifuge 14
5.3 Belt filters 16
5.4 Discontinuous centrifuge 17
5.5 Enhanced solids removal 17
5.5.1 Precipitation/Flocculation 17
5.5.2 Flotation 18
5.5.3 Screens and filters 19
Nutrient Recovery Executive Summary
4
Improved yields from farming practice and food
processing are necessary in order to sustain positive
growth around the world. A key element to achieve this
aim is adequate supply of fertiliser.
Biogas plants produce, along with biogas, digestate,
which is an excellent plant fertiliser, rich in both organic
matter and in macro- and micronutrients. The physico-
chemical characteristics of digestate vary, strongly
depending on the nature and composition of the digest-
ed substrates as well as on the operational parameters of
the biogas processes.
Digestate is normally used as fertiliser for crops with-
out any further processing, substituting industrially
produced mineral fertilisers. However, the need for effi-
cient nutrient management, required by restrictions on
manure application in areas with high livestock density,
along with depletion of the global natural reserves of
phosphorous and potassium, make recovery and recy-
cling of plant nutrients from manure, waste streams, and
other resources increasingly important for farmers, tech-
nology providers, investors, and decision makers.
This report focuses on digestate from biogas plants,
where animal manures and slurries, crop residues,
organic wastes and residues from agri-food processing
industries and from other industrial processes are the
principal substrates.
The nutrients contained in digestate can be extracted
and concentrated through application of a range of tech-
nologies and processes, although there is no unified
approach in the published literature about what defines
digestate processing for nutrient recovery. The present
report presents the technologies that are commercially
available. Nutrient recovery technologies are those that
result in an end-product with higher concentrations of
plant nutrients than the unprocessed digestate, or tech-
nologies that are capable of separating out nutrients in
mineral form, or of creating another marketable end-
product, suitable for recycling as biofertiliser, and clos-
ing the nutrient cycle.
Digestate processing can be partial, primarily for the
purpose of volume reduction, or it can be complete,
refining digestate to pure water, a solid biofertiliser frac-
tion and fertiliser concentrates. While partial processing
uses relatively simple and cheap technologies, for com-
plete processing complex methods and technologies are
currently available with various degrees of technical
maturity, higher energy input, and higher investment
and operating costs.
The first step in digestate processing is to separate the
solid phase from the liquid phase. The solid fraction can
subsequently be directly applied as biofertiliser in agri-
culture or it can be composted or dried for intermediate
storage and transport. Depending on the consistency of
the digestate, screw presses or centrifuges are most com-
monly used for solid–liquid separation.
For complete digestate processing for nutrient recov-
ery, membrane technology can be used, such as nanofil-
tration and ultrafiltration followed by reverse osmosis.
Membrane filtration produces a nutrient concentrate
and purified (process) water. A further possibility for
concentrating digestate is evaporation utilising excess
heat from the biogas plant CHP unit. Nitrogen recovery
from digestate can be carried out by ammonia stripping,
ion exchange or struvite precipitation. Whatever the
technology applied, complete digestate processing
requires high energy input, use of chemical reagents
which, along with high investment costs for appropriate
machinery, imply considerable costs for such applications.
Due to diversified support schemes in different
countries, it is not easy to generalise whether a specific
technology always is feasible in connection with a biogas
plant. Some countries stimulate biogas plant owners to
utilise excess heat through subsidies, while others have
not implemented such fiscal instruments.
The techniques for nutrient recovery from digestate
are developing rapidly, aiming to improve nutrient man-
agement in agriculture and in waste treatment systems.
In parallel, there is a general need to increase the degree
of commercialisation of organic fertilisers from digestate
processing through product standardisation.
The information contained in this report should be
of interest to biogas and digestate producers, to livestock
and crop farmers supplying manure to biogas plants or
using digestate as fertiliser, to agro-food industries and
other organic waste producers, that supply organic
wastes to biogas plants as well as to policy makers, regu-
lators, investors and end-consumers.
Executive Summary
Nutrient Recovery Introduction / Digestate
5
The growing awareness over the last decades about pollu-
tion problems arising from organic waste streams and
manure management has led to restrictions for nutrient
input per hectare in many places with intensive animal
production around the world. Anaerobic digestion of
animal manures and slurries is often required by nation-
al nutrient management regulations or environmental
regulations in such areas, aiming to close the nutrients
cycle, to improve veterinary safety, and to provide air
quality/odour control. At the same time, depletion of
phosphorus and potassium reserves as well as the neces-
sity to preserve and secure their future supply has
changed the focus of digestate processing from nutrient
removal and disposal towards nutrient recovery and recy-
cling. The techniques for nutrient recovery from diges-
tate are developing rapidly, aiming to improve nutrient
management in agriculture and in waste treatment
systems.
The report outlines the prevailing techniques for
digestate processing for the purpose of nutrient recovery.
The aim of the report is to provide information about
possibilities for nutrient recovery from digestate, thereby
highlighting the potential of digestate as a sustainable
source of nutrients for agricultural use.
The technical information provided in the report is
mainly based on an existing publication on digestate
processing technologies, elaborated by University of
Natural Resources and Life Sciences (Department IFA
Tulln) in 2010 (Fuchs and Drosg, 2010),
which was updated and completed with
new information from the IEA Bioenergy
Task 37 member countries and from avail-
able technical and scientific literature.
Key words: nutrient recovery, digestate process-
ing, digestate conditioning, nitrogen recovery,
phosphorus recovery, digestate use as fertilis-
er, solid–liquid separation
2.1 What is digestate?Along with biogas, digestate is a product of anaerobic
digestion (AD) and represents the effluent or digested
substrate which is removed from the AD reactor (digest-
er) after recovery of biogas. Digestate is normally liquid,
but it can also be a solid, stackable material when origi-
nating from, for example, a dry state AD process. During
the biogas process, the substrate, which can be a mixture
of various AD substrates or a pure monosubstrate, is
retained inside the digester for several weeks. During that
time it is sequentially decomposed by a variety of micro-
organisms through a complex biochemical process in the
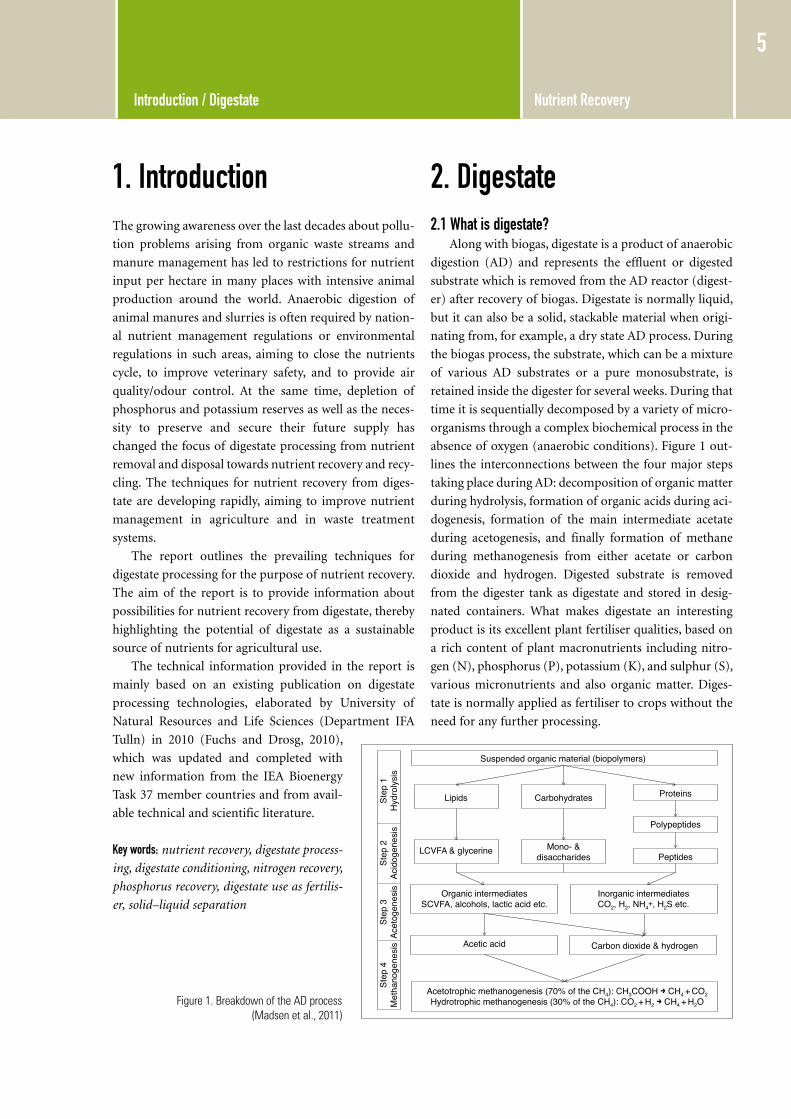
absence of oxygen (anaerobic conditions). Figure 1 out-
lines the interconnections between the four major steps
taking place during AD: decomposition of organic matter
during hydrolysis, formation of organic acids during aci-
dogenesis, formation of the main intermediate acetate
during acetogenesis, and finally formation of methane
during methanogenesis from either acetate or carbon
dioxide and hydrogen. Digested substrate is removed
from the digester tank as digestate and stored in desig-
nated containers. What makes digestate an interesting
product is its excellent plant fertiliser qualities, based on
a rich content of plant macronutrients including nitro-
gen (N), phosphorus (P), potassium (K), and sulphur (S),
various micronutrients and also organic matter. Diges-
tate is normally applied as fertiliser to crops without the
need for any further processing.
1. Introduction 2. Digestate
Figure 1. Breakdown of the AD process (Madsen et al., 2011)
Suspended organic material (biopolymers)
Lipids
LCVFA & glycerine Mono- &disaccharides
Inorganic intermediatesCO2, H2, NH4+, H2S etc.
Organic intermediatesSCVFA, alcohols, lactic acid etc.
Acetotrophic methanogenesis (70% of the CH4): CH3COOH P CH4 + CO2Hydrotrophic methanogenesis (30% of the CH4): CO2 + H2 P CH4 + H2O
Step
1H
ydro
lysi
sSt
ep 2
Acid
ogen
esis
Step
3Ac
etog
enes
isSt
ep 4
Met
hano
gene
sis Acetic acid Carbon dioxide & hydrogen
Carbohydrates Proteins
Polypeptides
Peptides
Nutrient Recovery Digestate
6
2.2 Digestate characteristics – relevant for its use as fertiliser
The physico-chemical characteristics of digestate
vary, strongly depending on the nature and composition
of the substrates as well as on the operational parameters
of the AD process (see Annex 1). Literature (Holm-
Nielsen et al., 1997; Chantigny et al., 2007; Möller et al.,
2008; Tambone et al., 2010; Fouda, 2011) indicates that,
when compared with raw animal manures and slurries,
digestate generally has lower total solids (TS) and total
organic carbon (C) content, lower carbon to nitrogen
ratio (C:N), and lower viscosity. On the other hand, the
pH value and the share of ammonium (NH4+) are
higher in digestate compared to raw animal manures
and slurries. Some characteristics relevant for the ferti-
liser quality of digestate are outlined below.
In Europe, the traditional substrates are agricultural/
livestock by-products (manure and slurries), biogenic
waste (food waste, municipal organic waste, etc.), energy
crops (maize whole crop silage, sugar beet, grass silage),
by-products from food and agro-industries (animal by-
products from abattoirs, brewers’ spent grains and solu-
bles, etc.). More recently, residues from the bioethanol
and the biodiesel industries are used. The influence of
various substrate materials on digestate characteristics is
illustrated in Table 1. These characteristics greatly influ-
ence the choice of digestate processing technology.
The AD process conditions also influence digestate
composition, as shown in Table 2.
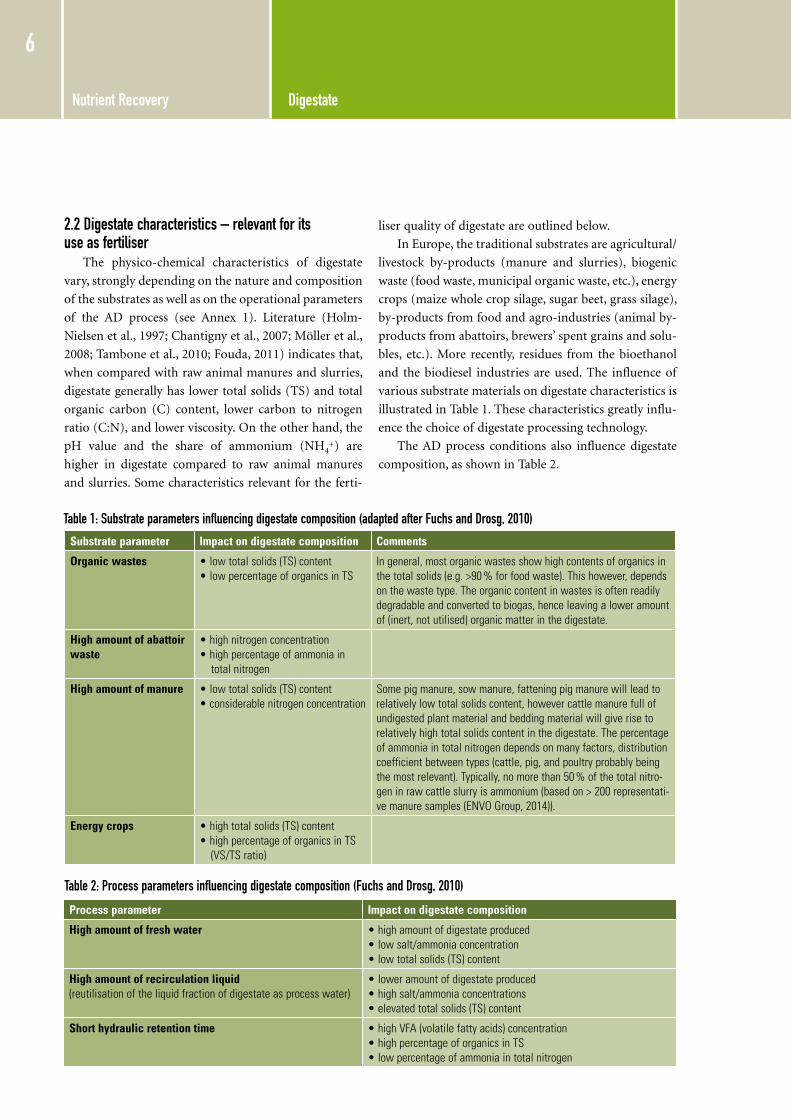
Table 1: Substrate parameters influencing digestate composition (adapted after Fuchs and Drosg, 2010)
Process parameter Impact on digestate composition
High amount of fresh water • high amount of digestate produced• low salt/ammonia concentration• low total solids (TS) content
High amount of recirculation liquid (reutilisation of the liquid fraction of digestate as process water)
• lower amount of digestate produced• high salt/ammonia concentrations• elevated total solids (TS) content
Short hydraulic retention time • high VFA (volatile fatty acids) concentration• high percentage of organics in TS• low percentage of ammonia in total nitrogen
Table 2: Process parameters influencing digestate composition (Fuchs and Drosg, 2010)
Substrate parameter Impact on digestate composition Comments
Organic wastes • low total solids (TS) content • low percentage of organics in TS
In general, most organic wastes show high contents of organics in the total solids (e.g. >90 % for food waste). This however, depends on the waste type. The organic content in wastes is often readily degradable and converted to biogas, hence leaving a lower amount of (inert, not utilised) organic matter in the digestate.
High amount of abattoir waste
• high nitrogen concentration• high percentage of ammonia in
total nitrogen
High amount of manure • low total solids (TS) content• considerable nitrogen concentration
Some pig manure, sow manure, fattening pig manure will lead to relatively low total solids content, however cattle manure full of undigested plant material and bedding material will give rise to relatively high total solids content in the digestate. The percentage of ammonia in total nitrogen depends on many factors, distribution coefficient between types (cattle, pig, and poultry probably being the most relevant). Typically, no more than 50 % of the total nitro-gen in raw cattle slurry is ammonium (based on > 200 representati-ve manure samples (ENVO Group, 2014)).
Energy crops • high total solids (TS) content• high percentage of organics in TS
(VS/TS ratio)
Nutrient Recovery Digestate
7
2.2.1 Total solids content (TS)The content of total solids (also called dry matter)
decreases during AD, so digestate can contain 50 % to
80 % less TS compared to the incoming substrate (Holm
Nielsen et al., 1997; ARBOR, 2013). The TS content of
digestate mainly depends on the initial TS content of the
substrate (e.g. 3 – 15 % TS for wet state AD, and up to
30 % TS for dry state AD), as well as on the content of
easily digestible organic matter. It is generally accepted
that woody materials containing relatively large amounts
of the structural plant polymer lignin have a very low
digestibility, while substrate containing fats, sugars and
alcohols have very high digestibility. Up to 70 % of the TS
content of digestate can be organic, represented by vola-
tile solids (VS). This implies that digestate application on
soils has the potential of improving soil structure through
input of inert organic matter and fibers (primarily ligno-
cellulose), which contributes to the formation of humus
in the medium to long term.
2.2.2 pH valueThe pH value of fresh digestate typically ranges from
7.5 to 8.0 pH. This is higher than the average pH of 7.1
for raw manure (ARBOR, 2013). The pH is mainly influ-
enced by the biochemistry of the AD process, while the
characteristics of substrates will also influence it (ARBOR,
2013, and WRAP, 2012). For example, the formation of
ammonium carbonate ((NH4)2CO3) as well as the
removal of CO2 as a result of the transformation of CO32−
and 2 H3O+ to CO2 and H2O, result in increased pH
(BiotecVisions, 2012). The consumption of volatile fatty
acids (VFA) during AD increases the pH. The same effect
is produced by the concentrations of basic cations like
Ca2+ and K+ (ARBOR, 2013). On the other hand, pre-
cipitation of carbonates such as calcite CaCO3 and of
iron phosphates contribute to decreasing the pH (Hjorth
et al., 2010). On the one hand an increased pH indicates
the degradation of offensively smelling VFAs, which
reduces odour emissions. On the other hand the degree
of ammonia volatilisation increases. Consequently, diges-
tate should be immediately incorporated in soil after
application, or even via direct soil injection to prevent
excess ammonia emissions. However, the superior infil-
tration speed of digestate into soil compared to raw
manure/slurry lowers the risk of excess ammonia vola-
tilisation if digestate is handled according to best agricul-
tural practice. Storage of digestate until field application
should take place in closed storage tanks (manure storage
tanks with flexible plastic coverage).
2.2.3 Nitrogen contentThe AD process degrades organic nitrogen com-
pounds, releasing ammonium NH4-N, which is immedi-
ately bioavailable for growing plants. The content of
ammonium in digestate is directly related to the total N
content in the substrate. As pig slurry has higher N-total
and NH4-N contents than cattle slurry, this will be
reflected directly in the digestate dominated by such sub-
strates (Holm-Nielsen et al., 1997; Fouda, 2011). Specific
differences of nitrogen concentrations in digestate deriv-
ing from the AD of energy crops compared to digestate
from organic waste and industrial by-products are shown
in Figure 2 a and b. The figure shows that nitrogen con-
centrations in energy crop AD plants are rather similar,
whereas in biogas plants co-digesting organic wastes, the
nitrogen concentration varies widely, mainly due to vari-
ations in nitrogen contents in the respective substrates. In
addition, process parameters such as the amount of fresh
water and degree of recirculation can influence the total
nitrogen concentrations. In the case of mono-digestion
of industrial by-products, the influence of nitrogen con-
centration in the substrate is easily recognised. So is the
influence of sulphate.
2.2.4 Phosphorus contentThe phosphorus content of digestate is either given as
total phosphorus or as phosphate equivalents. The AD
process does not affect the content of phosphate in diges-
tate, which is completely dependent on the content in the
substrate. Nevertheless, co-digesting substrate with high
content of phosphate like pig slurries with substrate with
lower phosphate content will consequently lower the
phosphate content in the digestate produced due to sim-
ple dilution (ARBOR, 2013).
Nutrient Recovery
8
2.2.5 Impurities and contaminantsThe presence of impurities and contaminants in
digestate, whether they are of physical, chemical or bio-
logical nature, is highly dependent on their abundance
in the original substrates. The biological contaminants
(pathogens and weed seeds) can be effectively degraded
during the AD process to an extent, which depends on
the process temperature and the retention time inside
the digester. According to Angelidaki and Ellegaard
(2003) thermophilic treatment at a temperature of at
least 52°C and a minimum guaranteed retention time of
10 h effectively corresponds to a controlled sanitation at
70°C for 1 h. Most problematic weeds and pathogens are
removed under these conditions. This is, however, not
the case for the physical contaminants (pieces of inert
materials or larger pieces of digestible ones) as well as
the chemical contaminants (heavy metals and persistent
organic pollutants), which are mainly able to pass
through the AD process unaffected. The presence of any
kind of impurities in digestate is a potential environ-
mental hazard and has a negative impact on its quality
and suitability to be used as fertiliser, and on the farmers’
acceptance of the product (Al Seadi and Lukehurst,
2012). Careful selection of “clean” substrates or alterna-
tive conditioning of substrates prior to AD is therefore
the most sustainable way to avoid impurities and con-
taminants ending up in the digestate. There are quality
standards, national certification systems, and positive
lists of substrates already adopted in several countries,
aiming to ensure that only high quality digestate is certi-
fied as fertiliser (Al Seadi and Lukehurst, 2012). Research
results (Kern, 2008) indicate that the concentration of
heavy metals in phosphorus recovered as the mineral
struvite from digested sewage sludge is many times
below the threshold values for crop fertiliser in Germa-
ny. The explanation is that pollutants present in the
anaerobic sludge, such as heavy metals and persistent
organic pollutants are not involved in the crystallisation
process of struvite. Hence, they are present in the stru-
vite product only in minute amounts (Kern, 2008).
Digestate
a)
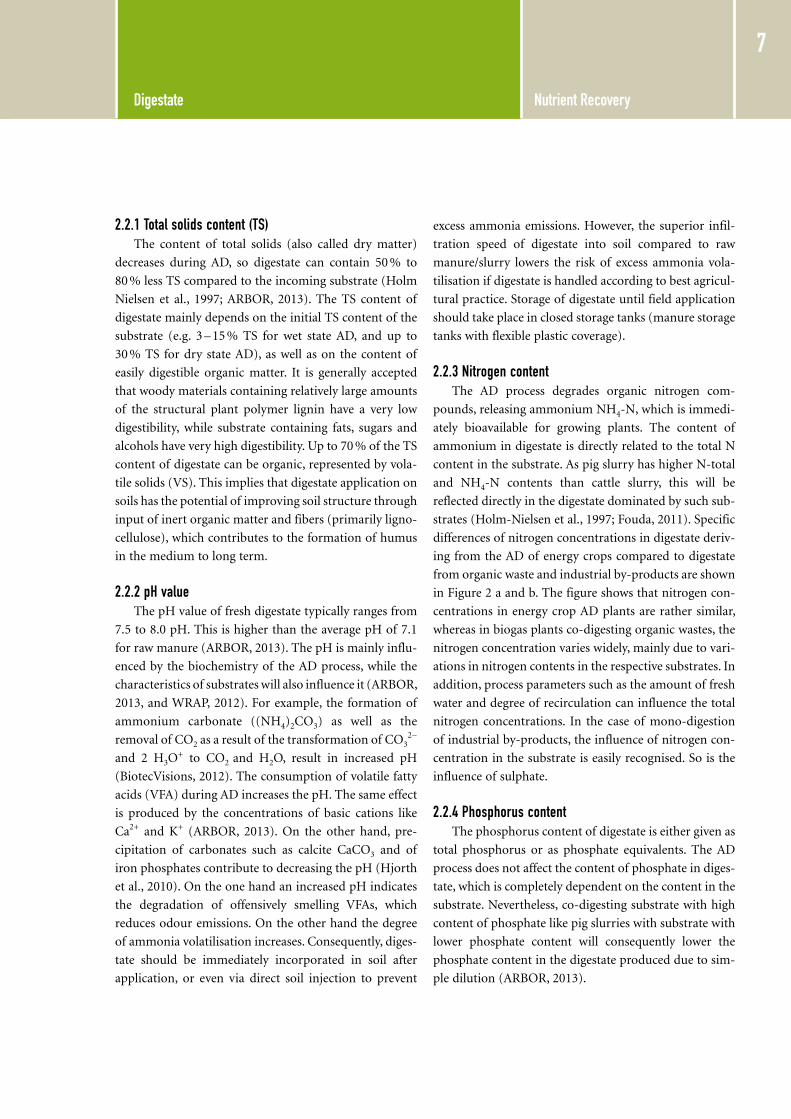
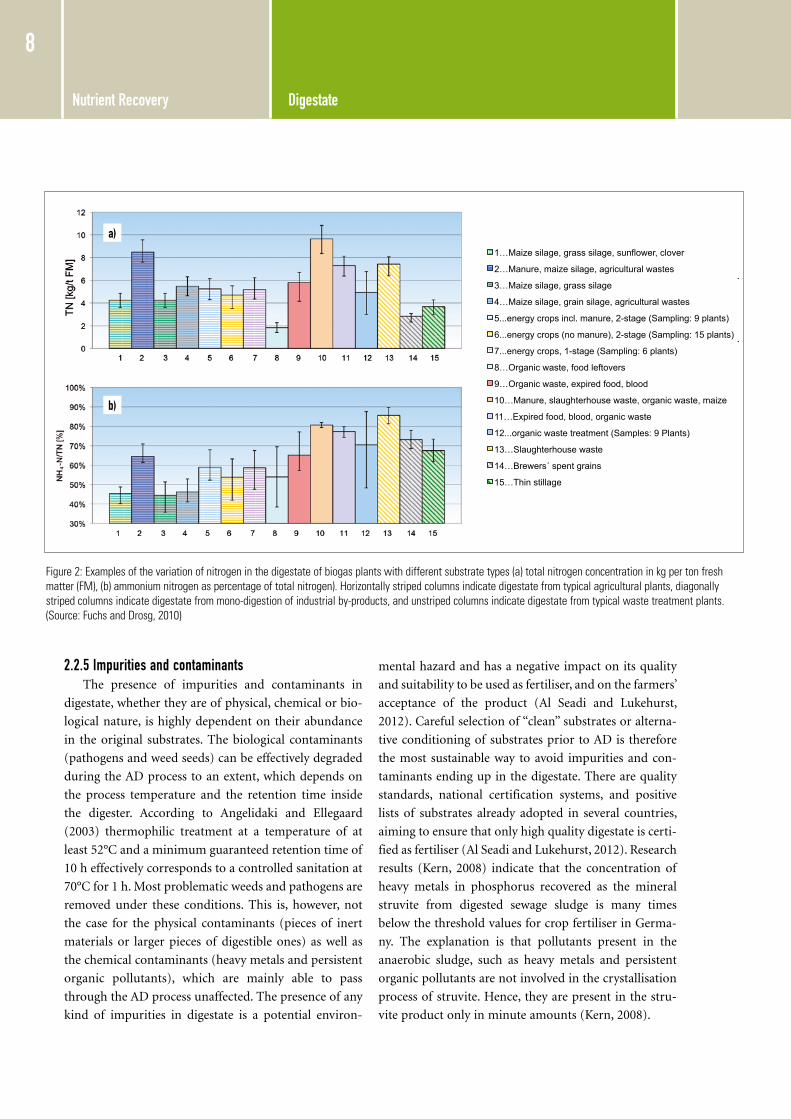
Figure 2: Examples of the variation of nitrogen in the digestate of biogas plants with different substrate types (a) total nitrogen concentration in kg per ton fresh matter (FM), (b) ammonium nitrogen as percentage of total nitrogen). horizontally striped columns indicate digestate from typical agricultural plants, diagonally striped columns indicate digestate from mono-digestion of industrial by-products, and unstriped columns indicate digestate from typical waste treatment plants. (Source: Fuchs and Drosg, 2010)
9
nitrogen concentrations in energy crop AD plants are rather similar, whereas in biogas plants co-digesting organic wastes, the nitrogen concentration varies widely, mainly due to variations in nitrogen contents in the respective substrates. In addition, process parameters such as the amount of fresh water and degree of recirculation can influence the total nitrogen concentrations. In the case of mono-digestion of industrial by-products, the influence of nitrogen concentration in the substrate is easily recognised. So is the influence of sulphate.
2a)
2b)
Figure 2a and 2b: Examples of total nitrogen concentration (TN) in the digestate of
biogas plants with different substrate types (in kg per ton fresh matter (FM)).
Horizontally striped columns indicate digestate from typical agricultural plants,
diagonally striped columns indicate digestate from mono-digestion of industrial by-
products, and unstriped columns indicate digestate from typical waste treatment plants.
(Source: Fuchs and Drosg, 2010)
2.2.4 Phosphorus content
30%
40%
50%
60%
70%
80%
90%
100%
NH
4-N
/TN
[%
]
1 2 3 4 85 6 7 9 1413121110 15
30%
40%
50%
60%
70%
80%
90%
100%
NH
4-N
/TN
[%]
1…Maize silage, grass silage, sunflower, clover
2…Manure, maize silage, agricultural wastes
3…Maize silage, grass silage
4…Maize silage, grain silage, agricultural wastes
5...energy crops incl. manure, 2-stage (Sampling: 9 plants)
6...energy crops (no manure), 2-stage (Sampling: 15 plants)
7...energy crops, 1-stage (Sampling: 6 plants)
8…Organic waste, food leftovers
9…Organic waste, expired food, blood
10…Manure, slaughterhouse waste, organic waste, maize
11…Expired food, blood, organic waste
12...organic waste treatment (Samples: 9 Plants)
13…Slaughterhouse waste
14…Brewers´ spent grains
15…Thin stillage
b)
Nutrient Recovery Digestate processing for nutrient recovery
9
In this report digestate processing is approached
from the point of view of nutrient recovery and digestate
conditioning. Here the aim is to produce a standardised
biofertiliser (solid or liquid), where the quality and mar-
ketability of the digestate is improved. However, diges-
tate processing can also be approached from the point of
view of digestate treatment. This approach is similar to
wastewater treatment, where nutrients and organic mat-
ter from the effluent are removed in order to allow dis-
charge to the sewage system, to the wastewater treatment
plant on site or to a receiving water body. In practice,
digestate processing concepts show aspects of both
approaches. Nevertheless, technologies where nutrients
cannot be recovered (e.g. denitrification in aerobic
wastewater treatment) are not considered here. Conse-
quently, the present report defines digestate processing
for nutrient recovery as the technology that results in an
end-product with higher concentrations of plant nutri-
ents than the unprocessed digestate, or technologies that
are capable of separating out nutrients in mineral form,
or of creating another marketable end-product, suitable
for recycling as biofertiliser, thus closing the nutrient
cycle.
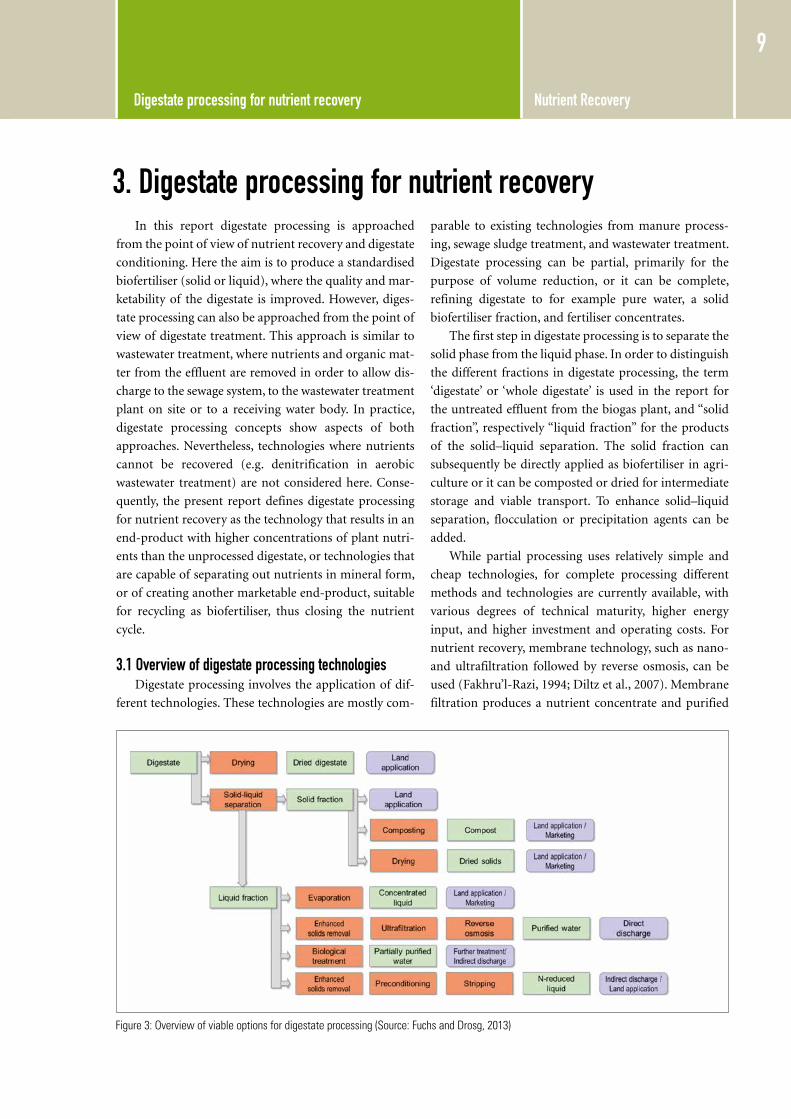
3.1 Overview of digestate processing technologiesDigestate processing involves the application of dif-
ferent technologies. These technologies are mostly com-
parable to existing technologies from manure process-
ing, sewage sludge treatment, and wastewater treatment.
Digestate processing can be partial, primarily for the
purpose of volume reduction, or it can be complete,
refining digestate to for example pure water, a solid
biofertiliser fraction, and fertiliser concentrates.
The first step in digestate processing is to separate the
solid phase from the liquid phase. In order to distinguish
the different fractions in digestate processing, the term
‘digestate’ or ‘whole digestate’ is used in the report for
the untreated effluent from the biogas plant, and “solid
fraction”, respectively “liquid fraction” for the products
of the solid–liquid separation. The solid fraction can
subsequently be directly applied as biofertiliser in agri-
culture or it can be composted or dried for intermediate
storage and viable transport. To enhance solid–liquid
separation, flocculation or precipitation agents can be
added.
While partial processing uses relatively simple and
cheap technologies, for complete processing different
methods and technologies are currently available, with
various degrees of technical maturity, higher energy
input, and higher investment and operating costs. For
nutrient recovery, membrane technology, such as nano-
and ultrafiltration followed by reverse osmosis, can be
used (Fakhru’l-Razi, 1994; Diltz et al., 2007). Membrane
filtration produces a nutrient concentrate and purified
Figure 3: overview of viable options for digestate processing (Source: Fuchs and Drosg, 2013)
3. Digestate processing for nutrient recovery
Nutrient Recovery Digestate processing for nutrient recovery
10
process water (Castelblanque and Salimbeni, 1999, Klink
et al., 2007). The liquid digestate can also be purified
through aerobic biological wastewater treatment (Cama-
rero et al., 1996). However, because of the high nitrogen
content and low biological oxygen demand (BOD),
addition of an external carbon source is often necessary
in order to achieve sufficient denitrification. A further
possibility for concentrating digestate is evaporation
with excess heat from the biogas plant CHP unit. In
order to reduce the nitrogen content in the digestate,
ammonia stripping (Siegrist et al., 2005), ion exchange
(Sánchez et al., 1995) or struvite precipitation (Uludag-
Demirer et al., 2005; Marti et al., 2008) have been pro-
posed. Whatever technology is applied, advanced diges-
tate processing in most cases requires high energy input
and chemical reagents. Together with increased invest-
ment costs for appropriate machinery, considerable
treatment costs also arise. An overview of viable diges-
tate processing technologies is given in Figure 3.
3.2 Applied processes at industrial scaleAs illustrated above (Figure 3) a very broad range of
technologies are currently being applied for digestate
processing, depending on the boundary conditions. Up
to now, no market leading technology has evolved. The
most abundant approach is solid–liquid separation of
digestate, where, depending on the consistency of the
digestate, screw presses or centrifuges are most com-
monly applied. Solid–liquid separation can be improved
by the addition of precipitating agents.
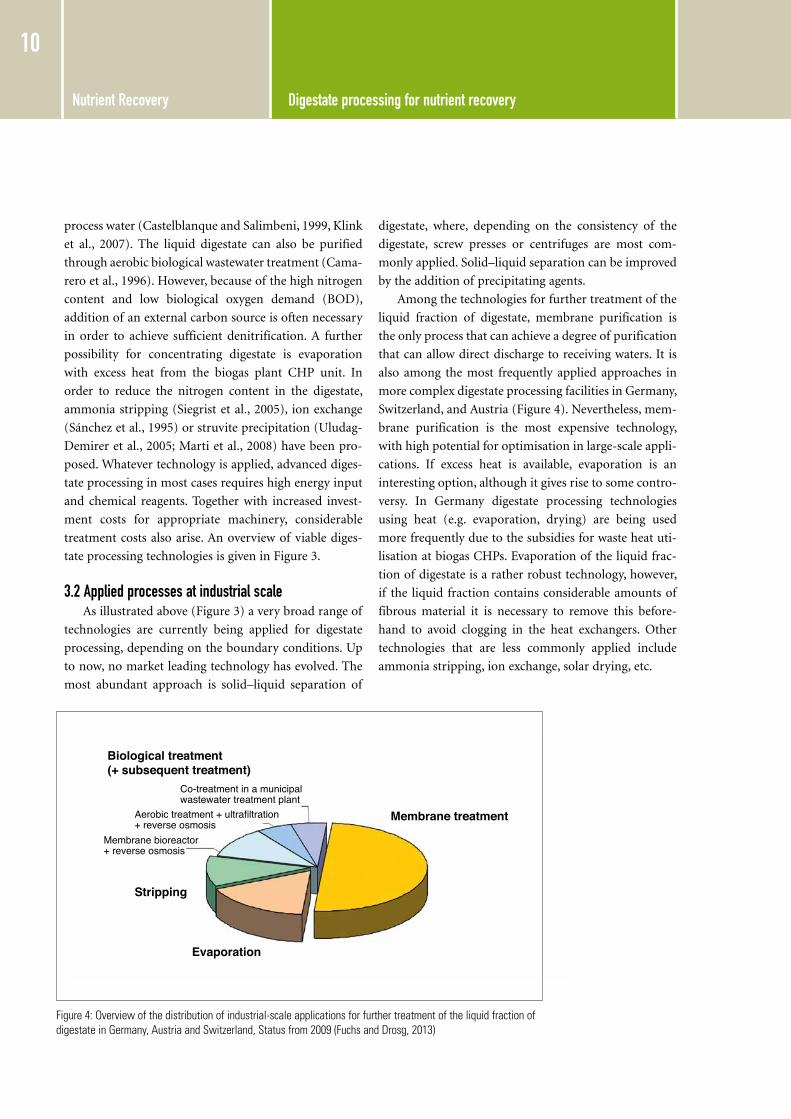
Among the technologies for further treatment of the
liquid fraction of digestate, membrane purification is
the only process that can achieve a degree of purification
that can allow direct discharge to receiving waters. It is
also among the most frequently applied approaches in
more complex digestate processing facilities in Germany,
Switzerland, and Austria (Figure 4). Nevertheless, mem-
brane purification is the most expensive technology,
with high potential for optimisation in large-scale appli-
cations. If excess heat is available, evaporation is an
interesting option, although it gives rise to some contro-
versy. In Germany digestate processing technologies
using heat (e.g. evaporation, drying) are being used
more frequently due to the subsidies for waste heat uti-
lisation at biogas CHPs. Evaporation of the liquid frac-
tion of digestate is a rather robust technology, however,
if the liquid fraction contains considerable amounts of
fibrous material it is necessary to remove this before-
hand to avoid clogging in the heat exchangers. Other
technologies that are less commonly applied include
ammonia stripping, ion exchange, solar drying, etc.
Figure 4: overview of the distribution of industrial-scale applications for further treatment of the liquid fraction of digestate in germany, Austria and Switzerland, Status from 2009 (Fuchs and Drosg, 2013)
Biological treatment(+ subsequent treatment)
Membrane treatment
Stripping
Evaporation
Co-treatment in a municipalwastewater treatment plant
Aerobic treatment + ultrafiltration+ reverse osmosis
Membrane bioreactor+ reverse osmosis
The standard utilisation of digestate is application as
fertiliser and soil conditioner in agriculture, horticulture,
forestry etc. Direct application is possible immediately
following its removal from the digester (whole digestate)
without the need for any further processing.
However, digestate is rather dilute with respect to
nutrients, which makes the costs of transportation rela-
tively high compared to conventional fertiliser. Other
significant costs are related to investments in storage
capacity, required by environmental regulations in many
countries, like for instance in the case of Denmark, Ger-
many and France, where not only the nutrient input per
hectare is restricted, but also the period of application is
limited to the growing season.
Nevertheless, many crop cultivaters agree that syner-
gistic effects arise from applying digestate as organic fer-
tiliser compared to conventional fertiliser.
4.1 Legal frameworks
At EU level, the European Nitrate Directive 91/676/
EEC limits the annual load of nitrogen that can be
applied to agricultural land in EU member states. In
many parts of Europe and around the world, livestock
production is intensive, concentrated in areas with lim-
ited land available for manure application. This creates a
permanent excess of nutrients, making such areas highly
vulnerable from the point of view of nutrient pollution
of ground and surface waters. When animal feed is being
imported to such a region, efficient nutrient handling
becomes even more crucial. Restrictions on the nutrient
input per hectare require the excess nutrients to be recov-
ered, exported, and recycled outside the vulnerable areas.
To deal with the problem, digestate processing technolo-
gies, aiming first of all at volume reduction and nitrogen
removal, have consequently been implemented in many
places during the last decade.
More recently, also concerns regarding phosphorus
surplus from manure application in many areas and
excessive levels of phosphorus found in surface and
ground waters have greatly increased demand for nutri-
ent management and export of excess of nutrients.
4.2 Resources managementAn ever growing aspect of digestate processing is its
contribution to effective resource management. Nutri-
ents recovered from digestate are important as a sustain-
able source of phosphorus and potassium. The natural
reserves of phosphates and potassium are concentrated
in few areas around the globe and extracted through
mining activities. It is estimated that the easily available
resources of phosphorus will be depleted by the end of
this century (Neset & Cordell, 2012), while the global
demand for nutrients will increase continuously, creating
an imbalance between availability and demand, with the
consequence of rising prices for essential plant nutrients
(Vaneeckhaute et al., 2013).
4.3 LogisticsStorage, transport, handling and application of diges-
tate as fertiliser imply significant costs for farmers, due to
its large volume and low nutrient concentration com-
pared with its fertiliser value. For small to medium-scale
biogas plants, transportation of substrate and digestate
accounts for roughly 33 % of the overall biogas produc-
tion costs (Bojesen et al., 2014), which makes transport
minimisation a crucial cost reduction criterion.
Significant transportation costs savings can be real-
ised for the farmers and crop cultivators associated with
a biogas plant, if the tanker trucks collect raw manure
from stables and deliver digestate in storage tanks nearby
the fields where digestate is to be applied. Hence, indi-
vidual parties should settle on a fair distribution of the
transportation costs in order to optimise savings for the
farmers.
4.4 Product standardisationUp to now, the market for organic fertilisers produced
through digestate processing is poorly developed in most
countries. From the point of view of commercialisation
of organic fertiliser from agricultural substrates, this
should be feasible if there is a suitable legal frame. For
industrial wastes, the legal situation will depend on the
origin of the waste and the process in question. It is nev-
Nutrient Recovery Drivers for digestate processing for nutrient recovery
11
4. Drivers for digestate processing for nutrient recovery
Nutrient Recovery Solid–liquid separation – the first step in digestate processing
12
ertheless expected that in the near future, the degree of
commercialisation of organic fertilisers from digestate
processing will increase. Local policies and markets
influence the marketability of compost and dried diges-
tate. Quality standards and legislation for fertilisers and
compost products need special consideration. Especially
in the case of digestate originating from co-digestion of
industrial waste and household waste, the presence of
heavy metals, persistent organic pollutants and other
chemical pollutants may be a barrier for marketing of
digestate products. It must be emphasised that these
consumer-induced barriers are often not based on quan-
tifiable parameters, rather on social attitude towards
waste and its inherent heterogeneity. Legal frameworks
in most countries stipulate the quality conditions for the
marketing of waste based digestate products.
4.5 Other driversBecause of high water content, application of whole
digestate (as well as of raw animal slurries) could lead to
“soaking” of land in very rainy, humid climates or in
water sensitive areas. Such conditions too, make diges-
tate processing for nutrient concentration attractive.
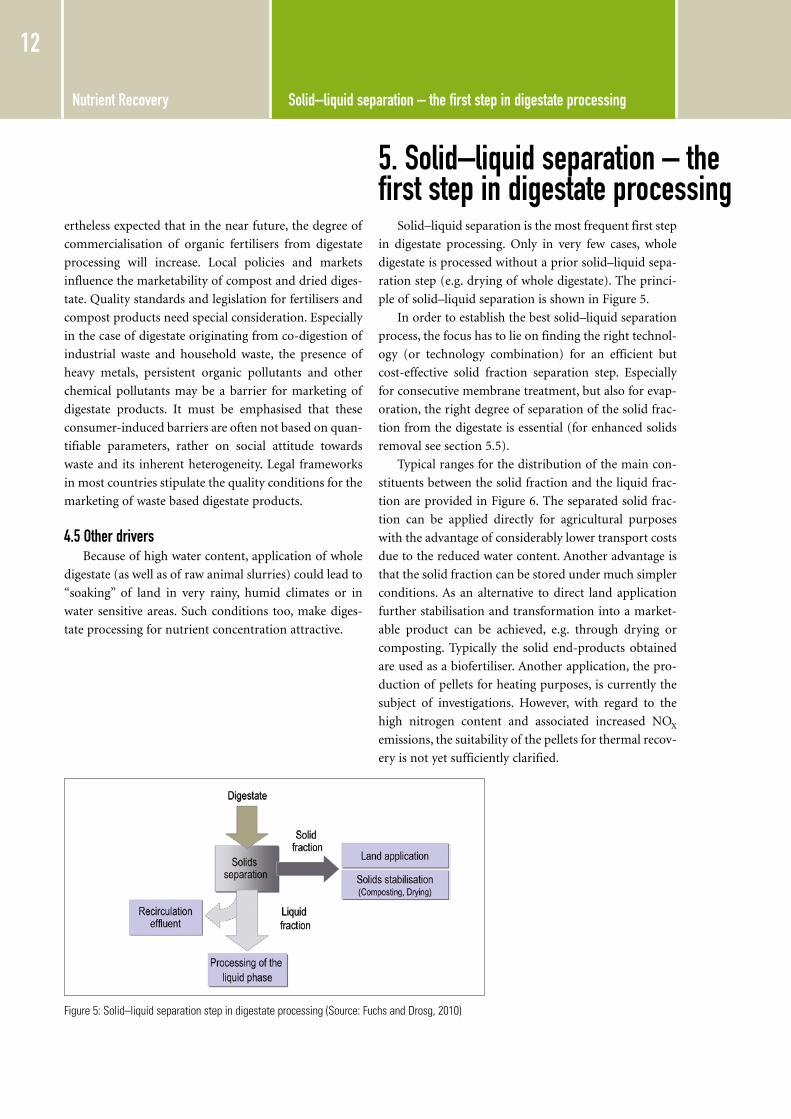
Solid–liquid separation is the most frequent first step
in digestate processing. Only in very few cases, whole
digestate is processed without a prior solid–liquid sepa-
ration step (e.g. drying of whole digestate). The princi-
ple of solid–liquid separation is shown in Figure 5.
In order to establish the best solid–liquid separation
process, the focus has to lie on finding the right technol-
ogy (or technology combination) for an efficient but
cost-effective solid fraction separation step. Especially
for consecutive membrane treatment, but also for evap-
oration, the right degree of separation of the solid frac-
tion from the digestate is essential (for enhanced solids
removal see section 5.5).
Typical ranges for the distribution of the main con-
stituents between the solid fraction and the liquid frac-
tion are provided in Figure 6. The separated solid frac-
tion can be applied directly for agricultural purposes
with the advantage of considerably lower transport costs
due to the reduced water content. Another advantage is
that the solid fraction can be stored under much simpler
conditions. As an alternative to direct land application
further stabilisation and transformation into a market-
able product can be achieved, e.g. through drying or
composting. Typically the solid end-products obtained
are used as a biofertiliser. Another application, the pro-
duction of pellets for heating purposes, is currently the
subject of investigations. However, with regard to the
high nitrogen content and associated increased NOX
emissions, the suitability of the pellets for thermal recov-
ery is not yet sufficiently clarified.
Figure 5: Solid–liquid separation step in digestate processing (Source: Fuchs and Drosg, 2010)
5. Solid–liquid separation – the first step in digestate processing

Nutrient Recovery Solid–liquid separation – the first step in digestate processing
13
The major fraction deriving from the separation step
is the liquid fraction. Depending on the characteristics of
the whole digestate and the efficiency of solids removal,
its composition is subject to wide variation. Frequently,
part of the liquid fraction is recycled to adjust the dry
matter concentration of the input substrate (Resch et al.,
2008). For the remaining liquid fraction, there are a vari-
ety of recovery and treatment options. In the simplest
case, it is spread on agricultural land. Here the advantage
of solid–liquid separation can be that a solid fraction
gives rise to improved storage and residues management
logistics. Nevertheless, further treatment with the aim of
volume reduction and recovery of nutrients can be
applied. In most cases, these objectives will be achieved
only through a sequence of several steps. As a general
rule, the necessary procedures are relatively complex and
therefore expensive.
5.1 Screw press Screw press separators (see Figure 7) are often used if
the digestate has high fibre content. In Figure 8 the
detailed set-up of a screw press separator is shown. A
screw presses the fibres against a cylindrical screen. The
liquid fraction of digestate leaves the separator through
the sieve. Because of the increasing diameter of the screw
the pressure is increases as the fibres advance along the
separator. Finally, the solid fraction (containing the
fibres) exits at the end of the separator, where the resist-
ance can be adjusted mechanically. The degree of separa-
tion can be influenced by the mesh size of the screen,
smaller particles (diameter of 0.5–1 mm) remain in the
liquid (Weiland, 2008).
Unlike decanter centrifuges, screw press separators
cannot separate small sludge particles from the digestate.
If the digestate contains mainly fibres, the amount of
solid fraction that will accumulate is dependent on the
Figure 7: Screw press separator (Source: Fuchs and Drosg, 2010)
Figure 8: Detailed set-up of a screw press separator (Source: Fuchs and Drosg, 2010)
Figure 6: Distribution of the principal constituents after solid–liquid separation (data based on own investigations and various references; adapted after Bauer et al. (2009))
Liquid fraction Solid fraction
Nutrient Recovery Solid–liquid separation – the first step in digestate processing
14
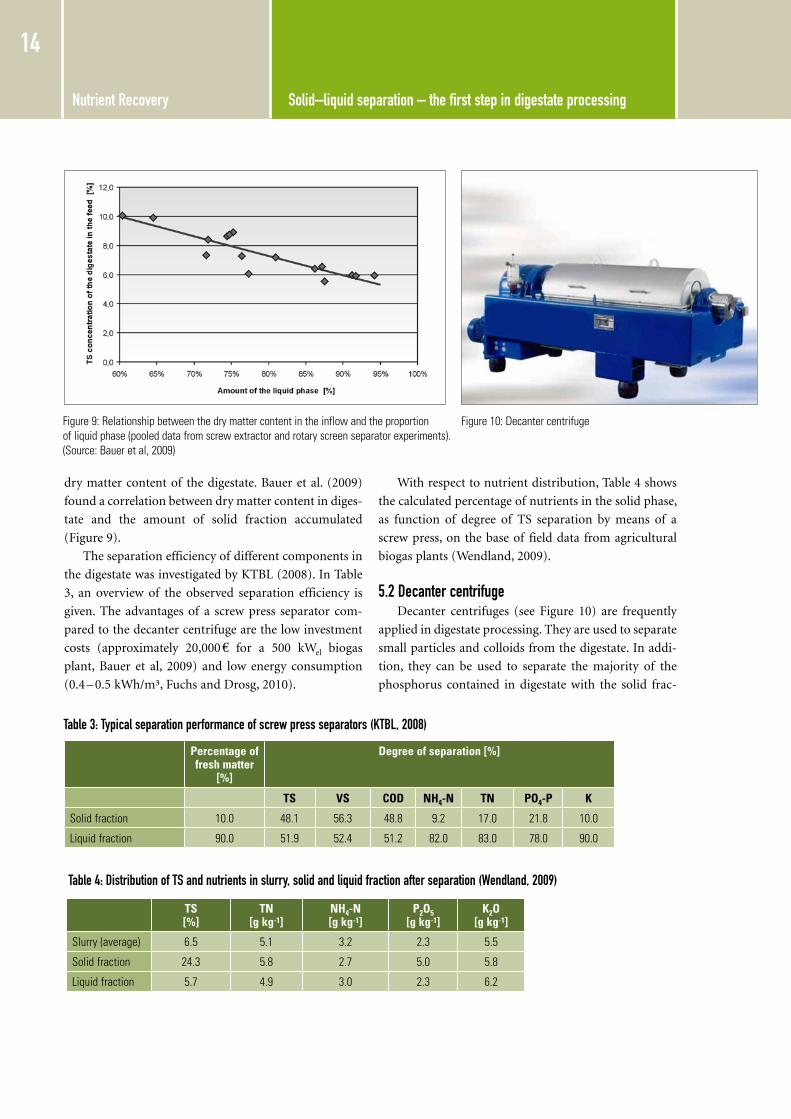
dry matter content of the digestate. Bauer et al. (2009)
found a correlation between dry matter content in diges-
tate and the amount of solid fraction accumulated
(Figure 9).
The separation efficiency of different components in
the digestate was investigated by KTBL (2008). In Table
3, an overview of the observed separation efficiency is
given. The advantages of a screw press separator com-
pared to the decanter centrifuge are the low investment
costs (approximately 20,000 € for a 500 kWel biogas
plant, Bauer et al, 2009) and low energy consumption
(0.4 – 0.5 kWh/m³, Fuchs and Drosg, 2010).
With respect to nutrient distribution, Table 4 shows
the calculated percentage of nutrients in the solid phase,
as function of degree of TS separation by means of a
screw press, on the base of field data from agricultural
biogas plants (Wendland, 2009).
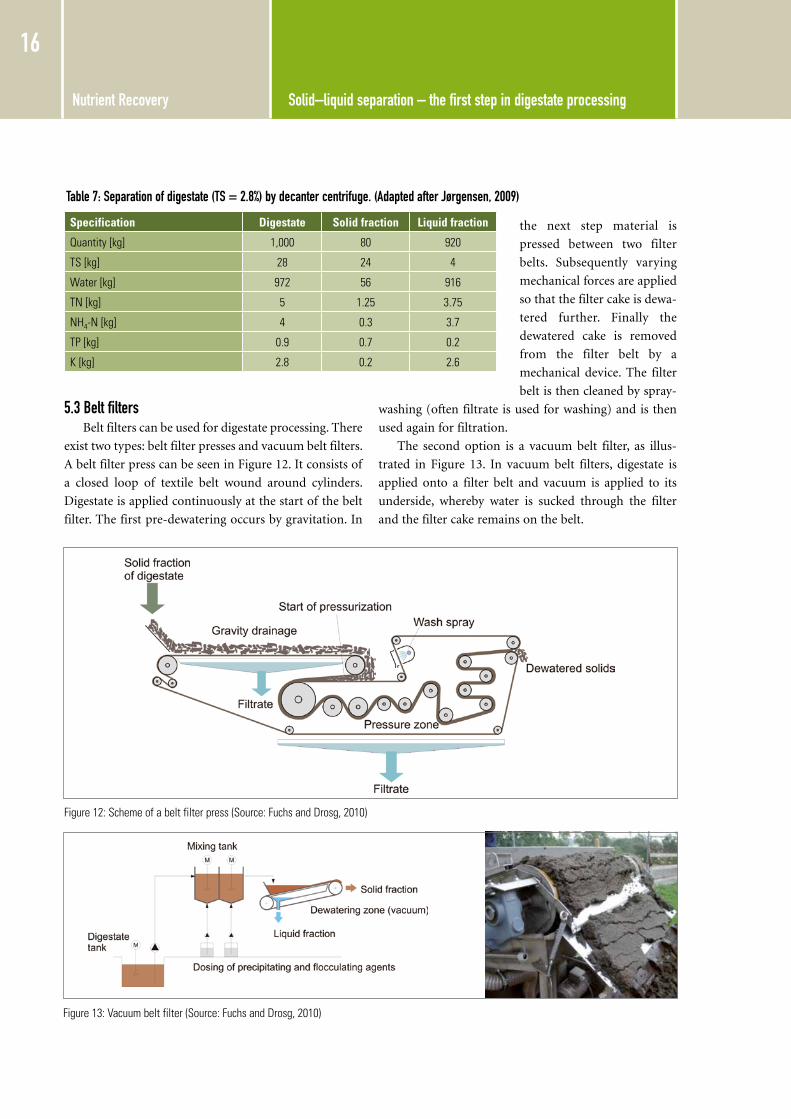
5.2 Decanter centrifugeDecanter centrifuges (see Figure 10) are frequently
applied in digestate processing. They are used to separate
small particles and colloids from the digestate. In addi-
tion, they can be used to separate the majority of the
phosphorus contained in digestate with the solid frac-
Figure 9: relationship between the dry matter content in the inflow and the proportion of liquid phase (pooled data from screw extractor and rotary screen separator experiments). (Source: Bauer et al, 2009)
Table 3: Typical separation performance of screw press separators (KTBL, 2008)
Percentage of fresh matter
[%]
Degree of separation [%]
TS VS COD NH4-N TN PO4-P K
Solid fraction 10.0 48.1 56.3 48.8 9.2 17.0 21.8 10.0
Liquid fraction 90.0 51.9 52.4 51.2 82.0 83.0 78.0 90.0
Table 4: Distribution of TS and nutrients in slurry, solid and liquid fraction after separation (Wendland, 2009)
TS[%]
TN[g kg-1]
NH4-N[g kg-1]
P2O5[g kg-1]
K2O[g kg-1]
Slurry (average) 6.5 5.1 3.2 2.3 5.5
Solid fraction 24.3 5.8 2.7 5.0 5.8
Liquid fraction 5.7 4.9 3.0 2.3 6.2
Figure 10: Decanter centrifuge

Nutrient Recovery Solid–liquid separation – the first step in digestate processing
15
tion (Møller, 2001). There are several commercial brands
of decanter centrifuges in use today for digestate separa-
tion, with similar performances. In Figure 11 the detailed
set-up of a decanter centrifuge is shown. The digestate
enters the centrifuge via a central inlet and is fed into the
centre of the centrifuge. The particles are separated by
the centrifugal force. The separation performance
depends on the particle size and shape, the difference in
density between particles and fluid, as well on the fluid
viscosity. The separated particles accumulate on the walls
of the cylinder and are transported and fur-
ther compressed by a screw. At the final outlet
(right-hand side in Figure 11) the solid frac-
tion leaves the decanter. On the left side, the
clarified liquid leaves the decanter. Energy
consumption is rather high (3 – 5 kWh/m³,
Fuchs and Drosg, 2010), compared with other
solid–liquid separation technologies.
In Tables 5 and 6 technology test results of
the GEA Westfalia decanter centrifuge are
shown (DANETV, 2010). The test was made
on 5 batches of minimum four hours each,
with a fixed start and end time for each batch.
For each batch the weight or volume of input digested
biomass, liquid output fraction and solid output fraction
were measured and concentrations of solids and nutri-
ents were determined by analysing representative samples
of the inlet flow and the two outlet flows. During the
5 batch tests, the decanter centrifuge treated 283 m3 of
digestate, corresponding to an average capacity of
13.72 m3 biomass treated per hour.
A specific example of the effect of digestate separation
by decanter centrifuge is given in Table 7.
Figure 11: Detailed set-up of a decanter centrifuge (Source: Fuchs and Drosg, 2010)
Table 5: Digestate separation by decanter centrifuge – average content of total solids, ashes, volatile solids, suspended solids and pH over 5 batches (adapted after DANETV, 2010)
Fraction TS [%]
Ash [%]
VS* [%]
Suspended solids [g/L]
pH [-]
Input digestate 4.85 1.46 3.39 35.0 7.64
Liquid fraction 2.31 0.82 1.49 8.4 7.94
Solid fraction 27.66 6.46 21.20 not relevant 8.12
* Values for volatile solids are not measured but calculated as the difference between total solids and ashes.
Table 6: Digestate separation by decanter centrifuge - average concentrations of nutrients over 5 batches (adapted after DANETV, 2010)
Fraction TN [g kg-1]
NH4-N [g kg-1]
Org N* TP[g kg-1]
Total sulphur[g kg-1]
Input digestate 4.08 2.87 1.21 0.94 0.42
Liquid fraction 3.49 2.63 0.86 0.31 0.29
Solid fraction 8.15 4.50 3.65 6.52 1.56
* Values for organic nitrogen are not measured but calculated as the difference between total-N and ammonium-N.
Nutrient Recovery Solid–liquid separation – the first step in digestate processing
16
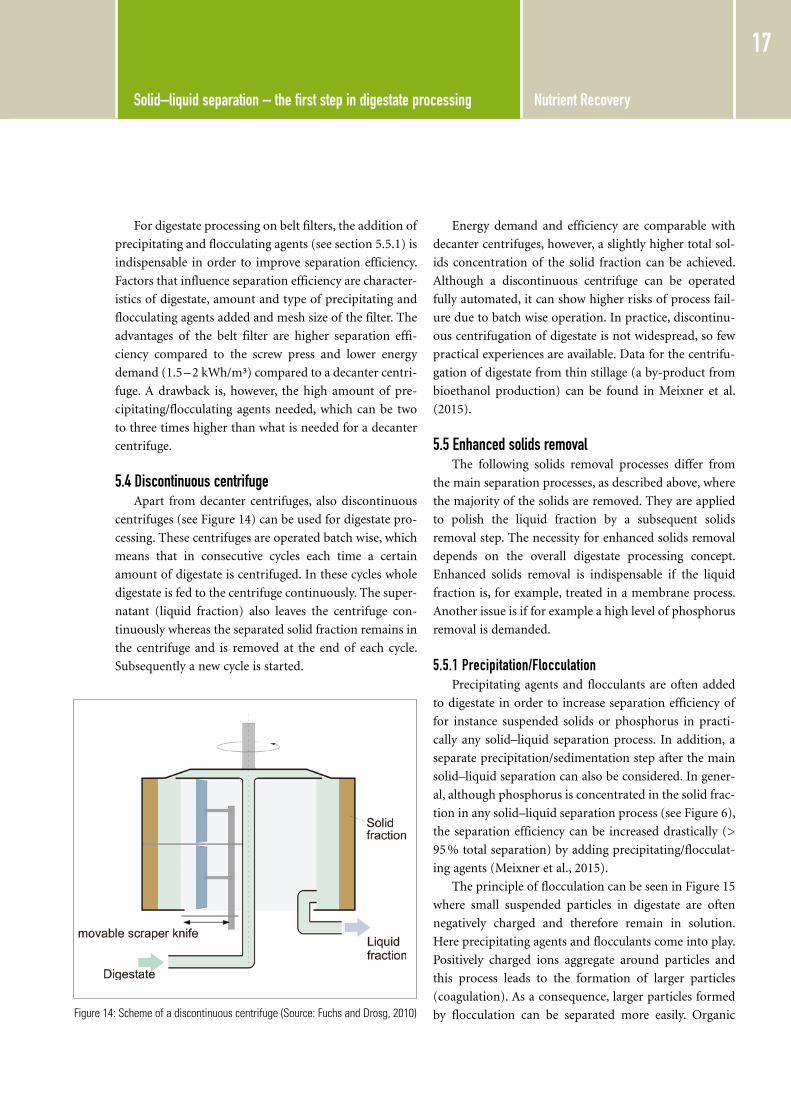
5.3 Belt filtersBelt filters can be used for digestate processing. There
exist two types: belt filter presses and vacuum belt filters.
A belt filter press can be seen in Figure 12. It consists of
a closed loop of textile belt wound around cylinders.
Digestate is applied continuously at the start of the belt
filter. The first pre-dewatering occurs by gravitation. In
the next step material is
pressed between two filter
belts. Subsequently varying
mechanical forces are applied
so that the filter cake is dewa-
tered further. Finally the
dewatered cake is removed
from the filter belt by a
mechanical device. The filter
belt is then cleaned by spray-
washing (often filtrate is used for washing) and is then
used again for filtration.
The second option is a vacuum belt filter, as illus-
trated in Figure 13. In vacuum belt filters, digestate is
applied onto a filter belt and vacuum is applied to its
underside, whereby water is sucked through the filter
and the filter cake remains on the belt.
Table 7: Separation of digestate (TS = 2.8%) by decanter centrifuge. (Adapted after Jørgensen, 2009)
Specification Digestate Solid fraction Liquid fraction
Quantity [kg] 1,000 80 920
TS [kg] 28 24 4
Water [kg] 972 56 916
Tn [kg] 5 1.25 3.75
nh4-n [kg] 4 0.3 3.7
TP [kg] 0.9 0.7 0.2
k [kg] 2.8 0.2 2.6
Figure 12: Scheme of a belt filter press (Source: Fuchs and Drosg, 2010)
Figure 13: Vacuum belt filter (Source: Fuchs and Drosg, 2010)
Nutrient Recovery Solid–liquid separation – the first step in digestate processing
17
For digestate processing on belt filters, the addition of
precipitating and flocculating agents (see section 5.5.1) is
indispensable in order to improve separation efficiency.
Factors that influence separation efficiency are character-
istics of digestate, amount and type of precipitating and
flocculating agents added and mesh size of the filter. The
advantages of the belt filter are higher separation effi-
ciency compared to the screw press and lower energy
demand (1.5 – 2 kWh/m³) compared to a decanter centri-
fuge. A drawback is, however, the high amount of pre-
cipitating/flocculating agents needed, which can be two
to three times higher than what is needed for a decanter
centrifuge.
5.4 Discontinuous centrifugeApart from decanter centrifuges, also discontinuous
centrifuges (see Figure 14) can be used for digestate pro-
cessing. These centrifuges are operated batch wise, which
means that in consecutive cycles each time a certain
amount of digestate is centrifuged. In these cycles whole
digestate is fed to the centrifuge continuously. The super-
natant (liquid fraction) also leaves the centrifuge con-
tinuously whereas the separated solid fraction remains in
the centrifuge and is removed at the end of each cycle.
Subsequently a new cycle is started.
Energy demand and efficiency are comparable with
decanter centrifuges, however, a slightly higher total sol-
ids concentration of the solid fraction can be achieved.
Although a discontinuous centrifuge can be operated
fully automated, it can show higher risks of process fail-
ure due to batch wise operation. In practice, discontinu-
ous centrifugation of digestate is not widespread, so few
practical experiences are available. Data for the centrifu-
gation of digestate from thin stillage (a by-product from
bioethanol production) can be found in Meixner et al.
(2015).
5.5 Enhanced solids removal The following solids removal processes differ from
the main separation processes, as described above, where
the majority of the solids are removed. They are applied
to polish the liquid fraction by a subsequent solids
removal step. The necessity for enhanced solids removal
depends on the overall digestate processing concept.
Enhanced solids removal is indispensable if the liquid
fraction is, for example, treated in a membrane process.
Another issue is if for example a high level of phosphorus
removal is demanded.
5.5.1 Precipitation/Flocculation Precipitating agents and flocculants are often added
to digestate in order to increase separation efficiency of
for instance suspended solids or phosphorus in practi-
cally any solid–liquid separation process. In addition, a
separate precipitation/sedimentation step after the main
solid–liquid separation can also be considered. In gener-
al, although phosphorus is concentrated in the solid frac-
tion in any solid–liquid separation process (see Figure 6),
the separation efficiency can be increased drastically (>
95 % total separation) by adding precipitating/flocculat-
ing agents (Meixner et al., 2015).
The principle of flocculation can be seen in Figure 15
where small suspended particles in digestate are often
negatively charged and therefore remain in solution.
Here precipitating agents and flocculants come into play.
Positively charged ions aggregate around particles and
this process leads to the formation of larger particles
(coagulation). As a consequence, larger particles formed
by flocculation can be separated more easily. Organic Figure 14: Scheme of a discontinuous centrifuge (Source: Fuchs and Drosg, 2010)

Nutrient Recovery Solid–liquid separation – the first step in digestate processing
18
polymers (e.g. acrylamide) may be added to increase the
linkage of the flocks and therefore flocculation perfor-
mance.
Common precipitating agents are aluminium sul-
phate (Al2(SO4)3), ferric chloride (FeCl3), ferric sulphate
(Fe2(SO4)3), and lime (Ca(OH)2). The dosage of the
precipitating agents or flocculants can either be done
separately in mixing tanks prior to solid–liquid separa-
tion or in-line, which means that they are injected
directly into the transfer pipes, where mixing systems are
integrated to provide sufficient turbulence.
Polymers are widely used in wastewater treatment
plants during dewatering of sludge, which is then
applied on farmland. Some agricultural co-digestion
plants have also applied polymers, but the use appears to
be limited to a few plants. However, there is still insuffi-
cient documentation with respect to the potential toxic-
ity and ultimate fate of
certain polymers when
applied to farmland.
Extensive use of poly-
mers in the wastewater
treatment sector has
not led to reporting of
negative impacts on the
environment, however
detailed controlled
studies have not been
undertaken. Hence, the
precautionary principle
prevails in many cases
and can be a barrier towards acceptance
of polymer–containing digestate prod-
ucts (Henriksson, 2010).
The uncertainty about polymer usage
has led to regulatory restrictions. For
instance in Sweden the quality standards
applied to digestate used as fertiliser
(SPCR120) do not allow for addition of
polymers due to insufficient knowledge
about their environmental impact when
spread on soils. In Germany this aspect
has been taken into consideration in the
amendment to the Fertilizer Regulation
(DüMV) from November 2012 (BGK
e.V., 2012). For polymers that do not degrade in the soil,
a transitional period until 31.12.2013 was set. Mean-
while, for a better transition to alternative products this
period was extended to 31.12.2016. In addition, the
required degradation rate for permitted polymers was
more exactly specified: > 20 % degradation within 2
years.
5.5.2 FlotationFlotation is a process that is rarely applied in diges-
tate processing due to the additional costs. The principle
of flotation is that the lifting force of suspended particles
is increased by the attachment of small gas bubbles to
them. Consequently, they are lifted to the surface where
they produce a floating layer that can then be harvested.
In general, flotation equipment occupies 30 – 50 % less
Figure 15: Simplified illustration of the different phases in flocculation I: suspended colloids, II: destabilisation of colloids by flocculation agents, III: linkage and increase of flocks by floccu-lation agents (Source: Fuchs and Drosg, 2010)
Figure 16: Scheme of flotation (Source: Fuchs and Drosg, 2010)

Nutrient Recovery Solid–liquid separation – the first step in digestate processing
19
space than standard sedimentation equipment as the lift-
ing force is generally much higher than the sedimenta-
tion force. Two different flotation processes exist: flota-
tion by decompression or by gassing. In the first process,
pressurised water saturated with air is injected into the
flotation chamber (see Figure 16). The sudden reduction
in pressure leads to the formation of microbubbles. In the
second process air is directly injected via special nozzles
that produce small air bubbles. The first process pro-
duces smaller bubbles and is more commonly applied in
wastewater treatment. For any efficient flotation process
the addition of flotation agents
is necessary, which are compa-
rable to precipitating/floccu-
lating agents (see section
5.5.1). Apart from increasing
flock size and volume, also the
ability of the air bubbles to
attach to the flocks is enhanced.
5.5.3 Screens and filtersVibrating screens (see Fig-
ure 17) and vibrating curved
screens (see Figure 18) are
commonly applied in digestate
processing. The liquid fraction
of the digestate is applied on
the screen and any solid mate-
rial (screenings) remain on
top of the screen (and are con-
stantly removed), whereas the liquid passes through. In
order to prevent rapid clogging of the screens, they are
operated under vibration. Typical mesh sizes are 150 – 250
µm for vibrating screens and 100-300 µm for vibrating
curved sieves. However, too small mesh sizes can lead to
rapid clogging. Apart from screens, security filters are
also used which have the function of retaining larger
particles, e.g. prior to a membrane system, which have
accidentally passed previous solid–liquid separation
steps. As they have a different function than the screens,
the retained material is not constantly removed.
Figure 17: Vibrating screen (Source: Fuchs and Drosg, 2010)
Figure 18: Vibrating curved screen (Source: Fuchs and Drosg, 2010)
Nutrient Recovery Processing of the solid fraction
20
The solid fraction which accumulates in solid–liquid
separation shows TS concentrations in the range of
20 – 30 %. This fraction is partially stabilised so that
appropriate storage and direct application as biofertiliser
or soil improver on agricultural land is facilitated. Nev-
ertheless, this fraction still contains biodegradable mate-
rial, in other words microbial activity can still happen
and odour emissions can occur. If it is desired to obtain
a stable and marketable biofertiliser product, further
processing is necessary, which can be composting, dry-
ing or another form of stabilisation.
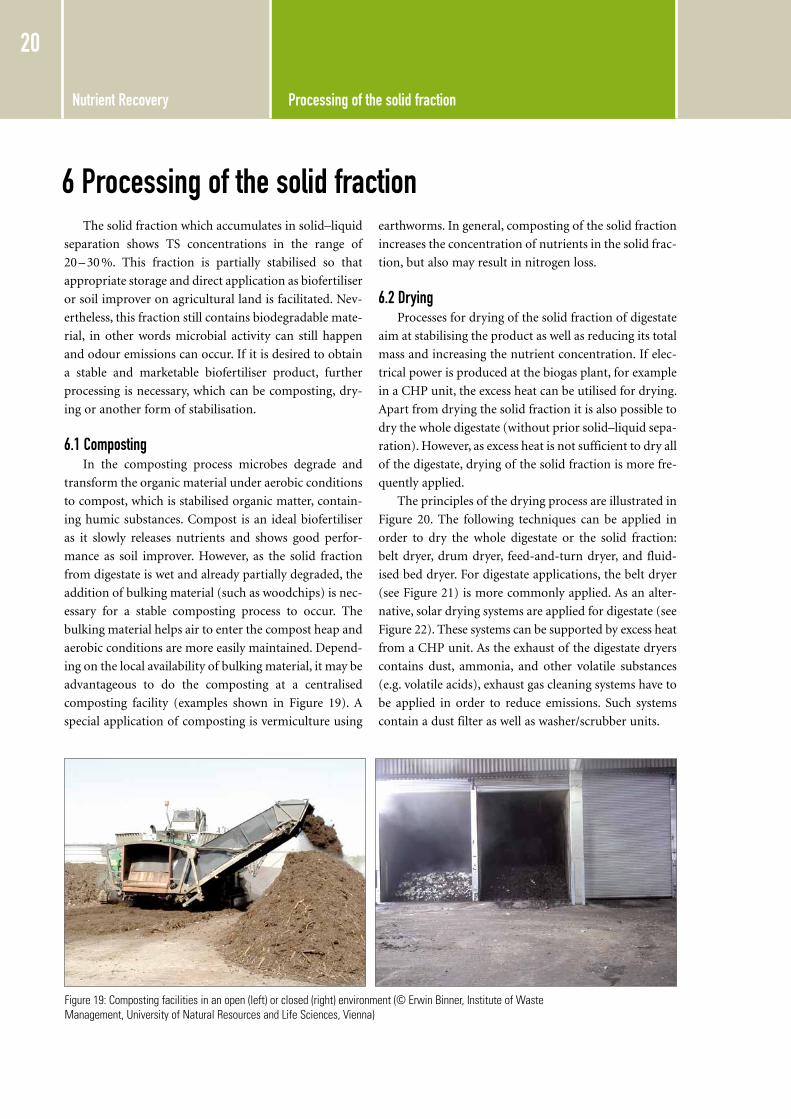
6.1 CompostingIn the composting process microbes degrade and
transform the organic material under aerobic conditions
to compost, which is stabilised organic matter, contain-
ing humic substances. Compost is an ideal biofertiliser
as it slowly releases nutrients and shows good perfor-
mance as soil improver. However, as the solid fraction
from digestate is wet and already partially degraded, the
addition of bulking material (such as woodchips) is nec-
essary for a stable composting process to occur. The
bulking material helps air to enter the compost heap and
aerobic conditions are more easily maintained. Depend-
ing on the local availability of bulking material, it may be
advantageous to do the composting at a centralised
composting facility (examples shown in Figure 19). A
special application of composting is vermiculture using
earthworms. In general, composting of the solid fraction
increases the concentration of nutrients in the solid frac-
tion, but also may result in nitrogen loss.
6.2 DryingProcesses for drying of the solid fraction of digestate
aim at stabilising the product as well as reducing its total
mass and increasing the nutrient concentration. If elec-
trical power is produced at the biogas plant, for example
in a CHP unit, the excess heat can be utilised for drying.
Apart from drying the solid fraction it is also possible to
dry the whole digestate (without prior solid–liquid sepa-
ration). However, as excess heat is not sufficient to dry all
of the digestate, drying of the solid fraction is more fre-
quently applied.
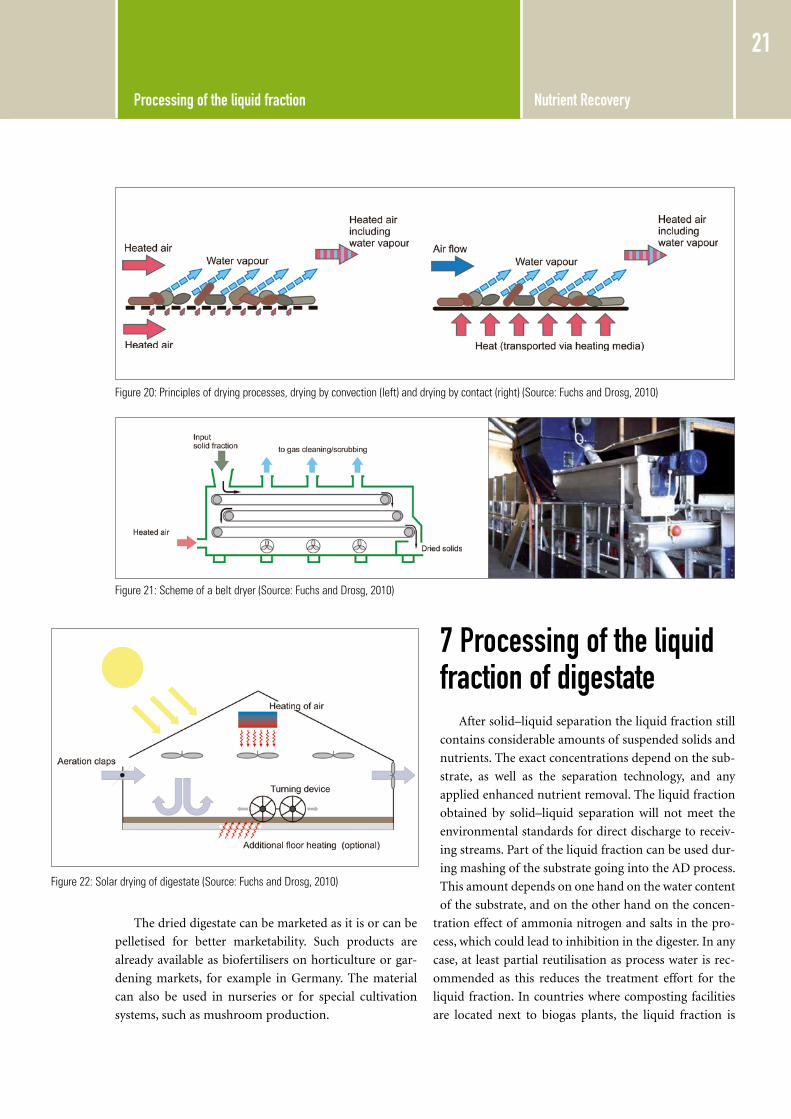
The principles of the drying process are illustrated in
Figure 20. The following techniques can be applied in
order to dry the whole digestate or the solid fraction:
belt dryer, drum dryer, feed-and-turn dryer, and fluid-
ised bed dryer. For digestate applications, the belt dryer
(see Figure 21) is more commonly applied. As an alter-
native, solar drying systems are applied for digestate (see
Figure 22). These systems can be supported by excess heat
from a CHP unit. As the exhaust of the digestate dryers
contains dust, ammonia, and other volatile substances
(e.g. volatile acids), exhaust gas cleaning systems have to
be applied in order to reduce emissions. Such systems
contain a dust filter as well as washer/scrubber units.
Figure 19: composting facilities in an open (left) or closed (right) environment (© Erwin Binner, Institute of Waste Management, University of Natural Resources and Life Sciences, Vienna)
6 Processing of the solid fraction
Nutrient Recovery Processing of the liquid fraction
21
The dried digestate can be marketed as it is or can be
pelletised for better marketability. Such products are
already available as biofertilisers on horticulture or gar-
dening markets, for example in Germany. The material
can also be used in nurseries or for special cultivation
systems, such as mushroom production.
7 Processing of the liquid fraction of digestate
After solid–liquid separation the liquid fraction still
contains considerable amounts of suspended solids and
nutrients. The exact concentrations depend on the sub-
strate, as well as the separation technology, and any
applied enhanced nutrient removal. The liquid fraction
obtained by solid–liquid separation will not meet the
environmental standards for direct discharge to receiv-
ing streams. Part of the liquid fraction can be used dur-
ing mashing of the substrate going into the AD process.
This amount depends on one hand on the water content
of the substrate, and on the other hand on the concen-
tration effect of ammonia nitrogen and salts in the pro-
cess, which could lead to inhibition in the digester. In any
case, at least partial reutilisation as process water is rec-
ommended as this reduces the treatment effort for the
liquid fraction. In countries where composting facilities
are located next to biogas plants, the liquid fraction is
Figure 20: Principles of drying processes, drying by convection (left) and drying by contact (right) (Source: Fuchs and Drosg, 2010)
Figure 21: Scheme of a belt dryer (Source: Fuchs and Drosg, 2010)
Figure 22: Solar drying of digestate (Source: Fuchs and Drosg, 2010)
Nutrient Recovery Processing of the liquid fraction
22
used to moisturise compost
heaps. In such cases, the
reduction of the ammonia
concentration is recom-
mended in order to reduce
ammonia emissions.
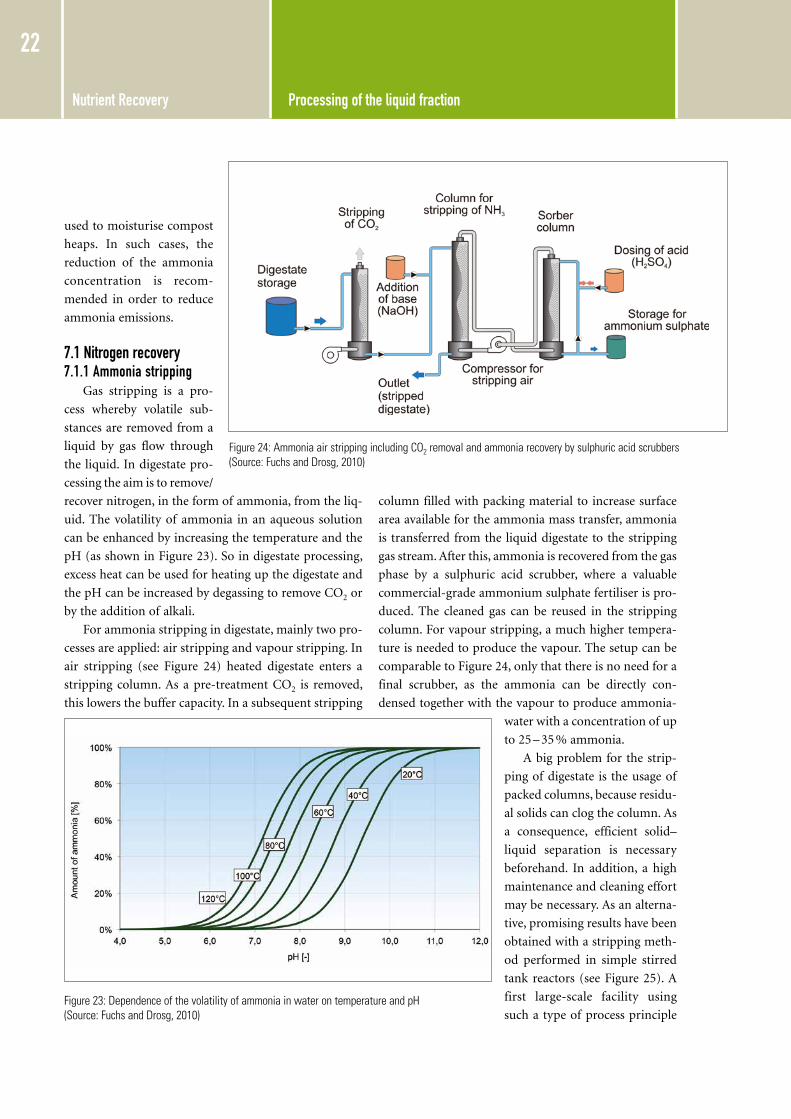
7.1 Nitrogen recovery 7.1.1 Ammonia stripping
Gas stripping is a pro-
cess whereby volatile sub-
stances are removed from a
liquid by gas flow through
the liquid. In digestate pro-
cessing the aim is to remove/
recover nitrogen, in the form of ammonia, from the liq-
uid. The volatility of ammonia in an aqueous solution
can be enhanced by increasing the temperature and the
pH (as shown in Figure 23). So in digestate processing,
excess heat can be used for heating up the digestate and
the pH can be increased by degassing to remove CO2 or
by the addition of alkali.
For ammonia stripping in digestate, mainly two pro-
cesses are applied: air stripping and vapour stripping. In
air stripping (see Figure 24) heated digestate enters a
stripping column. As a pre-treatment CO2 is removed,
this lowers the buffer capacity. In a subsequent stripping
column filled with packing material to increase surface
area available for the ammonia mass transfer, ammonia
is transferred from the liquid digestate to the stripping
gas stream. After this, ammonia is recovered from the gas
phase by a sulphuric acid scrubber, where a valuable
commercial-grade ammonium sulphate fertiliser is pro-
duced. The cleaned gas can be reused in the stripping
column. For vapour stripping, a much higher tempera-
ture is needed to produce the vapour. The setup can be
comparable to Figure 24, only that there is no need for a
final scrubber, as the ammonia can be directly con-
densed together with the vapour to produce ammonia-
water with a concentration of up
to 25 – 35 % ammonia.
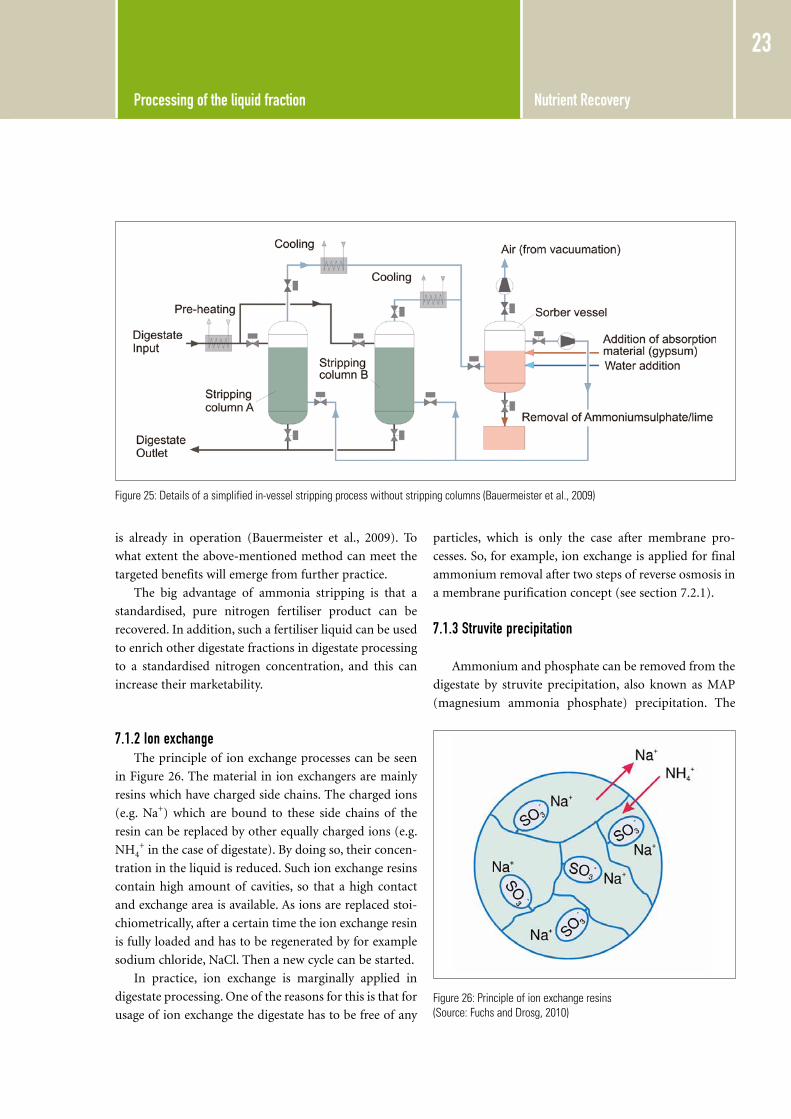
A big problem for the strip-
ping of digestate is the usage of
packed columns, because residu-
al solids can clog the column. As
a consequence, efficient solid–
liquid separation is necessary
beforehand. In addition, a high
maintenance and cleaning effort
may be necessary. As an alterna-
tive, promising results have been
obtained with a stripping meth-
od performed in simple stirred
tank reactors (see Figure 25). A
first large-scale facility using
such a type of process principle Figure 23: Dependence of the volatility of ammonia in water on temperature and ph (Source: Fuchs and Drosg, 2010)
Figure 24: Ammonia air stripping including co2 removal and ammonia recovery by sulphuric acid scrubbers (Source: Fuchs and Drosg, 2010)
Nutrient Recovery Processing of the liquid fraction
23
is already in operation (Bauermeister et al., 2009). To
what extent the above-mentioned method can meet the
targeted benefits will emerge from further practice.
The big advantage of ammonia stripping is that a
standardised, pure nitrogen fertiliser product can be
recovered. In addition, such a fertiliser liquid can be used
to enrich other digestate fractions in digestate processing
to a standardised nitrogen concentration, and this can
increase their marketability.
7.1.2 Ion exchangeThe principle of ion exchange processes can be seen
in Figure 26. The material in ion exchangers are mainly
resins which have charged side chains. The charged ions
(e.g. Na+) which are bound to these side chains of the
resin can be replaced by other equally charged ions (e.g.
NH4+ in the case of digestate). By doing so, their concen-
tration in the liquid is reduced. Such ion exchange resins
contain high amount of cavities, so that a high contact
and exchange area is available. As ions are replaced stoi-
chiometrically, after a certain time the ion exchange resin
is fully loaded and has to be regenerated by for example
sodium chloride, NaCl. Then a new cycle can be started.
In practice, ion exchange is marginally applied in
digestate processing. One of the reasons for this is that for
usage of ion exchange the digestate has to be free of any
particles, which is only the case after membrane pro-
cesses. So, for example, ion exchange is applied for final
ammonium removal after two steps of reverse osmosis in
a membrane purification concept (see section 7.2.1).
7.1.3 Struvite precipitation
Ammonium and phosphate can be removed from the
digestate by struvite precipitation, also known as MAP
(magnesium ammonia phosphate) precipitation. The
Figure 25: Details of a simplified in-vessel stripping process without stripping columns (Bauermeister et al., 2009)
Figure 26: Principle of ion exchange resins (Source: Fuchs and Drosg, 2010)

Nutrient Recovery Processing of the liquid fraction
24
reaction is described by the following equation:
In order to achieve best nutrient recovery perfor-
mance in practice, magnesium is added in excess so that
nutrient concentrations are approximately 1.3:1:0.9 for
Mg:N:P. As ammonia is almost always in excess in diges-
tate, magnesium oxide and phosphoric acid are added to
the digestate. In addition, pH is slightly increased to
8.5 – 9.0. The resulting struvite is a good fertiliser as N, P,
and Mg are valuable plant nutri-
ents. As illustrated in Figure 27,
the chemicals can be added either
in a first step with subsequent
separation by centrifugation, or
chemical addition and sedimen-
tation of the struvite crystals
occur in the same vessel.
The main disadvantage of
struvite precipitation is that a
large amount of chemicals are
needed, and this translates into high operational costs.
An alternative process can be to recover the chemicals, as
struvite releases ammonium and water after heating to
well above 100°C. The resulting magnesium hydrogen
phosphate can then be reused for precipitating ammo-
nium.
7.2 Nutrient concentration and water purification7.2.1 Membrane technologies
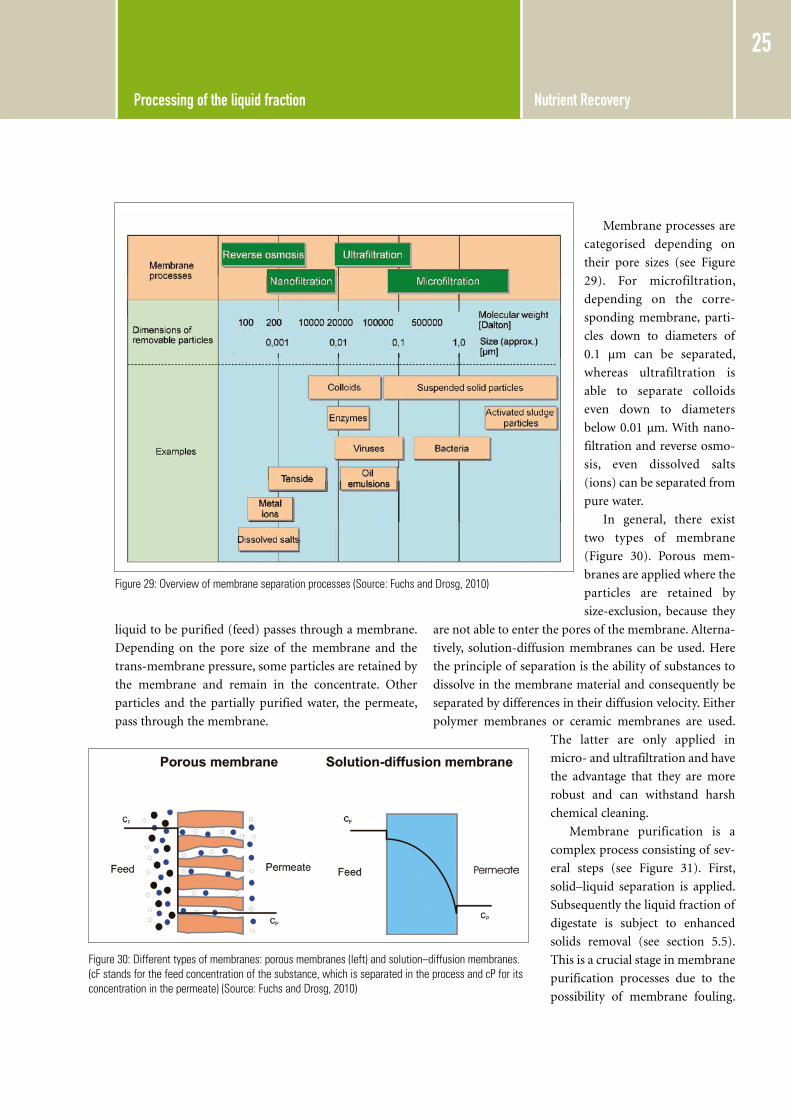
The principle of membrane processes is shown in
Figure 28. It is a physical separation process where the
Figure 27: Possible process options for struvite precipitation (adapted after Lehmkuhl, 1990)
Mg2+ + NH4+ + HPO4
2- + OH- + 5 H2O Mg NH4 PO4 · 6 H2O
Figure 28: Principle of membrane separation (Source: Fuchs and Drosg, 2010)
Nutrient Recovery Processing of the liquid fraction
25
liquid to be purified (feed) passes through a membrane.
Depending on the pore size of the membrane and the
trans-membrane pressure, some particles are retained by
the membrane and remain in the concentrate. Other
particles and the partially purified water, the permeate,
pass through the membrane.
Membrane processes are
categorised depending on
their pore sizes (see Figure
29). For microfiltration,
depending on the corre-
sponding membrane, parti-
cles down to diameters of
0.1 µm can be separated,
whereas ultrafiltration is
able to separate colloids
even down to diameters
below 0.01 µm. With nano-
filtration and reverse osmo-
sis, even dissolved salts
(ions) can be separated from
pure water.
In general, there exist
two types of membrane
(Figure 30). Porous mem-
branes are applied where the
particles are retained by
size-exclusion, because they
are not able to enter the pores of the membrane. Alterna-
tively, solution-diffusion membranes can be used. Here
the principle of separation is the ability of substances to
dissolve in the membrane material and consequently be
separated by differences in their diffusion velocity. Either
polymer membranes or ceramic membranes are used.
The latter are only applied in
micro- and ultrafiltration and have
the advantage that they are more
robust and can withstand harsh
chemical cleaning.
Membrane purification is a
complex process consisting of sev-
eral steps (see Figure 31). First,
solid–liquid separation is applied.
Subsequently the liquid fraction of
digestate is subject to enhanced
solids removal (see section 5.5).
This is a crucial stage in membrane
purification processes due to the
possibility of membrane fouling.
Figure 29: overview of membrane separation processes (Source: Fuchs and Drosg, 2010)
Figure 30: Different types of membranes: porous membranes (left) and solution–diffusion membranes. (cF stands for the feed concentration of the substance, which is separated in the process and cP for its concentration in the permeate) (Source: Fuchs and Drosg, 2010)

Nutrient Recovery Processing of the liquid fraction
26
Therefore, decanter centrifuges are usually used in the
first solid–liquid separation step, and often precipitating
agents are added enabling increased solids removal. The
next step is ultrafiltration and finally reverse osmosis is
used for removal of ammonia and COD
(organic matter expressed as the equiv-
alent chemical oxygen demand). Nor-
mally, three steps of reverse osmosis are
needed to reach discharge levels for
ammonia. The permeate quality,
depending on 2- or 3-step reverse
osmosis, is shown in Table 8. As an
alternative, the last reverse osmosis step
can be replaced by ion exchange.
A drawback of such membrane
purification processes is that only a lim-
ited amount of the digestate will be
purified water, about 50 % of the diges-
tate is accumulated as by-products. The
following fractions accumulate in the
process: solid fraction, ultrafiltration
retentate, reverse osmosis concentrate.
In order to reduce the amounts, the
ultrafiltration retentate is often recycled
into the biogas plant and/or the solid–
liquid separation step. Membrane puri-
fication is quite expensive and requires
a considerable amount of energy.
7.2.2 Evaporation The evaporation of digestate is only
interesting for biogas plants where excess heat is availa-
ble in sufficient amounts, or where excess heat from
other sources near the biogas plant can be used. As many
biogas plants are located in rural areas remotely from
Figure 31: Typical process steps for digestate processing by membrane purification (Source: Fuchs and Drosg, 2010)
Table 8: Examples of permeate quality after a 2-step reverse osmosis (Schulze und Block, 2005) and a 3-step reverse osmosis (Brüß, 2009)
Parameter Unit Two-step reverse osmosis
Three-step reverse osmosis
TS [mg/L] 0 0
coD [mg/L] 50 – 60 < 5
nh4-n [mg/L] 300 – 320 –
Tn [mg/L] 320 – 340 3.5
TP [mg/L] 53 < 0.05
Figure 32: Forced circulation evaporator (left) and natural circulation evaporator (right) (Source: Fuchs and Drosg, 2010)
Nutrient Recovery Processing of the liquid fraction
27
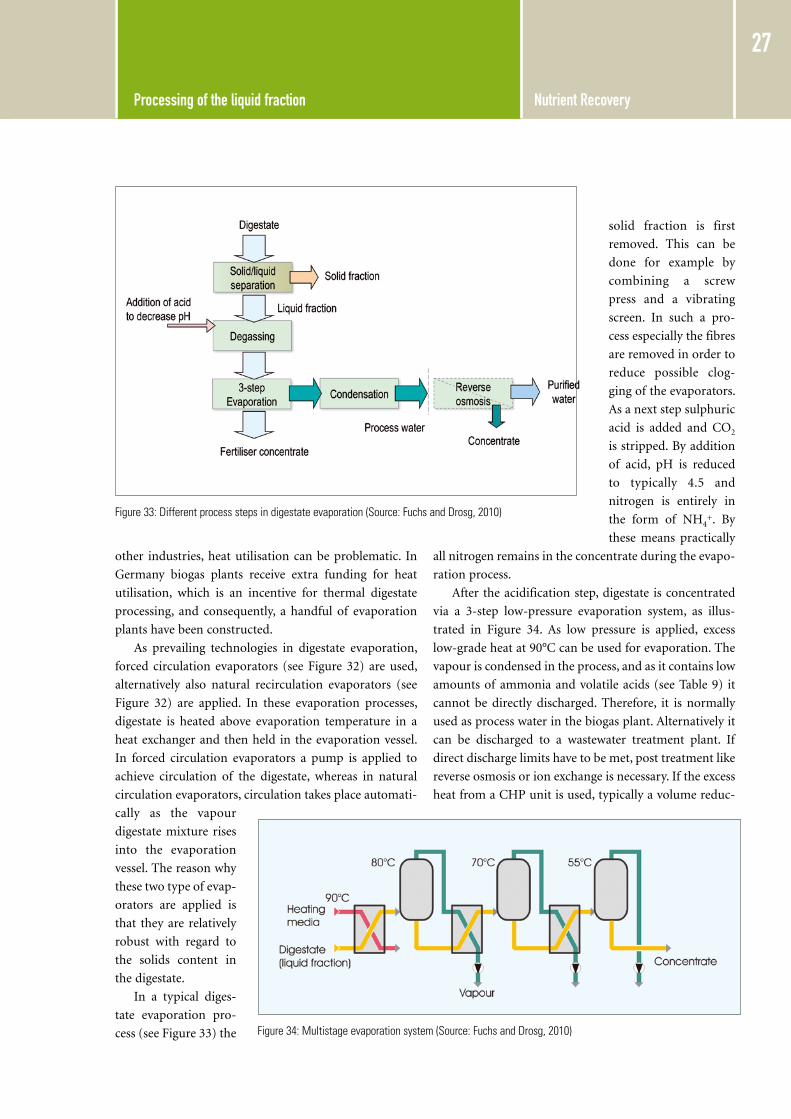
other industries, heat utilisation can be problematic. In
Germany biogas plants receive extra funding for heat
utilisation, which is an incentive for thermal digestate
processing, and consequently, a handful of evaporation
plants have been constructed.
As prevailing technologies in digestate evaporation,
forced circulation evaporators (see Figure 32) are used,
alternatively also natural recirculation evaporators (see
Figure 32) are applied. In these evaporation processes,
digestate is heated above evaporation temperature in a
heat exchanger and then held in the evaporation vessel.
In forced circulation evaporators a pump is applied to
achieve circulation of the digestate, whereas in natural
circulation evaporators, circulation takes place automati-
cally as the vapour
digestate mixture rises
into the evaporation
vessel. The reason why
these two type of evap-
orators are applied is
that they are relatively
robust with regard to
the solids content in
the digestate.
In a typical diges-
tate evaporation pro-
cess (see Figure 33) the
solid fraction is first
removed. This can be
done for example by
combining a screw
press and a vibrating
screen. In such a pro-
cess especially the fibres
are removed in order to
reduce possible clog-
ging of the evaporators.
As a next step sulphuric
acid is added and CO2
is stripped. By addition
of acid, pH is reduced
to typically 4.5 and
nitrogen is entirely in
the form of NH4+. By
these means practically
all nitrogen remains in the concentrate during the evapo-
ration process.
After the acidification step, digestate is concentrated
via a 3-step low-pressure evaporation system, as illus-
trated in Figure 34. As low pressure is applied, excess
low-grade heat at 90°C can be used for evaporation. The
vapour is condensed in the process, and as it contains low
amounts of ammonia and volatile acids (see Table 9) it
cannot be directly discharged. Therefore, it is normally
used as process water in the biogas plant. Alternatively it
can be discharged to a wastewater treatment plant. If
direct discharge limits have to be met, post treatment like
reverse osmosis or ion exchange is necessary. If the excess
heat from a CHP unit is used, typically a volume reduc-
Figure 33: Different process steps in digestate evaporation (Source: Fuchs and Drosg, 2010)
Figure 34: Multistage evaporation system (Source: Fuchs and Drosg, 2010)
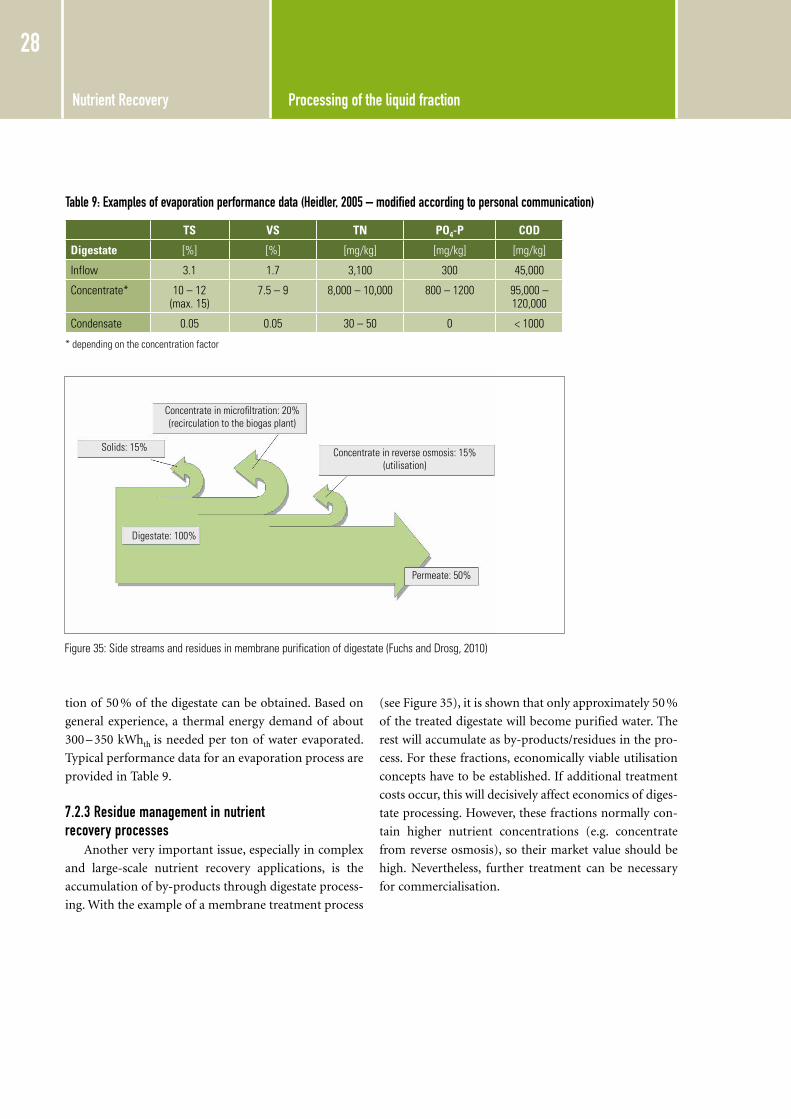
Nutrient Recovery Processing of the liquid fraction
28
tion of 50 % of the digestate can be obtained. Based on
general experience, a thermal energy demand of about
300 – 350 kWhth is needed per ton of water evaporated.
Typical performance data for an evaporation process are
provided in Table 9.
7.2.3 Residue management in nutrient recovery processes
Another very important issue, especially in complex
and large-scale nutrient recovery applications, is the
accumulation of by-products through digestate process-
ing. With the example of a membrane treatment process
(see Figure 35), it is shown that only approximately 50 %
of the treated digestate will become purified water. The
rest will accumulate as by-products/residues in the pro-
cess. For these fractions, economically viable utilisation
concepts have to be established. If additional treatment
costs occur, this will decisively affect economics of diges-
tate processing. However, these fractions normally con-
tain higher nutrient concentrations (e.g. concentrate
from reverse osmosis), so their market value should be
high. Nevertheless, further treatment can be necessary
for commercialisation.
Table 9: Examples of evaporation performance data (Heidler, 2005 – modified according to personal communication)
TS VS TN PO4-P COD
Digestate [%] [%] [mg/kg] [mg/kg] [mg/kg]
Inflow 3.1 1.7 3,100 300 45,000
concentrate* 10 – 12 (max. 15)
7.5 – 9 8,000 – 10,000 800 – 1200 95,000 – 120,000
condensate 0.05 0.05 30 – 50 0 < 1000
* depending on the concentration factor
Figure 35: Side streams and residues in membrane purification of digestate (Fuchs and Drosg, 2010)
Digestate: 100%
Permeate: 50%
Solids: 15%
concentrate in microfiltration: 20%(recirculation to the biogas plant)
concentrate in reverse osmosis: 15%(utilisation)
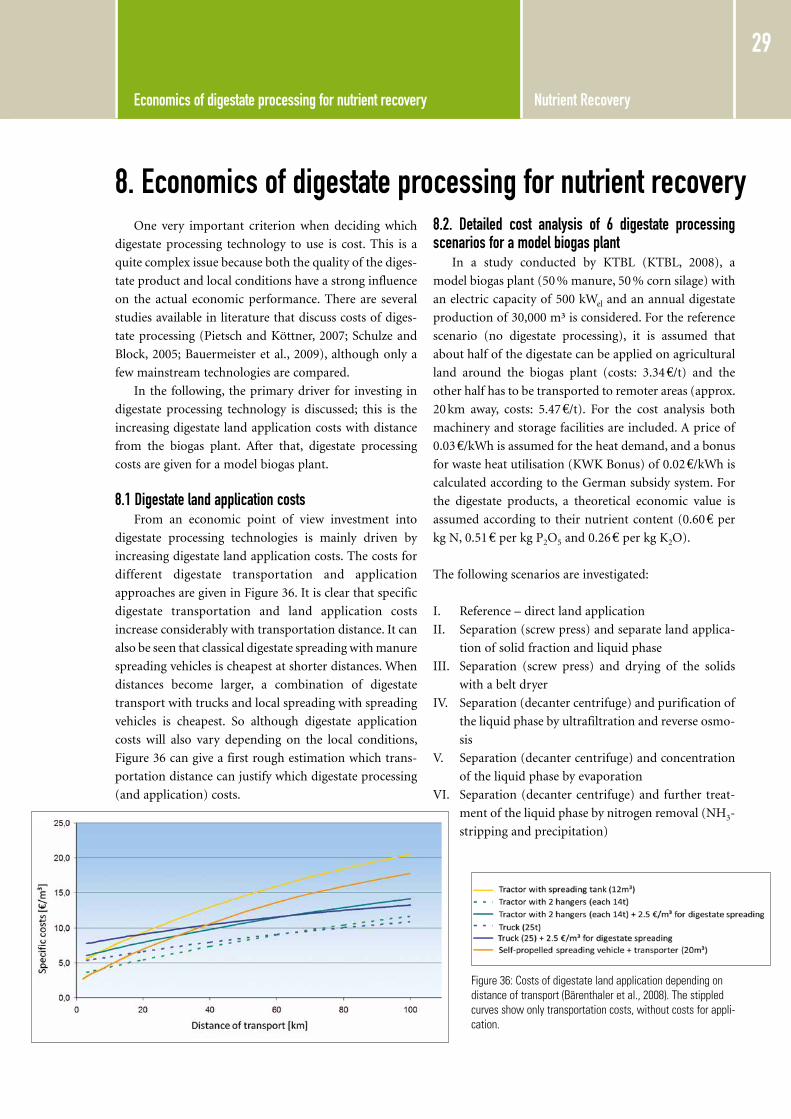
Nutrient Recovery Economics of digestate processing for nutrient recovery
29
One very important criterion when deciding which
digestate processing technology to use is cost. This is a
quite complex issue because both the quality of the diges-
tate product and local conditions have a strong influence
on the actual economic performance. There are several
studies available in literature that discuss costs of diges-
tate processing (Pietsch and Köttner, 2007; Schulze and
Block, 2005; Bauermeister et al., 2009), although only a
few mainstream technologies are compared.
In the following, the primary driver for investing in
digestate processing technology is discussed; this is the
increasing digestate land application costs with distance
from the biogas plant. After that, digestate processing
costs are given for a model biogas plant.
8.1 Digestate land application costsFrom an economic point of view investment into
digestate processing technologies is mainly driven by
increasing digestate land application costs. The costs for
different digestate transportation and application
approaches are given in Figure 36. It is clear that specific
digestate transportation and land application costs
increase considerably with transportation distance. It can
also be seen that classical digestate spreading with manure
spreading vehicles is cheapest at shorter distances. When
distances become larger, a combination of digestate
transport with trucks and local spreading with spreading
vehicles is cheapest. So although digestate application
costs will also vary depending on the local conditions,
Figure 36 can give a first rough estimation which trans-
portation distance can justify which digestate processing
(and application) costs.
8.2. Detailed cost analysis of 6 digestate processing scenarios for a model biogas plant
In a study conducted by KTBL (KTBL, 2008), a
model biogas plant (50 % manure, 50 % corn silage) with
an electric capacity of 500 kWel and an annual digestate
production of 30,000 m³ is considered. For the reference
scenario (no digestate processing), it is assumed that
about half of the digestate can be applied on agricultural
land around the biogas plant (costs: 3.34 €/t) and the
other half has to be transported to remoter areas (approx.
20 km away, costs: 5.47 €/t). For the cost analysis both
machinery and storage facilities are included. A price of
0.03 €/kWh is assumed for the heat demand, and a bonus
for waste heat utilisation (KWK Bonus) of 0.02 €/kWh is
calculated according to the German subsidy system. For
the digestate products, a theoretical economic value is
assumed according to their nutrient content (0.60 € per
kg N, 0.51 € per kg P2O5 and 0.26 € per kg K2O).
The following scenarios are investigated:
I. Reference – direct land application
II. Separation (screw press) and separate land applica-
tion of solid fraction and liquid phase
III. Separation (screw press) and drying of the solids
with a belt dryer
IV. Separation (decanter centrifuge) and purification of
the liquid phase by ultrafiltration and reverse osmo-
sis
V. Separation (decanter centrifuge) and concentration
of the liquid phase by evaporation
VI. Separation (decanter centrifuge) and further treat-
ment of the liquid phase by nitrogen removal (NH3-
stripping and precipitation)
8. Economics of digestate processing for nutrient recovery
Figure 36: costs of digestate land application depending on distance of transport (Bärenthaler et al., 2008). The stippled curves show only transportation costs, without costs for appli-cation.
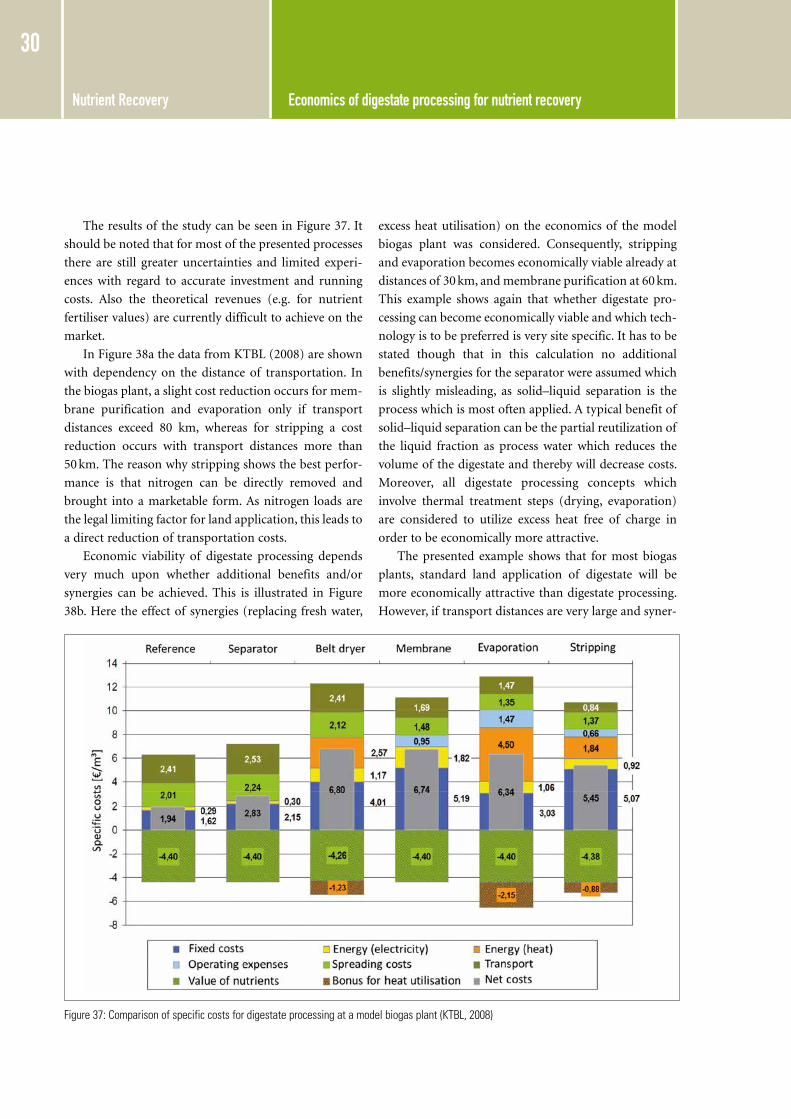
Nutrient Recovery Economics of digestate processing for nutrient recovery
30
The results of the study can be seen in Figure 37. It
should be noted that for most of the presented processes
there are still greater uncertainties and limited experi-
ences with regard to accurate investment and running
costs. Also the theoretical revenues (e.g. for nutrient
fertiliser values) are currently difficult to achieve on the
market.
In Figure 38a the data from KTBL (2008) are shown
with dependency on the distance of transportation. In
the biogas plant, a slight cost reduction occurs for mem-
brane purification and evaporation only if transport
distances exceed 80 km, whereas for stripping a cost
reduction occurs with transport distances more than
50 km. The reason why stripping shows the best perfor-
mance is that nitrogen can be directly removed and
brought into a marketable form. As nitrogen loads are
the legal limiting factor for land application, this leads to
a direct reduction of transportation costs.
Economic viability of digestate processing depends
very much upon whether additional benefits and/or
synergies can be achieved. This is illustrated in Figure
38b. Here the effect of synergies (replacing fresh water,
excess heat utilisation) on the economics of the model
biogas plant was considered. Consequently, stripping
and evaporation becomes economically viable already at
distances of 30 km, and membrane purification at 60 km.
This example shows again that whether digestate pro-
cessing can become economically viable and which tech-
nology is to be preferred is very site specific. It has to be
stated though that in this calculation no additional
benefits/synergies for the separator were assumed which
is slightly misleading, as solid–liquid separation is the
process which is most often applied. A typical benefit of
solid–liquid separation can be the partial reutilization of
the liquid fraction as process water which reduces the
volume of the digestate and thereby will decrease costs.
Moreover, all digestate processing concepts which
involve thermal treatment steps (drying, evaporation)
are considered to utilize excess heat free of charge in
order to be economically more attractive.
The presented example shows that for most biogas
plants, standard land application of digestate will be
more economically attractive than digestate processing.
However, if transport distances are very large and syner-
Figure 37: comparison of specific costs for digestate processing at a model biogas plant (kTBL, 2008)
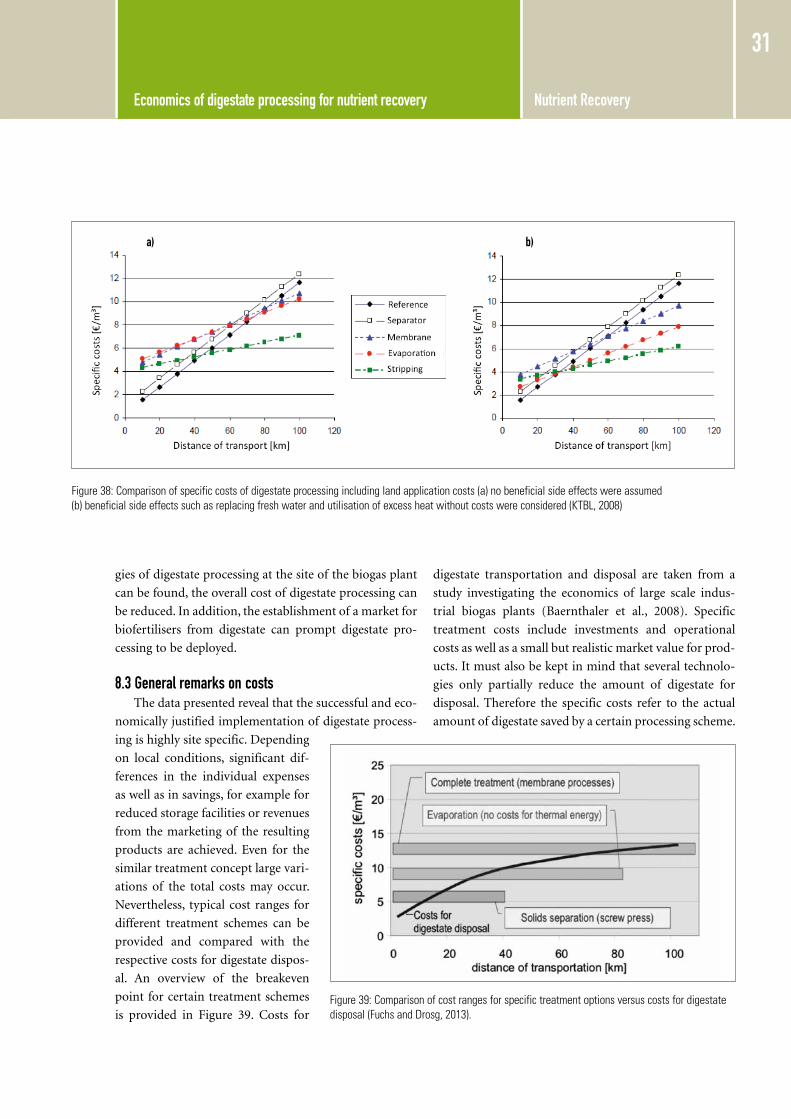
Nutrient Recovery Economics of digestate processing for nutrient recovery
31
gies of digestate processing at the site of the biogas plant
can be found, the overall cost of digestate processing can
be reduced. In addition, the establishment of a market for
biofertilisers from digestate can prompt digestate pro-
cessing to be deployed.
8.3 General remarks on costsThe data presented reveal that the successful and eco-
nomically justified implementation of digestate process-
ing is highly site specific. Depending
on local conditions, significant dif-
ferences in the individual expenses
as well as in savings, for example for
reduced storage facilities or revenues
from the marketing of the resulting
products are achieved. Even for the
similar treatment concept large vari-
ations of the total costs may occur.
Nevertheless, typical cost ranges for
different treatment schemes can be
provided and compared with the
respective costs for digestate dispos-
al. An overview of the breakeven
point for certain treatment schemes
is provided in Figure 39. Costs for
digestate transportation and disposal are taken from a
study investigating the economics of large scale indus-
trial biogas plants (Baernthaler et al., 2008). Specific
treatment costs include investments and operational
costs as well as a small but realistic market value for prod-
ucts. It must also be kept in mind that several technolo-
gies only partially reduce the amount of digestate for
disposal. Therefore the specific costs refer to the actual
amount of digestate saved by a certain processing scheme.
Figure 38: comparison of specific costs of digestate processing including land application costs (a) no beneficial side effects were assumed (b) beneficial side effects such as replacing fresh water and utilisation of excess heat without costs were considered (kTBL, 2008)
Figure 39: comparison of cost ranges for specific treatment options versus costs for digestate disposal (Fuchs and Drosg, 2013).
a) b)
Nutrient Recovery Concluding remarks and recommendations
32
As defined in this report, digestate is the liquid efflu-
ent from anaerobic digestion (AD) of animal manures
(slurries, solid manure, deep litter), organic residues and
wastes, and energy crops. If treated appropriately diges-
tate possesses excellent agricultural fertiliser qualities.
The AD process is primarily applied with the aim of
generating renewable energy in the form of biogas, and
with respect to the substrates handled, to improve nutri-
ent management, strengthen veterinary safety and to
facilitate air quality/odour control when applying
manure to farmland.
In many countries, environmental regulations con-
cerning manure/digestate management restrict the
nutrient input per hectare as well as the period for nutri-
ent application. This imposes considerable costs for
farmers for seasonal storage, transport from stables to
storage tanks, handling, and application of digestate as
biofertiliser. The costs are significant due to the large
volume and low nutrient concentration in digestate.
Further costs are related to investments in digestate stor-
age capacities required by environmental regulations in
many countries. Volume reduction both reduces trans-
port and application costs and facilitates export of excess
nutrients to nutrient deficient areas. This requires diges-
tate to be further processed after being removed from
the digester.
Digestate processing involves the application of a
range of possible technologies to digestate, comparable
to the existing technologies for manure processing, sew-
age sludge treatment, and, in some cases, for wastewater
treatment. The last decades have seen a trend of increased
emphasis on improved sustainability in agriculture and
preservation of natural resources like minerals phospho-
rus and potassium, consequently changing the focus of
digestate processing from nutrient removal and disposal
towards integrated nutrient recovery and recycling. This
trend needs to be continued.
Digestate processing, as described by this report, can
be partial, usually targeting volume reduction and sepa-
ration of digestate into a liquid and a solid fraction, or it
can be complete, refining digestate to for example pure
water, a solid biofertiliser fraction and fertiliser concen-
trates. The first step in digestate processing is to separate
the solid from the liquid. The solid fraction, often rich in
phosphorus, can subsequently be directly applied as
biofertiliser in agriculture or it can be composted or
dried for intermediate storage and feasible long-range
transport. For nutrient recovery, various methods and
technologies are currently available, with various degrees
of technical maturity. Of these, membrane technologies,
such as nanofiltration and ultrafiltration, followed by
reverse osmosis are increasingly applied. The end-prod-
ucts of membrane filtration consist of a nutrient con-
centrate and purified process water.
While partial processing using relatively simple sol-
id–liquid separation technologies (decanter centrifuge,
screw press etc.) are considered comparatively inexpen-
sive, complete processing requires far more sophisticated
process equipment and often has a high specific energy
consumption, which implies high additional costs.
The techniques for nutrient recovery from digestate
are developing rapidly, aiming to improve nutrient man-
agement in agriculture and in waste treatment systems.
In parallel, there is a general need to increase the degree
of commercialisation of organic fertilisers from digestate
processing through product standardisation.
9. Concluding remarks and recommendations
Nutrient Recovery References
33
AL SEADI, T. LUKEHURST, C. (2012). Quality management of diges-tate from biogas plants used as fertilizer. IEA Bioenergy Task 37 publication. Available from: http://www.iea-biogas.net/technical-brochures.html.
ANGELIDAKI, I. and ELLEGAARD, L. (2003). Codigestion of manure and organic wastes in centralized biogas plants: Status and future trends. Applied Biochemistry and Biotechnology - Part A Enzyme Engineering and Biotechnology 109(1-3), 95-105.
ARBOR ( 2013). Inventory: Techniques for nutrient recovery from diges-tate. Available from: http://arbornwe.eu/downloads (www.arbornwe.eu)
BÄRNTHALER, J., BERGMANN, H., DROSG, B., HORNBACHNER, D., KIRCHMAYR, R., KONRAD, G. and RESCH, Ch. (2008). Tech-nologie, Logistik und Wirtschaftlichkeit von Biogas-Großanlagen auf Basis industrieller biogener Abfälle (Technology, logistics and eco-nomic feasibility of industrial-scale biogas plants based on indus-trial biogenic by-products). Final project report. Available from: http://www.biogas-netzeinspeisung.at/downloads/200811_biogas-grossanlagen.pdf
BAUER, A. MAYR, H., HOPFNER-SIXT, K., AMON, T. (2009). Detailed monitoring of two biogas plants and mechanical solid–liq-uid separation of fermentation residues, Journal of Biotechnology 142, 56-63.
BAUERMEISTER, U., WILD, A., MEIER, T. (2009). Stickstoffabtren-nung mit dem ANAstrip-Verfahren System GNS (Nitrogen removal by the ANAstrip process system GNS), Gülzower Fachgespräche, Band 30: Gärrestaufbereitung für eine pflanzliche Nutzung – Stand und F&E Bedarf, pp. 78-96.
BGK e.V. (2012). Novelle der Düngemittelverordnung verabschiedet. Bundesgütegemeinschaft Kompost e.V. Available from: http://www.kompost.de/uploads/media/Novelle_der_Duengemittelver-ordnung_verabschiedet.pdf
BIOTECVISIONS (2012). January. Biotechnology Journal, 7: n/a. doi: 10.1002/biot.201100482.
BOJESEN, M., BOERBOOM, L., SKOV-PETERSEN, H. (2014). Towards a sustainable capacity expansion of the Danish biogas sec-tor. IFRO Working Paper 2014 / 03, p12.
BRÜß, U. (2009). Totalaufbereitung von Gärresten aus Biogasanlagen, Gülzower Fachgespräche, Band 30: Gärrestaufbereitung für eine pflanzliche Nutzung - Stand und F&E Bedarf, Seiten 96-116. Avail-able from: http://www.fnr-server.de/ftp/pdf/literatur/pdf_365-index.htm
CAMARERO, L., DIAZ, J.M., ROMERO, F. (1996). Final treatments for anaerobically digested piggery slurry effluents, Biomass and Bioen-ergy 11(6), 483-489
CASTELBLANQUE, J., SALIMBENI, F. (1999). Application of mem-brane systems for COD removal and reuse of waste water from anaerobic digestors, Desalination 126(1-3), 293-300.
CHANTIGNY, M. H., ANGERS, D. A., ROCHETTE, P., BEL-ANGER, G., (2007). Gaseous nitrogen emissions and forage nitrogen uptake on soils fertilized with raw and treated swine manure. J.Environ. Qual. 2007(36), 1864-1872.
DANETV (2010). Verification Statement for GEA Westfalia decanter centrifuge for post-treatment of digested biomass. The Danish Cen-tre for Verification of Climate and Environmental Technologies (DANETV). AgroTech Verification Centre. Available from: www.etv-denmark.com, 4 pp.
DILTZ, R.A., MAROLLA, T.V., HENLEY, M.V., LI, L. (2007). Reverse osmosis processing of organic model compounds and fermentation broths, Bioresource Technology 98(3), 686-695.
ENVO GROUP, (2014). unpublished data.
FAKHRU’L-RAZI, A. (1994). Ultrafiltration membrane separation for anaerobic wastewater treatment, Water Science and Technology, 30(12), 321-327.
FOUDA, S. (2011). Nitrogen availability of biogas residues. Ph.D. Thesis, Technische Universität München, 2011.
FUCHS, W. and DROSG, B. (2010). Technologiebewertung von Gär-restbehandlungs- und Verwertungskonzepten, Eigenverlag der Uni-versität für Bodenkultur Wien; ISBN: 978-3-900962-86-9
FUCHS, W. and DROSG, B. (2013). Assessment of the state of the art of technologies for the processing of digestate residue from anaerobic digesters. Water Sci Technol. 2013, 67(9), 1984-1993
HEIDLER, B. (2005). Gärrestaufbereitung durch Separierung und Ein-dampfung, 2, Norddeutsche Biogastagung 10.-11.06.2005, Hildesheim, Germany.
HENRIKSSON, G. (2010). The environmental effects of polymers in the biogas process, what does the research show? Available from: www.wasterefinery.se/sv/project/projects/miljoeffekt_polymerer/Docu-ments/WR33_avslut_popul%C3%A4r%20sammanfatt%20eng.pdf
HJORTH, M., CHRISTENSEN, K.V., CHRISTENSEN, M.L., SOM-MER, S.G., (2010). Solid–liquid separation of animal slurry in the-ory and practice. A review. Agron. Sustain. Dev., 2010(30), 153–180.
HOLM-NIELSEN, J., HALBERG, N., HUTINGFORD, S., AL SEADI, T., (1997). Joint Biogas Plants. Agricultural advantages-circulation of N, P, and K. Report made for the Danish Energy Agency. Second Edition, August 1997.
JØRGENSEN, P.J. (2009). Biogas - grøn energi, ISBN 978-87-992243-1-3, 32 p.
KERN, J., HEINZMANN, B., MARKUS, B., KAUFMANN, A.-C.,. SOETHE, N., ENGELS, C. (2008). Recycling and Assessment of Struvite Phosphorus from Sewage Sludge. Agricultural Engineering International. CIGR Journal, Volume X (2008). Available from: http://www.cigrjournal.org/index.php/Ejounral/article/view/1071
10. References
Nutrient Recovery References
34
KLINK, G., SALEWSKI, C., BOLDUAN, P. (2007). Vom Gärrest zum Nährstoffkonzentrat (From digestate to nutrient concentrate), Ver-fahrenstechnik 10, 46-47
KTBL, (2008). Umweltgerechte, innovative Verfahren zur Abtrennung von Nährstoffen aus Gülle und Gärrückständen - Technologischer Stand, Perspektiven und Entwicklungsmöglichkeiten. Studie im Auftrag der Deutschen Bundesstiftung Umwelt, erstellt durch das Kuratorium für Technik und Bauwesen in der Landwirtschaft (KTBL), Darm-stadt, D, in Zusammenarbeit mit dem Institut für Technologie und Biosystemtechnik der Bundesforschungsanstalt für Landwirtschaft (FAL), Braunschweig, D (only in German).
LEHMKUHL, J. (1990). Verfahren für die Ammonium-Elimination, wlb Wasser Luft Boden 11-12 (1990): 46-48.
MADSEN, M., HOLM-NIELSEN, J.B., ESBENSEN, K.H. (2011). Moni-toring of anaerobic digestion processes: A review perspective. Renewable and Sustainable Energy Reviews, 15(6), 3141-3155.
MARTI, N., BOUZAS, A., SECO, A., FERRER, J. (2008). Struvite precipi-tation assessment in anaerobic digestion processes, Chemical Engineer-ing Journal, 14(1-3), 67-74.
MEIXNER, K., FUCHS, W., VALKOVA, T., SVARDAL, K., LODERER, C., NEUREITER, M., BOCHMANN, G., DROSG, B. (2015). Effect of precipitating agents on centrifugation and ultrafiltration performance of thin stillage digestate. SEP PURIF TECHNOL. 2015; 145: 154-160.
MØLLER, H.B. (2001). Anaerobic digestion and separation of livestock slurry - Danish experiences, Report to MATRESA 2nd edition, Danish Inst. Of Agricultural Sciences, Bygholm Research Centre, Horsens, Denmark.
MÖLLER, K., STINNER, W., DEUKER, A., LEITHOLD, G., (2008). Effects of different manuring systems with and without biogas digestion on nitrogen cycle and crop yield in mixed organic dairy farming sys-tems. Nutr. Cycl. Agroecosys., 82, 209– 232.
NESET, T.S., CORDELL, D. (2012). Global phosphorus scarcity: identifying synergies for a sustainable future; J. Sci. Food Agric., 92: 2-6.
PIETSCH, K., KÖTTNER, M. (2007). Gärrestaufbereitung – Ziele, Meth-oden, Kosten. 6. Rottaler Biomasse Fachgespräch. Biomasse – Kosten-faktor Nr.1 in der Biogasanlage, 30.03.2007, Rottersdorf, D. Available from: http://www.biogas-infoboard.de/pdf/Seiten61-67%20aus%206.%20Rottaler%20Biom.%20Fachtagung_200%20dpi-6.pdf
RESCH, C., BRAUN, R., KIRCHMAYR, R. (2008). The influence of energy crop substrates on the mass-flow analysis and the residual methane potential at a rural anaerobic digestion plant. Water Science and Tech-nology, 57(1), 73-81.
SÁNCHEZ, E., MILÁN, Z., BORJA, R., WEILAND, P., RODRIGUEZ, X. (1995). Piggery waste treatment by anaerobic digestion and nutrient removal by ionic exchange, Resources, Conservation and Recycling, 15(3-4), 235-244.
SCHULZE, D., BLOCK, R. (2005). Ökologische und ökonomische Bewer-tung von Fermenterabwasseraufbereitungs-systemen auf der Basis von Praxisversuchen und Modellkalkulationen für das Betreiben von Biogasanlagen. Projektbericht des Gartenbauzentrums Straelen der
Landwirtschaftskammer Nordrhein-Westfalen, Straelen, D. Available from: http://www.lvg-straelen-lwkr.de/biogas/projektbericht-gaer-restaufbereitung-05.pdf
SIEGRIST, H., HUNZIKER, W., HOFER, H. (2005). Anaerobic digestion of slaughterhouse waste with UF-membrane separation and recycling of permeate after free ammonia stripping, Water Science & Technology, 52(1-2), 531-536.
TAMBONE, F., SCAGLIA, B., D’IMPORZANO, G., SCHIEVANO, A. ORZI, V. SALATI, S. ADANI, F. (2010). Assessing amendment and fertilizing properties of digestates from anaerobic digestion through a comparative study with digested sludge and compost. Chemosphere 2010 (81), 577–583.
ULUDAG-DEMIRER, S., DEMIRER, G.N., CHEN, S. (2005). Ammonia removal from anaerobically digested dairy manure by struvite precipi-tation. Process Biochemistry 40(12), 3667-3674.
VANEECKHAUTE, C., GHEKIERE, G., MICHELS, E., VAN-ROLLEGHEM, P. A., MEERS, E., TACK, F. (2013). Nutrient recovery from bio-digestion waste water streams and re-use as renewable fertiliz-ers. WEF/IWA Nutrient Removal and Recovery, Presented at the WEF/IWA Nutrient Removal and Recovery 2013: Trends in resource recovery and use, Water Environment Federation (WEF); Interna-tional Water Association (IWA).
WEILAND, P. (2008). Gärrestaufbereitung. 17. Symposium Bioenergie, 20.-21.11.2008, Kloster Banz, Bad Staffelstein, Germany.
WENDLAND, M., (2009). Biogasgärreste: Einsatz von Gärresten aus der Biogasproduktion als Düngemittel, Bayerische Landesanstalt für Landwirtschaft, Germany
WRAP (2012). Enhancement and treatment of digestates from anaerobic digestion. Available from: http://www.wrap.org.uk/node/13207
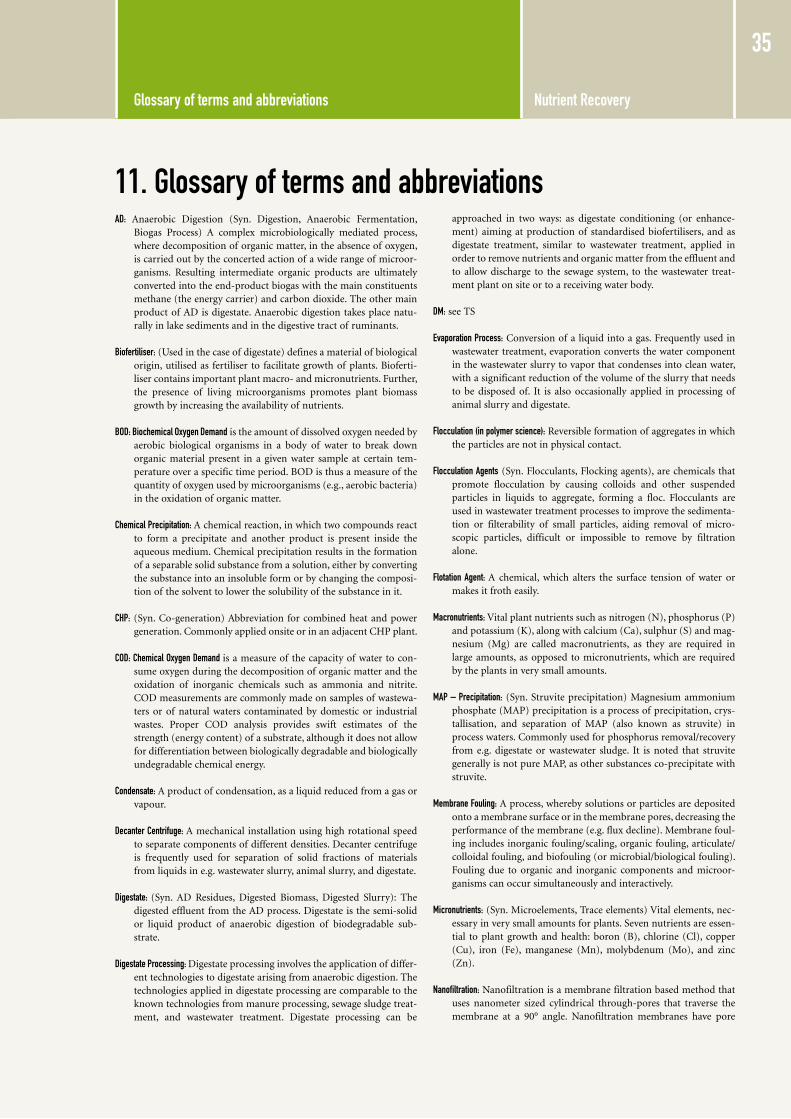
Nutrient Recovery Glossary of terms and abbreviations
35
AD: Anaerobic Digestion (Syn. Digestion, Anaerobic Fermentation, Biogas Process) A complex microbiologically mediated process, where decomposition of organic matter, in the absence of oxygen, is carried out by the concerted action of a wide range of microor-ganisms. Resulting intermediate organic products are ultimately converted into the end-product biogas with the main constituents methane (the energy carrier) and carbon dioxide. The other main product of AD is digestate. Anaerobic digestion takes place natu-rally in lake sediments and in the digestive tract of ruminants.
Biofertiliser: (Used in the case of digestate) defines a material of biological origin, utilised as fertiliser to facilitate growth of plants. Bioferti-liser contains important plant macro- and micronutrients. Further, the presence of living microorganisms promotes plant biomass growth by increasing the availability of nutrients.
BOD: Biochemical Oxygen Demand is the amount of dissolved oxygen needed by aerobic biological organisms in a body of water to break down organic material present in a given water sample at certain tem-perature over a specific time period. BOD is thus a measure of the quantity of oxygen used by microorganisms (e.g., aerobic bacteria) in the oxidation of organic matter.
Chemical Precipitation: A chemical reaction, in which two compounds react to form a precipitate and another product is present inside the aqueous medium. Chemical precipitation results in the formation of a separable solid substance from a solution, either by converting the substance into an insoluble form or by changing the composi-tion of the solvent to lower the solubility of the substance in it.
CHP: (Syn. Co-generation) Abbreviation for combined heat and power generation. Commonly applied onsite or in an adjacent CHP plant.
COD: Chemical Oxygen Demand is a measure of the capacity of water to con-sume oxygen during the decomposition of organic matter and the oxidation of inorganic chemicals such as ammonia and nitrite. COD measurements are commonly made on samples of wastewa-ters or of natural waters contaminated by domestic or industrial wastes. Proper COD analysis provides swift estimates of the strength (energy content) of a substrate, although it does not allow for differentiation between biologically degradable and biologically undegradable chemical energy.
Condensate: A product of condensation, as a liquid reduced from a gas or vapour.
Decanter Centrifuge: A mechanical installation using high rotational speed to separate components of different densities. Decanter centrifuge is frequently used for separation of solid fractions of materials from liquids in e.g. wastewater slurry, animal slurry, and digestate.
Digestate: (Syn. AD Residues, Digested Biomass, Digested Slurry): The digested effluent from the AD process. Digestate is the semi-solid or liquid product of anaerobic digestion of biodegradable sub-strate.
Digestate Processing: Digestate processing involves the application of differ-ent technologies to digestate arising from anaerobic digestion. The technologies applied in digestate processing are comparable to the known technologies from manure processing, sewage sludge treat-ment, and wastewater treatment. Digestate processing can be
approached in two ways: as digestate conditioning (or enhance-ment) aiming at production of standardised biofertilisers, and as digestate treatment, similar to wastewater treatment, applied in order to remove nutrients and organic matter from the effluent and to allow discharge to the sewage system, to the wastewater treat-ment plant on site or to a receiving water body.
DM: see TS
Evaporation Process: Conversion of a liquid into a gas. Frequently used in wastewater treatment, evaporation converts the water component in the wastewater slurry to vapor that condenses into clean water, with a significant reduction of the volume of the slurry that needs to be disposed of. It is also occasionally applied in processing of animal slurry and digestate.
Flocculation (in polymer science): Reversible formation of aggregates in which the particles are not in physical contact.
Flocculation Agents (Syn. Flocculants, Flocking agents), are chemicals that promote flocculation by causing colloids and other suspended particles in liquids to aggregate, forming a floc. Flocculants are used in wastewater treatment processes to improve the sedimenta-tion or filterability of small particles, aiding removal of micro-scopic particles, difficult or impossible to remove by filtration alone.
Flotation Agent: A chemical, which alters the surface tension of water or makes it froth easily.
Macronutrients: Vital plant nutrients such as nitrogen (N), phosphorus (P) and potassium (K), along with calcium (Ca), sulphur (S) and mag-nesium (Mg) are called macronutrients, as they are required in large amounts, as opposed to micronutrients, which are required by the plants in very small amounts.
MAP – Precipitation: (Syn. Struvite precipitation) Magnesium ammonium phosphate (MAP) precipitation is a process of precipitation, crys-tallisation, and separation of MAP (also known as struvite) in process waters. Commonly used for phosphorus removal/recovery from e.g. digestate or wastewater sludge. It is noted that struvite generally is not pure MAP, as other substances co-precipitate with struvite.
Membrane Fouling: A process, whereby solutions or particles are deposited onto a membrane surface or in the membrane pores, decreasing the performance of the membrane (e.g. flux decline). Membrane foul-ing includes inorganic fouling/scaling, organic fouling, articulate/colloidal fouling, and biofouling (or microbial/biological fouling). Fouling due to organic and inorganic components and microor-ganisms can occur simultaneously and interactively.
Micronutrients: (Syn. Microelements, Trace elements) Vital elements, nec-essary in very small amounts for plants. Seven nutrients are essen-tial to plant growth and health: boron (B), chlorine (Cl), copper (Cu), iron (Fe), manganese (Mn), molybdenum (Mo), and zinc (Zn).
Nanofiltration: Nanofiltration is a membrane filtration based method that uses nanometer sized cylindrical through-pores that traverse the membrane at a 90° angle. Nanofiltration membranes have pore
11. Glossary of terms and abbreviations
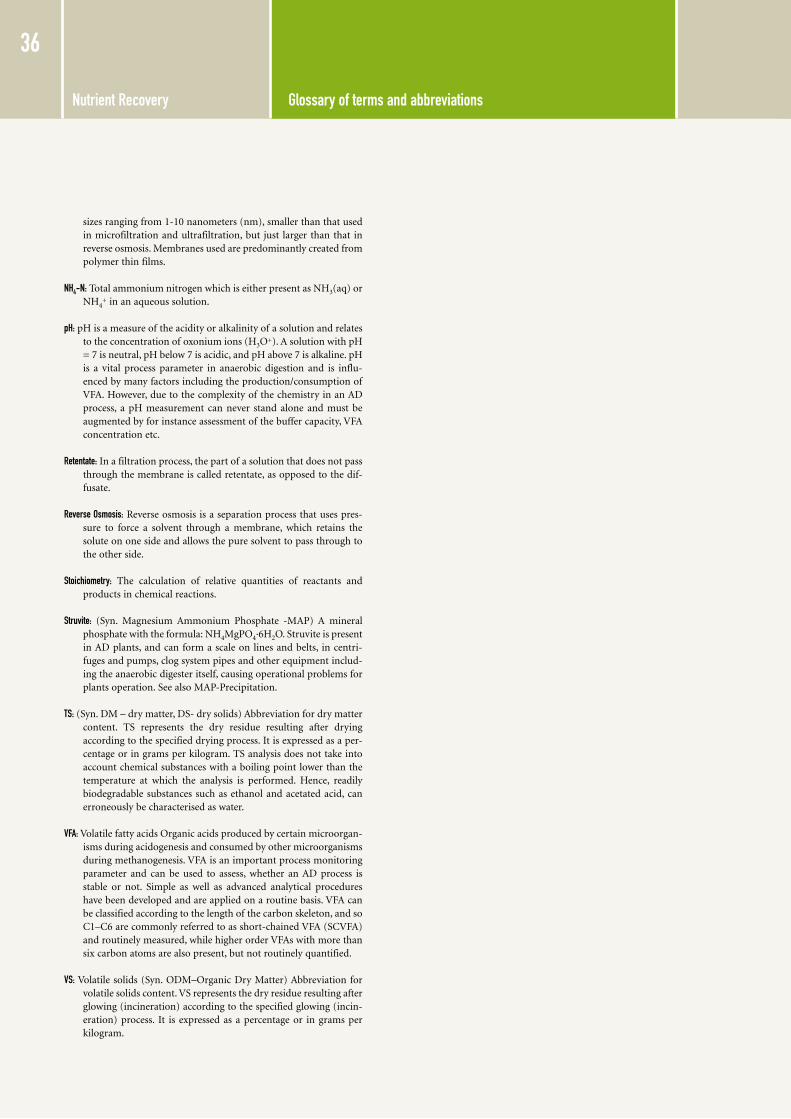
Nutrient Recovery Glossary of terms and abbreviations
36
sizes ranging from 1-10 nanometers (nm), smaller than that used in microfiltration and ultrafiltration, but just larger than that in reverse osmosis. Membranes used are predominantly created from polymer thin films.
NH4-N: Total ammonium nitrogen which is either present as NH3(aq) or NH4
+ in an aqueous solution.
pH: pH is a measure of the acidity or alkalinity of a solution and relates to the concentration of oxonium ions (H3O+). A solution with pH = 7 is neutral, pH below 7 is acidic, and pH above 7 is alkaline. pH is a vital process parameter in anaerobic digestion and is influ-enced by many factors including the production/consumption of VFA. However, due to the complexity of the chemistry in an AD process, a pH measurement can never stand alone and must be augmented by for instance assessment of the buffer capacity, VFA concentration etc.
Retentate: In a filtration process, the part of a solution that does not pass through the membrane is called retentate, as opposed to the dif-fusate.
Reverse Osmosis: Reverse osmosis is a separation process that uses pres-sure to force a solvent through a membrane, which retains the solute on one side and allows the pure solvent to pass through to the other side.
Stoichiometry: The calculation of relative quantities of reactants and products in chemical reactions.
Struvite: (Syn. Magnesium Ammonium Phosphate -MAP) A mineral phosphate with the formula: NH4MgPO4·6H2O. Struvite is present in AD plants, and can form a scale on lines and belts, in centri-fuges and pumps, clog system pipes and other equipment includ-ing the anaerobic digester itself, causing operational problems for plants operation. See also MAP-Precipitation.
TS: (Syn. DM – dry matter, DS- dry solids) Abbreviation for dry matter content. TS represents the dry residue resulting after drying according to the specified drying process. It is expressed as a per-centage or in grams per kilogram. TS analysis does not take into account chemical substances with a boiling point lower than the temperature at which the analysis is performed. Hence, readily biodegradable substances such as ethanol and acetated acid, can erroneously be characterised as water.
VFA: Volatile fatty acids Organic acids produced by certain microorgan-isms during acidogenesis and consumed by other microorganisms during methanogenesis. VFA is an important process monitoring parameter and can be used to assess, whether an AD process is stable or not. Simple as well as advanced analytical procedures have been developed and are applied on a routine basis. VFA can be classified according to the length of the carbon skeleton, and so C1–C6 are commonly referred to as short-chained VFA (SCVFA) and routinely measured, while higher order VFAs with more than six carbon atoms are also present, but not routinely quantified.
VS: Volatile solids (Syn. ODM–Organic Dry Matter) Abbreviation for volatile solids content. VS represents the dry residue resulting after glowing (incineration) according to the specified glowing (incin-eration) process. It is expressed as a percentage or in grams per kilogram.
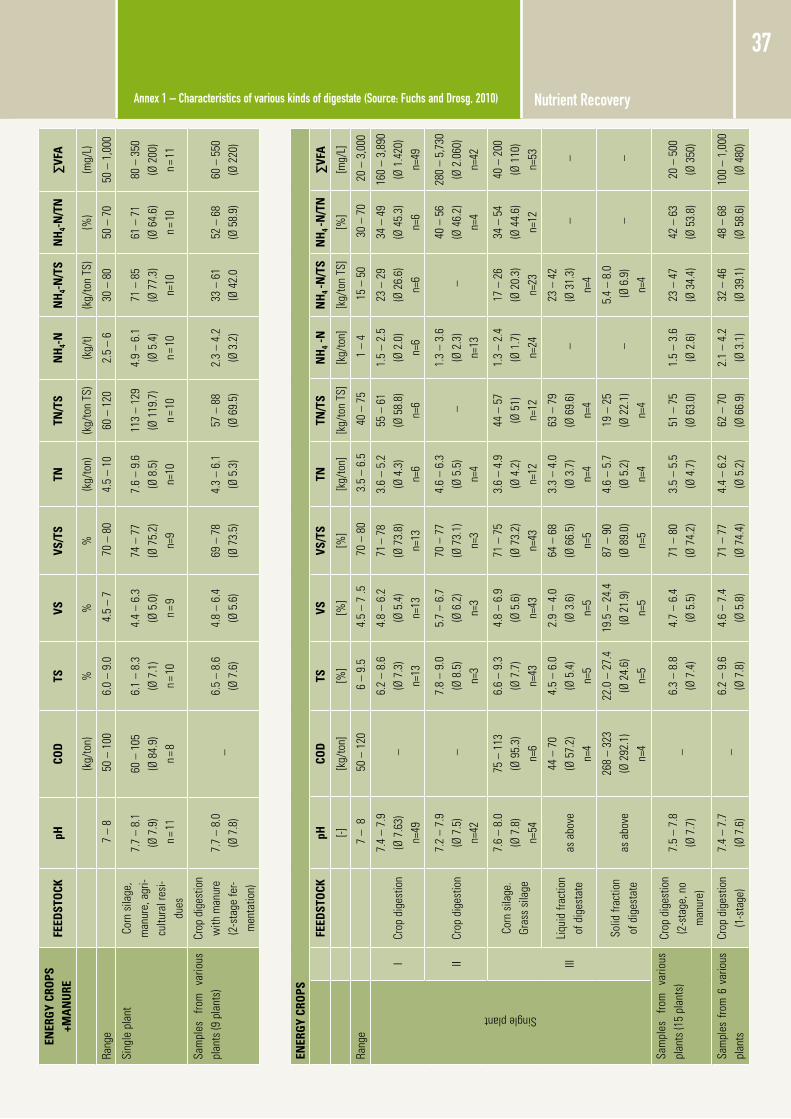
Nutrient Recovery Annex 1 – Characteristics of various kinds of digestate (Source: Fuchs and Drosg, 2010)
37EN
ERG
Y CR
OPS
+M
AN
URE
FEED
STO
CKpH
COD
TSVS
VS/T
STN
TN/T
SN
H4-
NN
H4-
N/T
SN
H4-
N/T
N∑
VFA
(k
g/to
n)%
%%
(kg/
ton)
(kg/
ton
TS)
(kg/
t)(k
g/to
n TS
)(%
)(m
g/L)
rang
e
7 –
8 5
0 –
100
6.0
– 9.
0 4
.5 –
7
70
– 80
4.5
– 10
60 –
120
2.5
– 6
30 –
80
50 –
70
50 –
1,0
00
Sing
le p
lant
corn
sila
ge,
man
ure,
agr
i-cu
ltura
l res
i-du
es
7.7
– 8.
1
(Ø 7
.9)
n =
11
60 –
105
(Ø
84.
9)
n = 8
6.1
– 8.
3
(Ø 7
.1)
n = 10
4.4
– 6.
3
(Ø 5
.0)
n =
9
74 –
77
(Ø
75.
2)
n=9
7.6
– 9.
6
(Ø 8
.5)
n=10
113
– 12
9 (Ø
119
.7)
n = 10
4.9
– 6.
1 (Ø
5.4
) n =
10
71 –
85
(Ø
77.
3)
n=10
61 –
71
(Ø
64.
6)
n = 10
80 –
350
(Ø
200
) n =
11
Sam
ples
fro
m
vario
us
plan
ts (9
pla
nts)
crop
dig
estio
n w
ith m
anur
e (2
-sta
ge fe
r-m
enta
tion)
7.7
– 8.
0
(Ø 7
.8)
–
6.5
– 8.
6
(Ø 7
.6)
4.8
– 6.
4
(Ø 5
.6)
69 –
78
(Ø 7
3.5)
4.3
– 6.
1 (Ø
5.3
)57
– 8
8
(Ø 6
9.5)
2.3
– 4.
2
(Ø 3
.2)
33 –
61
(Ø
42.
052
– 6
8
(Ø 5
8.9)
60 –
550
(Ø
220
)
ENER
GY
CRO
PS
FEED
STO
CKpH
COD
TSVS
VS/T
STN
TN/T
SN
H4 -
NN
H4 -N
/TS
NH
4 -N/T
N∑
VFA
[-]
[kg/
ton]
[%]
[%]
[%]
[kg/
ton]
[kg/
ton
TS]
[kg/
ton]
[kg/
ton
TS]
[%]
[mg/
L]
rang
e
7 –
8 5
0 –
120
6 –
9.5
4.5
– 7
.5 7
0 –
80 3
.5 –
6.5
40
– 75
1 –
4 1
5 –
50 3
0 –
70 2
0 –
3,00
0
Single plant
Icr
op d
iges
tion
7.4
– 7.
9 (Ø
7.6
3)
n=49
–
6.2
– 8.
6
(Ø 7
.3)
n=13
4.8
– 6.
2 (Ø
5.4
)n=
13
71 –
78
(Ø 7
3.8)
n=
13
3.6
– 5.
2(Ø
4.3
)n=
6
55 –
61
(Ø 5
8.8)
n=
6
1.5
– 2.
5(Ø
2.0
)n=
6
23 –
29
(Ø 2
6.6)
n=6
34 –
49
(Ø 4
5.3)
n=6
160
– 3,
890
(Ø 1
.420
)n=
49
IIcr
op d
iges
tion
7.2
– 7.
9 (Ø
7.5
) n=
42 –
7.
8 –
9.0
(Ø 8
.5)
n=3
5.7
– 6.
7(Ø
6.2
) n=
3
70 –
77
(Ø 7
3.1)
n=
3
4.6
– 6.
3(Ø
5.5
)n=
4 –
1.
3 –
3.6
(Ø 2
.3)
n=13
–
40 –
56
(Ø 4
6.2)
n=4
280
– 5,
730
(Ø 2
.060
)n=
42
III
corn
sila
ge.
gras
s si
lage
7.6
– 8.
0 (Ø
7.8
) n=
54
75 –
113
(Ø
95.
3)
n=6
6.6
– 9.
3 (Ø
7.7
) n=
43
4.8
– 6.
9 (Ø
5.6
)n=
43
71 –
75
(Ø 7
3.2)
n=
43
3.6
– 4.
9(Ø
4.2
) n=
12
44 –
57
(Ø 5
1)n=
12
1.3
– 2.
4(Ø
1.7
)n=
24
17 –
26
(Ø 2
0.3)
n=23
34 –
54
(Ø 4
4.6)
n=12
40 –
200
(Ø
110
)n=
53
Liqu
id fr
actio
n of
dig
esta
teas
abo
ve44
– 7
0 (Ø
57.
2)
n=4
4.5
– 6.
0 (Ø
5.4
) n=
5
2.9
– 4.
0 (Ø
3.6
) n=
5
64 –
68
(Ø 6
6.5)
n=
5
3.3
– 4.
0 (Ø
3.7
) n=
4
63 –
79
(Ø 6
9.6)
n=
4 –
23
– 4
2 (Ø
31.
3)n=
4 –
–
Solid
frac
tion
of d
iges
tate
as a
bove
268
– 32
3 (Ø
292
.1)
n=4
22.0
– 2
7.4
(Ø 2
4.6)
n=
5
19.5
– 2
4.4
(Ø 2
1.9)
n=
5
87 –
90
(Ø 8
9.0)
n=
5
4.6
– 5.
7 (Ø
5.2
) n=
4
19 –
25
(Ø 2
2.1)
n=
4 –
5.
4 –
8.0
(Ø 6
.9)
n=4
–
–
Sam
ples
fro
m
vario
us
plan
ts (1
5 pl
ants
)cr
op d
iges
tion
(2
-sta
ge, n
o m
anur
e)
7.5
– 7.
8 (Ø
7.7
) –
6.
3 –
8.8
(Ø 7
.4)
4.7
– 6.
4 (Ø
5.5
)71
– 8
0 (Ø
74.
2)3.
5 –
5.5
(Ø 4
.7)
51 –
75
(Ø 6
3.0)
1.5
– 3.
6(Ø
2.6
)23
– 4
7 (Ø
34.
4)42
– 6
3 (Ø
53.
8)20
– 5
00
(Ø 3
50)
Sam
ples
fro
m 6
var
ious
pl
ants
crop
dig
estio
n
(1-s
tage
)7.
4 –
7.7
(Ø 7
.6)
–
6.2
– 9.
6 (Ø
7.8
)4.
6 –
7.4
(Ø 5
.8)
71 –
77
(Ø 7
4.4)
4.4
– 6.
2 (Ø
5.2
)62
– 7
0(Ø
66.
9)2.
1 –
4.2
(Ø 3
.1)
32 –
46
(Ø 3
9.1)
48 –
68
(Ø 5
8.6)
100
– 1,
000
(Ø 4
80)
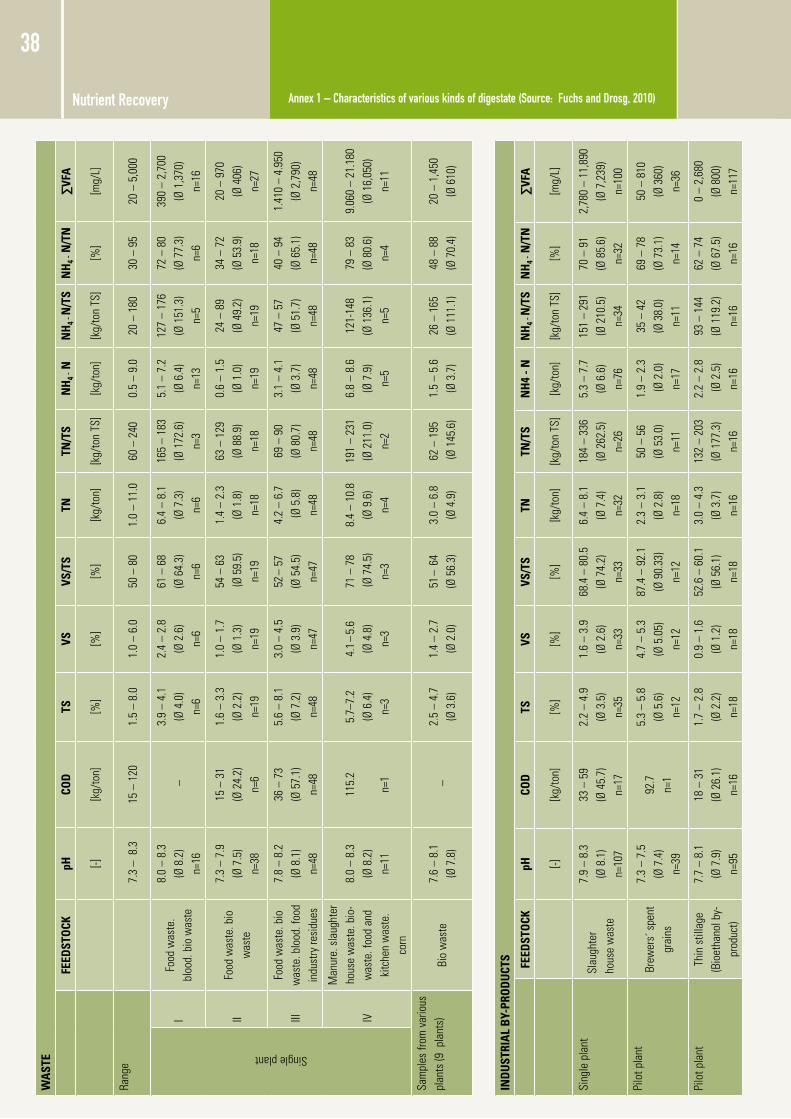
Nutrient Recovery Annex 1 – Characteristics of various kinds of digestate (Source: Fuchs and Drosg, 2010)
38W
AST
E
FEED
STO
CKpH
COD
TSVS
VS/T
STN
TN/T
SN
H4 -
NN
H4 -
N/T
SN
H4 -
N/T
N∑
VFA
[-]
[k
g/to
n][%
][%
][%
][k
g/to
n][k
g/to
n TS
][k
g/to
n][k
g/to
n TS
][%
][m
g/L]
rang
e
7.3
– 8
.315
– 1
201.
5 –
8.0
1.0
– 6.
050
– 8
01.
0 –
11.0
60 –
240
0.5
– 9.
020
– 1
8030
– 9
520
– 5
,000
Single plant
IFo
od w
aste
. bl
ood.
bio
was
te
8.0
– 8.
3
(Ø 8
.2)
n=16
–
3.9
– 4.
1
(Ø 4
.0)
n=6
2.4
– 2.
8
(Ø 2
.6)
n=6
61 –
68
(Ø
64.
3)
n=6
6.4
– 8.
1
(Ø 7
.3)
n=6
165
– 18
3 (Ø
172
.6)
n=3
5.1
– 7.
2
(Ø 6
.4)
n=13
127
– 17
6 (Ø
151
.3)
n=5
72 –
80
(Ø
77.
3)
n=6
390
– 2,
700
(Ø
1,3
70)
n=16
IIFo
od w
aste
. bio
w
aste
7.3
– 7.
9
(Ø 7
.5)
n=38
15 –
31
(Ø
24.
2)
n=6
1.6
– 3.
3
(Ø 2
.2)
n=19
1.0
– 1.
7
(Ø 1
.3)
n=19
54 –
63
(Ø 5
9.5)
n=19
1.4
– 2.
3
(Ø 1
.8)
n=18
63 –
129
(Ø
88.
9)
n=18
0.6
– 1.
5
(Ø 1
.0)
n=19
24 –
89
(Ø 4
9.2)
n=19
34 –
72
(Ø
53.
9)n=
18
20 –
970
(Ø
406
) n=
27
IIIFo
od w
aste
. bio
w
aste
. blo
od. f
ood
indu
stry
resi
dues
7.8
– 8.
2
(Ø 8
.1)
n=48
36 –
73
(Ø
57.
1)
n=48
5.6
– 8.
1
(Ø 7
.2)
n=48
3.0
– 4.
5
(Ø 3
.9)
n=47
52 –
57
(Ø
54.
5)
n=47
4.2
– 6.
7 (Ø
5.8
) n=
48
69 –
90
(Ø
80.
7)n=
48
3.1
– 4.
1
(Ø 3
.7)
n=48
47 –
57
(Ø 5
1.7)
n=48
40 –
94
(Ø
65.
1)n=
48
1.41
0 –
4.95
0
(Ø 2
,790
) n=
48
IV
Man
ure.
sla
ught
er
hous
e w
aste
. bio
-w
aste
. foo
d an
d ki
tche
n w
aste
. co
rn
8.0
– 8.
3
(Ø 8
.2)
n=11
115.
2
n=1
5.7–
7.2
(Ø
6.4
) n=
3
4.1 –
5.6
(Ø
4.8
) n=
3
71 –
78
(Ø 7
4.5)
n=
3
8.4
– 10
.8
(Ø 9
.6)
n=4
191
– 23
1 (Ø
211
.0)
n=2
6.8
– 8.
6
(Ø 7
.9)
n=5
121-
148
(Ø 1
36.1
)n=
5
79 –
83
(Ø
80.
6)
n=4
9.06
0 –
21.1
80
(Ø 1
6,05
0)
n=11
Sam
ples
from
var
ious
pl
ants
(9 p
lant
s)Bi
o w
aste
7.6
– 8.
1
(Ø 7
.8)
–
2.5
– 4.
7
(Ø 3
.6)
1.4
– 2.
7
(Ø 2
.0)
51 –
64
(Ø
56.
3)3.
0 –
6.8
(Ø
4.9
)62
– 1
95
(Ø 1
45.6
)1.
5 –
5.6
(Ø
3.7
)26
– 1
65
(Ø 1
11.1
)48
– 8
8
(Ø 7
0.4)
20 –
1,4
50
(Ø 6
10)
IND
UST
RIA
L B
Y-PR
OD
UCT
S FEED
STO
CKpH
COD
TSVS
VS/T
STN
TN/T
SN
H4
- NN
H4 -
N/T
SN
H4 -
N/T
N∑
VFA
[-]
[k
g/to
n][%
][%
][%
][k
g/to
n][k
g/to
n TS
][k
g/to
n][k
g/to
n TS
][%
][m
g/L]
Sing
le p
lant
Slau
ghte
r ho
use
was
te
7.9
– 8.
3
(Ø 8
.1)
n=10
7
33 –
59
(Ø
45.
7)
n=17
2.2
– 4.
9 (Ø
3.5
) n=
35
1.6
– 3.
9
(Ø 2
.6)
n=33
68.4
– 8
0.5
(Ø
74.
2)
n=33
6.4
– 8.
1
(Ø 7
.4)
n=32
184
– 33
6 (Ø
262
.5)
n=26
5.3
– 7.
7 (Ø
6.6
) n=
76
151
– 29
1 (Ø
210
.5)
n=34
70 –
91
(Ø
85.
6)
n=32
2,78
0 –
11,8
90
(Ø 7
,239
) n=
100
Pilo
t pla
ntBr
ewer
s´ s
pent
gr
ains
7.3
– 7.
5
(Ø 7
.4)
n=39
92.7
n=
1
5.3
– 5.
8
(Ø 5
.6)
n=12
4.7
– 5.
3
(Ø 5
.05)
n=
12
87.4
– 9
2.1
(Ø
90.
33)
n=12
2.3
– 3.
1
(Ø 2
.8)
n=18
50 –
56
(Ø 5
3.0)
n=
11
1.9
– 2.
3 (Ø
2.0
) n=
17
35 –
42
(Ø
38.
0)
n=11
69 –
78
(Ø
73.
1)
n=14
50 –
810
(Ø
360
) n=
36
Pilo
t pla
ntTh
in s
tilla
ge
(Bio
etha
nol b
y-pr
oduc
t)
7.7
– 8.
1
(Ø 7
.9)
n=95
18 –
31
(Ø
26.
1)
n=16
1.7
– 2.
8
(Ø 2
.2)
n=18
0.9
– 1.
6
(Ø 1
.2)
n=18
52.6
– 6
0.1
(Ø
56.
1)
n=18
3.0
– 4.
3
(Ø 3
.7)
n=16
132
– 20
3 (Ø
177
.3)
n=16
2.2
– 2.
8 (Ø
2.5
) n=
16
93 –
144
(Ø
119
.2)
n=16
62 –
74
(Ø
67.
5)
n=16
0 –
2,68
0
(Ø 8
00)
n=11
7
Nutrient Recovery
39
WA
STE
FEED
STO
CKpH
COD
TSVS
VS/T
STN
TN/T
SN
H4 -
NN
H4 -
N/T
SN
H4 -
N/T
N∑
VFA
[-]
[k
g/to
n][%
][%
][%
][k
g/to
n][k
g/to
n TS
][k
g/to
n][k
g/to
n TS
][%
][m
g/L]
rang
e
7.3
– 8
.315
– 1
201.
5 –
8.0
1.0
– 6.
050
– 8
01.
0 –
11.0
60 –
240
0.5
– 9.
020
– 1
8030
– 9
520
– 5
,000
Single plant
IFo
od w
aste
. bl
ood.
bio
was
te
8.0
– 8.
3
(Ø 8
.2)
n=16
–
3.9
– 4.
1
(Ø 4
.0)
n=6
2.4
– 2.
8
(Ø 2
.6)
n=6
61 –
68
(Ø
64.
3)
n=6
6.4
– 8.
1
(Ø 7
.3)
n=6
165
– 18
3 (Ø
172
.6)
n=3
5.1
– 7.
2
(Ø 6
.4)
n=13
127
– 17
6 (Ø
151
.3)
n=5
72 –
80
(Ø
77.
3)
n=6
390
– 2,
700
(Ø
1,3
70)
n=16
IIFo
od w
aste
. bio
w
aste
7.3
– 7.
9
(Ø 7
.5)
n=38
15 –
31
(Ø
24.
2)
n=6
1.6
– 3.
3
(Ø 2
.2)
n=19
1.0
– 1.
7
(Ø 1
.3)
n=19
54 –
63
(Ø 5
9.5)
n=19
1.4
– 2.
3
(Ø 1
.8)
n=18
63 –
129
(Ø
88.
9)
n=18
0.6
– 1.
5
(Ø 1
.0)
n=19
24 –
89
(Ø 4
9.2)
n=19
34 –
72
(Ø
53.
9)n=
18
20 –
970
(Ø
406
) n=
27
IIIFo
od w
aste
. bio
w
aste
. blo
od. f
ood
indu
stry
resi
dues
7.8
– 8.
2
(Ø 8
.1)
n=48
36 –
73
(Ø
57.
1)
n=48
5.6
– 8.
1
(Ø 7
.2)
n=48
3.0
– 4.
5
(Ø 3
.9)
n=47
52 –
57
(Ø
54.
5)
n=47
4.2
– 6.
7 (Ø
5.8
) n=
48
69 –
90
(Ø
80.
7)n=
48
3.1
– 4.
1
(Ø 3
.7)
n=48
47 –
57
(Ø 5
1.7)
n=48
40 –
94
(Ø
65.
1)n=
48
1.41
0 –
4.95
0
(Ø 2
,790
) n=
48
IV
Man
ure.
sla
ught
er
hous
e w
aste
. bio
-w
aste
. foo
d an
d ki
tche
n w
aste
. co
rn
8.0
– 8.
3
(Ø 8
.2)
n=11
115.
2
n=1
5.7–
7.2
(Ø
6.4
) n=
3
4.1 –
5.6
(Ø
4.8
) n=
3
71 –
78
(Ø 7
4.5)
n=
3
8.4
– 10
.8
(Ø 9
.6)
n=4
191
– 23
1 (Ø
211
.0)
n=2
6.8
– 8.
6
(Ø 7
.9)
n=5
121-
148
(Ø 1
36.1
)n=
5
79 –
83
(Ø
80.
6)
n=4
9.06
0 –
21.1
80
(Ø 1
6,05
0)
n=11
Sam
ples
from
var
ious
pl
ants
(9 p
lant
s)Bi
o w
aste
7.6
– 8.
1
(Ø 7
.8)
–
2.5
– 4.
7
(Ø 3
.6)
1.4
– 2.
7
(Ø 2
.0)
51 –
64
(Ø
56.
3)3.
0 –
6.8
(Ø
4.9
)62
– 1
95
(Ø 1
45.6
)1.
5 –
5.6
(Ø
3.7
)26
– 1
65
(Ø 1
11.1
)48
– 8
8
(Ø 7
0.4)
20 –
1,4
50
(Ø 6
10)
Task 37 - Energy from Biogas
IEA Bioenergy aims to accelerate the use of environmentally sustainable and cost competitive bioenergy that will contribute to future low-carbon energy demands. This report is the result of work carried out by IEA Bioenergy Task 37: Energy from Biogas.
The following countries are members of Task 37, in the 2013 – 2015 Work Programme:
Australia Bernadette MccABE, [email protected] Bernhard DroSg, [email protected] günther BochMAnn, [email protected] cícero JAYME BLEY, [email protected] Teodorita AL SEADI, [email protected] European commission (Task Leader) David BAxTEr, [email protected] Finland Jukka rInTALA, [email protected] France olivier ThÉoBALD, [email protected] guillaume BASTIDE, [email protected] germany Bernd LInkE, [email protected] Tormod BrISEID, [email protected] of Ireland Jerry MurPhY, [email protected] of korea ho kAng, [email protected] Mattias SVENSSON, [email protected] nathalie BAchMAnn, [email protected] netherlands Mathieu DuMonT, [email protected] kingdom clare LukEhurST, [email protected] charles BAnkS, [email protected]
WriTTen By:
Bernhard Drosg (corresponding author)IFA-Tullnkonrad Lorenzstrasse 20A-3430 Tulln Austria
Werner Fuchs IFA-Tullnkonrad Lorenzstrasse 20A-3430 Tulln Austria
eDiTeD By:David BaxTerEuropean commissionJrc Institute for Energy and Transport1755 LE PettenThe netherlands
Teodorita al seaDiBIoSAnTEchLerhøjs Allé 14, Dk-6715, EsbjergDenmark
Michael MaDsenENVO Group A/SVestvejen 170 –172Dk-6200 AabenraaDenmark
Bernd linkeLeibniz-Institut für Agrartechnik Potsdam-Bornim Max-Eyth-Allee 100D-14469 Potsdamgermany
PuBlisheD By iea Bioenergy, August 2015
iMPressuM: graphic Design by Susanne AuEr
ISBn 978-910154-16-8
http://www.iea-biogas.net

isBn 978-910154-16-8