nutrient tmdl for pompano canal (wbid 3271) - florida dep · nutrient tmdl for pompano canal (wbid...
TRANSCRIPT

Final
FLORIDA DEPARTMENT OF ENVIRONMENTAL PROTECTION
Division of Water Resource Management, Bureau of Watershed Management
SOUTHEAST DISTRICT
TMDL Report
Nutrient TMDL for Pompano Canal (WBID 3271)
T.S. Wu
C. Todd Jackson and
Woo-Jun Kang
May 2007

TMDL Report DRAFT: Southeast Coast-Biscayne Bay, Pompano Canal, WBID 3271, Nutrients
Florida Department of Environmental Protection
ii
Acknowledgments
This report was prepared by the Watershed Assessment Section of the Florida Department of Environmental Protection’s Bureau of Watershed Management. For additional information on the watershed management approach and impaired waters in the Southeast Coast-Biscayne Bay Basin, contact Amy Tracy Florida Department of Environmental Protection Bureau of Watershed Management Watershed Planning and Coordination Section 2600 Blair Stone Road, Mail Station 3565 Tallahassee, FL 32399-2400 Email: [email protected] Phone: (850) 245-8506; Suncom: 205-8506 Fax: (850) 245-8434 Access to all data used in the development of this report can be obtained by contacting Jan Mandrup-Poulsen Florida Department of Environmental Protection Bureau of Watershed Management Watershed Assessment Section 2600 Blair Stone Road, Mail Station 3555 Tallahassee, FL 32399-2400 Email: [email protected] Phone: (850) 245-8448; Suncom: 205-8448 Fax: (850) 245-8444 This study could not have been accomplished without significant support and assistance provided by the South Florida Water Management District, Broward County Environmental Protection Department, and City of Pompano Beach staff, particularly their contributions towards understanding the issues, history, and processes at work in the Pompano Canal drainage basin. Editorial assistance provided by Jan Mandrup-Poulsen, Daryll Joyner, and Linda Lord.

TMDL Report DRAFT: Southeast Coast-Biscayne Bay, Pompano Canal, WBID 3271, Nutrients
Florida Department of Environmental Protection
iii
Contents
Chapter 1: INTRODUCTION___________________________________ 1 1.1 Purpose of Report ________________________________________________1
1.2 Identification of Waterbody ________________________________________1
1.3 Background _____________________________________________________5
Chapter 2: DESCRIPTION OF WATER QUALITY PROBLEM ________ 6
2.1 Statutory Requirements and Rulemaking History ______________________6
2.2 Information on Verified Impairment__________________________________6
Chapter 3. DESCRIPTION OF APPLICABLE WATER QUALITY STANDARDS AND TARGETS________________________ 9
3.1 Classification of the Waterbody and Criteria Applicable to the TMDL______9
3.2 Applicable Water Quality Standards and Numeric Water Quality Targets _________________________________________________________9
3.2.1 Interpretation of Narrative Nutrient Criterion __________________________9
Chapter 4: ASSESSMENT OF SOURCES_______________________ 10
4.1 Types of Sources________________________________________________10
4.2 Point Sources __________________________________________________10 4.2.1 NPDES Permitted Wastewater Facilities ___________________________10 4.2.2 Municipal Separate Storm Sewer System Permittees _________________10
4.3 Land Uses and Nonpoint Sources__________________________________11 4.3.1 Land Uses___________________________________________________11 4.3.2 Estimating Nonpoint Loadings ___________________________________16
Chapter 5: DETERMINATION OF ASSIMILATIVE CAPACITY_______ 21
5.1 Determination of Loading Capacity_________________________________21
5.2 Relationship Between Nutrients, precipitation, and BOD _______________21 5.2 Critical Conditions_______________________________________________21 5.2 Estimated Loads ________________________________________________23
Chapter 6: DETERMINATION OF THE TMDL ____________________ 24
6.1 Expression and Allocation of the TMDL _____________________________24

TMDL Report DRAFT: Southeast Coast-Biscayne Bay, Pompano Canal, WBID 3271, Nutrients
Florida Department of Environmental Protection
iv
6.2 Load Allocation (LA) _____________________________________________25
6.3 Wasteload Allocation (WLA)_______________________________________25 6.3.1 NPDES Wastewater Discharges__________________________________25 6.3.2 NPDES Stormwater Discharges __________________________________25
6.4 Margin of Safety_________________________________________________26
Chapter 7: NEXT STEPS: IMPLEMENTATION PLAN DEVELOPMENT AND BEYOND _____________________ 27
7.1 Basin Management Action Plan____________________________________27
References _______________________________________________ 28
Appendices _____________________________ Error! Bookmark not defined.
Appendix A: Water Quality Monitoring Results for the Verified Period (1998* – 2005), Pompano Canal, WBID 3271 _________________________32
Appendix B: Background Information on Federal and State Stormwater Programs ______________________________________________________33
List of Tables
Table 2.1 Summary Statistics of Chlorophyll-a for the IWR Verified Period (1995 – 2002), Pompano Canal Watershed, WBID 3271 ___________7
Table 4.1 Water Quality Data from Sampling Sites in Pompano Canal Drainage Basin, WBID 3271, during the 2006 Wet Season
(June-September)____________________________________________13 Table 4.2. Classification and Coverage of Land Use Categories in the
Pompano Canal Watershed, WBID 3271 _______________________15 Table 4.3. Percent of Directly Connected Impervious Area for Different Land
Use Categories in the Pompano Canal watershed, wbid 327________17 Table 4.4. Annual Precipitation, Flow, and WMM Runoff in Pompano Canal,
WBID 3271 ______________________________________________20 Table 5.1 Estimated Annual Existing ans Allowable Nutrient Loadings in
Pompano Canal, WBID 3271 ________________________________23 Table 6.1 TMDL Components and Current Loadings for the LSC Watershed _______25

TMDL Report DRAFT: Southeast Coast-Biscayne Bay, Pompano Canal, WBID 3271, Nutrients
Florida Department of Environmental Protection
v
List of Figures
Figure 1.1 Location of the Pompano Canal Watershed in the Broward County Planning Unit ______________________________________________2
Figure 1.2 Pompano Canal Drainage Basin _________________________________4 Figure 2.1 Chlorophyll-a Results Based on the IWR Assessment for
Pompano Canal, wbid 3271 __________________________________8 Figure 4.1 Pompano Canal Drainage Basin with Wet Season (June-
Semptember) 2006 Sample Sites _____________________________12 Figure 4.2 WBID 3271- Pompano Canal, Land Use Map (1999) ________________14 Figure 4.3. Annual Total Precipitation and Annual Average Flow in Pompano
Canal, WBID 3721_________________________________________18 Figure 5.1 The Relationship between Chlorophyll-a and Total Nitrogen ___________22 Figure 5.2 The Relationship between Chlorophyll-a and Total Phosphorus ________22

TMDL Report DRAFT: Southeast Coast-Biscayne Bay, Pompano Canal, WBID 3271, Nutrients
Florida Department of Environmental Protection
vi
Web sites
Florida Department of Environmental Protection, Bureau of Watershed Management
TMDL Program http://www.dep.state.fl.us/water/tmdl/index.htm Identification of Impaired Surface Waters Rule http://www.dep.state.fl.us/water/tmdl/docs/AmendedIWR.pdf STORET Program http://www.dep.state.fl.us/water/storet/index.htm 2004 305(b) Report http://www.dep.state.fl.us/water/docs/2004_Integrated_Report.pdf Criteria for Surface Water Quality Classifications http://www/dep.state.fl.us/legal/legaldocuments/rules/ruleslistnum.htm Basin Status Reports http://www.dep.state.fl.us/water/tmdl/stat_rep.htm Water Quality Assessment Reports http://www.dep.state.fl.us/water/tmdl/stat_rep.htm Allocation Technical Advisory Committee (ATAC) Report http://www.dep.state.fl.us/water/tmdl/docs/Allocation.pdf
U.S. Environmental Protection Agency
Region 4: Total Maximum Daily Loads in Florida http://www.epa.gov/region4/water/tmdl/florida/ National STORET Program http://www.epa.gov/storet/
TMDL Report DRAFT: Southeast Coast-Biscayne Bay, Pompano Canal, WBID 3271, Nutrients
Florida Department of Environmental Protection
1
Chapter 1: INTRODUCTION
1.1 Purpose of Report
This report presents the Total Maximum Daily Load (TMDL) for total nitrogen (TN) and total phosphorus (TP) for the Pompano Canal. Using the methodology described in Chapter 62-303, Florida Administrative Code (F.A.C.) (Identification of Impaired Surface Waters Rule, or IWR) to identify and verify water quality impairments, the Pompano Canal was verified as impaired for nutrients, and was included on the Verified List of impaired waters for the Southeast Coast-Biscayne Bay Basin that was adopted by Secretarial Order on May 12, 2006. The TMDL process quantifies the amount of a pollutant that can be assimilated in a waterbody, identifies the sources of the pollutant, and recommends regulatory or other actions to be taken to achieve compliance with applicable water quality standards, based on the relationship between pollution sources and instream water quality conditions. This TMDL establishes the allowable loadings of nitrogen and phosphorus to the canal that would restore the waterbody so that it meets its applicable water quality criteria for nutrients.
1.2 Identification of Waterbody
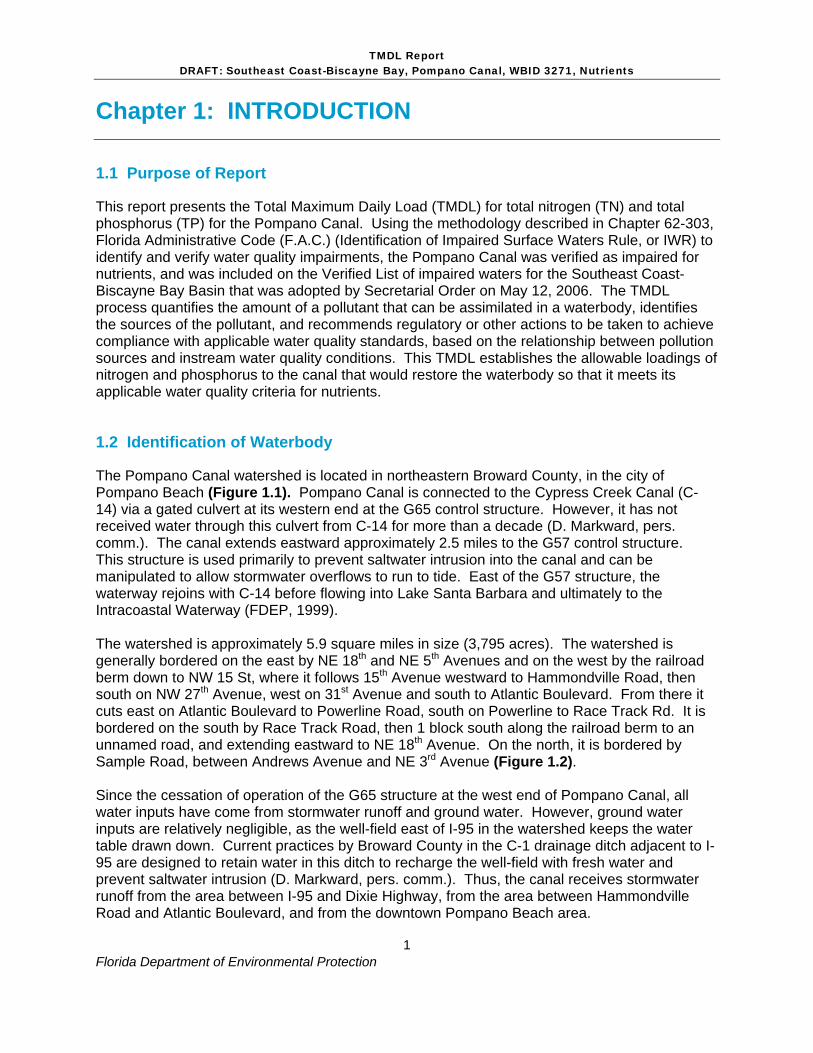
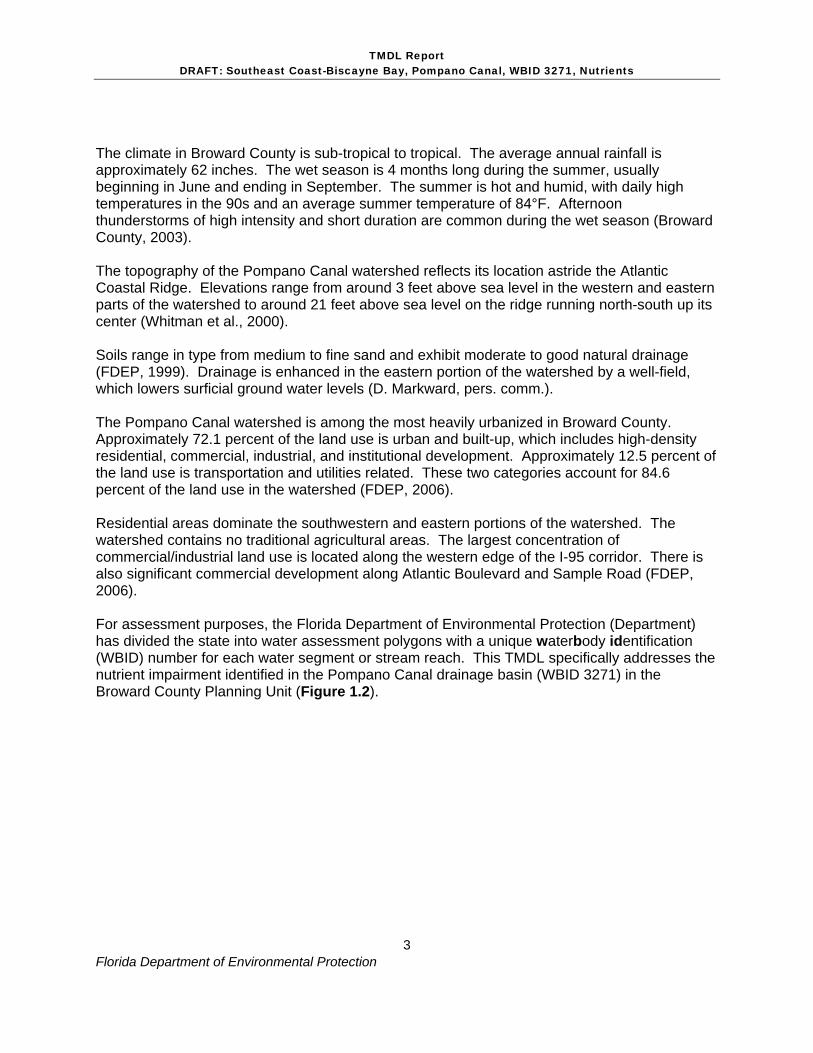
The Pompano Canal watershed is located in northeastern Broward County, in the city of Pompano Beach (Figure 1.1). Pompano Canal is connected to the Cypress Creek Canal (C-14) via a gated culvert at its western end at the G65 control structure. However, it has not received water through this culvert from C-14 for more than a decade (D. Markward, pers. comm.). The canal extends eastward approximately 2.5 miles to the G57 control structure. This structure is used primarily to prevent saltwater intrusion into the canal and can be manipulated to allow stormwater overflows to run to tide. East of the G57 structure, the waterway rejoins with C-14 before flowing into Lake Santa Barbara and ultimately to the Intracoastal Waterway (FDEP, 1999). The watershed is approximately 5.9 square miles in size (3,795 acres). The watershed is generally bordered on the east by NE 18th and NE 5th Avenues and on the west by the railroad berm down to NW 15 St, where it follows 15th Avenue westward to Hammondville Road, then south on NW 27th Avenue, west on 31st Avenue and south to Atlantic Boulevard. From there it cuts east on Atlantic Boulevard to Powerline Road, south on Powerline to Race Track Rd. It is bordered on the south by Race Track Road, then 1 block south along the railroad berm to an unnamed road, and extending eastward to NE 18th Avenue. On the north, it is bordered by Sample Road, between Andrews Avenue and NE 3rd Avenue (Figure 1.2). Since the cessation of operation of the G65 structure at the west end of Pompano Canal, all water inputs have come from stormwater runoff and ground water. However, ground water inputs are relatively negligible, as the well-field east of I-95 in the watershed keeps the water table drawn down. Current practices by Broward County in the C-1 drainage ditch adjacent to I-95 are designed to retain water in this ditch to recharge the well-field with fresh water and prevent saltwater intrusion (D. Markward, pers. comm.). Thus, the canal receives stormwater runoff from the area between I-95 and Dixie Highway, from the area between Hammondville Road and Atlantic Boulevard, and from the downtown Pompano Beach area.

TMDL Report DRAFT: Southeast Coast-Biscayne Bay, Pompano Canal, WBID 3271, Nutrients
Florida Department of Environmental Protection
2
BROWARD
PALM BEACH
DADE
Tarpon River
L-6
Cana
l
L-40
Can
al
L-35b Canal
Hillsboro Canal (L-39)
Middle River Canal
Miami Canal
Cypress Creek Canal
Hill
sbor
o R
iver
I-75 Canal
C-10 Spur
Middle River
Snake Creek Canal
Dania Cut-Off Canal
Biscayne Canal
North New River Canal
Oleta R
iver
South New River Canal
North New River Canal
Miami Canal
I-75 Canal
South New River Canal
I - 9
5
I - 75
Florida Turnpike
I - 595
Saw
gras
s E
xpre
ssw
ay
US Hwy 441
State Hwy 84
I - 75
µ Divison of Water Resource ManagementBureau of Watershed Management
Canal Ditch
Impaired WBIDInterstates
Legend
Major Canals
0 7 143.5Miles
Figure 1.1 Location of the Pompano Canal Watershed in the Broward County Planning Unit
TMDL Report DRAFT: Southeast Coast-Biscayne Bay, Pompano Canal, WBID 3271, Nutrients
Florida Department of Environmental Protection
3
The climate in Broward County is sub-tropical to tropical. The average annual rainfall is approximately 62 inches. The wet season is 4 months long during the summer, usually beginning in June and ending in September. The summer is hot and humid, with daily high temperatures in the 90s and an average summer temperature of 84°F. Afternoon thunderstorms of high intensity and short duration are common during the wet season (Broward County, 2003). The topography of the Pompano Canal watershed reflects its location astride the Atlantic Coastal Ridge. Elevations range from around 3 feet above sea level in the western and eastern parts of the watershed to around 21 feet above sea level on the ridge running north-south up its center (Whitman et al., 2000). Soils range in type from medium to fine sand and exhibit moderate to good natural drainage (FDEP, 1999). Drainage is enhanced in the eastern portion of the watershed by a well-field, which lowers surficial ground water levels (D. Markward, pers. comm.). The Pompano Canal watershed is among the most heavily urbanized in Broward County. Approximately 72.1 percent of the land use is urban and built-up, which includes high-density residential, commercial, industrial, and institutional development. Approximately 12.5 percent of the land use is transportation and utilities related. These two categories account for 84.6 percent of the land use in the watershed (FDEP, 2006). Residential areas dominate the southwestern and eastern portions of the watershed. The watershed contains no traditional agricultural areas. The largest concentration of commercial/industrial land use is located along the western edge of the I-95 corridor. There is also significant commercial development along Atlantic Boulevard and Sample Road (FDEP, 2006). For assessment purposes, the Florida Department of Environmental Protection (Department) has divided the state into water assessment polygons with a unique waterbody identification (WBID) number for each water segment or stream reach. This TMDL specifically addresses the nutrient impairment identified in the Pompano Canal drainage basin (WBID 3271) in the Broward County Planning Unit (Figure 1.2).

TMDL Report DRAFT: Southeast Coast-Biscayne Bay, Pompano Canal, WBID 3271, Nutrients
Florida Department of Environmental Protection
4
!(
!( !(
BROWARD
I - 9
5
Florida TurnpikePompano Canal
Sailboat Lake
I- 95
DIX
IE H
WY
SAMPLE ROADN
E 5 A
VE
COPANS RD
BLO
UN
T RD
POW
ER
LINE
RD
NE
3 AVE
ATLANTIC BLVD(SR814)
HAMMONDVILLE RDN
W 27 A
VE
NW 15 ST(POMP BCH)
COPANS ROAD.
RACE TRACK RD/SW 3ST
PO
MP
AN
O P
AR
KWAY
N A
ND
REW
S
AND
REW
S AV
ENU
E
NE
18
AV
EN
UE
NW
6TH AV
EN
UE
DIX
IE H
WY
W
NE 10 STREET
NW
31 AVE
(SR
-849)ATLANTIC BLVD
NE 33TH STREET
NE 1 ST
COPANS ROAD
NW
8 A
VE
G57
G65
S37B
µ
21flbrow110
Pompano Canal Drainage Basin, WBID 3271
Legend
FDOT Local Roads
CanalDitch
Interstates
Impaired WBID
SFWMD Control Structures
0 0.75 1.50.375Miles
Divison of Water Resource ManagementBureau of Watershed Management
Figure 1.2 Pompano Canal Drainage Basin

TMDL Report DRAFT: Southeast Coast-Biscayne Bay, Pompano Canal, WBID 3271, Nutrients
Florida Department of Environmental Protection
5
1.3 Background
This report was developed as part of the Department’s watershed management approach for restoring and protecting state waters and addressing TMDL Program requirements. The watershed approach, which is implemented using a cyclical management process that rotates through the state’s 52 river basins over a 5-year cycle, provides a framework for implementing the TMDL Program–related requirements of the 1972 Federal Clean Water Act and the 1999 Florida Watershed Restoration Act (FWRA, Chapter 99-223, Laws of Florida).
A TMDL represents the maximum amount of a given pollutant that a waterbody can assimilate and still meet water quality standards, including its applicable water quality criteria and its designated uses. TMDLs are developed for waterbodies that are verified as not meeting their water quality standards. TMDLs provide important water quality restoration goals that will guide restoration activities. This TMDL Report will be followed by the development and implementation of a Basin Management Action Plan, or BMAP, which will be designed to reduce the amount of TN and TP needed to address the nutrient impairment in the Pompano Canal watershed. The action plan’s activities will depend heavily on the active participation of Broward County, the South Florida Water Management District (SFWMD), City of Pompano Beach, Florida Department of Transportation, local businesses and other stakeholders. The Department will work with these organizations and individuals to undertake or continue reductions in the discharge of pollutants and achieve the established TMDLs for impaired waterbodies.
TMDL Report DRAFT: Southeast Coast-Biscayne Bay, Pompano Canal, WBID 3271, Nutrients
Florida Department of Environmental Protection
6
Chapter 2: DESCRIPTION OF WATER QUALITY PROBLEM
2.1 Statutory Requirements and Rulemaking History
Section 303(d) of the federal Clean Water Act requires states to submit to the U.S. Environmental Protection Agency (EPA) a list of surface waters that do not meet applicable water quality standards (impaired waters) and establish a TMDL for each pollutant causing the identified impairment of the listed waters on a schedule. The Department has developed these lists, commonly referred to as 303(d) lists, since 1992. The list of impaired waters in each basin is also required by the FWRA (Subsection 403.067[4], Florida Statutes [F.S.]), and the Department is developing basin-specific lists as part of the watershed management cycle. The 1998 303(d) list included 18 waterbodies (WBIDs) in the Southeast Coast-Biscayne Bay Basin (Florida Department of Environmental Protection, 1998). However, the FWRA (Section 403.067, F.S.) stated that all previous Florida 303(d) lists were for planning purposes only and directed the Department to develop, and adopt by rule, a new science-based methodology to identify impaired waters. After a long rulemaking process, the Environmental Regulation Commission adopted the new methodology as Chapter 62-303, Florida Administrative Code (F.A.C.) (Identification of Impaired Surface Waters Rule, or IWR), (Florida Department of Environmental Protection, 2001; IWR subsequently modified in 2006). The list of waters for which impairments have been verified using the methodology in the IWR is referred to as the Verified List.
2.2 Information on Verified Impairment
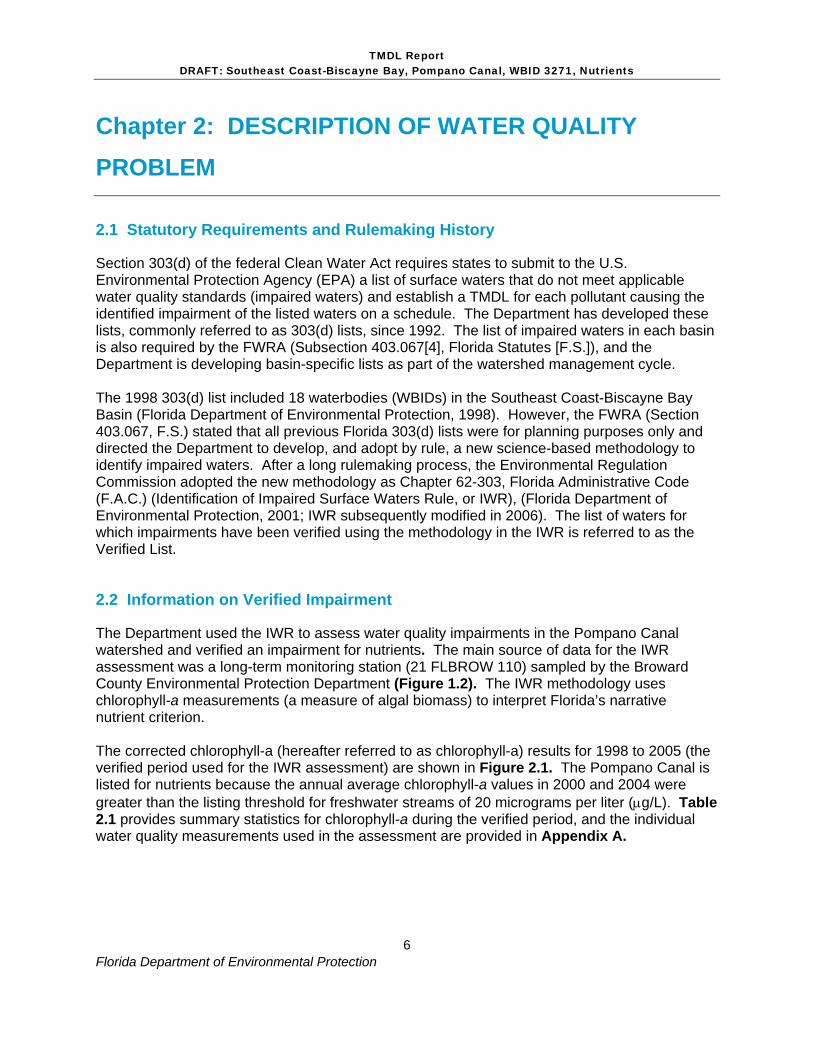
The Department used the IWR to assess water quality impairments in the Pompano Canal watershed and verified an impairment for nutrients. The main source of data for the IWR assessment was a long-term monitoring station (21 FLBROW 110) sampled by the Broward County Environmental Protection Department (Figure 1.2). The IWR methodology uses chlorophyll-a measurements (a measure of algal biomass) to interpret Florida’s narrative nutrient criterion. The corrected chlorophyll-a (hereafter referred to as chlorophyll-a) results for 1998 to 2005 (the verified period used for the IWR assessment) are shown in Figure 2.1. The Pompano Canal is listed for nutrients because the annual average chlorophyll-a values in 2000 and 2004 were greater than the listing threshold for freshwater streams of 20 micrograms per liter (μg/L). Table 2.1 provides summary statistics for chlorophyll-a during the verified period, and the individual water quality measurements used in the assessment are provided in Appendix A.
TMDL Report DRAFT: Southeast Coast-Biscayne Bay, Pompano Canal, WBID 3271, Nutrients
Florida Department of Environmental Protection
7
Table 2.1 Summary Statistics for Chlorophyll-a for the IWR Verified Period (1998 – 2005), Pompano Canal Watershed, WBID 3271
Year Minimum Mean Median Maximum 1999 3.74 12.6 10.69 25.4 2000 3.61 20.1 8.73 59.4 2001 2.8 6.4 3.14 16.5 2002 1.25 9.0 5.29 24.11 2003 11.6 18.0 18 24.4 2004 7.27 20.7 22.6 30.2 2005 3.3 16.2 16.15 29
[Note that I edited the numbers in the “Mean” column to have the same number of significant digits so that they would line up.] As part of the listing process, the Department attempts to identify the limiting nutrient or nutrients for the impaired water segment. A limiting nutrient, generally nitrogen and/or phosphorus, is defined as the nutrient that limits plant growth when it is not available in sufficient quantities. Algal biomass and growth is approximated by measuring the concentration of chlorophyll-a (chl-a). Once the limiting nutrient in a waterbody is exhausted, algae stop growing. If more of the limiting nutrient is added, larger algal populations will result, until their growth is again limited by nutrients or other environmental factors. In Florida waterbodies, nitrogen and phosphorus are most often the limiting nutrients. Determining the limiting nutrient in a waterbody can be accomplished by comparing the ratio of nitrogen to phosphorus in the waterbody. Water column ratios of total nitrogen (TN) to total phosphorus (TP) of less than 10 indicate nitrogen limitation, ratios greater than 30 indicate phosphorus limitation, and ratios between 10-30 indicate co-limitation. For the Pompano Canal watershed, the median TN to TP ratio at station 21FLBROW110 from 1999 to 2005 was 12.12, indicating that the WBID is co-limited.

TMDL Report DRAFT: Southeast Coast-Biscayne Bay, Pompano Canal, WBID 3271, Nutrients
Florida Department of Environmental Protection
8
Pompano Canal, WBID 3271, Annual Average Chlorophyll-a
0
5
10
15
20
25
1998 1999 2000 2001 2002 2003 2004 2005 2006
Year
Chl
-a (u
g/L)
Chl-aStandard
Figure 2.1 Chlorophyll-a Results Based on the IWR Assessment for Pompano Canal, WBID 3271

TMDL Report DRAFT: Southeast Coast-Biscayne Bay, Pompano Canal, WBID 3271, Nutrients
Florida Department of Environmental Protection
9
Chapter 3. DESCRIPTION OF APPLICABLE WATER QUALITY STANDARDS AND TARGETS
3.1 Classification of the Waterbody and Criteria Applicable to the TMDL
Florida’s surface waters are protected for five designated use classifications, as follows:
Class I Potable water supplies Class II Shellfish propagation or harvesting Class III Recreation, propagation, and maintenance of a healthy, well-
balanced population of fish and wildlife Class IV Agricultural water supplies Class V Navigation, utility, and industrial use (there are no state waters
currently in this class)
Pompano Canal is designated as a Class III surface water. The Class III water quality criteria applicable to the observed impairment is the narrative nutrient criteria.
3.2 Applicable Water Quality Standards and Numeric Water Quality Targets
3.2.1 Interpretation of Narrative Nutrient Criterion
Florida’s nutrient criterion is narrative only—nutrient concentrations of a body of water shall not be altered so as to cause an imbalance in natural populations of aquatic flora or fauna. Accordingly, a nutrient-related target was needed to represent levels at which an imbalance in flora or fauna is expected to occur. While the IWR provides a threshold for nutrient impairment for streams and estuaries based on annual average chlorophyll-a levels, these thresholds are not standards and need not be used as the nutrient-related water quality target for TMDLs. In fact, in recognition that the IWR thresholds were developed using statewide average conditions, the IWR (Section 62-303.450, F.A.C.) specifically allows the use of alternative, site-specific thresholds that more accurately reflect conditions beyond which an imbalance in flora or fauna occurs in the waterbody. In translating the narrative nutrient criterion for this TMDL, the Department wanted to ensure that the canal would not be identified as impaired by nutrients according to the assessment methodology in the IWR following implementation of the TMDL. Given the uncertainty of nutrient reactions and the conditions causing flow patterns in managed canal systems, the Department applied a chlorophyll-a target for this TMDL that should result in an annual average chlorophyll level below the IWR impairment threshold for freshwater (20 μg/L). This approach minimizes the potential for listing the water as impaired in the future. The summer chl-a values are almost always the highest of the year for the obvious reasons of temperature, day length, and precipitation. By setting nutrient load reductions at a level appropriate to generate average summer chl-a levels below 20 μg/L, this conservative approach should shift the distribution of values down to produce an annual average chl-a below 20 μg/L.
TMDL Report DRAFT: Southeast Coast-Biscayne Bay, Pompano Canal, WBID 3271, Nutrients
Florida Department of Environmental Protection
10
Chapter 4: ASSESSMENT OF SOURCES
4.1 Types of Sources
An important part of the TMDL analysis is the identification of pollutant source categories, source subcategories, or individual sources of the pollutant or pollutants causing impairment in the watershed and the amount of pollutant loading contributed by each of these sources. Sources are broadly classified as either “point sources” or “nonpoint sources.” Historically, the term point sources has meant discharges to surface waters that typically have a continuous flow via a discernable, confined, and discrete conveyance, such as a pipe. Domestic and industrial wastewater treatment facilities (WWTFs) are examples of traditional point sources. In contrast, the term “nonpoint sources” was used to describe intermittent, rainfall driven, diffuse sources of pollution associated with everyday human activities, including runoff from urban land uses, agriculture, silviculture, and mining; discharges from failing septic systems; and atmospheric deposition. However, the 1987 amendments to the Clean Water Act redefined certain nonpoint sources of pollution as point sources subject to regulation under the EPA’s National Pollutant Discharge Elimination System (NPDES) Program. These nonpoint sources included certain urban stormwater discharges, including those from local government master drainage systems, construction sites over five acres, and a wide variety of industries (see Appendix B for background information on the federal and state stormwater programs). To be consistent with Clean Water Act definitions, the term “point source” is used to describe traditional point sources (such as domestic and industrial wastewater discharges) and stormwater systems requiring an NPDES stormwater permit when allocating pollutant load reductions required by a TMDL. However, the methodologies used to estimate nonpoint source loads do not distinguish between NPDES stormwater discharges and non-NPDES stormwater discharges, and as such, this source assessment section does not make any distinction between the two types of stormwater.
4.2 Point Sources
4.2.1 NPDES Permitted Wastewater Facilities
There are no permitted wastewater treatment facilities or industrial facilities that discharge either directly or indirectly into the Pompano Canal watershed.
4.2.2 Municipal Separate Storm Sewer System Permittees
Municipal separate storm sewer systems (MS4s) may discharge nutrients to waterbodies in response to storm events. To address stormwater discharges, the EPA developed the NPDES
TMDL Report DRAFT: Southeast Coast-Biscayne Bay, Pompano Canal, WBID 3271, Nutrients
Florida Department of Environmental Protection
11
stormwater permitting program. The stormwater collection systems in the Pompano Canal watershed, which are owned and operated by Broward County, the city of Pompano Beach, and the Florida Department of Transportation, are all covered by a Phase I MS4 permit (# FLS 000016).
4.3 Land Uses and Nonpoint Sources
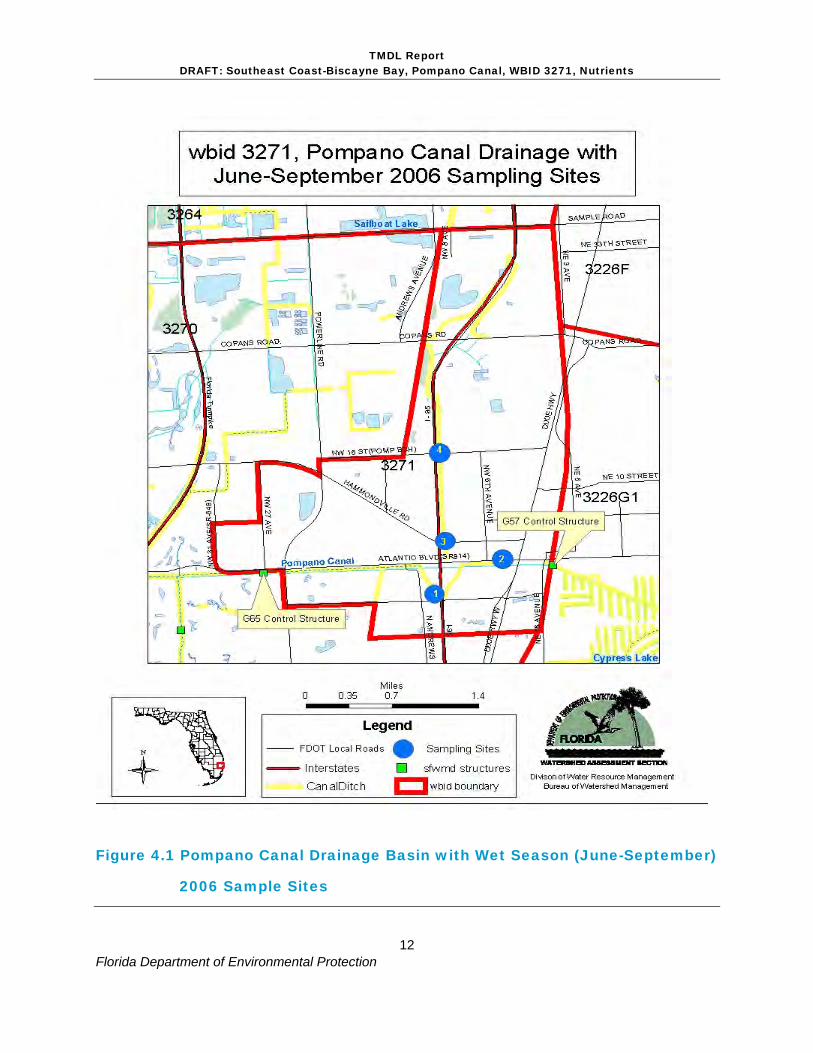
Nutrient loading from urban areas is most often attributable to multiple sources, including stormwater runoff, leaks and overflows from sanitary sewer systems, illicit discharges of sanitary wastewater, runoff from improper disposal of waste materials, leaking septic systems, and domestic animals. Because the Pompano Canal watershed is primarily urban, wildlife and agricultural animals or livestock sources are not expected to contribute significantly to nutrient loads. An exception to this could be the Pompano Racetrack, located in the southwestern portion of the WBID, which has a paddock area where racehorses are kept. As part of the current sampling regime, a sample site has been located just downstream of the racetrack (Figure 4.1, Site 1). This site recorded the lowest total nitrogen (TN) of all sites on all eight sample dates. However total phosphorus (TP) and biological oxygen demand (BOD) were often elevated relative to the other sites (Table 4.1). Whether or not the racetrack contributes to these elevated levels of TP and BOD is unknown, but runoff into the canal from the area west of I-95 is causing elevated levels of BOD and TP.
4.3.1 Land Uses
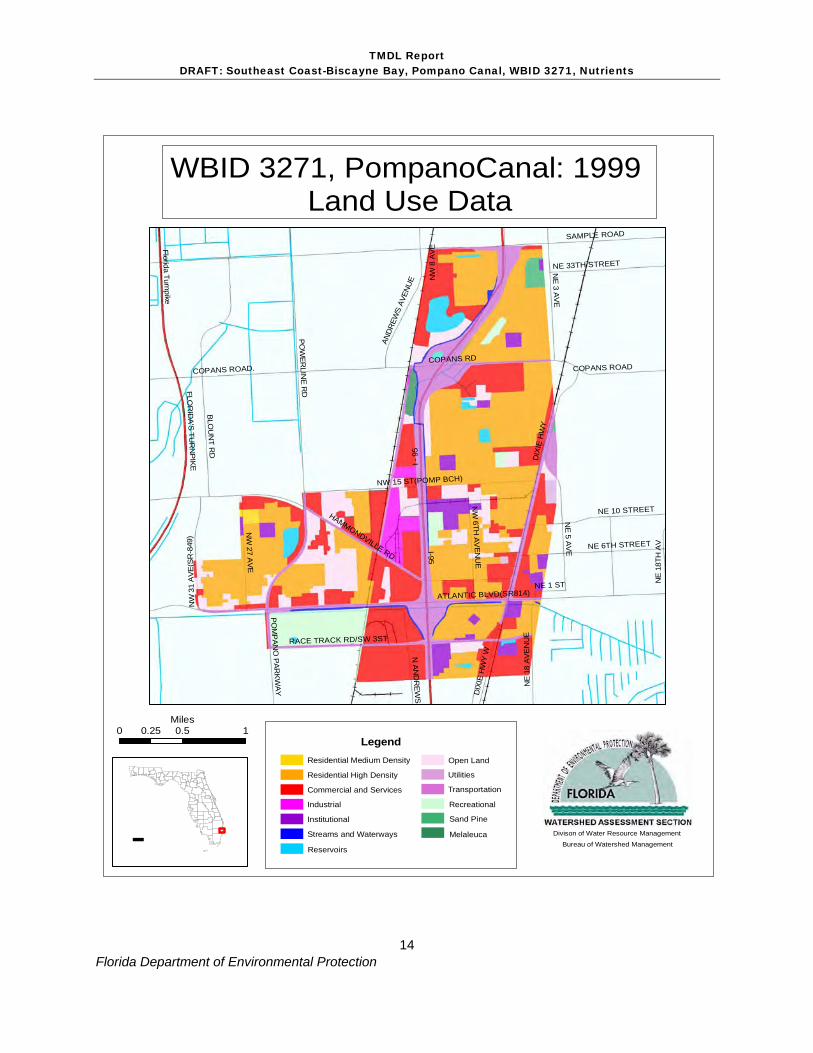
The spatial distribution and acreage of different land use categories were identified using 1999 land use coverage data (scale 1:60,000) contained in the Department’s geographic information system (GIS) library (Florida Department of Environmental Protection, June 2006) (Figure 4.2). Table 4.2 tabulates the Level 3 land use attributes in the watershed. The predominant land uses are urban and transportation, which comprise approximately 84 percent of the watershed’s total area. Table 4.3 provides the different land use attributes used in the WMM analysis to calculate average annual runoff. For these runoff calculations, land use categories were lumped into level 1 FLUCCS Code categories, as data exist to model runoff from this level of land use (Harper and Baker 2003).
TMDL Report DRAFT: Southeast Coast-Biscayne Bay, Pompano Canal, WBID 3271, Nutrients
Florida Department of Environmental Protection
12
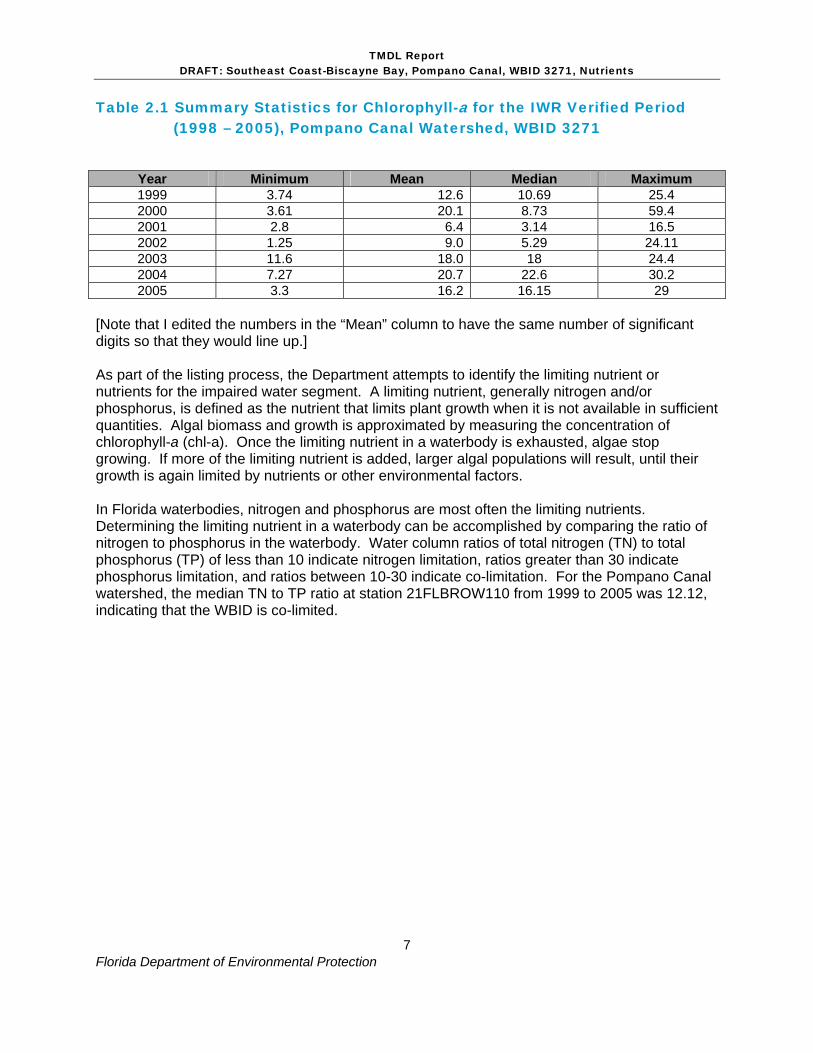
Figure 4.1 Pompano Canal Drainage Basin with Wet Season (June-September)
2006 Sample Sites

TMDL Report DRAFT: Southeast Coast-Biscayne Bay, Pompano Canal, WBID 3271, Nutrients
Florida Department of Environmental Protection
13
Table 4.1 Water Quality Data from Sampling Sites in Pompano Canal Drainage Basin, WBID 3271, during the 2006 Wet Season (June-September). Cells in Blue represent Rain Dates
Sample Date TN TP BOD Chl-a Site (mg/L) (mg/L) (mg/L) (μg/L)
1 6/8/2006 0.431 0.071 2.4 15.5 2 6/8/2006 0.4975 0.038 1.9 10.19 3 6/8/2006 0.565 0.037 1.9 14.5 4 6/8/2006 0.656 0.065 2.43 45.7 1 6/26/2006 0.5925 0.035 1.145 4.895 2 6/26/2006 0.605 0.061 2.5 24 3 6/26/2006 0.645 0.084 1.6 12.3 4 6/26/2006 1.08 0.072 2.7 38.5 1 7/13/2006 0.627 0.089 3.55 47.8 2 7/13/2006 0.66 0.104 3.4 77 3 7/13/2006 0.801 0.112 2.7 43.8 4 7/13/2006 0.959 0.084 2.4 69.1 1 7/24/2006 0.672 0.091 2.4 14.2 2 7/24/2006 0.7675 0.105 2.35 33.75 3 7/24/2006 0.747 0.074 1.9 30.5 4 7/24/2006 0.787 0.058 2.44 22.5 1 8/7/2006 0.5995 0.066 2.1 21.1 2 8/7/2006 0.696 0.053 2 15 3 8/7/2006 0.846 0.080 1.02 27.2 4 8/7/2006 0.817 0.055 3.02 43.1 1 8/14/2006 0.673 0.096 2.4 30.2 2 8/14/2006 0.705 0.071 3.4 35.9 3 8/14/2006 0.917 0.082 2.35 34.7 4 8/14/2006 0.78 0.062 3.42 N/A 1 9/6/2006 0.861 0.120 3.9 5.75 2 9/6/2006 0.913 0.095 2.5 7.83 3 9/6/2006 1.114 0.067 1.9 8.95 4 9/6/2006 1.102 0.079 2.06 15.1 1 9/21/2006 0.587 0.076 5 57.25 2 9/21/2006 0.755 0.051 3.4 38.3 3 9/21/2006 1.006 0.102 3.3 46.8 4 9/21/2006 0.98 0.057 4.18 52.2 Blue cells represent “rain dates”
TMDL Report DRAFT: Southeast Coast-Biscayne Bay, Pompano Canal, WBID 3271, Nutrients
Florida Department of Environmental Protection
14
I - 9
5
Flo rida Tu rnp ike
I-95
DIX
IE H
WY
SAMPLE ROADN
E 5 A
VE
COPANS RD
BLO
UN
T RD
ATLANTIC BLVD(SR814)
PO
WE
RLIN
E R
DHAMMONDVILLE RD
FLOR
IDA
'S TU
RN
PIK
E
NE
3 AV
E
NW
27 AV
E
NW 15 ST(POMP BCH)
RACE TRACK RD/SW 3ST
PO
MP
AN
O P
ARK
WA
Y
NE 10 STREET
COPANS ROAD.
NE 6TH STREET
N A
ND
RE
WS
NE
18
AV
EN
UE
AND
REW
S AV
ENU
E
NW
6TH A
VE
NU
E
DIX
IE H
WY
W
NE 33TH STREET
NE
18T
H A
V
NW
31
AV
E(S
R-8
49)
NE 1 ST
COPANS ROAD
NW
8 A
VE
WBID 3271, PompanoCanal: 1999 Land Use Data
- Divison of Water Resource Management
Bureau of Watershed Management
LegendResidential Medium Density
Residential High Density
Commercial and Services
Industrial
Institutional
Streams and Waterways
Transportation
Open Land
Sand Pine
Recreational
Reservoirs
Utilities
Melaleuca
0 0.5 10.25Miles

TMDL Report DRAFT: Southeast Coast-Biscayne Bay, Pompano Canal, WBID 3271, Nutrients
Florida Department of Environmental Protection
15
Figure 4.2 WBID 3271- Pompano Canal, Land Use Map (1999)
Table 4.2 Classification and Coverage of Land Use Categories in the
Pompano Canal Watershed, WBID 3271
Level 3 FLUCCS Land Use Description Acres Square % Use
Code Miles in WBID
1411 Shopping Centers 1.74 0.003 0.046 8310 Electrical power facilities 2.45 0.004 0.064 6440 Emergent aquatic vegetation 3.09 0.005 0.082 1820 Golf course 10.41 0.016 0.274 1210 Medium Density: Fixed Single Family Units 10.70 0.017 0.282 1920 Inactive land with street pattern 10.75 0.017 0.283 8330 Water supply plants - Including Pumping Stations 10.98 0.017 0.289 4220 Brazilian Pepper 15.22 0.024 0.401 8110 Airports 15.30 0.024 0.403 8120 Railroads and Railyards 15.76 0.025 0.415 4130 Sand Pine 22.33 0.035 0.589 1490 Commercial and Services Under Construction 23.08 0.036 0.608 1850 Parks and zoos 24.82 0.039 0.654 1390 High Density: Under construction 32.47 0.051 0.855 1480 Cemeteries 32.73 0.051 0.862 5120 Channelized Waterways, Canals 35.20 0.055 0.928 8100 Transportation 39.19 0.061 1.032 1700 Institutional 67.91 0.106 1.789 5300 Reservoirs 72.37 0.113 1.907 1710 Educational Facilities 74.19 0.116 1.955 1550 Other light industry 74.64 0.117 1.967 1830 Race tracks 142.49 0.223 3.754 1900 Open Land 357.98 0.559 9.432 8140 Roads and highways 389.58 0.609 10.265 1340 Multiple Dwelling Units, High Rise 481.55 0.752 12.688 1400 Commercial and Services 859.64 1.343 22.650 1310 High Density: Fixed Single Family Units 968.72 1.514 25.524
TOTAL 3795.29 5.930 100.000
City of Pompano Beach Population
According to the U.S Census Bureau, the population density in the City of Pompano Beach in the year 2000 was 3,814 people per square mile of land area. The Bureau reports that the total population for the city was 78,191 with 44,496 Housing Units, yielding a housing density of

TMDL Report DRAFT: Southeast Coast-Biscayne Bay, Pompano Canal, WBID 3271, Nutrients
Florida Department of Environmental Protection
16
2,170 houses per square mile. This city-wide high population density is also indicated by the land use coverage information for WBID 3271, which shows that approximately 39 percent of the land use is dedicated to residences (U.S. Census Bureau, 2004).
4.3.2 Estimating Nonpoint Loadings
Nonpoint sources addressed in this report primarily include loadings from surface runoff. TN, TP, and BOD loadings from surface runoff were estimated from data collected in April and June-September 2006 (mean concentrations of each in the water) and the amount of rainwater runoff estimated from the Watershed Management Model (WMM), which is based on the imperviousness values from different land use types in the watershed and the average annual precipitation during the Verified Period. The total loadings of nitrogen and phosphorus in the Pompano Canal watershed were estimated by averaging the TN, TP, and BOD values of samples taken during the April and June-September 2006 sampling programs throughout the watershed and using these to represent average nutrient concentrations of runoff. Runoff was calculated with the WMM model using precipitation data (annual average for the Verified Period) and coefficients of imperviousness of each land use category (CDM 1998). Precipitation data (SFWMD, DBHYDRO database, G57_R station) for the Verified Period are shown in Figure 4.3, along with the average value for the period that was used in the WMM. To justify the use of precipitation or runoff from precipitation as a reasonable proxy for nutrient loading into the Pompano Canal, one must demonstrate that water inputs (precipitation) roughly have some relationship with water outputs (flow). While this approach does not account for flux with groundwater, it is a useful yardstick to measure the applicability of the method. As shown in Figure 4.3, precipitation generally trended with flow data from station G57_S. Both G57_S and G57_R are located at the G57 SFWMD structure shown in Figure 1.2. The WMM model application was not used to generate nutrient loadings based on land use category and associated Event Mean Concentrations (EMCs) for the same reason that the longer term nutrient data were not used. Attempting to calibrate the loadings generated by the model to long-term sample data would fail to capture information from the area of the drainage basin that is generating the chl-a exceedences. That is, the model output does not calibrate well with the existing long-term data as the long-term data did not adequately sample the problem-causing area(s). Consequently, in order to attempt to account for this variability in nutrient loading and chl-a values throughout the watershed, average nutrient values from samples collected across the watershed were used as average annual nutrient concentrations. These were multiplied by the average model-derived runoff volume (from the Verified Period) to compute estimates of the annual nutrient loadings.

TMDL Report DRAFT: Southeast Coast-Biscayne Bay, Pompano Canal, WBID 3271, Nutrients
Florida Department of Environmental Protection
17
Table 4.3 Percent of Directly Connected Impervious Area for Different
Land Use Categories in the Pompano Canal Watershed, WBID 3271
Land Use Attributes Area
(acres) Percent
Impervious*
Impervious Runoff
Coeffecient
Pervious Runoff
Coeffecient
Effective Precipitation**
(in/year)
Runoff (acre-feet)
Forest/Rural Open 37.6 0.5% 0.95 0.100 54.305 17.7 Urban Open 1680.4 0.5% 0.95 0.100 54.305 792.8 Agricultural 0.0 0.5% 0.95 0.100 54.305 0.0 Low density residential 0.0 14.7% 0.95 0.100 54.305 0.0 Medium density residential 10.7 28.1% 0.95 0.100 54.305 16.4 High density residential 1482.7 67.0% 0.95 0.100 54.305 4,492.4 Communication/Highways 473.3 36.2% 0.95 0.100 54.305 873.0 Water 107.6 100.0% 0.95 0.100 54.305 462.5 Rangeland 0 0.0% 0.95 0.100 54.305 0.0 Wetlands 3.1 100.0% 0.95 0.100 54.305 13.3 Total 3795.29 6,667.97
*Percent impervious is the percent of area directly connected to the impervious area (i.e., directly connected impervious area [DCIA]). **Average annual precipitation in the watershed for the Verified Period (1998-2005)

TMDL Report DRAFT: Southeast Coast-Biscayne Bay, Pompano Canal, WBID 3271, Nutrients
Florida Department of Environmental Protection
18
Pompano Canal: Flow @ Station G57_S vs. Precipitation @ Station G57_R
0
10
20
30
40
50
60
70
80
90
100
1998 1999 2000 2001 2002 2003 2004 2005
Year
Ann
ual P
reci
p. (i
n.)
0
2000
4000
6000
8000
10000
12000
Ann
ual F
low
Vol
. (Ac
-ft)
Annual Precip. (in.)Annual Flow Volume (Ac-ft)Avg. Annual Precip. (in.)
Figure 4.3 Annual Total Precipitations and Annual Average Flow in Pompano Canal, WBID 3721
4.3.2 Estimating Runoff Using the Watershed Management Model The WMM was used to estimate annual runoff using annual rainfall and land use. The WMM was originally designed to estimate annual or seasonal pollutant loadings from a given watershed and evaluate the effect of watershed management strategies on water quality (Camp, Dresser, and McKee, 1998). The Department originally funded the WMM development under contract to Camp, Dresser, and McKee (CDM), and CDM has subsequently refined the model. For this TMDLs, the model was used to compute runoff in the WBID, while April and June-September 2006 data were used to estimate nutrient concentrations and loadings. The fundamental assumption of the model is that the amount of stormwater runoff from any given land use is in direct proportion to annual rainfall. The quantity of runoff is controlled by that fraction of the land use category that is characterized as impervious and the runoff coefficients of both pervious and impervious area. The governing equation is as follows:
(1) RL = [Cp + (CI – Cp) IMPL] * I Where:
RL = total average annual surface runoff from land use L (inches/year), IMPL = fractional imperviousness of land use L, I = long-term average annual precipitation (inches/year),

TMDL Report DRAFT: Southeast Coast-Biscayne Bay, Pompano Canal, WBID 3271, Nutrients
Florida Department of Environmental Protection
19
CP = pervious area runoff coefficient, and CI = impervious area runoff coefficient.
The data required for applying the WMM to compute annual runoff include the following:
• Area of all the land use categories,
• Percent impervious area of each land use category, and
• Annual precipitation
Data Required for Estimating Annual Runoff. To estimate the precipitation-derived runoff from the Pompano Canal watershed using the WMM, the following data were obtained: A. Precipitation data were obtained from the G57_R rain gauge located at the eastern end of the Pompano Canal (data from SFWMD DBHYDRO database). Figure 4.2 depicts the annual average precipitation and annual average flow at this location. (Flow data were obtained from G57_S, a flow gage located at the same structure) B. Areas of different land use categories in the Pompano Canal watershed were obtained by aggregating Level 1 land use coverages and by separating the low-, medium-, and high-density residential land uses from the urban land use category. Table 4.2 shows the ten land use categories applied in the WMM. These categories were used because the percent perviousness of these categories are available for Southwest Florida. The dominant land use category in the Pompano Canal watershed is high-density residential, which accounts for about 39.1 percent of the watershed’s total area. Transportation and commercial areas account for 46.2 percent of the area. The areas occupied by non-anthropogenic land uses account for only 14.7 percent of the area. C. Percent impervious area of each land use category is a very important parameter in estimating surface runoff using the WMM. Nonpoint pollution monitoring studies throughout the United States over the past 15 years have shown that annual per-acre discharges of urban stormwater pollution are positively related to the amount of imperviousness in land use (Camp, Dresser, and McKee, 1998). Theoretically, the impervious area is the area that does not retain water; therefore, 100 percent of the precipitation falling on the impervious area should become surface runoff. In practice, however, the runoff coefficient for the impervious area typically ranges between 95 and 100 percent. Impervious runoff coefficients lower than this range occur in the literature, but usually the number should not be lower than 80 percent. For the pervious area, the runoff coefficient usually ranges from 10 to 20 percent. However, values lower than this range were also observed (Camp, Dresser, and McKee, 1998). It should be noted that the impervious area percentages do not necessarily represent the directly connected impervious area (DCIA). Using a single-family residence as an example, rain falls on rooftops, sidewalks, and driveways. The sum of these areas may represent 30 percent of the total lot. However, much of the rain that falls on the roof drains to the grass and infiltrates to the ground or runs off the property, and thus does not run directly to the street. For the purposes of the WMM modeling, whenever the watershed area contributing to the surface runoff was considered, DCIA was used in place of impervious area. Table 4.3 lists the percent of

TMDL Report DRAFT: Southeast Coast-Biscayne Bay, Pompano Canal, WBID 3271, Nutrients
Florida Department of Environmental Protection
20
DCIA for different land use categories in the watershed and the quantity of surface runoff for each. Finally, average annual rainfall for the Verified Period was used with information in Table 4.3 to calculate average annual runoff. This table shows a breakdown of runoff resulting from each land use category as well as a summation of the runoff generated for the year due to precipitation. Table 4.4 shows precipitation, flow, and model-generated runoff for each year of the Verified Period as well as averages for the Verified Period. In addition, there is a % Error category that shows how well the model runoff volume agrees with the empirically-derived volume from the flow measurements. While flow volume and model-runoff volumes are not exactly matched in each year of the Verified Period, averaging smoothes out these individual annual effects and shows that average flow agrees quite well with model-runoff. Table 4.4 Annual Precipitation, Flow, and WMM Runoff in Pompano
Canal, WBID 3271
Year Annual Flow Annual Model Runoff 3 % Error 4 Volume (Ac-ft)1 Precipitation (in.)2
1998 6468.600 51.890 6371.440 1.502 1999 8475.700 80.500 9884.390 -16.620 2000 3673.200 62.160 7632.470 -107.788 2001 7167.600 56.570 6946.090 3.090 2002 6140.600 43.020 5282.320 13.977 2003 5173.100 46.870 5755.050 -11.250 2004 4603.800 38.980 4786.250 -3.963 2005 11584.900 54.450 6685.780 42.289 Avg. 6660.938 54.305 6667.974 -0.001
1. Values based on daily flow data from DBHYDRO database for station G57_S 2. Values based on daily precipitation data from DBHYDRO database for station G57_R 3. Values from WMM model using Annual Precipitation shown here 4. % Error between Empirical Flow Data and Model Runoff Estimations

TMDL Report DRAFT: Southeast Coast-Biscayne Bay, Pompano Canal, WBID 3271, Nutrients
Florida Department of Environmental Protection
21
Chapter 5: DETERMINATION OF ASSIMILATIVE CAPACITY
5.1 Determination of Loading Capacity
The goal of this TMDL development is to identify the maximum allowable TN, and TP loadings to the watershed, so that Pompano Canal will meet the narrative nutrient water quality criterion and maintain its function and designated use as a Class III water. The Department has determined that using single regression model based on June-September 2006 sample data (Table 4.1) is the best method available to estimate the loading capacity of the canal.
5.2 Site Selections and the Relationship between Nutrients and Precipitation
Site 1 is upstream of Site 2, the long term sampling station (FLBROW 110). Sites 3 and 4 are located in the secondary canal running alongside I-95. This canal intersects with and overflows into the Pompano Canal just upstream of site 2. Site 2 and 3 were chosen for obtaining relationships between chl-a and nutrients (TN and TP) via empirical analysis since the sites are located downstream of each canal where to have longer time for algae to respond to inputs of nutrients as well as to represent each canal in terms of canal hydrogeology. With the exception of heavy (greater than 1.0 inches per event) rain events on July 13, 2006, August 13, 2006 and September 6, 2006, there are linear, positive relationships observed for the two sites between chl-a and TN (r2 = 0.72, n = 10) and between chl-a and TP (r2 = 0.36, n = 10) during the period of June-September, 2006. During high rain events, more particulate N and P can be possibly delivered into the waterbody via storm water surface runoff and bottom sediment resuspension, resulting in increases in TN and TP with no stimulation of algae. Such direct responses of chl-a to nutrients inputs to the waterbody may allow us to develop assimilative capacity in the waterbody to establish nutrient thresholds for TMDLs. Based on best-fit equations shown in Figures 5.1 and 5.2, TN and TP thresholds at the chl-a level of 20 µg/L were estimated to be 0.64 mg/L and 0.051 mg/L, respectively.
5.3 Critical Conditions
The estimated assimilative capacity was based on short-term datasets from April and June-September 2006 rather than the long-term data set available for the Verified Period because the long-term data set (a) failed to capture the spatial variability of the chl-a data within the drainage area, (b) did not recognize its correlation to rain events, and (c) failed to provide a useable relationship between nutrients and chl-a. The Department concluded that the short-term dataset was the most accurate and useful data available.

TMDL Report DRAFT: Southeast Coast-Biscayne Bay, Pompano Canal, WBID 3271, Nutrients
Florida Department of Environmental Protection
22
y = 70.953x - 25.335R2 = 0.7221
0
20
40
60
0.0 0.2 0.4 0.6 0.8 1.0 1.2
TN (mg/L)
Chl-a
(µg/
L)
site 2
site 3
Figure 5.1 The Relationship between Chlorophyll-a and Total Nitrogen
y = 302.33x + 4.5594R2 = 0.3606
0
20
40
60
0.00 0.05 0.10 0.15
TP (mg/L)
Chl
-a (µ
g/L)
site 2
site 3
Figure 5.2 The Relationship between Chlorophyll-a and Total Phosphorus

TMDL Report DRAFT: Southeast Coast-Biscayne Bay, Pompano Canal, WBID 3271, Nutrients
Florida Department of Environmental Protection
23
5.4 Existing and Allowable Loads
As listed in Florida Department of Environmental Protection’s Group 4 Verified List, the averaged existing concentrations of TN and TP causing the chlorophyll-a impairment are 0.76 mg/L and 0.059 mg/L, respectively. The allowable concentrations of TN and TP from the watershed, as shown in Section 5.2, were estimated to be 0.64 mg/L and 0.051 mg/L, respectively. Along with average runoff volume calculated in Table 4.4, these allowable concentrations were used to estimate the average annual loadings of these nutrients. Table 5.1 shows the annual existing and allowable nutrient loading estimates for the watershed.
Table 5.1 Estimated Annual Existing and Allowable Nutrient Loadings
in Pompano Canal, WBID 3271
Existing
Concentration (mg/L) Allowable
Concentration (mg/L) Existing
Load (lb)* Allowable Load (lb)*
TN 0.76 0.640 13,764.28 11,590.98 TP 0.059 0.051 1,068.54 923.66
*Load (lb) = Concentration (mg/L) x 6660.0938 (Ac-ft) x 2.71931622034286

TMDL Report DRAFT: Southeast Coast-Biscayne Bay, Pompano Canal, WBID 3271, Nutrients
Florida Department of Environmental Protection
24
Chapter 6: DETERMINATION OF THE TMDL
6.1 Expression and Allocation of the TMDL
The objective of a TMDL is to provide a basis for allocating acceptable loads among all of the known pollutant sources in a watershed so that appropriate control measures can be implemented and water quality standards achieved. The goal of the TMDL development for Pompano Canal is to identify the maximum allowable TN and TP loadings to the watershed so that it will meet applicable water quality standards and maintain its function and designated use as a Class III water. A TMDL is expressed as the sum of all point source loads (Waste Load Allocations, or WLAs), nonpoint source loads (Load Allocations, or LAs), and an appropriate margin of safety (MOS) that takes into account any uncertainty concerning the relationship between effluent limitations and water quality: TMDL = ∑ WLAs + ∑ LAs + MOS As discussed earlier, the WLA is broken out into separate subcategories for wastewater discharges and stormwater discharges regulated under the NPDES Program: TMDL ≅ ∑ WLAswastewater + ∑ WLAsNPDES Stormwater + ∑ LAs + MOS It should be noted that the various components of the revised TMDL equation may not sum up to the value of the TMDL because (a) the WLA for NPDES stormwater is typically based on the percent reduction needed for nonpoint sources and is also accounted for within the LA, and (b) TMDL components can be expressed in different terms (for example, the WLA for stormwater is typically expressed as a percent reduction, and the WLA for wastewater is typically expressed as mass per day). WLAs for stormwater discharges are typically expressed as “percent reduction” because it is very difficult to quantify the loads from MS4s (given the numerous discharge points) and to distinguish loads from MS4s from other nonpoint sources (given the nature of stormwater transport). The permitting of stormwater discharges also differs from the permitting of most wastewater point sources. Because stormwater discharges cannot be centrally collected, monitored, and treated, they are not subject to the same types of effluent limitations as wastewater facilities, and instead are required to meet a performance standard of providing treatment to the “maximum extent practical” through the implementation of BMPs. This approach is consistent with federal regulation 40 CFR § 130.2[I] (U.S. Environmental Protection Agency, 2003), which states that TMDLs can be expressed in terms of mass per time (e.g., pounds per day), toxicity, or other appropriate measure. The TMDL for Pompano Canal is expressed in terms of pounds per year and percent reduction, and represents the maximum annual load the canal system can assimilate and maintain the narrative nutrient criterion (Table 6.1). The TMDLs are also expressed in terms of pounds per day. However, the TMDLs to be implemented are those expressed on a mass per year basis, and the expression of the TMDL on a mass per day basis is for information purposes only.
TMDL Report DRAFT: Southeast Coast-Biscayne Bay, Pompano Canal, WBID 3271, Nutrients
Florida Department of Environmental Protection
25
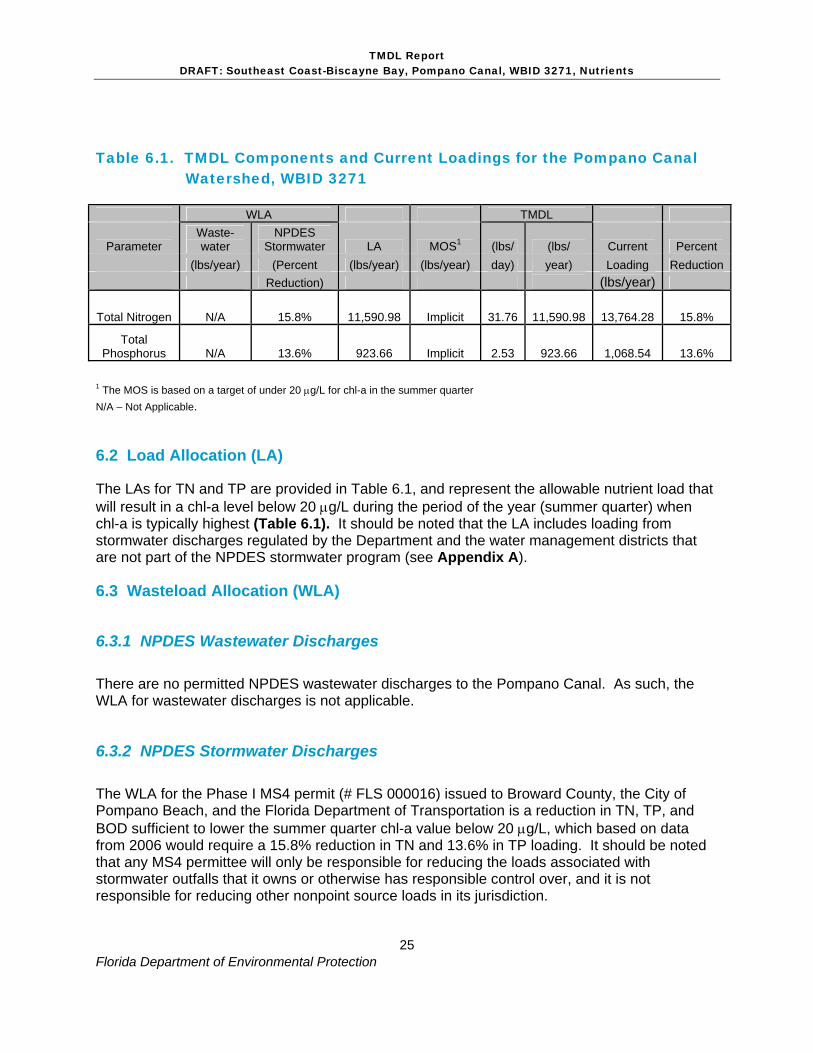
Table 6.1. TMDL Components and Current Loadings for the Pompano Canal
Watershed, WBID 3271
WLA TMDL
Parameter Waste-water
NPDES Stormwater LA MOS1 (lbs/ (lbs/ Current Percent
(lbs/year) (Percent (lbs/year) (lbs/year) day) year) Loading Reduction Reduction) (lbs/year)
Total Nitrogen N/A 15.8% 11,590.98 Implicit 31.76 11,590.98 13,764.28 15.8%
Total Phosphorus N/A 13.6% 923.66 Implicit 2.53 923.66 1,068.54 13.6%
1 The MOS is based on a target of under 20 μg/L for chl-a in the summer quarter N/A – Not Applicable.
6.2 Load Allocation (LA)
The LAs for TN and TP are provided in Table 6.1, and represent the allowable nutrient load that will result in a chl-a level below 20 μg/L during the period of the year (summer quarter) when chl-a is typically highest (Table 6.1). It should be noted that the LA includes loading from stormwater discharges regulated by the Department and the water management districts that are not part of the NPDES stormwater program (see Appendix A).
6.3 Wasteload Allocation (WLA)
6.3.1 NPDES Wastewater Discharges
There are no permitted NPDES wastewater discharges to the Pompano Canal. As such, the WLA for wastewater discharges is not applicable.
6.3.2 NPDES Stormwater Discharges
The WLA for the Phase I MS4 permit (# FLS 000016) issued to Broward County, the City of Pompano Beach, and the Florida Department of Transportation is a reduction in TN, TP, and BOD sufficient to lower the summer quarter chl-a value below 20 μg/L, which based on data from 2006 would require a 15.8% reduction in TN and 13.6% in TP loading. It should be noted that any MS4 permittee will only be responsible for reducing the loads associated with stormwater outfalls that it owns or otherwise has responsible control over, and it is not responsible for reducing other nonpoint source loads in its jurisdiction.

TMDL Report DRAFT: Southeast Coast-Biscayne Bay, Pompano Canal, WBID 3271, Nutrients
Florida Department of Environmental Protection
26
6.4 Margin of Safety
TMDLs must address uncertainty issues by incorporating a MOS into the analysis. The MOS is a required component of a TMDL and accounts for the uncertainty about the relationship between pollutant loads and the quality of the receiving waterbody (Clean Water Act, Section 303[d][1][c]). Considerable uncertainty is usually inherent in estimating nutrient loading from nonpoint sources, as well as predicting water quality response. The effectiveness of management activities (e.g., stormwater management plans) in reducing loading is also subject to uncertainty. The MOS can either be implicitly accounted for by choosing conservative assumptions about loading or water quality response, or explicitly accounted for during the allocation of loadings. For the Pompano Canal watershed, an implicit MOS was employed by setting the load reductions such that the summer quarter, typically having the highest chl-a values, would have an average predicted chl-a value under 20 μg/L. By reducing the highest quarterly chl-a value below the threshold and consequently shifting the distribution of values for the other quarters down as well, the annual average chl-a value should be protected from exceeding the threshold.

TMDL Report DRAFT: Southeast Coast-Biscayne Bay, Pompano Canal, WBID 3271, Nutrients
Florida Department of Environmental Protection
27
Chapter 7: NEXT STEPS: IMPLEMENTATION PLAN DEVELOPMENT AND BEYOND
7.1 Basin Management Action Plan
Following the adoption of this TMDL by rule, the next step in the TMDL process is to develop an implementation plan for the TMDL, which will be a component of the Basin Management Action Plan (BMAP) for the Pompano Canal watershed. This document will be developed over the next year in cooperation with local stakeholders and will attempt to reach consensus on more detailed allocations and on how load reductions will be accomplished. The BMAP will include the following:
• Appropriate allocations among the affected parties,
• A description of the load reduction activities to be undertaken,
• Timetables for project implementation and completion,
• Funding mechanisms that may be utilized,
• Any applicable signed agreement,
• Local ordinances defining actions to be taken or prohibited,
• Local water quality standards, permits, or load limitation agreements, and
• Monitoring and follow-up measures.

TMDL Report DRAFT: Southeast Coast-Biscayne Bay, Pompano Canal, WBID 3271, Nutrients
Florida Department of Environmental Protection
28
References
Broward County. 2003. Broward-by-the-numbers. Broward County, Office of Urban Planning and Redevelopment, Planning Services Division. No. 2. August, 2003. http://www.broward.org/planningservices/bbtn2.pdf
Camp, Dresser, and McKee, 1998. User’s Manual: Watershed Management Model, Version 4.1. Camp, Dresser, and McKee, Rouge River National Wet Weather Demonstration Project. PRO-NPS-TM27.02. Wayne County, Michigan.
Florida Department of Environmental Protection, December 1999. Ecosummary, Pompano Canal, Broward County. Florida Department of Environmental Protection, Southeast District, Assessment and Monitoring Program. Port St. Lucie, Florida.
—, February 2001. A Report to the Governor and the Legislature on the Allocation of Total Maximum Daily Loads in Florida. Florida Department of Environmental Protection, Allocation Technical Advisory Committee, Division of Water Resource Management, Bureau of Watershed Management, Tallahassee, Florida.
—, April 2001. Chapter 62-302, Surface Water Quality Standards, Florida Administrative Code (F.A.C.), Florida Department of Environmental Protection, Division of Water Resource Management, Bureau of Watershed Management, Tallahassee, Florida.
—, April 2001. Chapter 62-303, Identification of Impaired Surface Waters Rule (IWR), Florida Administrative Code, Florida Department of Environmental Protection, Division of Water Resource Management, Bureau of Watershed Management, Tallahassee, Florida.
—, September 2004. Nutrient TMDL for Lower Sweetwater Creek (WBID 1570A). Florida Department of Environmental Protection, Division of Water Resource Management, Bureau of Watershed Management, Tallahassee, Florida.
—, June 2006. Division of Water Resource Management, Bureau of Information Systems, Geographic Information Systems Section, Florida Department of Environmental Protection, Tallahassee, Florida. Available at http://www.dep.state.fl.us/gis/contact.htm
FWRA, 1999. Florida Watershed Restoration Act, Chapter 99-223, Laws of Florida. Harper, H.H. and Baker, D. M., 2003. Evaluation of Alternative Stormwater Regulations for Southwest Florida, Final Report. Environmental Research and Design, Inc., Orlando, Florida, September, 2003. Markward, Dave. 2006. Personal Communication. Operations Manager, Broward County Commission, Water and Wastewater Services- Water Management Division. 2555 W. Copans Rd., Pompano Beach, FL 33069-1233. [email protected] National Weather Service, 2004. National Weather Service, National Climatic Data Center, Climate Interactive Rapid Retrieval User System (CIRRUS) Database hosted by the Southeast Regional Climate Center web site, available at http://www.dnr.state.sc.us/pls/cirrus/cirrus.login.

TMDL Report DRAFT: Southeast Coast-Biscayne Bay, Pompano Canal, WBID 3271, Nutrients
Florida Department of Environmental Protection
29
South Florida Water Management District. DBHYDRO database. Available at http://glades.sfwmd.gov/pls/dbhydro_pro_plsql/show_dbkey_info.main_page U. S. Census Bureau Web Site. 2004. Available at http://www.census.gov/ U. S. Geological Survey, July 2004. United States Geological Survey, Surface Water Data for Florida web site, available ate http://waterdata.usgs.gov/fl/nwis/sw. U. S. Environmental Protection Agency, April 1991. Guidance for Water Quality –based Decisions: The TMDL Process. U. S. Environmental Protection Agency, Office of Water, Washington, D.C. EPA-440/4-91-001. —, November 1999. Protocol for Developing Nutrient TMDLs. U. S. Environmental Protection Agency, Office of Water, Washington, D.C. EPA841-B-99-007. Whitman, D., W. Robertson, K. Zhang, S. Leatherman, and S. Baig. 2000. An airborne laser topographic mapping study of eastern Broward County, Florida with applications to hurricane storm surge hazard. American Geophysical Union, Spring Meeting Sessions. http://www.earthscape.org/r1/agu05/whd01/whd01.html
TMDL Report DRAFT: Southeast Coast-Biscayne Bay, Pompano Canal, WBID 3271, Nutrients
Florida Department of Environmental Protection
30
Appendix A: Background Information on Federal and State Stormwater Programs
In 1982, Florida became the first state in the country to implement statewide regulations to address the issue of nonpoint source pollution by requiring new development and redevelopment to treat stormwater before it is discharged. The Stormwater Rule, as authorized in Chapter 403, F.S., was established as a technology-based program that relies on the implementation of BMPs that are designed to achieve a specific level of treatment (i.e., performance standards) as set forth in Chapter 62-40, F.A.C.
The rule requires the state’s water management districts (WMDs) to establish stormwater pollutant load reduction goals (PLRGs) and adopt them as part of a Surface Water Improvement and Management (SWIM) plan, other watershed plan, or rule. Stormwater PLRGs are a major component of the load allocation part of a TMDL. To date, stormwater PLRGs have been established for Tampa Bay, Lake Thonotosassa, the Winter Haven Chain of Lakes, the Everglades, Lake Okeechobee, and Lake Apopka. No PLRG has been developed for Newnans Lake at the time this report was developed.
In 1987, the U.S. Congress established Section 402(p) as part of the federal Clean Water Act Reauthorization. This section of the law amended the scope of the federal NPDES stormwater permitting program to designate certain stormwater discharges as “point sources” of pollution. These stormwater discharges include certain discharges that are associated with industrial activities designated by specific standard industrial classification (SIC) codes, construction sites disturbing 5 or more acres of land, and master drainage systems of local governments with a population above 100,000, which are better known as municipal separate storm sewer systems (MS4s). However, because the master drainage systems of most local governments in Florida are interconnected, the EPA has implemented Phase 1 of the MS4 permitting program on a countywide basis, which brings in all cities (incorporated areas), Chapter 298 urban water control districts, and the Florida Department of Transportation throughout the 15 counties meeting the population criteria.
An important difference between the federal and state stormwater permitting programs is that the federal program covers both new and existing discharges, while the state program focuses on new discharges. Additionally, Phase II of the NPDES Program expands the need for these permits to construction sites between 1 and 5 acres, and to local governments with as few as 10,000 people. The revised rules required that these additional activities obtain permits by 2003. While these urban stormwater discharges are now technically referred to as “point sources” for the purpose of regulation, they are still diffuse sources of pollution that cannot be easily collected and treated by a central treatment facility similar to other point sources of pollution, such as domestic and industrial wastewater discharges. The Department recently accepted delegation from the EPA for the stormwater part of the NPDES Program. It should be noted that most MS4 permits issued in Florida include a reopener clause that allows permit revisions to implement TMDLs once they are formally adopted by rule.

Florida Department of Environmental Protection Division of Water Resource Management
Bureau of Watershed Management 2600 Blair Stone Road, Mail Station 3565
Tallahassee, Florida 32399-2400 (850) 245-8561
www2.dep.state.fl.us/water/