nutrition education in chilean primary schools en la... · nutrition education in chilean primary...
TRANSCRIPT

'T
Nutrition education in Chilean primary schools
Sonia Olivares, Isabel Zacarias, Margarita Andrade, Juliana Kain, Lydia Lera,Fernando Vio, and Cecilio Mor6n
Abstract $4,590 and 20.6% of the population was living underthe line of poverty.
The purpose of this study was to incorporate nutrition Approximately 2 million children attend 10,621 pri-education in Chilean primary schools. The baseline infor- mary schools, 92.2% of whom attend public schools.mation included nutritional status, food consumption Up until 2003, 8 years of mandatory education wereand physical activity of 1,701 children from 3rd to 7th required in Chile, but starting in 2004 this has beengrade in ten urban and rural schools. Main results showed increased to 12 years [1].a high prevalence of obesity (15.4%) and overweight During the last 25 years, important changes have(19.6%), low consumption of vegetables, fruits, and dairy occurred in the epidemiologic profile of the Chilean
Iproducts, high intake of snacks and a low level of physical; population. Life expectancy rose from 60 years in 1970activity, especially in girls. Because the Ministry of Edu~ to 73 years in 2001 for men, and from 65 to 80 for
, cation does not allow the incorporation of new programs women during the same period. The country simulta-into the curriculum, the educational strategy was based neouslyexperienced a demographic and epidemiologicon the development of a text book, a teacher's guide, five transition, resulting in an aging population and a shiftpractical guides for students from third to eighth grade from infectious to chronic diseases. A sedentary life-
, and a CD-Rom. These materials were validated by 36 style and consumption of processed foods rich in fats,, teachers in six schools through an educational interven- sugars, salt, and low in dietary fiber, all known risk fac-
tion. Teachers and students considered the educational tors for obesity, have also risen considerably [2].materials useful, motivational and easy to understand. Between 1987 and 2000, the prevalence of obesityThis program is being implemented in 57 schools. (defined as BMI percentile ~ 95 of the CDC 2000 ref-
erence) among schoolchildren entering first grade atpublic schools across the country increased from 5.1 %
Key words: Nutrition education, school children to 14.7% for boys and from 4.0% to 15.8% for girls,[3,4]. bn the other hand, the prevalence of stunting(defined as height/age < 2 SD of the National Center
Introduction for Health Statistics (NCHS/WHO) reference declinedfrom 5.9% in 1993 to 3.1% in 2002, whereas weight
According to the Population Census carried out in deficit {defined as weight/height < 2 SD of the same2002, Chile had 15,116,435 inhabitants, an annual reference) was very low, 1.6% in 2002 [5].growth rate of 1.2%, 86.5% of the population living in Considering that obesity is the main nutrition prob-urban areas, and a literacy rate of 95.8% among thoSe leI11 among Chilean children and that it has been dem-10 years of age and older. The per capita income was US onstrated that being obese in childhood almost doubles
the risk of having this condition during adulthood [6],I ' Ii b I . d d uti , various initiatives are being developed to address this
SomaO vares,lsa e Zacarias,MargantaAn ra e,J ana bl [7 8]Kain, Lydia Lera, and Fernando Vio are affiliated with the pro em , . .. .Institute of Nutrition and Food Technology (INTA), Univer- In 1997, the MInistry of Health changed the tradl-sity of Chile. Cecilio Mor6n is affiliated with the Food and tional maternal and childhood policies for new healthAgriculture .organizati~n of the United Nation~ (FAO). and nutrition intervention priorities, based on cardio-
P!ease .dlrect qu~nes to the corr.espondlt;1g. autho.r: vascular disease, obesity, cancer, hypertension, diabetes,Soma Olivares, Cas Ilia 138-11, Santiago, Chile, e-mail.. . d .
I d fr thI [email protected]. o.steoporosls, an . an~mla. n or e~ t? con ont eMention of the names of firms and commercial products risk factors of this diseases, the MInistry of Health
i does not imply endorsement by the United Nations University. published the Chilean Dietary Guidelines (1997) and1
I
Food and Nutrition Bulletin, vol. 26, no. 2 (supplement 2) @ 2005, The United Nations University. 5179

5180 S. Olivares
an inter-sector organization, the National Board for foods limit the optimization of the program.Health Promotion, VIDA CHILE, was created in 1998, Additionally, each year JUNAEB carries out a censuswith the specific goal of reducing the prevalence of on the weight and height of all first grade children in allobesity in first grade schoolchildren from 16% in 2000 public schools throughout the country. This informa-to 12% in 2010 [7]. tionon the national and regional levels is available on the
In addition, a new strategy in the country, known as Internet (nutrition map, http://www.junaeb.cl) [5]."Health-Promoting Schools," has been implementedsince 1999 with the purpose of creating positive envi-ronmentalconditions to promote more healthful eating Nutrition education in Chilean primaryhabits and physical activity among schoolchildren. In schoolsthe country, currently 3,100 schools (29%) are workingin health promotion. It is clear that appropriate nutrition is essential for chil-
Another specific initiative was to improve the diet dren's growth and the changes in eating and physicalquality of low-income schoolchildren who are benefici- activity habits must occur at the earliest age possible.aries of the School Feeding Program (SFP) [9,10]. This Therefore, the school represents the best opportunity toprogram started in Chile in 1929, is administered by the adopt a healthy lifestyle through knowledge, attitudes,National Board of Assistance and Scholarships (Junta and behavior [11-13]. However, the primary schoolNacional de Auxilio Escolar y Becas or JUNAEB) and curriculum of the Chilean Ministry of Education doeswill benefit 875,531 primary schoolchildren daily in not yet include nutrition education [1].2004, with a fiscal annual budget of US $89 million. The main barriers to implement nutrition educa-
The main goal of the SFP is to promote school tion programs for primary schoolchildren in Chile areattendance by providing free meals to children who- the\Cachers' lack of nutrition knowledge, insufficientmight otherwise drop out of school. The meals have education materials, and the difficulty in obtainingdifferent nutrition contents (250, 700, and 1000 kcal) government support to address these issues with anand are distributed 178 days per year [5,9,10]. adequate methodology [14]. Taking these barriers into
In 2000, JUNAEB, with the technical support of the consideration [15], INTA and the Ministry of Educa-Institute of Nutrition and Food Technology (INTA) tion requested the Food and Agriculture Organizationof the University of Chile and the Ministry of Health, of the United Nations (FAO)"" to jointly design andimproved substantially the nutrition quality of meals. implement a technical cooperation project, the specificBreakfasts now include milk 5 days a week (instead of objectives of which were the following:the milk substitute delivered before). During lunch, the »To promote the integration of nutrition educationfrequency of salads has increased from 4 to 8 times per for 3rd to 8th grade curriculum of Chilean primarymonth, and fruits from 6 to 10 times per month. The schools, based on present food habits and nutritionnew program allows a maximum of 10% of calories status.from saturated fat, which has been accomplished by» To design. and validate appropriate learning materialschanging the type of meat. Table 1 shows the nutrition for primary schoolteachers and children.characteristics of the basic program (700 kcal/day) pro- »To develop and validate a training program for teach-vided by private food companies that deliver the meals ers, to be replicated in the whole country.after receiving a licence from JUNAEB. The project was developed in 10 public schools
Although the quality of the meals has improved, they located in low-income neighborhoods from three dif-are still deficient in terms of frequency and amount ferent regions representing the geographic variabilityof low-fat milk, vegetables, and fruits offered. Budget of the country: North (Region I), Center (Metropolitanconstraints and logistic difficulties for handling fresh Regi0n), andSouth (Region X). In each region, schools
with a minimum of 30 students per grade and fromTABLE 1. N.utrition content .of meals offered by the Chilean both rural and urban settings were selected. Figure 1Scltool Feeding Program and Its coverage of the US RDA [10] shows the model' followed during the development of
Elementary % Coverage the project.Nutrition content schoolsd ofRDAb
P%{daily,minimum) 11% 60% Baseline informationF% {daily, minimum 20-25% 36%
and maximum) Students from one class (grades 3rd to 7th) from eachSFA% (daily, maximum) 10% 35% of the 1? schools participated in the study, totalingFree sugars 25 g 50% 1,701 children between the ages of 8 and 13. The pro-
portion of boys and girls was similar, while the averageRDA, Recommended Dietary Allowance; P, protein, F, fat; SFA,
saturated fata. Contents for breakfast and lunch (700 Kcal) "" TCP/CHl/OO65 "Nutrition Education in Primary Schools"b. Considering a 2000 Kcal daily requirement project funded by FAD.

INutrition education in Chilean primary schools S181
viewed the children on their dietary and physical activ-Diagnosis ity habits. Anthropometric measurements and surveys
Schoolchildren nutritional status, food were performed between April and June of 2001.consumption, nutritional knowledge Nutrition status was determined using body-mass
and attitudes index (BMI, kg/m2). For each child, BMI was estimatedTeachers' training needs on food and nutrition by age and sex and compared with the CDC/NCHS ref-
I erence 2000 [4]. This has been recently recommendedfor evaluating Chilean children from 6 to 18 years ofage. The cut-off percentiles used to classify the nutri-tion status of the children were those recommendedby the North American Committee of Experts inChildhood Obesity [17]; underweight: BMI percentile< 10; normal weight: BMI percentile 2: 10 to < 85;overweight: BMI percentile 2: 85 to < 95; obese: BMIpercentile 2: 95.
The data analyses showed no significant differenceswhen comparing nutrition status among the three geo-
Implementation graphic regions, or between urban versus rural settings.I Production of educational materials Thus, results represented the sample as a whole.
Teacher training Fi~re 2 shows the nutrition status in both boysImplementation of NE intervention in and girls by age group (~-9, 10-11, and ~2-13 yea.rs).
school settings . Overall, boys showed a higher rate of obesIty than gIrls.
Significant differences in nutrition status were foundaccording to age, with the highest prevalence of obesityamong the younger boys (p < .05). In girls, no differ-
E I t. n ences were observed according to age.va ua 10 '" 1 d .1 J: d . .fi dSchoolchildren's changes in nutritional io eva uate ai y 1.00 c.onsumptIon, a quantI .eknowledge, attitudes, and food consumption food ~eque.nCY q~eStIOnnaIre (FF~) [18] was ap~hed
by traIned IntervIewers on all children. We obtaInedinformation on those foods recommended by the
FIG. 1. Nutrition education (NE) strategy Chilean Dietary Guidelines [8], that is, dairy products,fruits, vegetables, and also bread because its consump-tion is extremely high in the country. In addition, we
age was exactly the same, (10.6 :t 1.4 years) for both collected data on energy-dense foods such as snacksgenders. Data were analysed according to gender and by and beverages.three age groups (8-9, 10-11, and 12-13 years) [16]. The average daily food intake of the total sample
In each city, three trained interviewers (nutritionists was expressed in grams/day (mean:t SD), by age andor teachers), evaluated the nutrition status and inter- gender (table 2). Intake of dairy products was low. Boys
TABLE 2. Selected food intake by Chilean schoolchildren, by group and gender (mean :t SD in grams/day)
8-9 y, n = 611 10-11 y, n = 654 12-13 y, n = 436 Recom-Food groups Boys n = 324 Girls n = 287 Boys n = 365 Girls n = 289 Boys n = 238 Girls n = 436 mended4
Milk and 308.3:t 192.2 299.3:t 182.3 281.7:t 180.6h 242.5:t 167.5 267.1:t m.1h 240.9:t 155.9 750 mLyogurt ,
Fruits and 197.4 :t 135.9 220.4:t 149.9' 237.2:t 153.7' 210.7:t129.7 271.3:t 183.6' 238.1:t 145.7 400 g
vegetablesBread 269.6 :t 97.6h 232.1:t 94.1 295.8 :t 112.7h 255.4:t112.2 324.6 :t 133.2h 270.1:t 117.8 200 gSnacks 113.0:t 79.7 111.3:t 81.3 118.6:t 85.4' 106.7:t70.1 135.4:t 99.7' 124.2:t 94.0 -
(sweet andsalty) , .
Beverages 218.3:t 167.1 219.3:t 176.2 279.0:t 184;8' 250.9:t 173.0 301.1:t 199.9' 295.8:t 229.4 -
Source: Adapted from [16]a. Dietary Guidelines, Chilean Ministry of Healthb. p < .001 for higher statistical differences between boys and girls.c. Student's t-test p < .05
I, "

S182 S. Olivares
Boys (a) Girls (b)7 7
63.7
c: c:~ ~
"0 "0
::E5 ::E5u u- -0g 0
~ ~u u
\/13 \/13~O ~0' 0
2 2
1 143 33 25 2B
10 Underweight orma Overweight Obesity 0 Underweight orma Overweight Obesity
1!J8-9y 810-11y 812-13y 1!J8-9y 810-11y 812-13y
Weight Status
FIG. 2. Nutrition status of Chilean schoolchildren, by age group
consumed significantly more of these products in both result is similar to several epidemiologic studies where10-11 years and 12-13 years age groups. Intake of fruits an inv~se association has been found between dairyand vegetables was also low in all age groups. Other consumption and risk of being overweight [23].studies have found similar results [19, 20]. Ironically, To estimate the physical activity habits (PA), studentsChile is not only a fruit exporting country, but fruits were asked about the number of hours spent watch-are relatively inexpensive. This shows the urgent need ing television (TV) during a school day and a typicalto implement nutrition education programs which weekend day, and about the frequency of after-schooladdress the importance of consuming these foods. FA, such as running, jumping, jogging, bicycle riding,
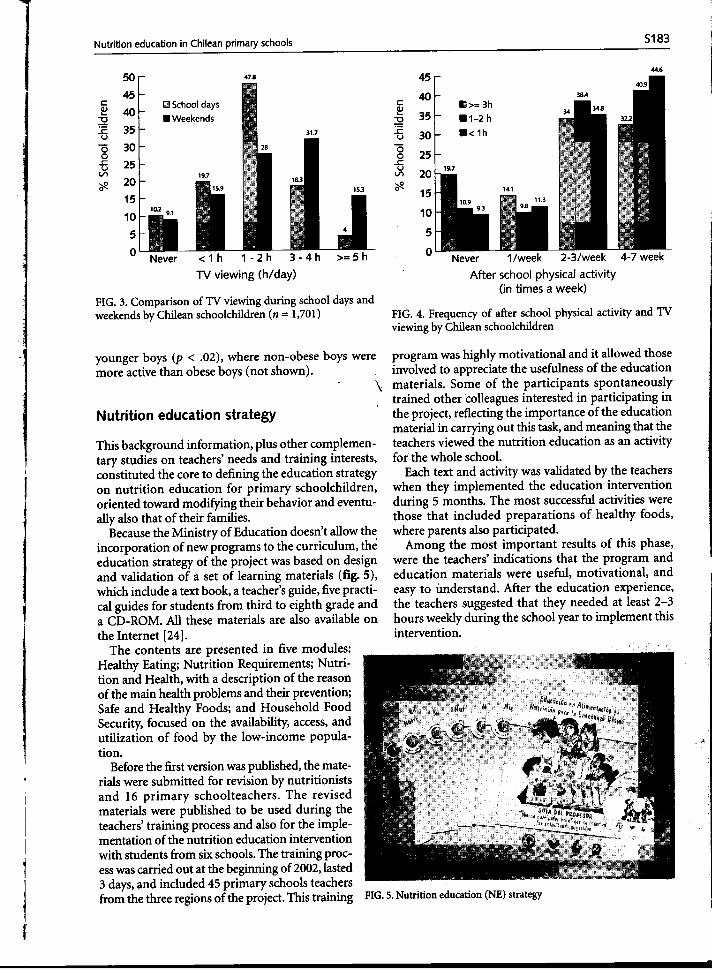
Intake of bread was significantly higher in boys or playing soccer. TV viewing was calculated adding theacross age groups. This has been found consistently in total number of shows watched on a daily basis, as hasother studies performed in the country [19,20]. Based been done in previous studies [22].on the Chilean Food Pyramid, the Ministry of Health Figure 3 compares total TV viewing during a schoolrecommends a total daily intake of cereals (apart from day and a typical weekend day. During a school day,bread, this group includes pastas, rice, potatoes, corn) 10% of the children reported never watching TV, andof 350 g and 300 g for 6- to 9-year-old boys and girls, 22.3% watched more than 3 hours. During the week-respectively, whereas for children 10-13 years old this end, the proportioh of children who watched morerecommendation is 375 g and 325 g, respectively. In this than 3 hours per day increased considerably, to 47%.study, bread alone accounted for around 80% of the The difference in TV viewing between a weekend daytotal recommendation; adding other foods from this and a week day was highly significant (p < .0001. Nogroup, which constitute the staple of our diet, obviously differerices were found by gender.increases the calorie intake. The time children spent in after-school PA varied
Intake of snacks rich in fat and sugar was very high according to age and gender. Although boys wereand similar for boys and girls in the younger groups. significantly more active than girls, only half of theIn the older groups, boys consumed significantly more boys were physically active four or more times a week.than girls. The intake of snacks represents 450 to 600 Between 7% and 9.5% of boys and between 14% andkcal extra daily. This is similar to the figures found 21% of , girls never engaged in FA. In boys, no differ-in schoolchildren by Yanez et al. [19], whereas Kain ences were noted across age groups. Younger girls wereet al. [21] reported approximately the same among significantly more active than older girls (p < .03) (notpreschoolchildren (350-500 kcal). In addition, a study shown).about food advertisement and preferences in this age When examining the distribution of TV viewinggroup showed that the products most often remem- in relation with after-school PA (fig. 4), the analysisbered and purchased by the children were French fries, showed an association between these two variables,sweet and salty snacks, soft drinks and fast foods [22]. that is, the more time children spent in FA, the less time
When we compare intake of each food group and they devoted to TV watching (p < .03).nutrition status, only the consumption of dairy prod- When analyzed for an association between afteructs was significantly greater among non-obese chil- -school PA and nutrition status according to age anddren for both genders across age groups (p < .005). This gender, an association was found only among the
,
,
Nutrition education in Chilean primary schools 5183 ,
. -
5 45 44~
4 40~ mSchooldays ~ B>=3h:2 BWeekends -0 35 B1-2 h
~ 3 31.7 ~ 30 B< 1h-0 3 -2. 2 g 25u ..t:
V1 ~ 20 19.7* 2 ~1 0 15
1 10 I5
Never < 1 h 1 - 2 h 3 - 4 h >= 5 h 0 Never 1/week 2-3/week 4-7 week
TV viewing (h/day) After school physical activity(in times a week)
FIG. 3. Comparison of TV viewing during school days andweekends by Chilean schoolchildren (n = 1,701) FIG. 4. Frequency of after school physical activity and TV
viewing by Chilean schoolchildren
younger boys (p < .02), where non-obese boys were program was highly motivational and it allowed thosemore active than obese boys (not shown). involved to appreciate the usefulness of the education
\ materials. Some of the participants spontaneouslytrained other colleagues interested in participating in
Nutrition education strategy the project, reflecting the importance of the educationmaterial in carrying out this task, and meaning that the
This background information, plus other complemen- teachers viewed the nutrition education as an activitytary studies on teachers' needs and training interests, for the whole school.constituted the core to defining the education strategy Each text and activity was validated by the teacherson nutrition education for primary schoolchildren, when they implemented the education interventionoriented toward modifying their behavior and eventu- during 5 months. The most successful activities wereally also that of their families. those that included preparations of healthy foods,
Because the Ministry of Education doesn't allow the where parents also participated.incorporation of new programs to the curriculum, the Among the most important results of this phase,education strategy of the project was based on design were the teachers' indications that the program andand validation of a set of learning materials (fig. 5), education material~ were useful, motivational, andwhich include a text book, a teacher's guide, five practi- easy to understand. After the education experience,
1 cal guides for students from third to eighth grade and the teachers suggested that they needed at least 2-3! a CD-ROM. All these materials are also available on hours weekly during the school year to implement this
the Internet [24]. intervention.The contents are presented in five modules:
Healthy Eating; Nutrition Requirements; Nutri-tion and Health, with a description of the reasonof the main health problems and their prevention;Safe and Healthy Foods; and Household FoodSecurity, focused on the availability, access, andutilization of food by the low-income popula-. "
tlon.
Before the first version was published, the mate-. rials were submitted for revision by nutritionists
and 16 primary schoolteachers. The revisedmaterials were published to be used during theteachers' training process and also for the imple-mentation of the nutrition education interventionwith students from six schools. The training proc-ess was carried out at the beginning of 2002, lasted3 days, and included 45 primary schools teachersfrom the three regions of the project. This training FIG. 5. Nutrition education (NE) strategy
i
-

r r-
5184 s. Olivares
Evaluation results of school experiences collecting baseline information on nutrition status,attitudes, and feeding practices of the schoolchildren,
The objectives of this project, which are to promote as well as teachers' training, which was carried out by ,the incorporation of nutrition education into the INTA. Further education interventions with the school- !school curriculum through the design and validation children will be implemented in 2004 and evaluated at ~
of a model and education materials for teachers and the end of the year.schoolchildren, were fully achieved. During the year 2003, INTA carried out four training
Although the education intervention only lasted courses for 122 teachers from 10 regions of the country.5 months and we did not expect significant changes Additionally, 31 supervisors of JUNAEB, who will carryin nutrition status and food intake, we nevertheless out the follow-up of the nutrition education activities icompared knowledge in food and nutrition and food at regional level, were trained by INTA.intake of the intervention group (812 children) versus Presently, every public school in the country hasthe control group (540 children). With regard to received a CD-ROM, which includes all the teachingknowledge, a significant increase was observed among materials (which are also available on the Internet).the initial and final scores in children from interven- It is estimated that starting in 2005, the Ministry oftion schools, with the exception of 5th grade. No dif- Education will incorporate these contents into theferences were observed among the control group. The official text books used by schoolchildren attendingcomparison of food consumption before and after the public schools.intervention showed a significant increase in the con- In addition, FAa has distributed this program tosumption of dairy products among the younger groups every Latin American country, some of which haveof the intervention schools. No increase was noted in already submitted similar projects to be implementedthe control group. Intake of fruits and vegetables only' in thelt respective school systems. This education mate-increased significantly in 10- to ll-year-old girls of rial with only small modifications can be easily adaptedthe intervention group. The consumption of bread to local realities.declined significantly among girls of the interventiongroup. Intake of snacks increased in both groups, butit was significantly higher in the control group. Soft Conclusionsdrinks increased significantly in 8- to 9-year-old chil-dren from both intervention and control groups. In August 2003, a workshop was organized by FAa and
; Because snack foods are very inexpensive and sold INTA, with the goal of evaluating the entire experience[l at kiosks within and right outside of schools, the from the participating teacher's perspective. The fol-, increase in the consumption of snacks in both groups lowing conclusions were reached:
makes us conclude that nutrition education will only The designed and validated nutrition educationproduce significant changes in food habits if certain materials for teachers and primary schoolchildren,initiatives are carried out. Specifically, health and developed by this, project, proved to be effective andeducation authorities should regulate what is sold highly motivational, and can be used as part of theinside the schools and establish some regulations general primary curriculum or in independent nutri-for the food industry. In addition, advertisement for tion education programs.children should not only be regulated, but required to The nutrition education training program for teach-promote healthful foods. It is important to point out ers was successful and motivational, and can be rep-that approximately 73% of low-income children take licated throughout the entire country. The teachersmoney to school, which is largely spent on snacks. The highlighted the usefulness of the education material forchildren should be given the opportunity to spend their own training, especially their capacity to motivatetheir money on healthful foods. These initiatives would the participation of the children, which is an outstand-surely contribute to halting the rapid increase in child- ing aspect of the learning process.hood obesity. In Summary, this project has provided the basis to
carry out systematic nutrition education interven-tions in primary education, validating a methodol-
Implementation and follow-up activities ogy, instruments, and education materials as wellas a teachers' training program that is applicable at
Given the successful experience of this project, the the national level. This nutrition education strategyChilean Ministry of Education assigned the respon- represents a significant contribution for developingsibility of incorporating nutrition education in the healthy eating habits and also a means to diminish thecurriculum of public schools to the JUNAEB. JUNAEB prevalence of overweight and obesity among Chileanbegan a new pilot project with 47 schools from 10 schoolchildren.regions in 2003, which in its first phase included
_c

Nutrition education in Chilean primary schools 5185,'uu"'v,, ~Vy~~..~" ." , , --- I
!
References j
1. Republica de Chile. Ministerio de Educaci6n (2003). 14. Olivares S, Snel J, McGrann M, Glasauer P. Nutri-Santiago, Chile. http://www.mineduc.cl Accessed 12 tion education in primary schools. Food Nutr Agric
January 2004. 1998;22:57-62.2. Uauy R, Albala C, Kain J. Obesity trends in Latin 15. FAO/Ministry of Education/Institute of Nutrition and
America: transiting from under to overweight. J Nutr Food Technology (INTA), University of Chile. Nutrition2001; 131 :8935-9S. Education in Primary Schools. TCP/CHI/0065. Santiago,
3. Kain J, Uauy R, Vio F, Albala C. Trends in overweight and Childe FAO, 2003.obesity prevalence in Chilean children: comparison of 16. Olivares S, Kain J, Lera L, Pizarro F, Vio F, Mor6n C.three definitions. Eur J Clin Nutr 2002 ;56:20(}--4. Nutrition status, food consumption and physical activity
4. CDC/NCHS. CDC growth charts: United States. http:// among Chilean schoolchildren: a descriptive study. Eur
www.cdc.gov/growthchart.Accessed 30 October 2000. J Clin Nutr 2004; 58:1278-1285.5. Ministerio de Educaci6n. Junta Nacional de Auxilio 17. Barlow S, Dietz W. Obesity evaluation and treat-
Escolar y Becas (JUNAEB 2003). Nutrition status of ment: expert committee recommendations. Pediatrics
schoolchildren in first grade. http://www.junaeb.cl 1998;102:E29-36.Accessed 9 February 2004. 18. Thompson F, Byers T. Dietary assessment resource
6. Dietz WHo Health consequences of obesity in youth: manual. J Nutr 1994;124(11S):22455-317S.Childhood predictors of adult disease. Pediatr 1998; 19. Yanez R, Olivares S, Torres I, Guevara M, Diaz N. Con-101 (Suppl 3):518-25. sumo de alimentos de escolares chilenos. Su relaci6n con
7. Salinas J, Vio F. Promoci6n de la salud en Chile. Revista las guias y la piramide alimentaria. Revista Chilena deChilena De Nutricion 2002;29(Sl):164-73. Nutricion 2001;28(8):422-8.
8. Castillo C, Uauy R, Atalah E, eds. Guias de Alimentaci6n 20. Kain J, Olivares S, Castillo M, Vo F. Validaci6n y apli-p~ra.la pobla~i6n chilena. Santiago, Chile: Imprenta \ caci6n. de instru~entos para evaluar i?terve?cionesDlano La Nac16n, 1997. educanvas en obesldad de escolares. Revlsta Chilena de
9. National Academy of Sciences/National Research Coun- Pediatria 2001;72(4):308-18.cil. Recommended Dietary Allowances, 10th edition. 21. Kain J, Andrade M. Characteristics of the diet and pat-Washington, DC: National Academy Press, 1989. terns of physical activity in obese Chilean preschoolers.
10. Kain J, Uauy R, Taibo M. Chile's school feeding pro- Nutr Res 1999;18:1825-35.gramme: targeting experience. Nutr Res 2001; 22:' 22. Olivares S, Albala C, Garcia F, Jofre I. Publicidad televi-599-608. siva y preferencias alimentarias en escolares de la Regi6n
11. WHO. Healthy nutrition: an essential element of a Metropolitana. Rev Med Chile 1999;127:791-9.health promoting school. WHO Information Series on 23. Zemel MB, Shi H, Greer B, Dirienzo D, Zemel PC.School Health. Geneva: WHO, 1998. Regulation of adiposity by dietary calcium. FASEB J
12. Lytle L. Nutrition education for school-aged children: a 2000;14(9):1132-8.review of research. In: Contento IR, Balch G, Bronner Y,' 24. Olivares S, Zacarias I, Andrade M, Mor6n C. Educaci6nPaige D, Bisignani L, Lytle L, Maloney S, White S, Olson en alimentaci6n y nutrici6n para la ensenanza bcisica.Ch, Sharaga S. The effectiveness of nutrition education Santiago: FAO/Ministerio de Salud/Universidad deand implications for nutrition education policy, pro- Chile, INTA, 2003. Texto general; Guia del Profesor;grams, and research: a review of research. J Nutr Educ Guias de Alumnos de 3° a 8° basico; CD-Rom. http://
I 1995;27:298-310. www.inta.cI1educacionennutricion/index.asp.Accessed 13. Centers for Disesase Control and Prevention. Guidelines 5 January 2004.
for school health programs to promote lifelong healthyeating. Morbid Mortal WkIy Rep 1996;45(RR-9):1-41.
..
i
. II ~