nutrition foundation of indianutritionfoundationofindia.res.in/pdfs/scientific-report-16.pdf · the...
TRANSCRIPT

NUTRITION FOUNDATION OF INDIA
ANAEMIA IN PREGNANCY - INTERSTATE DIFFERENCES
By
K.N. Agarwal, D.K. Agarwal, Anshu Sharma
Project funded by Department of Family Welfare, Government of India
Scientific Report 16 2005
ii

CONTENTS
List of Investigators i Preface ii
Interstate differences in the prevalence of anaemia in reproductive age women – a study of possible contributing factors 1-19 References 20 Annexures
ii

List of Investigators
Chief Investigator – Dr C Gopalan (President – Director, NFI)
Task Force Participating centre Co-investigator Avinashilingam University for Home Sc. & Higher Education, Coimbatore, Tamilnadu
Dr Rajammal P Devadas / Dr Prema Kumari
Medical College, Trivandrum, Kerala Dr L Vijayalekshmi Haryana Agricultural University, Hissar, Haryana Dr Neelam Khetarpaul Himachal Pradesh Krishi Vishvavidyalaya, Palampur, H.P. Dr A.C. Kapoor College of Home Science, Assam Agricultural University, Dr M.C. Kalita Orissa Institute of Medical Research and Health, Orissa Dr Shashi Mani Panda RIGHTS Consultants, Gwalior Madhya Pradesh Dr A.K. Govilla Database from NFHS-2 (Indian Institute of Population Studies) Dr T.K. Roy (Director) Study Design Dr K Ramachandran Training of the Field workers at NIN Dr K Vijayaraghavan
Dr Madhvan K Nair Study Co-ordination Co-ordinators Dr K.N. Agarwal
Dr (Mrs) D.K. Agarwal Study Co-ordinators at NFI Anshu Sharma
Karuna Sharma Kanti Prasad Mathur
Field Investigators Trained at NIN, Hyderabad Assam Ms Barnali Barua, Ms Lipika Dey, Ms Rulima Bharali Haryana Ms Shefali, Ms Pragati Malhotra, Ms Vandita Himachal Pradesh Ms Bandana, Ms Mamta Kerala Dr S Rajshree, Ms Sujatha Hariharan, Ms Reha K.M. Madhya Pradesh Mr Pradeep Sharma, Mr Rajesh Verma Orissa Ms Suchitra, Ms Itishree Parida, Ms Rupashree Das Tamil Nadu Ms P Radha, Ms R Ambika, Ms Preethi Krishnan
ii

Preface
Anaemia in pregnancy accounts for one fifth of maternal deaths and is a major factor responsible for low birth weight. The National Anaemia Prophylaxis Programme has been in operation since 1973. In the nineties, several small studies have reported that there is no reduction in prevalence or adverse effects due to anaemia in pregnancy. The National Family Health Survey–2 (NFHS), the first nationwide survey on anaemia, had reported that the prevalence of anaemia in pregnancy was only 50%. The Department of Family Welfare, Government of India commissioned NFI to undertake a study in the villages where NFHS had conducted the study to assess whether there has been a steep decline in the prevalence of anaemia in pregnancy, and also ascertain factors responsible for interstate differences. This report presents the data from the study on prevalence of anaemia in pregnancy in seven states. Data from this study showed that, contrary to the NFHS report, the prevalence of pregnancy anaemia in India continues to be high. The lower prevalence reported in NFHS-2 was most probably attributable to the method used for Haemoglobin estimation (Hemocue method as against the conventional Cyanmethaemoglobin method). Interstate differences were partly due to differences in dietary intake and partly due to utilisation of antenatal care. This study was organized and conducted by the Nutrition Foundation of India in collaboration with several scientists belonging to leading institutes. The Foundation acknowledges the support and contribution of all the scientists involved in this project.
Prema Ramachandran Director, NFI
ii

MAP OF INDIA SHOWING 7 STATES OF NFI STUDY
ii
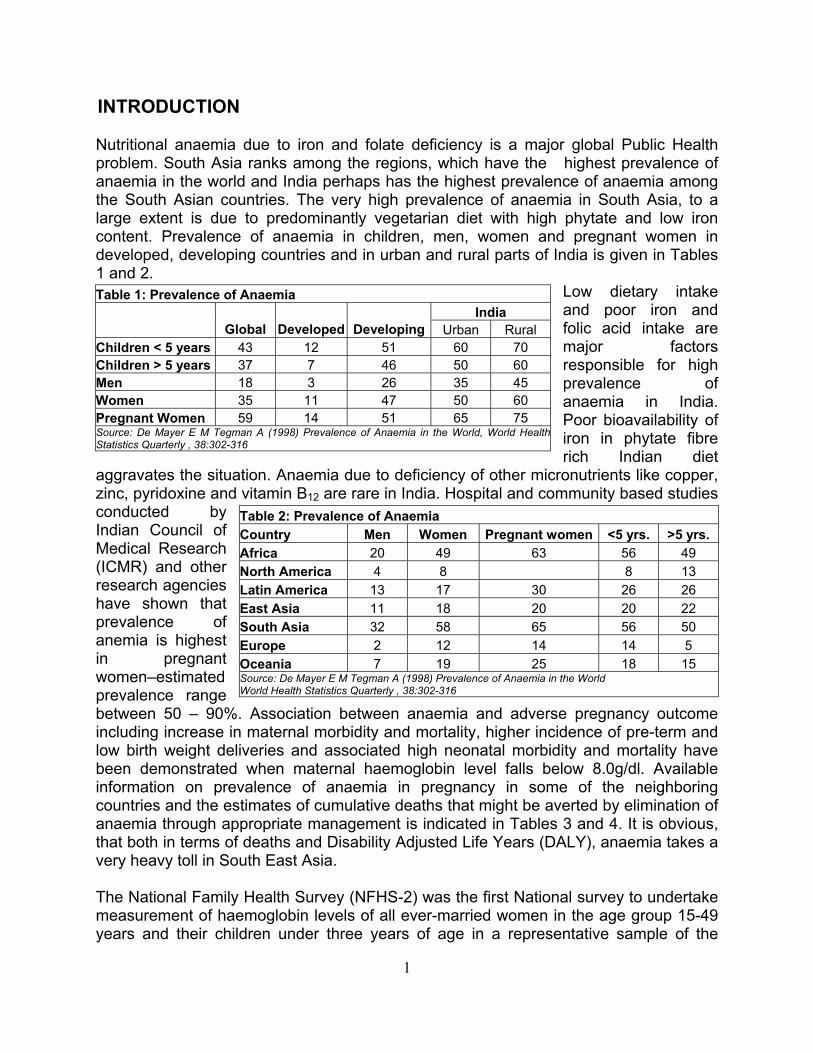
INTRODUCTION Nutritional anaemia due to iron and folate deficiency is a major global Public Health problem. South Asia ranks among the regions, which have the highest prevalence of anaemia in the world and India perhaps has the highest prevalence of anaemia among the South Asian countries. The very high prevalence of anaemia in South Asia, to a large extent is due to predominantly vegetarian diet with high phytate and low iron content. Prevalence of anaemia in children, men, women and pregnant women in developed, developing countries and in urban and rural parts of India is given in Tables 1 and 2.
Low dietary intake and poor iron and folic acid intake are major factors responsible for high prevalence of anaemia in India. Poor bioavailability of iron in phytate fibre rich Indian diet
aggravates the situation. Anaemia due to deficiency of other micronutrients like copper, zinc, pyridoxine and vitamin B12 are rare in India. Hospital and community based studies conducted by Indian Council of Medical Research (ICMR) and other research agencies have shown that prevalence of anemia is highest in pregnant women–estimated prevalence range between 50 – 90%. Association between anaemia and adverse pregnancy outcome including increase in maternal morbidity and mortality, higher incidence of pre-term and low birth weight deliveries and associated high neonatal morbidity and mortality have been demonstrated when maternal haemoglobin level falls below 8.0g/dl. Available information on prevalence of anaemia in pregnancy in some of the neighboring countries and the estimates of cumulative deaths that might be averted by elimination of anaemia through appropriate management is indicated in Tables 3 and 4. It is obvious, that both in terms of deaths and Disability Adjusted Life Years (DALY), anaemia takes a very heavy toll in South East Asia.
Table 1: Prevalence of Anaemia India
Global Developed Developing Urban Rural Children < 5 years 43 12 51 60 70 Children > 5 years 37 7 46 50 60 Men 18 3 26 35 45 Women 35 11 47 50 60 Pregnant Women 59 14 51 65 75 Source: De Mayer E M Tegman A (1998) Prevalence of Anaemia in the World, World Health Statistics Quarterly , 38:302-316
Table 2: Prevalence of Anaemia Country Men Women Pregnant women <5 yrs. >5 yrs. Africa 20 49 63 56 49 North America 4 8 8 13 Latin America 13 17 30 26 26 East Asia 11 18 20 20 22 South Asia 32 58 65 56 50 Europe 2 12 14 14 5 Oceania 7 19 25 18 15 Source: De Mayer E M Tegman A (1998) Prevalence of Anaemia in the World World Health Statistics Quarterly , 38:302-316
The National Family Health Survey (NFHS-2) was the first National survey to undertake measurement of haemoglobin levels of all ever-married women in the age group 15-49 years and their children under three years of age in a representative sample of the
1

population using the same technique for Hb estimation. Data from NFHS-2 showed that prevalence of anaemia among pregnant women was 49.7%; reported prevalence being substantially lower than earlier reports from smaller community surveys. There was an uncertainty whether this lower prevalence was due to the improvement in haemoglobin levels following improved antenatal coverage or difference in the method used for estimation of Haemoglobin.
Table 3: Prevalence of anaemia in Pregnant / Lactating women in some Asian countries Grps B’Desh Bhutan India Nepal S.Lanka Maldvs Thailand Malaysia China
Preg 77 59 85 ~75 39 68 16 58 35 Lact 77 77-
95 15
Source: Proceedings IX ACN. The burden of iron deficiency and anaemia in Asia : Challenges in prevention and control. Rudolfo F Florentino. Pp 313
DtaPHdca D(P
Table 4: Estimates of lives saved if iron deficiency anaemia were eliminated by 2010 in 4 countries Cumul. Lives Saved from 2003 to 20103 --------------------------------
Maternal Pregnancy Maternal Perinatal Mortality Perinatal Anaemia Deaths Deaths Country Ratio1 Mortality2 Prevalence (%) Averted Averted Malawi 1100 46 88 9,160 52,139 Mozambique 1100 90 37 4,775 56,309 Indonesia 380 40 74 18,209 268,866 India 540 85 88 80,630 3,903,540 1Per 1,00,000 live births2 Per 1,000 live births3 Assumes a linear decline in anaemia from the current prevalence to 50% of that level. Source:Ezzati M et al & Stoltzfus R J et al.
ata from NFHS-2 indicated that there was substantial interstate difference, especially he neighboring states, in the prevalence of anaemia. In Kerala, the prevalence of naemia was substantially lower as compared to adjoining Tamil Nadu; Himachal radesh had markedly lower prevalence of anaemia as compared to neighboring aryana. It is, therefore, essential to assess the factors responsible for the interstate ifferences and see if the performance of the states with lower prevalence of anaemia ould be replicated in the other states so that there will be rapid reduction in anaemia nd its adverse health consequences.
epartment of Family Welfare funded NFI to carry out a research study in seven states Tamil Nadu, Kerala, Himachal Pradesh, Haryana, Assam, Orissa and Madhya radesh)
To estimate haemoglobin levels (Hb), using classical cyanmethaemoglobin method, in reproductive age women, and compare them with Hb values reported in the NFHS-2 survey,
2

To obtain data on dietary intakes and food consumption patterns in the selected households and individuals, To assess access to and utilization of health services including receipt and
e Nutrition Programmes in selected areas,
ges, To identify the possible factors underlying the interstate differences with reference to
e field investigators were given an rientation training at NIN Hyderabad between 25-29th June 2001. The training
r
s;
24 hr dietary recall);
and nutrition etc;
ir, Asst. Director, NIN trained the field workers in Hb stimation and looked after external quality control; all the centers sent every 10th
lth and nutrition surveys were chosen to undertake the tudy. The centres in different states are indicated in Table – 5. The data were received,
scrutinized and analyzed at NFI.
consumption of iron-folic acid tablets, To assess the implementation of th To assess the occurrence and severity of parasitic infestations and other major
infections in the selected villa
the prevalence of anaemia. METHODOLOGY FOR THE STUDY The study was taken up by NFI as a Task Force study in seven states. The composition of the Task Force and the responsibilities taken up by different consultants and the Staff of NFI are indicated in the Annexure. Each participating center appointed two-three field investigators (graduates or post graduates - nutrition/allied sciences) for data collection. In order to ensure uniformity, a pre-tested proforma was used for data collection in all centers. Prior to initiation of the study, all thoprogramme included methodology to be used fo Enumeration of households in the village Use of random number tables to select the study women;
Dietary survey (by Recording obstetric history, utilisation of health services, education related to health
Training for anthropometric assessment. The following supplies were centrally procured, checked and standardized at NIN, Hyderabad and given to all the centers participating in the study: i) Anthropometeric rod, ii) Drabkin’s solution, iii) Haemoglobin standard, iv) Deonised water, (items ii, iii and iv from Dr Reddy’s lab) v) Whatmann filter paper, vi) Haemoglobin pipettes vii) Standardized utensil sets for 24 hr recall dietary survey. Weighing scales and colorimeters were procured locally according to the specifications provided by NIN. Dr Madhavan Naesample to NIN for Hb estimation. The survey was undertaken as a Task Force study in seven states – Tamil Nadu and Kerala in the South; Himachal Pradesh and Haryana in the North; Assam and Orissa in the East and Madhya Pradesh in Central India. The study was coordinated by NFI. Seven collaborating institutions with investigators who had experience and expertise in conducting community based heas
3

Table – 5 Participating centers in the 7 states 1. College of Home Science, Assam Agricultural University, Jorhat, Assam 2. Haryana Agricultural University, Hissar, Haryana 3. Himachal Pradesh Krishi Vishvavidyalaya,Palampur, Himachal Pradesh 4. Medical College, Trivandrum, Kerala 5. RIGHTS Consultants, Gwalior Madhya Pradesh 6. Orissa Institute of Medical Research and Health, Orissa 7.Avinashilingam Univ. for Home Sc. & Higher Education, Coimbatore, Tamil Nadu
STUDY DESIGN The study design and the sampling frame were decided after detailed discussion in the Task Force meeting in which all the investigators participated. Initially, the study design envisaged that the survey would be conducted in a sub-sample of households and villages from the NFHS-2 survey sample. A total of 20 villages were to be selected from the different tertiles, the number of villages from each tertile being proportional to the tertile/size. From each of the 20 villages, a simple random sample of 15 households was to be selected, using circular systematic sampling, making a total of 300 households in each state. In case, the selected village did not have 15 women, the neighbouring village was to be taken. However, the co-ordinators felt if 15 women belonging to different age and physiological status were investigated, it might be difficult to get adequate number in comparable subgroups for interstate comparison. It was, therefore, decided that only women from the most vulnerable groups - that is, pregnant and lactating women (upto 3 months) in the selected villages will be taken up in the study. All households with pregnant and lactating women were to be identified during household survey. It was decided that if there are more than 15 pregnant and lactating women in any village, the first 15 will be taken up for the survey and if there are less than 15, then efforts will be made to go to the adjoining village to recruit pregnant and lactating women so that a total of 15 women belonging to the two study groups are recruited. RESULTS The total number of women investigated in the two groups (Pregnant/lactating-< 3 months) in the seven states is indicated in Table 6. There were substantial differences in the proportion of pregnant and lactating (<3 months) women recruited between the NFI survey states. This might be because of different approaches used by different investigators to recruit women belonging to these two groups. Perhaps because of the large village size, Kerala was able to recruit 300 subjects inspite of low birth rate. States like Orissa, Haryana and Tamil Nadu also were able to collect data on 300 subjects. In Himachal Pradesh, because of relatively small village 4

size and low birth rate there were a lot of difficulties in recruiting the required number of pregnant and lactating women. Even though 30 villages were surveyed, the total number of pregnant and lactating women who could be recruited for the survey was only 170. NFHS-2 also faced similar problems and has relatively lower sample size in Himachal
Pradesh. Further efforts to increase the number of villages beyond 30 was not attempted by NFI as this would have introduced a new bias as a large number of villages would have been not the same as covered by the NFHS-2 survey. In Assam also, the number of women recruited for the study was lower. In view of the problems of floods and local unrest, it was felt that the total number of women recruited in 20 villages where NFHS-2 was carried out would be utilized and no further efforts will be made to conduct the survey and recruit women from adjoining villages.
Table - 6 Recruitment for the survey State Districts Villages Women surveyed
(Preg + Lact) Assam 13 20 (132+93) 225 Haryana 9 20 (188+112) 300
Himachal Pradesh
9 30 (94+76) 170
Kerala 8 14 (244+56) 300 Madhya Pradesh 16 24 (125+44) 169 Orissa 7 23 (164+134) 298 Tamilnadu 13 20 (201+88) 289 Total (1148+603) 1751
In Madhya Pradesh, there were no problems in recruiting sufficient numbers of women. However, the external quality control carried out by NIN indicated that there were large variations in reported haemoglobin levels (even though haemoglobin estimations were done under the supervision of Prof and Head Deptt of Biochemistry). So, only those samples in which haemoglobin estimations were done at NIN-Hyderabad were included in the study report (169 women). Field investigators collected data on pretested uniform proforma. They did not have any problem in collecting socio-economic data, obstetric history, measuring height and weight and obtaining samples for haemoglobin estimation. However, they found it difficult to collect the data on occurrence and severity of parasitic infestations and other major infections in the selected villages. They were unable to get clinical examination done for detecting infections, samples collection, transportation and examination at the nearest laboratory with adequate quality control. In view of these difficulties, it was not possible to obtain data on infections including parasitic infections as a part of the survey. Prevalence of Anaemia
5
Prevalence of anaemia in pregnant and lactating women is shown in Table 7 (a & b). Comparison of the data from NFI survey on prevalence of anaemia with NFHS data shows that the prevalence of anaemia in all states is higher in the NFI survey. Prevalence of anaemia in pregnant women from NFI survey is comparable to the data reported by the District Level Household Survey (DLHS) in all states. The NFI and DLHS had used the standard cyanmethaemoglobin method for estimating haemoglobin while NFHS had used the hemocue method.

Prevalence of anaemia was lower in Kerala as compared to Tamil Nadu and Himachal pradesh as compared to Haryana in both the NFI and NFHS-2 surveys. Madhya Pradesh, Orissa and Assam had higher prevalence of anaemia as compared to these states. There have been several recent
publications indicating that
hemocue overestimates Hb levels by 1.5 to 2.0 g/dl but there is no correlation between haemoglobin values from cyanmethaemoglobin method and hemocue method. It would appear that hemocue method is responsible for the lower prevalence of anaemia reported in NFHS-2.
Table 7 (a) Prevalence of anaemia (any anaemia) in pregnant women Percentage of pregnant women with any anaemia State
NFI NFHS-2 DLHS 2002 Assam 93.9 (132) 62.3 (217) 97.1 (131) Haryana 68.1(188) 55.5 (174) 98.0 (343) Himachal Pradesh 68.1(94) 31.8 (1766) 98.9 (166) Kerala 59.0 (244) 20.3 (140) 35.0 (180) Madhya Pradesh 96.8 (125) 53.8 (533) 94.6 (560) Orissa 97.0 (164) 60.5 (297) 94.6 (532) Tamilnadu 91.5 (201) 57.1 (310) 87.8 (353) The figures in parenthesis indicates the sample size Table 7 (b) Prevalence of anaemia in lactating women
Percentage of lactating women with any anaemia State NFI NFHS-2
Assam 93.5 (93) 70.9 (685) Haryana 88.4 (112) 56.1 (649) Himachal Pradesh 65.8 (76) 47.6 (524) Kerala 31.8 (56) 21.3 (455) Madhya Pradesh 93.2 (44) 58.0 (1806) Orissa 93.3 (134) 64.8 (1098) Tamilnadu 76.1 (88) 61.1 (607) The figures in parenthesis indicates the sample size
INTERSTATE DIFFERENCES Kerala and Tamil Nadu A detailed comparative profile of demographic and socio-economic characteristics of the households in the states of Kerala and Tamil Nadu in both the NFI and NFHS II surveys is presented in Annexure 1. The data shows that in Kerala only 50% of the subjects were Hindus as compared 95% in Tamil Nadu. The Kerala women had higher literacy, better housing, better access to mass media and health care as compared to women in the neighboring state of Tamil Nadu. In Tamil Nadu, more than 90% women were anaemic in both the groups whereas in Kerala, only 58% pregnant and 60% lactating women are anaemic. Some of the factors, which may account for atleast in part for higher prevalence of anaemia in Tamil Nadu are mentioned in Table 8: Earlier age at marriage and of pregnancy; Lower literacy Lower dietary intake, especially minerals and micronutrient rich food stuffs; Low percentage of women receiving IFA tablets, still lower number getting for >90
days and 71% of them consuming regularly as against 97% in Kerala;
6

Higher prevalence of underrnutrition (more number of the subjects with height below 145 cm and BMI less than 18.5Kg/m2); Lower percentage receiving ANC, especially from a doctor and the first ANC being
done in the first trimester; Less percentage of women with anaemia awareness; Lower intake of calcium, iron and vitamin C rich foods in the diet and low percentage
of women taking these nutrients >70% RDA.
Fig 1 Nutrient intake in Kerala and Tamil Nadu
0
20
40
60
80
100
Energy Calcium Iron Vitamin C Free FolicAcidNutrients
Perc
ent I
ntak
e
Kerala Tamil Nadu
Figure 1 shows the difference in the dietary intake (expressed as >70% RDA) of the sub
3+ months Regular consumed IFA tab.
96.7 71.4
jects between the two states. Though
urveys is presented in Annexure .
a of Him rad mhigh school in the former. Also, higher propH Pradesh, m be jecbetter sanitation facilities. B NFHS-2 and vey ed tial difference in the prevalence of a both among pregn and ctating (<3 months) between Himachal
Table 8 Factors responsible for the anaemia prevalence difference between the states of Kerala and Tamil Nadu
Kerala Tamil Nadu Age <20 (yrs) 7.7 15.6 Education of women (upto 10th class or above)
95.3 58.9
Education of Husband (upto 10th class or above)
95.7 67.5
Aware abonaemia c
ut anaemia 74.3 15.9 Aprevented by
ould be diet
91.0 69.7
Receiving IFA Tab. 91.0 66.8 Received supply for 55.8 43.5
the energy intake was higher in Tamil Nadu, but the intake of calcium, iron and vitamin C was higher in the state of Kerala. Himachal Pradesh and Haryana A comprehensive profile of demographic and socio-economic characteristics of the households in the states of Himachal Pradesh and Haryana in both the NFI and NFHS II s2The household profile data of this state shows that though higher percentage of women are illiterate as compared to the ore number of women have education upto ortion of households has pucca houses. In
ts had access to piped water, electricity and
a substan
djoining state achal P esh but
imachal ore num r of sub
oth the NFI sur s shownaemia the ant
SLI (High) 21.3 19.0 Birth order > 3 1.7 2.0
7.3 12.1 BMI <18.5 (kg/m2) 11.0 19.7 Antenatal checkup by doctor
71.0 50.2
First antenatal check-up (Ist trimester)
81.3 61.9
Mean Height (cm) 154.2+5.9 151.4+5.8 Mean weight (kg) 53.2+8.8 46.4+6.6 BMI (kg/ht2) Nutrients Energy (Kcal) 1850+526 2012+514 Calcium (mgIron (mg) 17.1+11.0 11.3+6.7 Vit CFree Folic Acid (ug) 64.3+45.3 105.4+58.3 Nutrients (Energy 72.0 83.7 Calcium 38.7 12.1 Iron 16.3 6.2 Vitamin C 72.0 40.5 Free Folic Acid 3.3 14.2
SLI (low) 23.3 18.3
Ht. <145.0 cm
22.4+3.3 20.2+2.5
) 664+422 359+291
(mg) 74+68 38+35
>70% RDA)
7 la
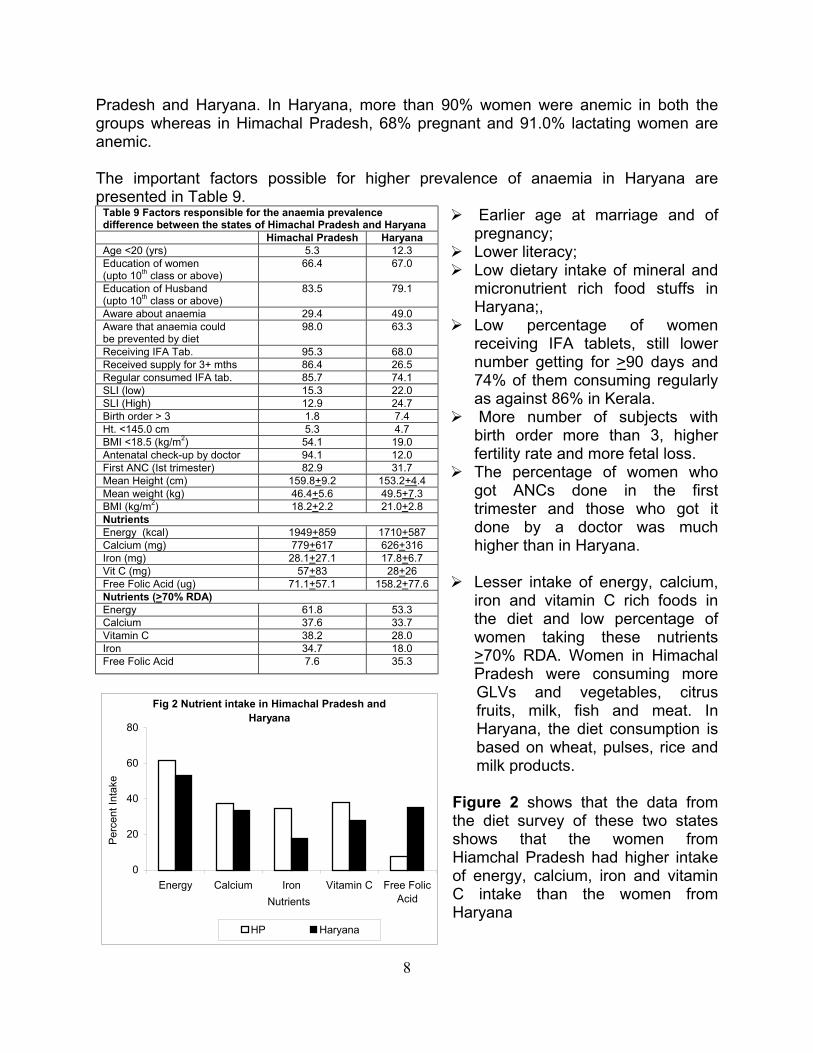
Pradesh and Haryana. In Haryana, more than 90% women were anemic in both the groups whereas in Himachal Pradesh, 68% pregnant and 91.0% lactating women are a T tant factors poss for high prev in Haryana are presented in Table 9.
women
nemic.
he impor ible er
Table 9 Factors respon emia difference between the st Himac adesh H hal Pr aryanaAge <20 (yrs) 5.3 12.3 Education of women (upto 10th class or above)
66.4 67.0
Education of Husband (upto 10th class or above)
83.5 79.1
Aware about anaemia 29.4 49.0 Aware that anaemia could
diet be prevented by98.0 63.3
Receiving IFA Tab. 95.3 68.0 Received supply for 3+ mths 86.4 26.5 Regular consumed IFA tab. 85.7 74.1 SLI (low) 15.3 22.0 SLI (High) 12.9 24.7 Birth order > 3 1.8 7.4 Ht. <145.0 cm 5.3 4.7 BMI <18.5 (kg/m2) 54.1 19.0 Antenatal check-up by doctor 94.1 12.0 First ANC (Ist trimester) 82.9 31.7 Mean Height (cm) 159.8+9.2 153.2+4.4 Mean weight (kg) 46.4+5.6 49.5+7.3 BMI (kg/m ) 2 18.2+2.2 21.0+2.8 Nutrients Energy (kcal) 1949+859 1710+587 Calcium (mg) 779+617 626+316 Iron (mg) 28.1+27.1 17.8+6.7 Vit C (mg) 57+83 28+26 Free Folic Acid (ug) 71.1+57.1 158.2+77
alence of anaemia
Earlier age at marriage and of pregnancy; Lower literacy;
Low dietary intake of mineral and micronutrient rich food stuffs in Haryana;, Low percentage of receiving IFA tablets, still lower number getting for >90 days and 74% of them consuming regularly
en who got ANCs done in the first
as against 86% in Kerala. More number of subjects with birth order more than 3, higher fertility rate and more fetal loss. The percentage of wom
trimester and those who got it done by a doctor was much higher than in Haryana.
Lesser intake of energy, calcium, iron and vitamin C rich foods in the diet and low percentage of women taking these nutrients >70% RDA. Women in Himachal Pradesh were consuming more GLVs and vegetables, citrus fruits, milk, fish and meat. In
hat the women from iamchal Pradesh had higher intake f energy, calcium, iron and vitamin
C intake than the women from
sible for the ana prevalence ates of Himachal Pradesh and Haryana
.6 Nutrients (>70% RDA) Energy 61.8 53.3
Haryana, the diet consumption is based on wheat, pulses, rice and milk products.
Figure 2 shows that the data from the diet survey of these two states shows tHo
Haryana
Nutrients
HP Haryana
Calcium 37.6 33.7Vitamin C 38.2 28.0 Iron 34.7 18.0Free Folic Acid 7.6 35.3
Fig 2 Nutrient intake in Himachal Pradesh and Haryana
0
20
40
60
80
Perc
ent I
ntak
e
Energy Calcium Iron Vitamin C Free FolicAcid
8

Assam, Orissa and Madhya Pradesh
s with most of e women being housewives. These states had higher percentage of subjects with
piped water, better proper sanitation a
oth the data sets, i.e), NFH nd NF wed p e of anaemia in rissa and Madhya Pra h (Table ).
As fousta acy status is
ese 3
ercentage of
tablets for
The
re
of the
subjects was lower
ponsible for the anaem alence diff e among A , sh
The demographic and socio-economic profile of the households in the states of Assam, Madhya Pradesh and Orissa in both the NFI and NFHS II surveys is presented in Annexure 3. The data shows that the literacy rates were quite low in these three statethnuclear families and majority of them lived in either kutcha or semi pucca houses. A lower percentage of the subjects had access tofacilities, electricity (in Assam and Orissa) and exposure to m B S-2 a I, sho a highAssam, O des 10Table 10 Factors res ia prev erenc ssamOrissa and Madhya Prade A O M
Pradesh ssam rissa adhya
Age <20 (yrs) 14.2 6.7 11.2
Education of women (upto 10 class or abth ove)
38.3 43.6 24.3
Education of Husband (upto 10th class or above)
46.2 58.7 56.8
Aware about anaemia 4.0 30.9 9.5
Anaemia could be prevented by diet 3.6 28.5 8.3
Receiving IFA Tab. 32.0 58.4 74.6
Received supply for 3+ months 12.0 29.9 6.3
Regular consumed IFA tab. 4.9 63.5 6.3
SLI (low) 24.9 60.4 22.5
SLI (High) 29.3 6.4 26.6
Birth order > 3 15.1 9.7 7.7
Ht. <145.0 cm 14.7 17.4 13.6
BMI <18.5 (kg/m2) 29.8 26.8 17.2
Antenatal check-up by doctor 24.4 73.5 0.6
First antenatal check-up (Ist trimester) 28.7 39.3 17.8
Mean Height (cm) 150.3 +5.1 148.9 +5.4 150.1 +4.5
Mean weight (kg) 44.7 +6.2 44.4 +5.6 46.9 +6.1
BMI (kg/h2) 19.8 +2.2 19.8 +2.1 20.8+2.5
Nutrients Energy (kcal) 1934 +447 2009 +567 1404 +427
Calcium (mg)
Iron (mg) 13.1 +8.3 14.9 +11.6 19.4 +9.0
Vit C (mg) 37 +35 40 +39
Free 8 +28
NutrienEnergy 78.2 27.8 76.5
ss media.
revalenc
compared to the other r states, in these tes: The literpoor both for the subjects and their husbands in thstates. The number of women going for ANC was low. The psubjects getting IFA
more than 90 days was low (6-29%). Very few women got
themselves registered in the first trimester of pregnancy.subjects had lower marriage age and higher parity (mothan 2.5). Age of marriage was low in Assam and Madhya Pradesh. The iron and vitamin C consumption
281 +314 428 +548 499 +291
than the RDA. FFA intakes were far lower than the RDA.
9
49 +56
Folic Acid (ug) 38.3 +42.0 55.9 +31.2 59. .7
ts (>70% RDA)
Calcium 5.3 21.3 10.7
Iron 12.0 16.6 16.1
Vitamin C 34.7 45.0 36.9
Free Folic Acid 1.3 1.2 3.4

The energy intake in Assam, Orissa and Madhya Pradesh was higher than the other four states. Data from NNMB surveys show that energy intake in Madhya Pradesh was
substantially higher than those Fig 3 Nutrient intake in Assam, Orissa and Madhya
Pradeshreported in the NFI
survey. This might atleast in part be due to the relative very small number of women in whom data was available
in MP and the sample being non-representative. However, the intake of calcium, iron and vitamin C in these states was substantially lower.
0
20
Energy Calcium Iron Vitamin C Free FolicAcid
Assam MP Orissa
100
40
Perc
ent I
ntak
e
60
80
DISCUSSION Prevalence of anaemia The data from the NFI survey clearly showed tboth in pregnant and lactating woevery state. Inspite of the significantly higher haemoglobiof anaemia reported in prevalence of anaemia was similar in NFI was lowest in Kerala while Madhya Prades(Figure 4 a & b).
Fig 4 a Percent prevalence of anaemia in pregnancy (NFHS-2 and NFI)
80
100
hat the prevalence of anaemia is higher men as compared to the reported levels in NFHS-2 in
n level and lower prevalence the NFHS-2 survey, the pattern of interstate differences in
and NFHS surveys; prevalence of anaemia h had the highest prevalence of anaemia
Fig 4 b Percent prevalence of anaemia in lactation (NFHS-2 and NFI)
80
100
0
20
40
60
Assa
m
Har
yana HP
Kera
la
MP
Oris
sa
Tam
ilnad
u
% la
ctat
ing
wom
en
NFHS-2
0
20
40
60
Assa
m
Har
yana HP
Kera
la
MP
Oris
sa
Tam
ilnad
u
% p
regn
ant w
omen
NFHS-2 NFI NFI
10
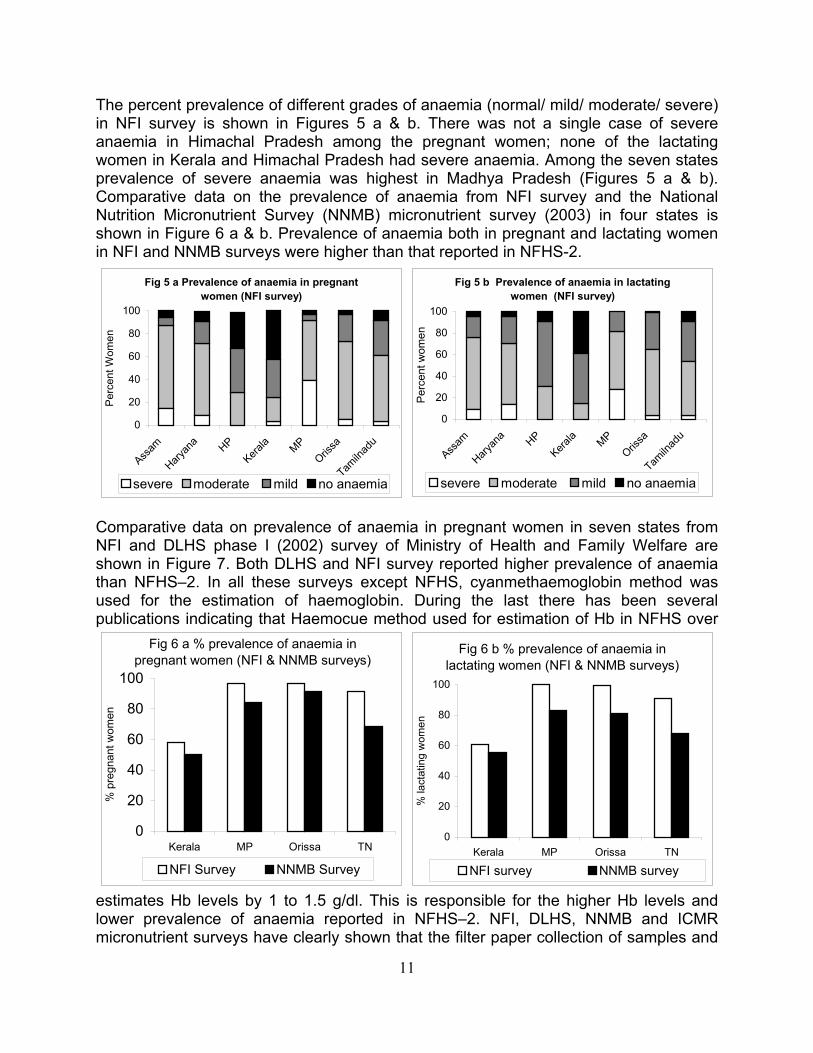
Fig 5 a Prevalence of anaemia in pregnant women (NFI survey)
80
100
0
20
40
60
HP MP
Perc
ent W
omen
0
20
40
60
Assam HP
Kerala MP
Orissa
Perc
ent w
omen
0
20
40
60
% p
regn
ant w
omen
0
20
40
60
% la
ctat
ing
wom
en
Assam
Haryan
aKera
laOris
sa
Tamiln
adu
severe moderate mild no anaemia
Comparative data on prevalencNFI and DLHS phase I (2002) survey of Minishown in Figure 7. Both DLHS and NFI survthan NFHS–2. In all these surveys exused for the estimation of haemoglobin. publications indicating that Haemocue method
The percent prevalence of diffein NFI survey is shown in Figures 5 a & anaemia in Himachal Pradeswomen in Kerala and Himachal Pradesh had prevalence of severe anaemia was highest Comparative data on the prevNutrition Micronutrient Survey shown in Figure 6 a & b. Prevalence of anaemia both in in NFI and NNMB surveys were higher than that reported in NFHS-2.
paper collection of samples and
rent grades of anaemia (normal/ mild/ moderate/ severe) b. There was not a single case of severe
h among the pregnant women; none of the lactating severe anaemia. Among the seven states in Madhya Pradesh (Figures 5 a & b).
alence of anaemia from NFI survey and the National (NNMB) micronutrient survey (2003) in four states is
pregnant and lactating women
Fig 5 b Prevalence of anaemia in lactating women (NFI survey)
80
100
e of anaemia in pregnant women in seven states from stry of Health and Family Welfare are
ey reported higher prevalence of anaemia cept NFHS, cyanmethaemoglobin method was
During the last there has been several used for estimation of Hb in NFHS over
Haryan
a
Tamiln
adu
severe moderate mild no anaemia
estimates Hb levels by 1 to 1.5 g/dl. This is responsible for the higher Hb levels and lower prevalence of anaemia reported in NFHS–2. NFI, DLHS, NNMB and ICMR micronutrient surveys have clearly shown that the filter
NFI Survey NNMB Survey NFI survey NNMB survey
Fig 6 a % prevalence of anaemia in pregnant women (NFI & NNMB surveys)
80
100
Kerala MP Orissa TN
Fig 6 b % prevalence of anaemia in lactating women (NFI & NNMB surveys)
80
100
Kerala MP Orissa TN
11
H
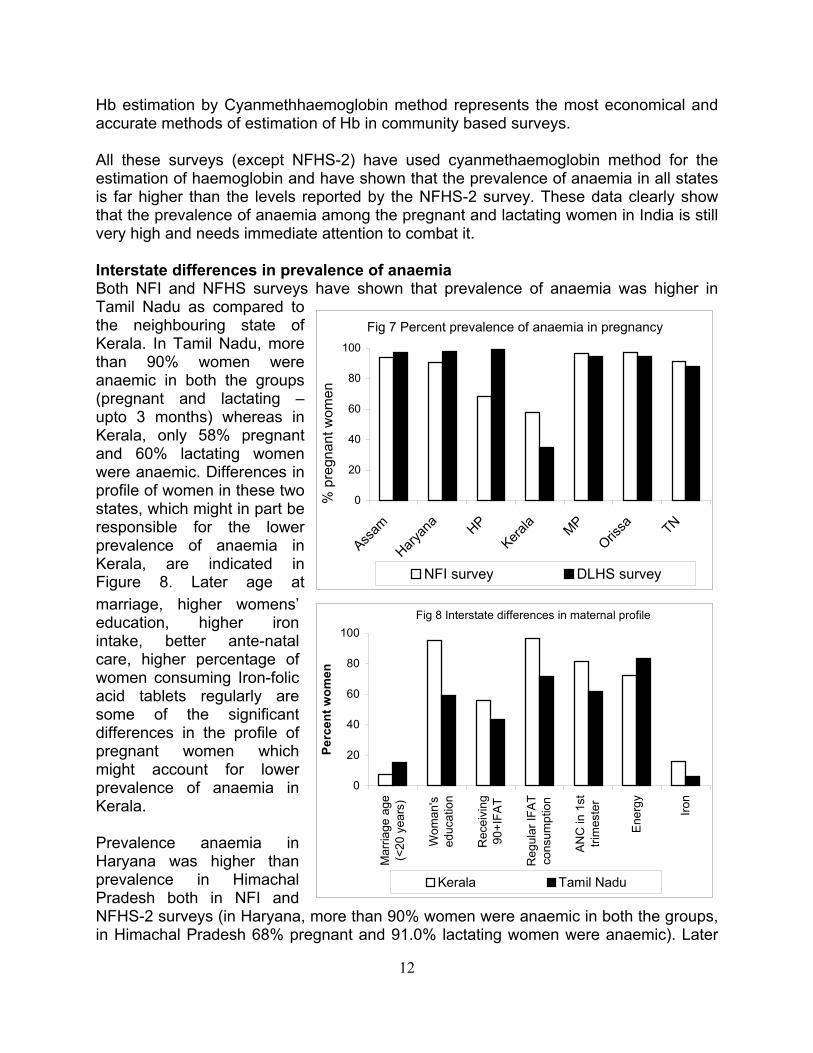
Fig 7 Percent prevalence of anaemia in pregnancy
40
60
80
100
a
0
20
Assam
Haryan
a HPKera
la MPOris
sa TN
gn
NFI survey DLHS survey
Fig 8 Interstate differences in maternal profile
20
40
60
80
100
Perc
ent w
omen
% p
rent
wom
en
All these surveys (except NFHestimation of haemoglobin and his far higher than the levels rethat the prevalence of anaemia avery high and needs immediate Interstate differences in prevaBoth NFI and NFHS surveys hTamil Nadu as compared to the neighbouring state of Kerala. In Tamil Nadu, more than 90% women were anaemic in both the groups (pregnant and lactating – upto 3 months) whereas in Kerala, only 58% pregnant and 60% lactating women were anaemic. Differences in profile of women in these two states, which might in part be responsible for the lower prevalence of anaemia in Kerala, are indicated in Figure 8. Later age at marriage, higher womens’ education, higher iron intake, better ante-natal care, hig
b estimation by Cyanmethhaemoglobin method represents the most economical and based surveys.
S-2) have used cyanmethaemoglobin method for the ave shown that the prevalence of anaemia in all states
ported by the NFHS-2 survey. These data clearly show mong the pregnant and lactating women in India is still
attention to combat it.
lence of anaemia ave shown that prevalence of anaemia was higher in
her percentage of omen consuming Iron-folic
acid tablets regularly are some of the significant differences in the profile of pregnant women which might account for lower prevalence of anaemia in Kerala. Prevalence anaemia in Haryana was higher than prevalence in Himachal Pradesh both in NFI and NFHS-2 surveys (in Haryana, more than 90% women were anaemic in both the groups, in Himachal Pradesh 68% pregnant and 91.0% lactating women were anaemic). Later
accurate methods of estimation of Hb in community
w
0
Mar
riage
age
(<20
yea
rs)
Wom
an's
educ
atio
n
Rec
eivi
ng90
+IFA
T
Reg
ular
IFAT
cons
umpt
ion
ANC
in 1
sttri
mes
ter
Ener
gy Iron
Kerala Tamil Nadu
12

Fig 9 Interstate differences in maternal profile
0
20
40
60
80
100
Mar
riage
age
(<20
yea
rs)
Wom
an's
educ
atio
n
Rec
eivi
ng90
+IFA
T
Reg
ular
IFAT
cons
umpt
ion
ANC
in 1
sttri
mes
ter
Ener
gy Iron
Perc
ent w
omen
Haryana Himachal Pradesh
age at marriage, better energy intake, substantially higher iron intake, better ante-natal care, regular access to intake of iron-folic acid tablets in Himachal Pradesh (Figure 9) are some of the factors that might account for the significantly lower prevalence of anaemia in this state.
Both NFHS and NFI surveys had shown that among the seven states prevalence of anaemia was higher in Assam, Orissa and Madhya Pradesh. All the three states had lower literacy rates, lower energy and on intake, poorer access to
terpregnancy intervals) and better utilization of health care especially antenatal care (higher coverage, better
ation and increased
irantenatal care and low consumption of IFA tablets as compared to other states (Figure 10).
Fig 10 Interstate differences in maternal profile100
The NFI survey confirmed that there are interstate differences in the mean haemoglobin levels as well as the prevalence of different grades of anaemia between states. Three major factors, which were associated with the lower prevalence of anaemia, were:
0
20
40
60
Mar
riage
age
(<20
yea
rs)
Wom
an's
educ
atio
n
Rec
eivi
ng90
+IFA
T
Reg
ular
IFAT
cons
umpt
ion
ANC
in 1
sttri
mes
ter
Ener
gy
Perc
ent w
omen
Assam Orissa MP
80
higher dietary intake including better dietary diversification , better family formation patterns (including higher age at marriage, lesser number of
births, higher in
Iron
quality of antenatal care including haemoglobin estimconsumption of iron and folate medication).
13

tors affecting haemoglobin levels profile of NFI survey women is shown in fi
14
Fig 12 IFAT consumption details of NFI survey subjects
Figure 12 indicates the percent of women who received IFA (at anytime); IFA supply for more than 3 months and also percent of women and also percent of women who received IFA supply for more than 3 months and consumed them regularly. Prevalence of anaemia was lower among educated women and women from higher income families. The prevalence of anaemia was least in the states of Kerala and Himachal Pradesh. In both the states more women got ANC and received IFA tablets and consumed them regularly (Figure 12).
0
20
40
60
80
100
120
Assa
m
Har
yana HP
Kera
la
MP
Oris
sa TN
Perc
ent w
omen
Receiving IFAT Received for 3+ months Regular consumption of IFAT
FacThe gures 11-15. Majority of women in all tates, irrespective of socioeconomic, demographic categories were anaemic. Both
NFHS-2 and NFI surveys report higher prevalence of anaemia in scheduled caste and schedules tribes.
s
Fig 11 a Statewise mean heights and weights of women
140
150
160
170
Assa
m
Har
yana HP
Kera
la
MP
Oris
sa TN
Hei
ght (
cm)
40
45
50
55
Wei
ght (
Kg)
Height (cm) Weight (Kg)
Fig 11 b Statewise mean BMI (Kg/m2) of women
15
18
21
24
Assa
m
Har
yana HP
Kera
la
MP
Oris
sa TN
BMI (
kg/m
2)
BMI (Kg/m2)

15
he corresponding percentage for each of these was lower in Madhya Pradesh, Orissa availed by less number of the subjects in the
percentage of women who did not avail the ANC services at all is much less in the NFI survey as compared to the NFHS-2 survey except in the state of Assam where the umber of women with not even a single ANC was quite high (in the NFI survey).
Tand Assam. The antenatal facilities were
states of Assam, Haryana, Madhya Pradesh and Orissa. Hardly any woman got the ANC done by the doctor in Madhya Pradesh where as 94% in Himachal Pradesh and 71% in Kerala got their ANC done by a doctor. The data shows that the prevalence of
0
20
40
60
80As
sam
Har
yana HP
Kera
la
MP
Oris
sa TN
Perc
ent s
ubje
cts
ANC in 1st trimester ANC by doctor
Fig 13 ANC facilities availed by the subjects100
anaemia was less in states where the women got their ANC done in the first trimester and had consulted doctors (Figure 13). The number of times the subjects in the NFI/NFHS-2 surveys who availed the ANC services is shown in figure 14. The
Fig 14 Distribution of subjects availing ante-natal services in the NFI & NFHS-2 surveys
100%
0%
20%
40%
60%
80%
NFH
S-2
Assa
m
Har
yana HP
Kera
la
MP
Oris
sa TN NFI
Assa
m
Har
yana HP
Kera
la
MP
Oris
sa TN
Wom
en
0 1 2 3 4+ Missing
n

The data from NFI dietary survey (by 24 hr dietary recall method) showed that dietary
among the subjects in Himachal Pradesh.
Vit C (mg) 40 40 40 80 Free Folic Acid (ug)
100 100 400 250
*non-pregnant, non-lactating
16
Fig 15 b Mean iron, vit C and FFA intake 75
Literacy, occupation and living standard of women; Age at marriage, number of pregnancies, gestational age, adequate dietary intake of
energy, iron and free folic acid;
Fig 15 a Mean energy intake by NFI survey subjects
0
25
50
Assa
m
Har
yana HP
Kera
la
MP
Oris
sa TN
Amou
nt (m
g)
30
80
130
Amou
nt (u
g)
Iron (mg) Vit C (mg) Free Folic Acid (ug)
intake of majority of the subjects in all the seven states were much less than the recommended dietary allowances (Table 11). However, there was substantial difference in the dietary intakes of the subjects in different states. The energy and other nutrient intake, as observed, in the seven states is shown in figure 15 (a & b).
It is noteworthy that even though the energy intake is lower in Himachal Pradesh, as compared to Assam, Orissa and Tamil Nadu, their iron and vitamin C intake is significantly higher than most of the other states (Fig.15). This may atleast in part be responsible for lower prevalence of anaemia
Nutritional anaemia in pregnancy: likely causative factors Low dietary intake of macro and micronutrients, especially iron and folate and poor bioavailability of iron from Indian diets is responsible for very high prevalence of anaemia in the country. In the present study detailed analysis demonstrated that the following factors are related to haemoglobin level in pregnancy:
ANC : Begun in first trimester, having more than 5 ANCs during pregnancy, ANC given by doctors, regular consumption of IFA tablets (>90 tablets).
Table 11 The Recommended Dietary Allowance (RDA) of women in different physiological states
RDA NPNL* sedentary workers
NPNL* Moderate workers
Pregnant sedentary workers
Lactating Sedentary workers
Energy (Kcal)
1875 2225 2175 2425
Calcium (mg)
400 400 1000 1000
Iron (mg) 30 30 38 30 Vit. A (ug) 600 600 600 650
0
1000
2000
3000
Assa
m
Har
yana HP
Kera
la
MP
Ener
gy (k
cal)
Energy (Kcal)
Oris
sa TN

Profile of the women in the seven states has shown that there were substantial differences in the dietary intakes and nutritional status of women between the states. The present survey confirmed that there are interstate differences in the mean haemoglobin levels as well as the prevalence of different grades of anaemia between states. Three major factors, which were associated with the lower prevalence of
naemia, were: rsificat
including higher age births, hi erpr y i n
better utilization of health care especially cquality of al cl ae n consumption of iron and folate medication).
RECOMMENDATIONS Preferred method for Haemoglobin estimation i omm D NFI su y as we s ICMR cronutri surves rly in te that alence naemi preg are very high. All these surveys clearly show that filter paper sample collection and Hb estimation by cyanmethaemoglobin method is feasible in large-scale community based surveys. This method is economical and gives accurate results and hence is the method of choice in estimation of haemoglobin in community-based surveys. Strategy for prevention of anaemia Data from NFI, NNMB, DLHS and ICMR Micronutrient survey clearly indicate that anaemia is a major public health problem affecting all segments of the population in all age and physiological groups. As majority of India’s one billion plus population is anaemic it is imperative that every effort is made to increase the iron and folate intake of the population and reduce the prevalence of anaemia through: improvement in dietary intake to meet RDA for all macro and micronutrients; dietary diversification inclusion of iron folate rich foods as well as food items that
promote iron absorption; health and nutrition education to improve over all dietary intakes and promote
le through out the year ination.
For en advocated as the most economical feasible and
dev ptability and cost
a higher dietary intake including better dietary dive better family formation patterns (
of gher int egnanc
care in
ntervals) a d antenatal moglobi antenat uding h
n c
ata from rve ll a mi ent urvey clea dica prev of a a in
ion, at marriage, lesser number
are (higher coverage, better estimation and increased
unity based surveys
y, NNMB survey and DLHS nancy and lactation
consumption of iron and folate-rich foodstuffs. Research & Development (R&D) efforts to identify iron folate rich, acceptable, inexpensive green leafy vegetables in different agro climatic zones in the country, growing and processing them so that they could be made availabat affordable cost is a priority item for intersectoral coord
tification of common salt has be
17
sustainable method of doubling the iron intake of Indian population. Research and elopment efforts focused on evaluation of the safety, efficacy, acce

effectiveness of double (iodine and iron) fortified salt should be taken up on priority
ave to be initiated right now and sustained over the next few years l result in sustainable
Cu nd adequate intake of iron and folic cid will result in improvement of Hb levels of the population over the next decade. In
screen vulnerable population for anaemia and appropriate anagement of anaemic individuals have to be continued so that the adverse health
n in hildhood and adolescence, every effort should be made to screen under nourished
nancy and gets erpetuated in women who go through rapid succession of pregnancies. Nearly three
al Programme for prevention and control of naemia, analysis of data from the present survey as well as the NFHS, ICMR, NNMB
severity and the time vailable for correction of anaemia. The strategy for treatment of anaemia in pregnancy
lactic therapy for all non-anemic pregnant women
iron folate oral medication at the maximum tolerable dose throughout pregnancy for
basis so that appropriate technology/technologies for double fortification is made available before the end of Tenth Plan period. Once this is achieved, decisions regarding making it mandatory that all salt for human consumption is fortified with iron and iodine universal double fortification of salt and its supply if necessary at a subsidised cost through TPDS system to people below poverty line could be taken. These measures hso that there is a change in the attitude and practices, which wilimprovement in Hb levels of the entire population.
Screening for anaemia and appropriate management of anaemic persons
rrent efforts to improve dietary diversification aathe meantime, efforts tomconsequences of anaemia are minimized. As anaemia is a major problem evecchildren and adolescent girls for anaemia. Anaemia is a major cause of maternal and perinatal morbidity and mortality. So every effort should be made to ensure universal screening for anaemia as a part of antenatal care. Anaemic children and adolescents should receive oral iron and folate treatment. Anaemia antedates pregnancy, gets aggravated during pregpdecades after initiation of the Nationaand DLHS show that the majority of pregnant women are anaemic; they are not screened for anaemia and iron and folic acid tablet intake is low. As part of antenatal care, universal screening of all pregnant women at least once in early pregnancy, is an essential prerequisite for detection and management of anaemia in pregnancy. Management of anaemia in pregnancy depends upon the aproposed during the Tenth Plan consisting of
oral iron folate prophy(haemoglobin more than 11 g/dl)
women with haemoglobin level between 8 and 11 g/dl, parenteral iron therapy for women with haemoglobin level between 5 and 8 g/dl if
they do not have any obstetric or systemic complication,
18
hospital admission and intensive personalised care for women with haemoglobin less than 5 g/dl ,

screening and effective management of obstetric and systemic problems in all anemic pregnant women, and
improvement in health care delivery systems and health education to the
community to promote utilisation of available care should be fully operationalised as early as possible in order to successfully combat this public health problem expeditiously .
19

References De Mayer E M Tegman A. Prevalence of Anaemia in the World, World Health
Statistics Quarterly , 38:302-316, 1998.
Preventing and controlling iron deficiency anaemia through primary health care.
WHO, Geneva, 1989.
Ezzati M, Lopez A D, Dogers A, Vander H S, Murray C J. Selected major risk factors
and global and regional burden of disease. Lancet, 360: 1347-1360, 2002. Florentino Rudolfo F. The burden of iron deficiency and anaemia in Asia : challenges
in prevention and control. Nutrition goals for Asia – vision 2020; Proceedings IX
Asian Congress of Nutrition. pp 313-318, 2003.
National Family Health Survey, India. International Institute of Population Sciences.
1998-99
National Nutrition Monitoring Bureau (NNMB Technical Report No. 22), Prevalence
of micronutrient deficiencies. NIN, ICMR, 2003
National Dissemination Seminar on Reproductive & Child Health Project, District
Level Household Survey (DLHS I), 2004
National Nutrition Monitoring Bureau (NNMB Technical Report No. 18) Report of
second repeat survey – rural. NIN, ICMR, 1999.
Stoltzfus R J, Mullany L, Black R E. Iron deficiency anaemia : comparative
quantification of health risks. In: The Global and Regional Burden of Disease due to
25 selected major risk factors. Cambridge, M A. Harvard University Press, 2003, in
press.
De Maeyer EM, Dallman P, Gurney JM, Hallberg L, Sood SK, Srikantia SG.
20

i
Annexure 1
Household profile comparison of NFI & NFHS-2 (rural) surveys in Kerala & Tamilnadu state
Kerala Tamilnadu Profile of the women NFHS-2 Rural NFI survey NFHS-2 Rural NFI study Age (yrs) 15-19 3.5 7.7 6.0 15.6 20-24 13.4 40.3 17.1 52.6 25-29 19.4 35.0 20.1 20.8 30-34 17.9 12.3 17.1 9.3 35-39 17.9 3.7 15.1 1.7 40-44 15.1 0.7 13.3 0.0 45-49 13.0 0.3 11.3 0.0 Education of women Illiterate 13.9 1.3 57.9 28.7 Literate,< primary school 10.0 3.3 4.5 12.5 High school complete 62.4 66.3 33.8 49.5 Higher secondary complete & above
13.6 29.0 3.8 9.4
Religion Hindu 48.3 49.3 93.4 94.5 Muslim 36.1 37.7 3.0 1.4 Christian 15.5 13.0 3.6 4.2 Jain 0.0 0.0 0.0 0.0 Caste/tribe Scheduled caste 9.5 9.7 26.4 21.8 Scheduled tribe 1.2 1.7 1.2 1.0 Backward caste 41.4 62.3 72.0 76.8 Other 47.9 26.3 0.4 0.0 Work status of women Working in family farm/ business 2.6 0.0 14.1 0.0 Employed by someone else 17.7 3.0 45.0 4.9 Self-employed 5.1 2.7 3.5 3.4 Not worked in past 12 months (Housewife)
74.6 94.3 37.4 91.7
Husband’s education Illiterate 8.8 0.0 35.4 22.1 Literate,< primary school 14.1 4.3 8.0 10.4 High school complete 64.3 75.0 49.3 54.0 Higher secondary complete & above
12.6 20.7 7.1 13.5
Missing 0.2 0.0 0.2 0.0 Type of family Nuclear 52.9 22.3 68.0 40.9 Joint 47.1 21.7 32.0 30.4 Extended nuclear 0.0 56.0 0.0 22.1

ii
Kerala Tamilnadu Background characteristic NFHS-2 Rural NFI survey NFHS-2 Rural NFI study Type of house Kutcha 7.8 10.7 42.8 34.6 Semi pucca 15.5 63.3 38.3 52.6 Pucca 76.7 26.0 18.8 12.8 Missing 0.1 0.0 Source of drinking water Piped 11.4 17.7 64.8 93.1 Hand pump 2.2 0.0 18.4 0.0 Well water 83.6 78.3 13.3 6.9 Surface water (tube well) 1.1 0.0 3.3 0.0 Other (stream/canal/river) 1.7 4.0 0.2 0.0 Sanitation facility Sanitary latrine 15.4 81.0 12.6 6.2 Pit toilet/Manually cleaned latrine
67.3 14.0 0.3 2.8
No facility 17.3 5.00 87.1 91.0 Electricity Yes 66.7 74.7 72.5 76.8 No 33.3 25.3 27.5 23.2 Main type of fuel used for cooking Wood 86.0 75.7 84.2 85.5 Kerosene 1.7 1.2 6.9 5.9 Liquid petroleum gas (LPG) 10.7 22.7 6.2 8.7 Others 1.6 0.0 2.7 0.0 Exposure to mass media Newspaper 61.2 28.0 15.8 2.1 Radio 69.9 66.0 49.2 31.1 Television 56.3 43.3 53.2 37.7 Standard of living index Low 21.6 23.3 51.0 18.3 Medium 54.4 53.3 40.3 62.6 High 24.1 21.3 7.7 19.0 Missing 1.0 0.0
iii
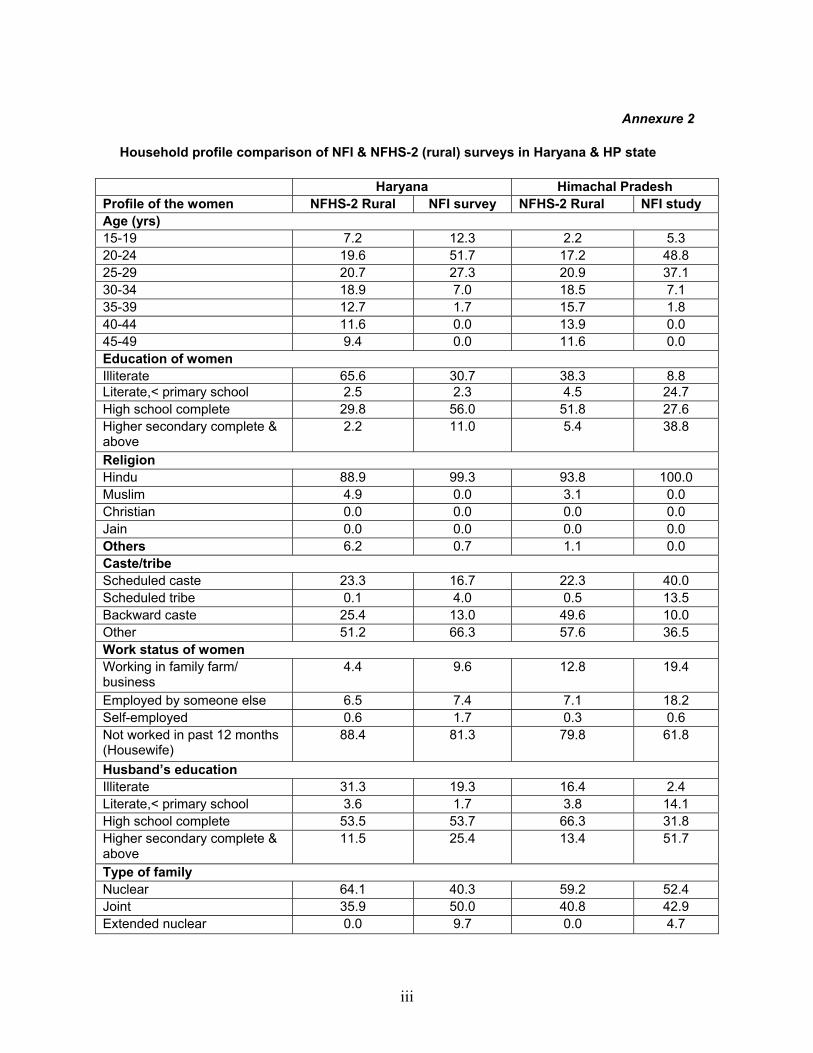
Annexure 2
Household profile comparison of NFI & NFHS-2 (rural) surveys in Haryana & HP state
Haryana Himachal Pradesh Profile of the women NFHS-2 Rural NFI survey NFHS-2 Rural NFI study Age (yrs) 15-19 7.2 12.3 2.2 5.3 20-24 19.6 51.7 17.2 48.8 25-29 20.7 27.3 20.9 37.1 30-34 18.9 7.0 18.5 7.1 35-39 12.7 1.7 15.7 1.8 40-44 11.6 0.0 13.9 0.0 45-49 9.4 0.0 11.6 0.0 Education of women Illiterate 65.6 30.7 38.3 8.8 Literate,< primary school 2.5 2.3 4.5 24.7 High school complete 29.8 56.0 51.8 27.6 Higher secondary complete & above
2.2 11.0 5.4 38.8
Religion Hindu 88.9 99.3 93.8 100.0 Muslim 4.9 0.0 3.1 0.0 Christian 0.0 0.0 0.0 0.0 Jain 0.0 0.0 0.0 0.0 Others 6.2 0.7 1.1 0.0 Caste/tribe Scheduled caste 23.3 16.7 22.3 40.0 Scheduled tribe 0.1 4.0 0.5 13.5 Backward caste 25.4 13.0 49.6 10.0 Other 51.2 66.3 57.6 36.5 Work status of women Working in family farm/ business
4.4 9.6 12.8 19.4
Employed by someone else 6.5 7.4 7.1 18.2 Self-employed 0.6 1.7 0.3 0.6 Not worked in past 12 months (Housewife)
88.4 81.3 79.8 61.8
Husband’s education Illiterate 31.3 19.3 16.4 2.4 Literate,< primary school 3.6 1.7 3.8 14.1 High school complete 53.5 53.7 66.3 31.8 Higher secondary complete & above
11.5 25.4 13.4 51.7
Type of family Nuclear 64.1 40.3 59.2 52.4 Joint 35.9 50.0 40.8 42.9 Extended nuclear 0.0 9.7 0.0 4.7

iv
Haryana Himachal Pradesh
Background characteristic NFHS-2 Rural NFI survey NFHS-2 Rural NFI study
Type of house
Kutcha 8.1 12.3 30.6 21.2
Semi pucca 62.2 21.3 45.0 21.2
Pucca 29.5 66.3 24.3 57.6
Missing 0.1 0.0 0.1 0.0
Source of drinking water Piped 35.7 53.1 65.7 97.1
Hand pump 46.9 35.2 9.5 0.0
Well water 17.0 11.7 18.6 1.2
Surface water (tube well) 0.1 0.0 5.7 0.0
Other (stream/canal/river) 0.3 0.0 0.4 1.8
Sanitation facility
Sanitary latrine 11.1 10.0 17.6 51.2
Pit toilet/Manually cleaned latrine
8.2 22.0 2.3 47.1
No facility 80.7 68.0 80.1 1.8
Electricity
Yes 85.0 83.7 96.9 98.8
No 15.0 16.3 3.1 1.2
Main type of fuel used for cooking
Wood 74.1 65.2 70.8 41.2
Kerosene 3.7 1.8 4.5 25.3
Liquid petroleum gas (LPG) 9.5 33.0 24.5 33.5
Others 12.7 0.0 0.0 0.0
Exposure to mass media
Newspaper 11.5 7.0 23.7 87.6
Radio 26.1 49.7 55.7 32.9
Television 50.3 61.0 71.7 40.0
Standard of living index
Low 15.8 22.0 13.5 15.3
Medium 55.0 53.3 63.0 71.8
High 28.7 24.7 22.7 12.9
Missing 0.6 0.0 0.8 0.0
v
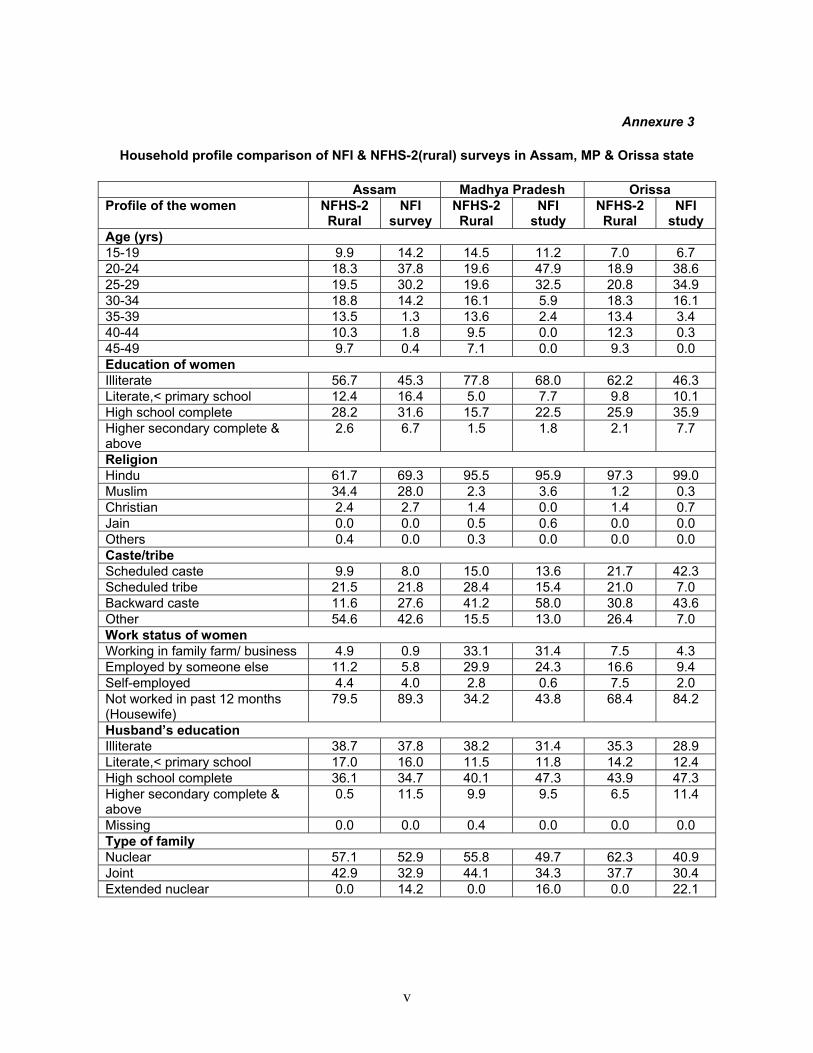
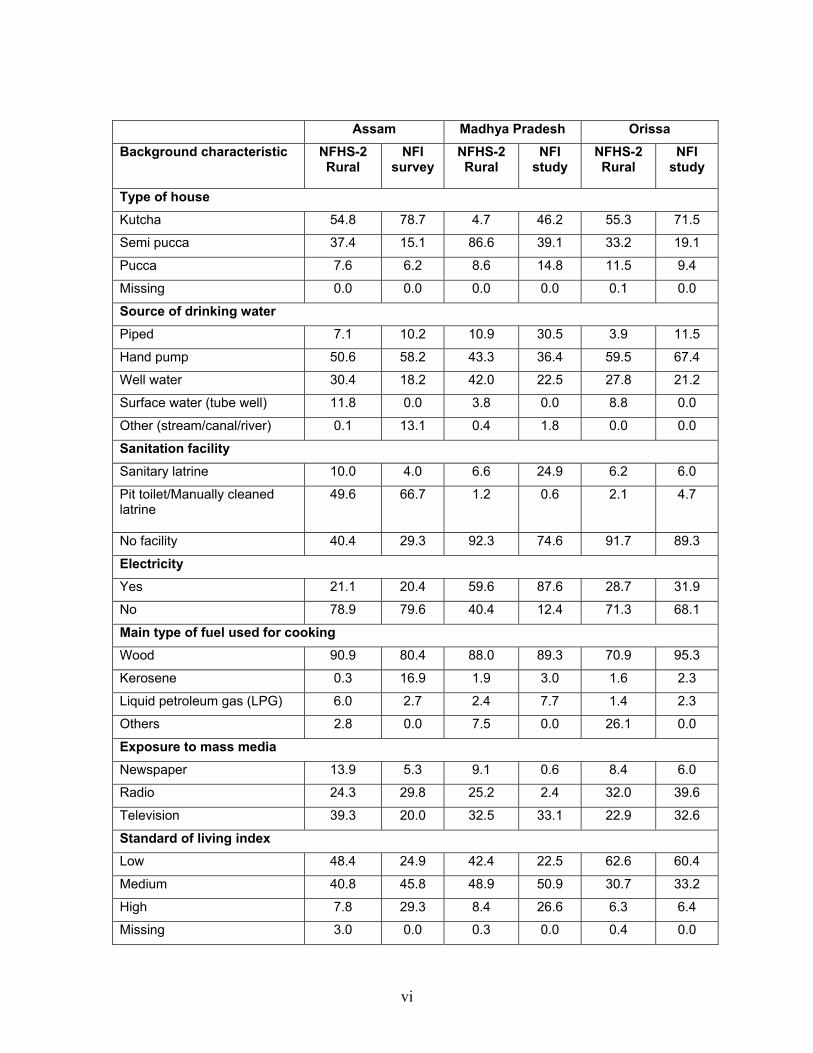
Annexure 3
Household profile comparison of NFI & NFHS-2(rural) surveys in Assam, MP & Orissa state
Assam Madhya Pradesh Orissa Profile of the women NFHS-2
Rural NFI
survey NFHS-2 Rural
NFI study
NFHS-2 Rural
NFI study
Age (yrs) 15-19 9.9 14.2 14.5 11.2 7.0 6.7 20-24 18.3 37.8 19.6 47.9 18.9 38.6 25-29 19.5 30.2 19.6 32.5 20.8 34.9 30-34 18.8 14.2 16.1 5.9 18.3 16.1 35-39 13.5 1.3 13.6 2.4 13.4 3.4 40-44 10.3 1.8 9.5 0.0 12.3 0.3 45-49 9.7 0.4 7.1 0.0 9.3 0.0 Education of women Illiterate 56.7 45.3 77.8 68.0 62.2 46.3 Literate,< primary school 12.4 16.4 5.0 7.7 9.8 10.1 High school complete 28.2 31.6 15.7 22.5 25.9 35.9 Higher secondary complete & above
2.6 6.7 1.5 1.8 2.1 7.7
Religion Hindu 61.7 69.3 95.5 95.9 97.3 99.0 Muslim 34.4 28.0 2.3 3.6 1.2 0.3 Christian 2.4 2.7 1.4 0.0 1.4 0.7 Jain 0.0 0.0 0.5 0.6 0.0 0.0 Others 0.4 0.0 0.3 0.0 0.0 0.0 Caste/tribe Scheduled caste 9.9 8.0 15.0 13.6 21.7 42.3 Scheduled tribe 21.5 21.8 28.4 15.4 21.0 7.0 Backward caste 11.6 27.6 41.2 58.0 30.8 43.6 Other 54.6 42.6 15.5 13.0 26.4 7.0 Work status of women Working in family farm/ business 4.9 0.9 33.1 31.4 7.5 4.3 Employed by someone else 11.2 5.8 29.9 24.3 16.6 9.4 Self-employed 4.4 4.0 2.8 0.6 7.5 2.0 Not worked in past 12 months (Housewife)
79.5 89.3 34.2 43.8 68.4 84.2
Husband’s education Illiterate 38.7 37.8 38.2 31.4 35.3 28.9 Literate,< primary school 17.0 16.0 11.5 11.8 14.2 12.4 High school complete 36.1 34.7 40.1 47.3 43.9 47.3 Higher secondary complete & above
0.5 11.5 9.9 9.5 6.5 11.4
Missing 0.0 0.0 0.4 0.0 0.0 0.0 Type of family Nuclear 57.1 52.9 55.8 49.7 62.3 40.9 Joint 42.9 32.9 44.1 34.3 37.7 30.4 Extended nuclear 0.0 14.2 0.0 16.0 0.0 22.1
vi
Assam Madhya Pradesh Orissa Background characteristic NFHS-2
Rural NFI
survey NFHS-2 Rural
NFI study
NFHS-2 Rural
NFI study
Type of house
Kutcha 54.8 78.7 4.7 46.2 55.3 71.5
Semi pucca 37.4 15.1 86.6 39.1 33.2 19.1
Pucca 7.6 6.2 8.6 14.8 11.5 9.4
Missing 0.0 0.0 0.0 0.0 0.1 0.0
Source of drinking water Piped 7.1 10.2 10.9 30.5 3.9 11.5
Hand pump 50.6 58.2 43.3 36.4 59.5 67.4
Well water 30.4 18.2 42.0 22.5 27.8 21.2
Surface water (tube well) 11.8 0.0 3.8 0.0 8.8 0.0
Other (stream/canal/river) 0.1 13.1 0.4 1.8 0.0 0.0
Sanitation facility
Sanitary latrine 10.0 4.0 6.6 24.9 6.2 6.0
Pit toilet/Manually cleaned latrine
49.6 66.7 1.2 0.6 2.1 4.7
No facility 40.4 29.3 92.3 74.6 91.7 89.3
Electricity
Yes 21.1 20.4 59.6 87.6 28.7 31.9
No 78.9 79.6 40.4 12.4 71.3 68.1
Main type of fuel used for cooking
Wood 90.9 80.4 88.0 89.3 70.9 95.3
Kerosene 0.3 16.9 1.9 3.0 1.6 2.3
Liquid petroleum gas (LPG) 6.0 2.7 2.4 7.7 1.4 2.3
Others 2.8 0.0 7.5 0.0 26.1 0.0
Exposure to mass media
Newspaper 13.9 5.3 9.1 0.6 8.4 6.0
Radio 24.3 29.8 25.2 2.4 32.0 39.6
Television 39.3 20.0 32.5 33.1 22.9 32.6
Standard of living index
Low 48.4 24.9 42.4 22.5 62.6 60.4
Medium 40.8 45.8 48.9 50.9 30.7 33.2
High 7.8 29.3 8.4 26.6 6.3 6.4
Missing 3.0 0.0 0.3 0.0 0.4 0.0