nutrition & health: dairy -...
TRANSCRIPT
40 Feedstuffs, September 10, 2008
Nutrition & Health [ Dietary allowances for dairy cattle ]
Nutrition & Health: DairyBy JIM LINN
DAIRY cattle, as well as other ruminant animals, essentially have two requirements for nutrients. One is the animal or tissue requirement for biochemical reactions needed for life, health and production. The other is for the microbial
population in the rumen. In general, diets should be formulated to meet but not greatly exceed total nutrient requirements. This decreases feed costs and nutrient excretion into the environment yet maintains animal performance and health.
The purpose of this paper is to provide both an understanding of the nutrient requirements of dairy cows and a resource guide for the formulation of dairy cow diets.
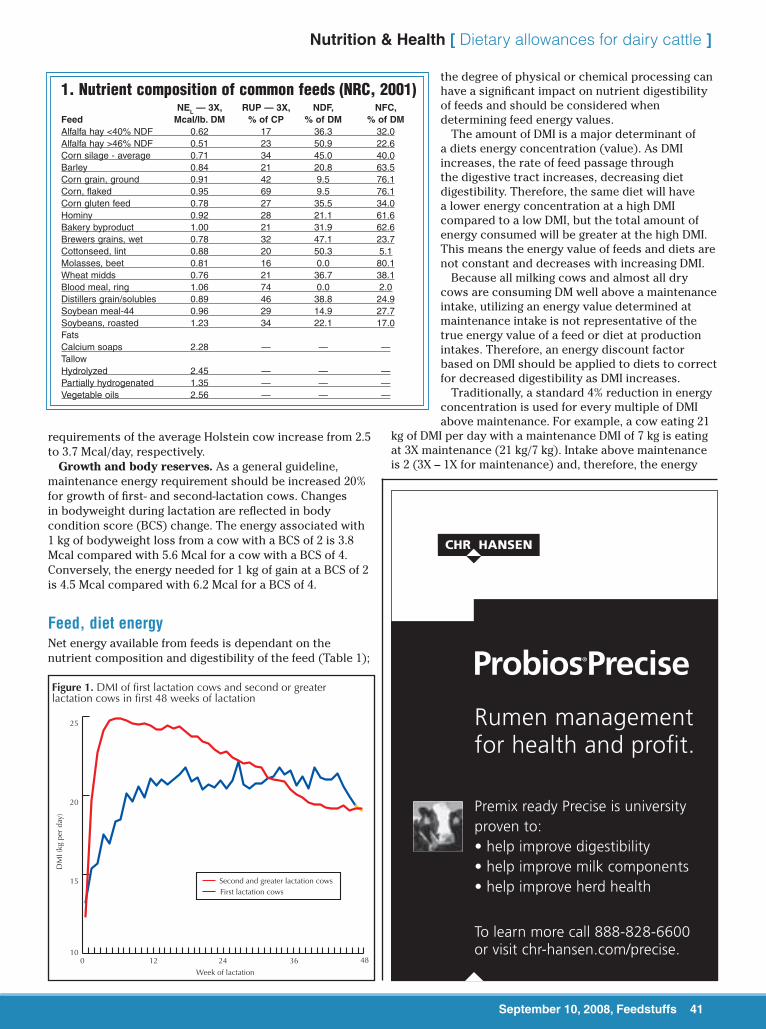
DMI: lactating cowsDry matter intake (DMI) of fi rst-lactation cows and cows of second or greater lactation differs during lactation (Figure 1). First lactation cows have a slow steady rise in DMI during early lactation reaching a plateau at about 16 weeks and remaining there for the duration of the lactation. In contrast, cows starting their second or later lactations increase DMI rapidly the fi rst few weeks of lactation peaking at fi ve to six weeks of lactation and then slowly decreasing as lactation progresses. The difference in both the quantity and pattern of DMI over the lactation emphasizes the importance of grouping and feeding fi rst lactation and older cows separately until at least 35 weeks into lactation.
DMI is a critical component in meeting the nutrient requirements of animals as: (1) animals require amounts of nutrients, not percentages or concentrations, each day to maintain health and production and (2) certain nutrients like energy and rumen undegradable protein (RUP) concentrations in the diet are affected by the amount of feed DM an animal consumes. DMI of dairy cows is the container that all nutrients must be in to meet the animal’s requirements. In the absence of known DMI, the following equation can be used to predict DMI of lactating cows (NRC, 2001): DMI (kg/day) = (0.372 x 4% FCM + 0.0968 x BW0.75) x (1-e(-0.192 x (WOL + 3.62))), where 4% FCM = (kg of milk x 0.4) + (kg
of milk x fat%/100 x 15); BW = bodyweight (kg); e = 2.71828; WOL = week of lactation, and FCM = fat-corrected milk.
It is useful to compare actual and predicted DMI. If actual DMI is 5% above predicted DMI, check the following: feeding accuracy (are mixer scales calibrated and the total mixed ration [TMR] properly mixed prior to feeding), feed refusals (are they accounted for and reasonably accurate), DM value of feedstuffs (are they correct), cow bodyweights (is feed energy being used for bodyweight gain), and feed effi ciency (cows should average 1.4-1.8 lb. of milk per pound of DMI). In contrast, if actual DMI is less than predicted, one of the following may be limiting DMI: ration palatability, feed access, high fi ber rations, water intake, heat stress or excess dietary RUP.
Energy requirements: lactating, dry cowsThe energy system used for lactating and dry dairy cows is net energy of lactation (NEL) and is expressed in megacalories (Mcal). The Dairy NRC (2001) describes energy requirements of dairy cows for the following: maintenance, lactation, activity, pregnancy and growth.
Maintenance. Energy requirements for maintenance are: NEL, Mcal/day = 0.08 x BW0.75 (BW = bodyweight in kilograms). Maintenance energy is needed for life’s normal daily processes. Excessive walking increases maintenance energy requirements 0.00045 Mcal/kg bodyweight for every kilometer walked. For example, a 600-kg cow that walks 2 km per day needs an additional 0.54 Mcal of energy per day or about a 5.5% increase in maintenance requirement. Mild to severe heat stress increases maintenance energy requirements 7-25%.
Lactation. The energy required to produce milk is based on the concentration of fat, protein and lactose in the milk produced and can be calculated using the following equations: NEL (Mcal/kg) = 0.0929 x fat % + 0.0547 x CP % + 0.0395 x Lactose %; or, if lactose is not known, NEL (Mcal/kg) = 0.0929 x fat % + 0.0547 x CP % + 0.192.
Pregnancy. Before 190 days of gestation, no additional energy above maintenance is needed for pregnancy. Between 190 and 279 days of gestation, pregnancy
September 10, 2008, Feedstuffs 41
Nutrition & Health [ Dietary allowances for dairy cattle ]
September 10, 2008, Feedstuffs 41
requirements of the average Holstein cow increase from 2.5 to 3.7 Mcal/day, respectively.
Growth and body reserves. As a general guideline, maintenance energy requirement should be increased 20% for growth of fi rst- and second-lactation cows. Changes in bodyweight during lactation are refl ected in body condition score (BCS) change. The energy associated with 1 kg of bodyweight loss from a cow with a BCS of 2 is 3.8 Mcal compared with 5.6 Mcal for a cow with a BCS of 4. Conversely, the energy needed for 1 kg of gain at a BCS of 2 is 4.5 Mcal compared with 6.2 Mcal for a BCS of 4.
Feed, diet energyNet energy available from feeds is dependant on the nutrient composition and digestibility of the feed (Table 1);
the degree of physical or chemical processing can have a signifi cant impact on nutrient digestibility of feeds and should be considered when determining feed energy values.
The amount of DMI is a major determinant of a diets energy concentration (value). As DMI increases, the rate of feed passage through the digestive tract increases, decreasing diet digestibility. Therefore, the same diet will have a lower energy concentration at a high DMI compared to a low DMI, but the total amount of energy consumed will be greater at the high DMI. This means the energy value of feeds and diets are not constant and decreases with increasing DMI.
Because all milking cows and almost all dry cows are consuming DM well above a maintenance intake, utilizing an energy value determined at maintenance intake is not representative of the true energy value of a feed or diet at production intakes. Therefore, an energy discount factor based on DMI should be applied to diets to correct for decreased digestibility as DMI increases.
Traditionally, a standard 4% reduction in energy concentration is used for every multiple of DMI above maintenance. For example, a cow eating 21
kg of DMI per day with a maintenance DMI of 7 kg is eating at 3X maintenance (21 kg/7 kg). Intake above maintenance is 2 (3X – 1X for maintenance) and, therefore, the energy
1. Nutrient composition of common feeds (NRC, 2001) NEL — 3X, RUP — 3X, NDF, NFC, Feed Mcal/lb. DM % of CP % of DM % of DMAlfalfa hay <40% NDF 0.62 17 36.3 32.0Alfalfa hay >46% NDF 0.51 23 50.9 22.6Corn silage - average 0.71 34 45.0 40.0Barley 0.84 21 20.8 63.5Corn grain, ground 0.91 42 9.5 76.1Corn, flaked 0.95 69 9.5 76.1Corn gluten feed 0.78 27 35.5 34.0Hominy 0.92 28 21.1 61.6Bakery byproduct 1.00 21 31.9 62.6Brewers grains, wet 0.78 32 47.1 23.7Cottonseed, lint 0.88 20 50.3 5.1Molasses, beet 0.81 16 0.0 80.1Wheat midds 0.76 21 36.7 38.1Blood meal, ring 1.06 74 0.0 2.0Distillers grain/solubles 0.89 46 38.8 24.9Soybean meal-44 0.96 29 14.9 27.7Soybeans, roasted 1.23 34 22.1 17.0FatsCalcium soaps 2.28 — — —TallowHydrolyzed 2.45 — — —Partially hydrogenated 1.35 — — —Vegetable oils 2.56 — — —
10
15
20
25
0 12 24 36 48
Second and greater lactation cowsFirst lactation cows
Figure 1. DMI of first lactation cows and second or greater lactation cows in first 48 weeks of lactation
DM
I (kg
per
day
)
Week of lactation
Rumen management for health and profit.
Premix ready Precise is university proven to:• help improve digestibility• help improve milk components• help improve herd health
To learn more call 888-828-6600 or visit chr-hansen.com/precise.
42 Feedstuffs, September 10, 2008
Nutrition & Health [ Dietary allowances for dairy cattle ]
value of the diet should be decreased 8%. Alternatively, the following equations from the Dairy NRC (2001) can be utilized:
• Discount factor (DEp) = (TDN1X – [((0.18 x TDN1X) – 10.3) x Intake]/TDN1X
• DEp, Mcal/kg = DE x discount factor • MEp, Mcal/kg = (1.01 x DEp – 0.45) + (0.0046 x (EE – 3))• NELp, Mcal/kg = (0.703 x MEp – 0.19) + {[(0.097 x MEp +
0.19)/0.97] x (EE – 3)}Where TDN = total digestible nutrients; DE = digestible
energy; EE = ether extract and ME = metabolizable energy.
CarbohydratesCarbohydrates are typically classifi ed as fi ber or non-fi ber. Fiber carbohydrates include neutral detergent fi ber (NDF)
and acid detergent fi ber (ADF) and are primarily cellulose and hemicellulose. The non-fi ber carbohydrate (NFC) fraction is considered to be starches and sugars; however, other components such as organic acids and neutral detergent soluble fi bers (pectins, beta-glucans, fructans) are included in NFC. The NFC content (%) of a feed or diet can be estimated by subtracting the sum of the (%), crude protein (CP; %), fat (%) and ash (%) in a feed or diet from 100 (all compositional values are on a DM basis). However, a better formula is NFC (%) = 100 – [NDF + (CP – NDF-CP) + fat + ash] as it corrects for CP in the NDF fraction already included as part of the total CP.
The composition of NFC determines the volatile fatty acids produced from a feed or diet during fermentation in the rumen and is therefore important to consider when formulating diets. Starches, sugars and fructans will ferment to more lactic and propionic acids compared to pectins, which result in more acetic acid. As a stronger acid (10-fold), lactic acid will have a much greater impact on decreasing rumen pH than acetic or propionic acid.
NFC composition of most legume and most grass forages is primarily pectin and organic acids compared to corn, where NFC is starch plus a small amount of sugar. Slightly higher dietary NFC levels (1-4%) are acceptable in diets where legumes or grasses (NFC, primarily pectin) are the major forage source compared to where corn silage (NFC, primarily starch) is the major forage source.
Recommendations for NDF, ADF and NFC concentrations in lactating cow diets are shown in Table 2. The amount of NDF from forages, total NDF and ADF recommendations are minimums whereas NFC recommendations are maximums. Other dietary factors including grain source, rumen availability of starch, fi ber source, fi ber particle size and digestibility of fi ber should be considered when choosing the amount of fi ber and NFC feedstuffs to include in the diet. When formulating diets, use NDF as the measurement for fi ber content of the diet; as total NDF in the diet decreases a higher percentage of NDF should come from forages and the total NFC in the diet should decrease.
Starch and sugar. Starch levels of 23-27% of the diet DM are suggested; however, no specifi c starch requirement has been established. The availability of starch in the rumen will have a signifi cant effect on how much starch can be fed in a diet. The diet content should be lower when high rumen degradable starch sources like steam-fl aked, very-fi ne-ground or high-moisture corn are fed compared to coarse ground or cracked dry corn.
Recent research indicates lower starch levels (17.5-21.0%) can be fed to lactating dairy cows without decreasing cow performance if the starch source is replaced with highly digestible byproduct feeds (Dann et al., 2008; Ranathunga et al., 2008).
Sugar is very rapidly fermented in the rumen and, therefore, feeding guidelines are lower than for starch at 3-5% of DM.
Forage particle size. The NDF content of a diet does not refl ect the amount of physically effective fi ber (peNDF) in the diet. peNDF represents the longer fi ber particles that stimulate cud chewing and are used to maintain the rumen mat, an essential component for rumen function and animal health. Forages are the major
2. Recommended total NDF, forage NDF, ADF, and NFC concentrations in the diets of lactating cows fed total mixed rations1
--Minimum % of diet DM-- -Maximum % of diet DM- Forage NDF Total NDF ADF NFC2
19 25 17 44 18 27 18 42 17 29 19 40 16 31 20 38 15 33 21 36
1Assumes forage particle size is adequate and ground dry corn is starch source.2NFC = 100 – (NDF + CP + Fat + Ash). All analyses are % on a DM basis.
3. MP requirements for dry and lactating cowsParameter MP requirement, g/dayMaintenance bodyweight, kg 400 390450 404500 410550 418600 423650 427Gestation*Only when > 220 days pregnant 240 g + 2 g/day for every day >220Lactation, true milk protein % g/kg of milk produced2.8 423.0 453.2 483.4 513.6 54
*There is no protein requirement for gestation when < 220 days pregnant.
4. Dietary protein guidelines for dry and lactating 680 kg cow. DMI, kg/day CP, % of DM RUP, % of DMEarly lactation < 30 days in milkMilk, kg/day20 12.4 16.6 5.330 14.5 18.8 7.740 16.7 20.3 9.3Midlactation >90 days in milkMilk, kg/day25 20.3 13.9 4.035 23.6 15.1 4.745 26.9 15.9 5.855 30.2 16.6 6.8Dry cow – 240 days pregnant — 11 2.5
Talk to your local Pioneer sales professional about how Pioneer® brand 11CFT can benefit your silage program.
Beyond Fermentation
Unlocking the nutrient potential
of your corn silage
®,TM
,SM T
rade
mar
ks a
nd s
ervi
ce m
arks
of P
ione
er H
i-Bre
d.
All p
urch
ases
are
sub
ject
to th
e te
rms
of la
belin
g an
d pu
rcha
se d
ocum
ents
. © 2
008
PHII
FORA
G010
524P
399A
VAR2
44 Feedstuffs, September 10, 2008
Nutrition & Health [ Dietary allowances for dairy cattle ]
source of peNDF. Several research studies have indicated a minimum forage particle length of 6.5 mm (0.25 in.) is needed to maintain good rumen pH and adequate rumination activity, and prevent depressions in milk fat percentage (Allen, 1997; Beauchemin et al., 1994; Grant et al., 1990). The Penn State particle box is an excellent tool for estimating particle size in forages and TMRs. Guidelines for TMR particle size using the Penn State box are: top screen = 7-10%, second screen = 40-50%, third screen < 35% and bottom pan < 20% of the total sample wet weight.
NDF digestibility. NDF digestibility is an estimation of what proportion of the NDF is digested during a given time period. The relationship between diet NDF digestibility and cow performance has been reported as follows: a 1% unit increase in NDF digestibility increases DMI 0.37 lb. per day and increases milk 0.55 lb. per day (Oba and Allen, 1999). However, due to differences in forages and diets along with variability in NDF digestibility, analysis probably require forages to have an 8% unit difference or more in NDF digestibility before changes in production are observed on farms.
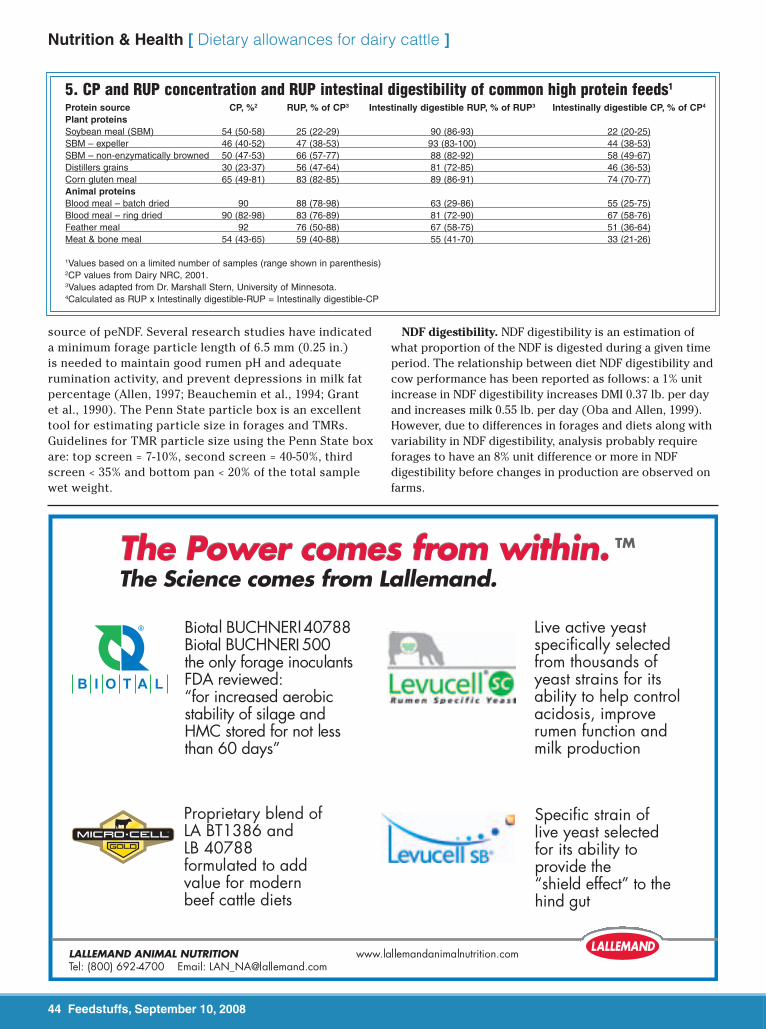
5. CP and RUP concentration and RUP intestinal digestibility of common high protein feeds1 Protein source CP, %2 RUP, % of CP3 Intestinally digestible RUP, % of RUP3 Intestinally digestible CP, % of CP4
Plant proteinsSoybean meal (SBM) 54 (50-58) 25 (22-29) 90 (86-93) 22 (20-25)SBM – expeller 46 (40-52) 47 (38-53) 93 (83-100) 44 (38-53)SBM – non-enzymatically browned 50 (47-53) 66 (57-77) 88 (82-92) 58 (49-67)Distillers grains 30 (23-37) 56 (47-64) 81 (72-85) 46 (36-53)Corn gluten meal 65 (49-81) 83 (82-85) 89 (86-91) 74 (70-77)Animal proteinsBlood meal – batch dried 90 88 (78-98) 63 (29-86) 55 (25-75)Blood meal – ring dried 90 (82-98) 83 (76-89) 81 (72-90) 67 (58-76)Feather meal 92 76 (50-88) 67 (58-75) 51 (36-64)Meat & bone meal 54 (43-65) 59 (40-88) 55 (41-70) 33 (21-26)
1Values based on a limited number of samples (range shown in parenthesis)2CP values from Dairy NRC, 2001.3Values adapted from Dr. Marshall Stern, University of Minnesota.4Calculated as RUP x Intestinally digestible-RUP = Intestinally digestible-CP
September 10, 2008, Feedstuffs 45
Nutrition & Health [ Dietary allowances for dairy cattle ]
September 10, 2008, Feedstuffs 45
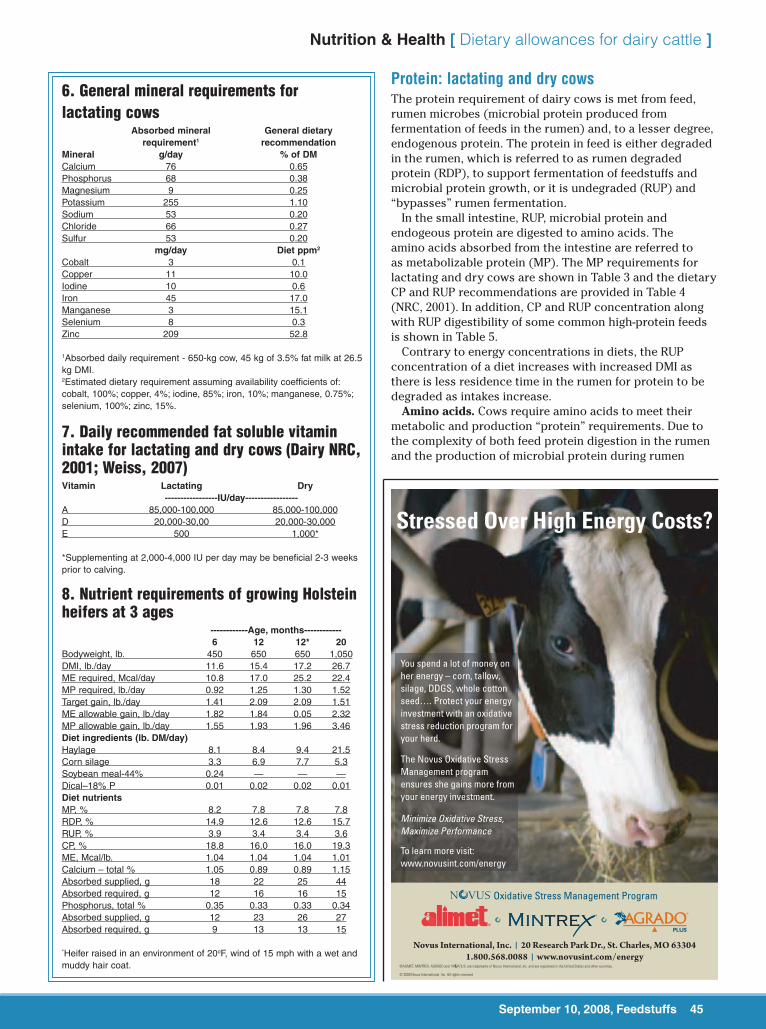
6. General mineral requirements for lactating cows Absorbed mineral General dietary requirement1 recommendationMineral g/day % of DMCalcium 76 0.65Phosphorus 68 0.38Magnesium 9 0.25Potassium 255 1.10Sodium 53 0.20Chloride 66 0.27Sulfur 53 0.20 mg/day Diet ppm2
Cobalt 3 0.1Copper 11 10.0Iodine 10 0.6Iron 45 17.0Manganese 3 15.1Selenium 8 0.3Zinc 209 52.8
1Absorbed daily requirement - 650-kg cow, 45 kg of 3.5% fat milk at 26.5 kg DMI.2Estimated dietary requirement assuming availability coefficients of: cobalt, 100%; copper, 4%; iodine, 85%; iron, 10%; manganese, 0.75%; selenium, 100%; zinc, 15%.
Protein: lactating and dry cowsThe protein requirement of dairy cows is met from feed, rumen microbes (microbial protein produced from fermentation of feeds in the rumen) and, to a lesser degree, endogenous protein. The protein in feed is either degraded in the rumen, which is referred to as rumen degraded protein (RDP), to support fermentation of feedstuffs and microbial protein growth, or it is undegraded (RUP) and “bypasses” rumen fermentation.
In the small intestine, RUP, microbial protein and endogeous protein are digested to amino acids. The amino acids absorbed from the intestine are referred to as metabolizable protein (MP). The MP requirements for lactating and dry cows are shown in Table 3 and the dietary CP and RUP recommendations are provided in Table 4 (NRC, 2001). In addition, CP and RUP concentration along with RUP digestibility of some common high-protein feeds is shown in Table 5.
Contrary to energy concentrations in diets, the RUP concentration of a diet increases with increased DMI as there is less residence time in the rumen for protein to be degraded as intakes increase.
Amino acids. Cows require amino acids to meet their metabolic and production “protein” requirements. Due to the complexity of both feed protein digestion in the rumen and the production of microbial protein during rumen
7. Daily recommended fat soluble vitamin intake for lactating and dry cows (Dairy NRC, 2001; Weiss, 2007)Vitamin Lactating Dry -----------------IU/day-----------------A 85,000-100,000 85,000-100,000D 20,000-30,00 20,000-30,000E 500 1,000*
*Supplementing at 2,000-4,000 IU per day may be beneficial 2-3 weeks prior to calving.
8. Nutrient requirements of growing Holstein heifers at 3 ages ------------Age, months------------ 6 12 12* 20Bodyweight, lb. 450 650 650 1,050DMI, lb./day 11.6 15.4 17.2 26.7ME required, Mcal/day 10.8 17.0 25.2 22.4MP required, lb./day 0.92 1.25 1.30 1.52Target gain, lb./day 1.41 2.09 2.09 1.51ME allowable gain, lb./day 1.82 1.84 0.05 2.32MP allowable gain, lb./day 1.55 1.93 1.96 3.46Diet ingredients (lb. DM/day)Haylage 8.1 8.4 9.4 21.5Corn silage 3.3 6.9 7.7 5.3Soybean meal-44% 0.24 — — —Dical–18% P 0.01 0.02 0.02 0.01Diet nutrientsMP, % 8.2 7.8 7.8 7.8RDP, % 14.9 12.6 12.6 15.7RUP, % 3.9 3.4 3.4 3.6CP, % 18.8 16.0 16.0 19.3ME, Mcal/lb. 1.04 1.04 1.04 1.01Calcium – total % 1.05 0.89 0.89 1.15Absorbed supplied, g 18 22 25 44Absorbed required, g 12 16 16 15Phosphorus, total % 0.35 0.33 0.33 0.34Absorbed supplied, g 12 23 26 27Absorbed required, g 9 13 13 15
*Heifer raised in an environment of 20oF, wind of 15 mph with a wet and muddy hair coat.
Stressed Over High Energy Costs?
Oxidative Stress Management Program
PLUS
You spend a lot of money on her energy – corn, tallow, silage, DDGS, whole cotton seed…. Protect your energy investment with an oxidative stress reduction program for your herd.
The Novus Oxidative Stress Management program ensures she gains more from your energy investment.
Minimize Oxidative Stress, Maximize Performance
To learn more visit: www.novusint.com/energy
Novus International, Inc. l 20 Research Park Dr., St. Charles, MO 633041.800.568.0088 l www.novusint.com/energy
®ALIMET, MINTREX, AGRADO and are trademarks of Novus International, Inc. and are registered in the United States and other countries.
© 2008 Novus International, Inc. All rights reserved

46 Feedstuffs, September 10, 2008
Nutrition & Health [ Dietary allowances for dairy cattle ]
9. ME and ADP requirements of young calves fed liquids only, liquids and solids and solids onlyCalf weight, lb. Daily gain, lb. DMI, lb. ME, ADP, Mcal/day lb./day ---------Milk or milk replacer only---------55 0.9 0.9 2.0 0.2588 0.9 1.2 2.6 0.26110 0.9 1.4 3.0 0.26 -------Milk/milk replacer and starter------88 1.3 1.8 3.4 0.28110 1.3 2.1 3.9 0.29132 1.3 2.3 4.3 0.30 -----------------Starter only------------------132 1.5 3.8 5.3 0.53176 1.5 4.4 6.2 0.56220 1.5 5.3 7.0 0.58
10. Impact of temperature on ME requirements of calves Calves, birth to 3 weeks, Calves > 3 weeks,Temperature, oF Increase in ME, % Increase in ME, %50 27 041 40 1332 54 2723 68 4014 86 545 94 68-4 108 81-13 121 94-22 134 107
fermentation, amino acid requirements have not been defi nitively established. However, based on dose-response curves, recommended levels for lysine and methionine — typically the two most-limiting amino acids for lactating dairy cows — are 6.6-6.8% and 2.2% of the MP, respectively (Schwab and Boucher, 2007).
The benefi t of formulating diets to meet amino acid requirements of the cow include feeding diets lower in total CP, increased effi ciency of protein utilization in the animal, increased milk protein and fat yield and decreased feed costs.
Minerals and vitaminsMineral requirements for lactating dairy cows. The mineral requirements for a high-producing lactating cow of average size and producing milk of standard composition is shown in Table 6. The absorbed mineral is the amount the diet must supply to the tissues to meet requirements. Not all mineral in a diet is absorbable with availability of mineral in feedstuffs depending on the mineral, concentration in a feedstuff, type of feedstuff and interactions with other minerals and nutrients. The minimum recommended dietary concentration of minerals need to meet the absorbed amounts in a standard lactating cow diet also is shown in Table 6.
DCAD. Dietary cation-anion difference (DCAD) is a measurement of the difference between the concentration of strong cations (positively charged ions) and anions
(negatively charged ions) in the diet. A variety of equations have been proposed to determine DCAD, but the commonly utilized equation is: DCAD mEq (milliequivalents)/100 g dietary DM = [(%sodium x 43.5 + %potassium x 25.6) - (%chloride x 28.2 + %sulfur x 62.5)]. Negative DCAD diets can be fed to close-up dry cows as a method to decrease metabolic disorders associated with calving. Positive DCAD diets should be fed to lactating dairy cows to promote milk production and health.
Close-up dry cows (less than 3 weeks prior to calving): Recommended DCAD level is -10 to -15 mEq/100 g dietary DM. Negative DCAD diets are fed to help maintain blood calcium levels at or following parturition. Bone is a major source of buffer used to control acid-base balance in the body. When cows consume acidic diets and blood pH decreases, calcium is released from bone into the blood. In addition, acidic diets result in increased absorption of calcium from the intestine. To determine the effectiveness of a negative DCAD diet, measure urine pH on a regular basis. Optimally, urine pH should be between 6.0 and 6.5 for the last two to three weeks before calving (Goof, 2006).
Lactating dairy cows: To maximize feed intake and milk production, a positive
Brock Grain SystemsA Division of CTB, Inc.Phone: 574.658.4191Internet: www.brockgrain.com E-Mail: [email protected]
Contactus today.
Different By Design™
Storage Bin Capacities up to 730,000 bushels
SWEEP-TRACKER® Controller for remote
sweep operation
Dependable
Enclosed Roller-Belt Conveyors handleup to 58,000 bph
Energy-Efficient
Grain Dryers up to 7,000 bph
Easy to Use
QUANTUM® Dryer Control
Single-pass
Bin Sweeps up to 20,000 bph
Storage Bin Capacities up to 730,000 bushels
SWEEP-TRACKER® Controller for remote
sweep operation
Dependable
Enclosed Roller-Belt Conveyors handleup to 58,000 bph
Energy-Efficient
Grain Dryers up to 7,000 bph
Easy to Use
QUANTUM® Dryer Control
Single-pass
Bin Sweeps up to 20,000 bph
September 10, 2008, Feedstuffs 47
Nutrition & Health [ Dietary allowances for dairy cattle ]
September 10, 2008, Feedstuffs 47
LesafLesafLesafLesafLesaffrfrfrfrfreeeee
FFFFFeed eed eed eed eed AdAdAdAdAdditiditiditiditiditivvvvveseseseses
Fax (414) 615-4003
(800) 990-0214(414) 615-4024
DCAD between 25 and 40 mEq/100 g DM is recommended. Feeding a positive DCAD diet is useful in heat stress conditions as cows under heat stress experience losses of bicarbonate and potassium; a DCAD between 25 and 30 mEq/100 g DM DCAD is recommended during heat stress (Beede, 2005).
Water-soluble vitamins (B-vitamins and vitamin C): Dietary supplementation of water soluble vitamins is not required to prevent clinical defi ciencies; vitamin C is synthesized by the cow in the liver and kidneys, most B-vitamins are synthesized by rumen and intestinal bacteria and there is a signifi cant amount of B-vitamins in feeds typically fed to dairy cows. Under certain conditions, however, the addition of the following water-soluble vitamins to dairy cow diets may result in health and/or performance improvements (Dairy NRC, 2001; Weiss, 2007).
Biotin: Research has shown a positive effect of biotin on hoof health and lameness when dairy cows are supplemented with 20 mg of biotin per day for two to six months. Increased milk yield (2-3 lb. per day) also has been observed in some studies.
Niacin: Niacin is involved in energy and fat metabolism and is therefore important for the production of milk and milk components. Supplementation at 12 g per day may slightly improve milk, protein and fat yield during early lactation. Feeding rumen unprotected niacin at 6-12 g per day appears to be ineffective in reducing ketosis. Niacin is extensively degraded in the rumen and, therefore, if niacin supplementation is considered, a rumen-protected source would likely be more benefi cial than an unprotected source.
Choline: Choline is rapidly degraded in the rumen if not encapsulated or protected from rumen microbial degradation. Rumen-protected choline has been shown to result in a fairly consistent positive milk yield response (about 5 lb. per day) when supplemented at approximately 30 g per day. Rumen-protected choline has also been supplemented in transition cow diets to decrease the incidence of fatty liver and ketosis, but results are less consistent.
Fat-soluble vitamins (A, D, E, K): Recommended dietary intake of fat-soluble vitamins for dry and lactating dairy cows is shown in Table 7. For cows housed in confi nement, dietary supplementation of vitamin A, D and E is recommended. As vitamin D is synthesized in the presence of sunlight, vitamin D supplementation may not be necessary when cows are primarily on pasture. Supplementing with vitamin K is not needed due to microbial synthesis of menaquionones (vitamin K2) and the concentration of phylloquinones (vitamin K1) in forages commonly fed to dairy cows.
Impact of minerals and vitamins on immunity. Many trace minerals and vitamins have important roles in maintaining a healthy immune system. For example, vitamin E, selenium and vitamin A serve as antioxidants, decreasing cellular damage from free radicals in the body. Copper and zinc are required components of superoxide dismutase, an enzyme that protects cells from reactive oxygen species formed by neutrophils in order to destroy pathogens.
Defi ciencies of micro minerals, therefore, may impair immune function and impact the cows’ ability to fi ght off diseases. This would be especially detrimental during the transition period or during periods of stress when the immune system is already compromised.
Micro mineral requirements to optimize immune function are not known. Researchers investigating the relationship between micro minerals and immune function of dairy cows have primarily focused on selenium, vitamin E, copper and zinc (Spears, 2000; Goff, 2008).
Selenium and vitamin E: Likely due to impaired neutrophil function, selenium or vitamin E defi ciency is associated with increased incidence of retained placenta and mastitis. Supplementing diets with 0.3 ppm selenium (the legal limit) is recommended. This is particularly important when forages are grown on selenium-defi cient soils. Fresh pasture is a good source of vitamin E. Cows in confi nement may benefi t from increasing dietary vitamin E concentrations to between 2,000 and 4,000 IU per day for three weeks before to three weeks after parturition.
Copper and zinc: Defi ciencies of copper and zinc not only decrease immune function but can reduce reproductive performance. Adequate quantities of these and other micro minerals should be fed during the dry period for placental transfer to the fetus and accumulation in the liver and other tissues to increase concentrations in colostrum and milk for the new born.
Growing heifers: 200-1,300 lb.Nutrient requirements of growing Holstein heifers at three ages are in Table 8; target weights are: fi rst breeding weight
48 Feedstuffs, September 10, 2008
Nutrition & Health [ Dietary allowances for dairy cattle ]
– 827 lb.; fi rst calving weight – 1,232 lb.; mature weight – 1,504 lb. All heifers are projected to calve at 24 months of age. Also shown in Table 8 is the effect of cold stress and a wet hair coat on the daily gain of 650 lb. heifers (12 months of age).
The data in Table 8 illustrate two common problems observed in heifer growth. First, heifers raised in a cold and wet environment often will not gain weight. The additional nutrients required in this kind of environment for maintenance surpass the nutrients available from the diet. Thus, heifers do not gain and often lose weight during
Ovsynch™, Co-Synch™, Pre-Synch™, Re-Synch™. Synchronization programs
can improve herd reproduction, but good body condition also plays a big part in
this delicate balance. Feeding Energy Booster 100 gives your cows the most
palatable, energy dense supplement available in a bypass fat. This extra boost
helps them reach positive energy balance sooner while improving body
condition more quickly after calving.
Energy Booster 100 already is recognized for increasing production of milk,
protein and butterfat. Combine those benefi ts with improved body condition,
which helps cows breed back faster, to keep every part of productivity running
smoothly. Feed Energy Booster 100 for improved production, body condition —
and reproduction. More energy, more results.
Learn how Energy Booster 100 can help keep the effectiveness
of your reproduction and synch programs in sync. Call MSC Specialty Nutrition at 1-800-323-5424 or visit www.msccompany.com/sn.
winter and spring months. Secondly, pregnant heifers have a low nutrient requirement compared to their DMI and, thus, it is easy to fatten pregnant heifers even on a relatively low-energy diet. Even feeding low amounts of corn silage, such as in Table 8, provides pregnant heifers with considerably more energy than required to meet target gains.
Young calves: birth to 200 lb.The nutrient requirements of the calf are divided into three phases corresponding to the changes and development of
the digestive tract:(1) Liquid feeding
phase, when all nutrient requirements are met by milk or milk replacer. Generally the fi rst three weeks of life.
(2) The transition phase, when the consumption of both liquid and starter contribute to meeting the nutrient requirements of the calf. This phase is generally from three to six weeks of age.
(3) The ruminant phase, when calves are consuming all solid feed and microbial fermentation in the rumen is contributing to meeting the nutrient requirements of the calf.
Energy and protein requirements of calves fed milk or milk replacer only, a combination of milk or milk replacer and starter and starter or starter feed only is shown in Table 9.
Effect of environment on calf energy requirement. The energy requirements provided in Table 9 are based on a calf being in a thermal neutral zone and not expending energy to dissipate heat or invoke energy conserving mechanisms to retain heat. The thermal neutral zone for calves varies depending on age and DMI. Calves less than three weeks of age have a thermal neutral zone of 59-77°F, whereas calves older than three weeks can tolerate temperatures down to about 15°F before heat conserving mechanisms are invoked. The increase in ME required for maintenance with increasing cold temperatures
September 10, 2008, Feedstuffs 49
Nutrition & Health [ Dietary allowances for dairy cattle ]
September 10, 2008, Feedstuffs 49
is shown in Table 10. For many calves housed outdoors during the winter, the
extended days at the lower end of critical temperatures will result in no gain or even weight loss; increased maintenance energy requirement depletes all of the consumed energy leaving no energy for growth. Feeding additional amounts of milk or milk replacer will help offset the increase in maintenance ME at lower temperatures, but at very low temperatures, calves can not consume enough energy to maintain their bodyweight.
SummaryWhen formulating diets for dairy cows, avoid over-feeding nutrients, especially those of environmental concern such as protein and phosphorus.
An accurate assessment of DMI is essential. Animals require an amount of nutrients and not concentration of nutrients in the ration.
In order to expand our knowledge of feeding dairy cows, interesting topics requiring further exploration include amino acid balancing and the interaction between nutrition and immunology.
ReferencesAllen, M.S. 1997. Relationship between fermentation acid production in the rumen and the requirement for physically effective fi ber. J. Dairy Sci. 80:1447-1462.
Beauchemin, K.A., B.I. Farr, L.M. Rode and G.B. Schaalje. 1994. Effects of alfalfa silage chop length and supplementary long hay on chewing and milk production of dairy cows. J. Dairy Sci. 77:1326-1339.
Beede, D.K. 2005. Formulation of rations with optimal cations and anions (DCAD) for lactation. Proc. Tri-State Dairy Nutr. Conference. p. 93-112.
Dann, H.M., K.W. Cotanch, P.D. Krawczel, C.S. Mooney, R.J. Grant and T. Eguchi. 2008. Evaluation of low starch diets for lactating Holstein dairy cattle. J. Dairy Sci. 91 (E-Suppl. 1):583.
Goff, J.P. 2006. Mineral problems facing the fresh cow. Proc. Four-State Dairy Nutrition and Management Conference, p. 95-104.
Goff, J.P. 2008. Transition cow immune function and interactions with metabolic disease. Tri-State Dairy Nutrition Conference. p. 45-57.
Grant, R.F., V.F. Colenbrander and D.R. Mertens. 1990. Milk fat depression in dairy cows: role of particle size of alfalfa hay. J. Dairy Sci. 73:1823-1833.
National Research Council. 2001. Nutrient Requirements of Dairy Cattle. 7th rev. ed. National Academy of Sciences. Washington, D.C.
Oba, M., and M.S. Allen. 1999. Evaluation of the importance of the digestibility of neutral detergent fi ber from forage: effects on dry matter intake and milk yield of dairy cows. J. Dairy Sci. 82:589-596.
Ranathunga, S.D., K.F. Kalscheur, A.R. Hippen and D.J. Schingoethe. 2008. Replacement of starch from corn with non-forage fi ber from distillers grains in diets of lactating dairy cows. J. Dairy Sci. 91 (E-Suppl. 1):585.
Schwab, C.G., and S.E. Boucher. 2007. Metabolizable protein and amino acid nutrition of the cow: Where are we in 2007? Proc. 68th Minnesota Nutrition Conf. p. 121-138.
Spears, J.W. 2000. Micronutrients and immune function in cattle. Proceedings of the Nutrition Conference Society. 59:587-594.
Waldron, M.R. 2007. Nutritional strategies to enhance immunity during the transition period of dairy cows. Florida Ruminant Nutrition Symposium.
Weiss, W.P. 2007. An Update on Vitamins for Dairy Cattle. Southeast Dairy Herd Management Conference Proceedings.
Linn is a professor of dairy nutrition with the department of animal science at the University of Minnesota.