nutrition hot topics...
TRANSCRIPT
Copyright © 2009-2010 School Nutrition Association. All Rights Reserved. www.schoolnutrition.org
NUTRITION HOT TOPICS
CONTROVERSIES:How to handle the tough questions and
separate facts from emotion
Keith-Thomas Ayoob, EdD, RD, FADA, CDN
Associate Clinical Professor of PediatricsAlbert Einstein College of Medicine
School Nutrition Association Annual Conference
July 14, 2010
Copyright © 2009-2010 School Nutrition Association. All Rights Reserved. www.schoolnutrition.org
4 examples of “risky” topics
• Food allergies
• Sugar
• Artificial colors
• Sugar substitutes
Copyright © 2009-2010 School Nutrition Association. All Rights Reserved. www.schoolnutrition.org
Common thoughts…
• “Change the menu, my kid is allergic”• Sugar is making kids
– Fat– Hyperactive– Diabetic
– High
Copyright © 2009-2010 School Nutrition Association. All Rights Reserved. www.schoolnutrition.org
More common thoughts…
• “Artificial colors make them hyperactive”• “Sugar substitutes…
– Cause brain tumors/cancer/liver problems”
– Turn into formaldehyde in your body”– Make you crave sweets”– “Just HAVE to be bad – I read it on the
Internet”
Copyright © 2009-2010 School Nutrition Association. All Rights Reserved. www.schoolnutrition.org
“OK, who doesn’t eat what?”
Food Allergies
Copyright © 2009-2010 School Nutrition Association. All Rights Reserved. www.schoolnutrition.org
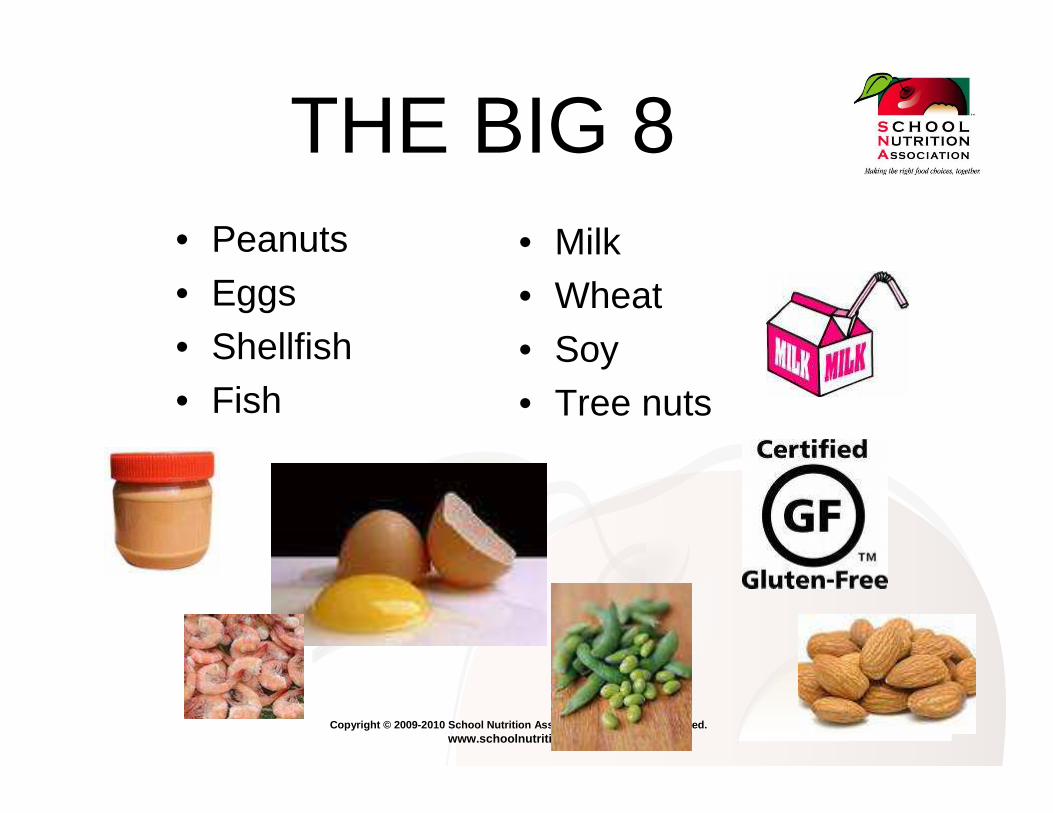
THE BIG 8• Peanuts
• Eggs• Shellfish
• Fish
• Milk • Wheat
• Soy• Tree nuts
Copyright © 2009-2010 School Nutrition Association. All Rights Reserved. www.schoolnutrition.org
THE BIG 8
• Account for 80% of allergies• Most kids outgrow food allergies• Most are NOT life-threatening
Copyright © 2009-2010 School Nutrition Association. All Rights Reserved. www.schoolnutrition.org
Problems with special diets:
• Labor intensive• Costly• May affect very few • Many varieties• Most not life-threatening
Copyright © 2009-2010 School Nutrition Association. All Rights Reserved. www.schoolnutrition.org
Special diets: Time to put our foot down?
• First it was allergies• Then peanut-free tables/schools/lives• Limits of reasonable responsibility• Budgets, budgets, budgets• Rethinking the purpose of school lunch
Copyright © 2009-2010 School Nutrition Association. All Rights Reserved. www.schoolnutrition.org
GO TO HILL!• Tell your legislators:
We do school lunch, not hospital lunch• Opt-out when below national average• Optional accommodation, based on
budget or other considerations• Rally against forcing schools to outlaw
allergic foods
Copyright © 2009-2010 School Nutrition Association. All Rights Reserved. www.schoolnutrition.org
A R T I F I C I A LC O L O R S
Copyright © 2009-2010 School Nutrition Association. All Rights Reserved. www.schoolnutrition.org
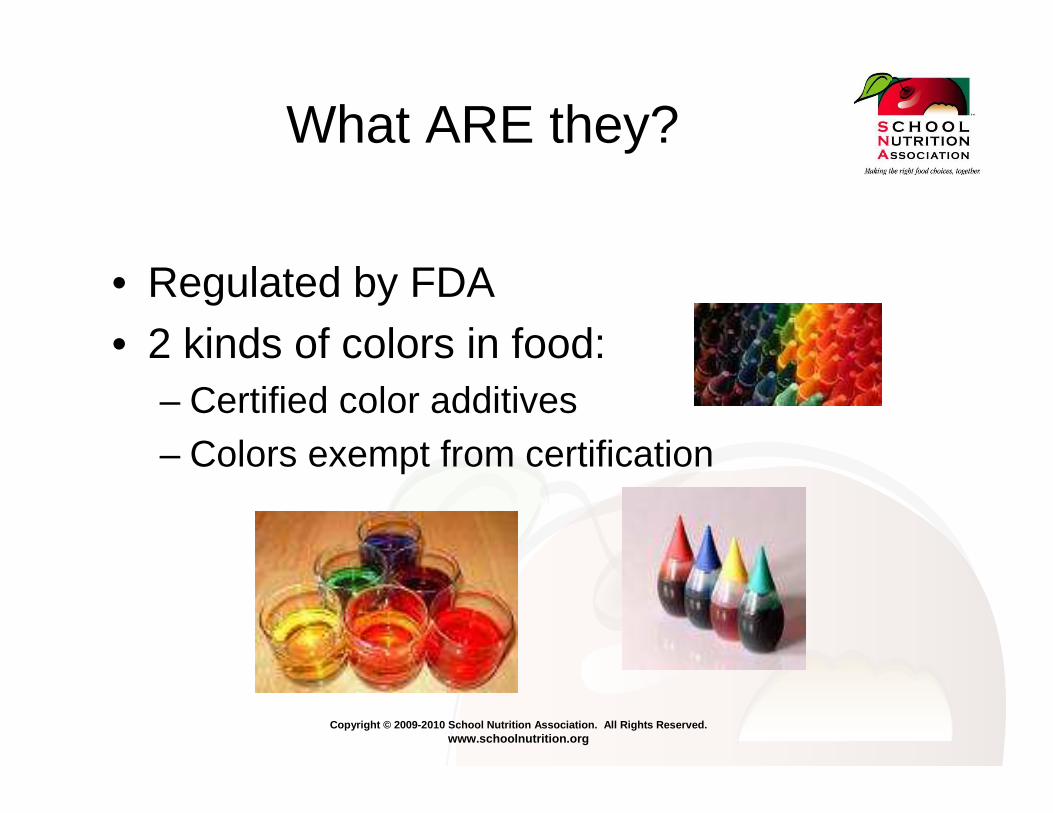
What ARE they?
• Regulated by FDA• 2 kinds of colors in food:
– Certified color additives– Colors exempt from certification
Copyright © 2009-2010 School Nutrition Association. All Rights Reserved. www.schoolnutrition.org
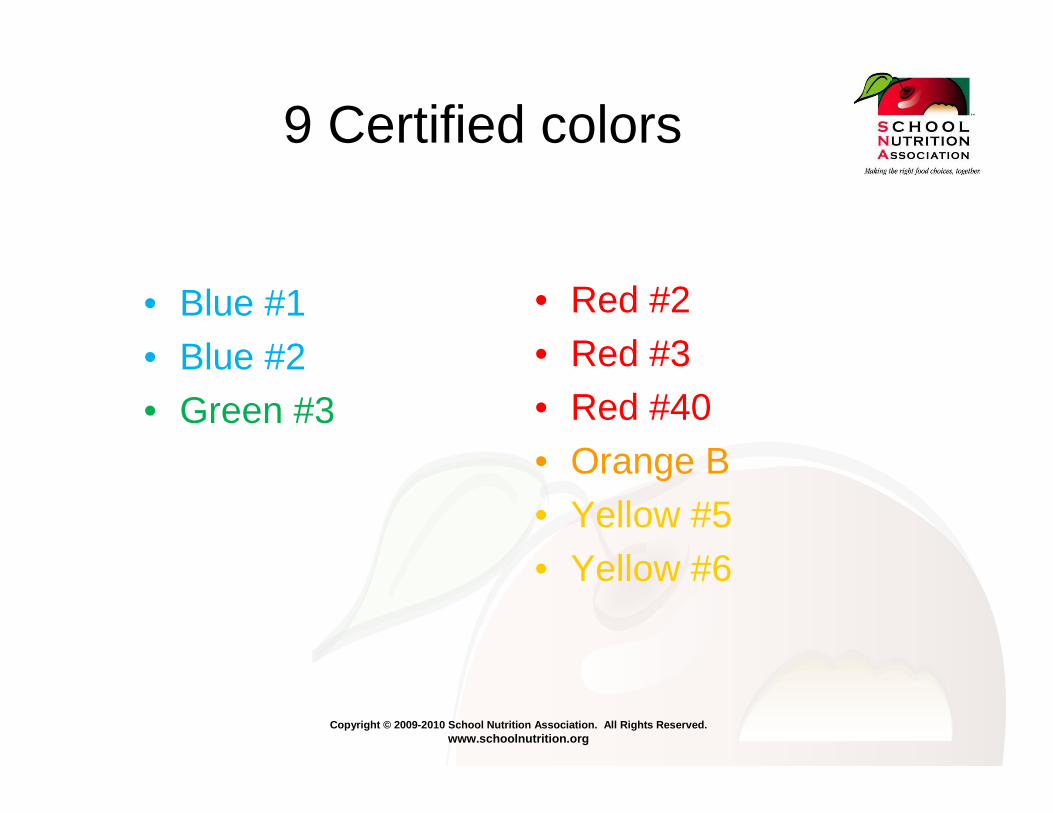
9 Certified colors
• Blue #1
• Blue #2• Green #3
• Red #2
• Red #3• Red #40
• Orange B• Yellow #5
• Yellow #6
Copyright © 2009-2010 School Nutrition Association. All Rights Reserved. www.schoolnutrition.org
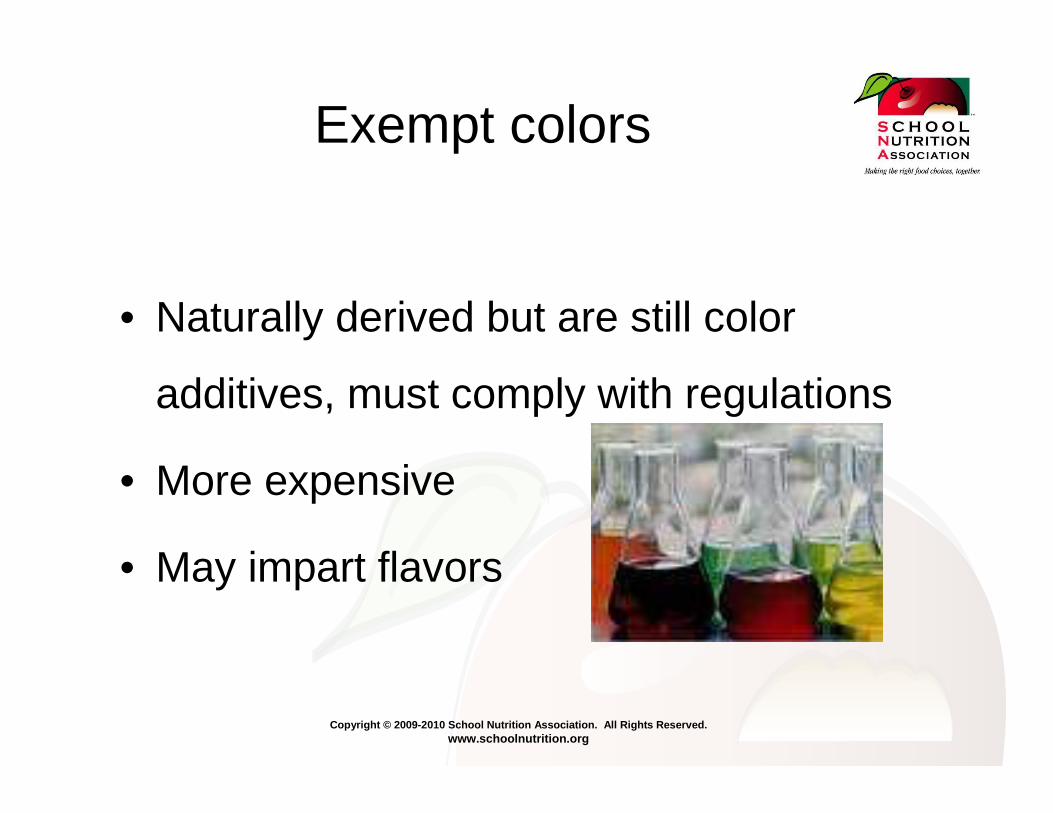
Exempt colors
• Naturally derived but are still color
additives, must comply with regulations
• More expensive
• May impart flavors
Copyright © 2009-2010 School Nutrition Association. All Rights Reserved. www.schoolnutrition.org
What are they doing in our food?
• Compensate for color losses• Maintain uniformity when colors naturally
vary• Enhance naturally occurring colors• Give color to colorless foods
Copyright © 2009-2010 School Nutrition Association. All Rights Reserved. www.schoolnutrition.org
THE BIG QUESTION:
DO COLORS IN FOOD CAUSE HYPERACTIVITY?

Copyright © 2009-2010 School Nutrition Association. All Rights Reserved. www.schoolnutrition.org
HISTORY
• Started with Feingold in the 1970s• Hyperactivity caused by:
– Salicylates
– Artificial flavors– Artificial colors
Feingold, BF Delaware Med J 1977
Copyright © 2009-2010 School Nutrition Association. All Rights Reserved. www.schoolnutrition.org
Feingold phenomenon
• Early studies were highly criticized:– Lack of controls– Small sample sizes– Anecdotal reports
– Inability to link specific colors with behavior– Inconsistent dosing
– poor methodology – lack of subjectivity
…however………..Feingold, BF Delaware Med J 1977

Copyright © 2009-2010 School Nutrition Association. All Rights Reserved. www.schoolnutrition.org
Review byShab & Trinh (2004)
• Meta-analysis• 15 DB-PC trials• Results:
– 5 studies: increased ADHD symptoms– 8 studies: no significant increases in ADHD
symptoms– 2 studies: DECREASED ADHD symptoms– Only 2 trials received the highest validity score of
“A”
Copyright © 2009-2010 School Nutrition Association. All Rights Reserved. www.schoolnutrition.org
Shab & Trinh (2004)
• 8 crossover studies• Some effect seen in previously diagnosed
hyperactive children BUT• Serious flaws in many studies
– 2 had no washout period– 3 had “unorthodox outcome measures”– None had a validity rating of “A”– One had imperfect blinding
Copyright © 2009-2010 School Nutrition Association. All Rights Reserved. www.schoolnutrition.org
Problems with studies on ACs and hyperactivity
• Who’s doing the ratings?• Does the test ask all the right questions?• Include/exclude children on medication?• Include/exclude non-hyperactive
children?• Include a washout period?
Copyright © 2009-2010 School Nutrition Association. All Rights Reserved. www.schoolnutrition.org
Bateman et al (2004)
• Randomized, DB-PC crossover trial • 277 4-year-olds• 20-mg of colors + 45 mg of sodium
benzoate• Ratings by parents AND teachers
Copyright © 2009-2010 School Nutrition Association. All Rights Reserved. www.schoolnutrition.org
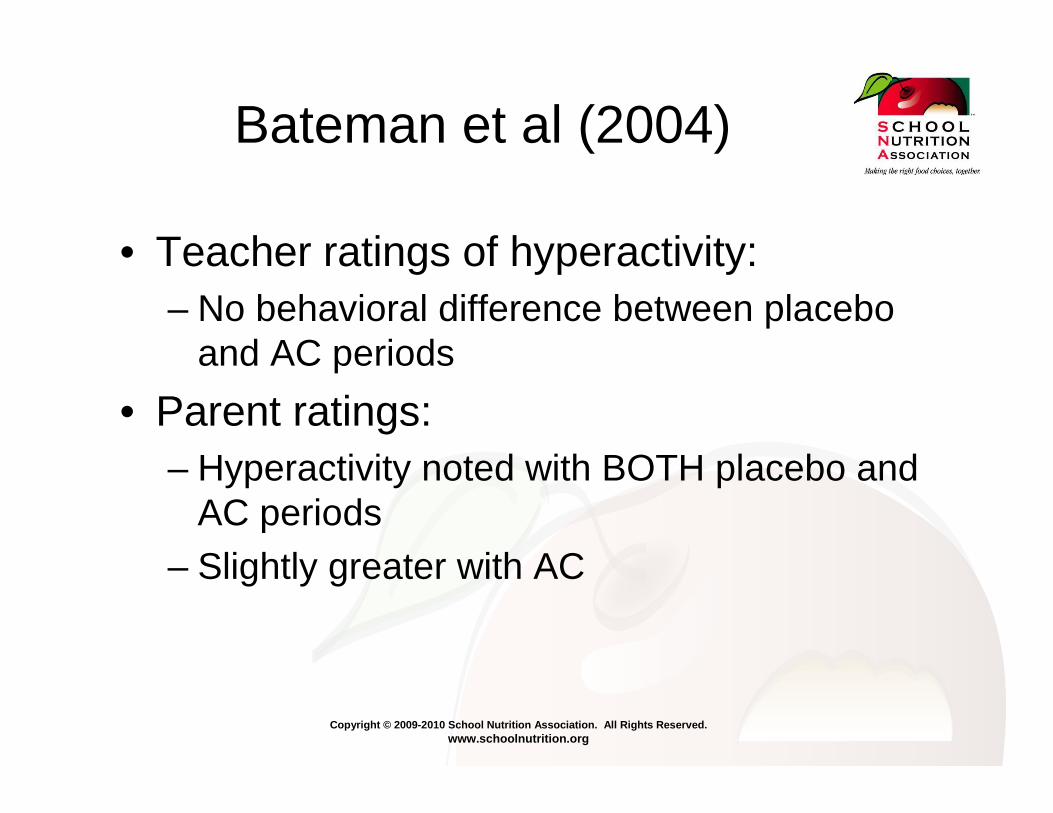
Bateman et al (2004)
• Teacher ratings of hyperactivity:– No behavioral difference between placebo
and AC periods
• Parent ratings:– Hyperactivity noted with BOTH placebo and
AC periods– Slightly greater with AC
Copyright © 2009-2010 School Nutrition Association. All Rights Reserved. www.schoolnutrition.org
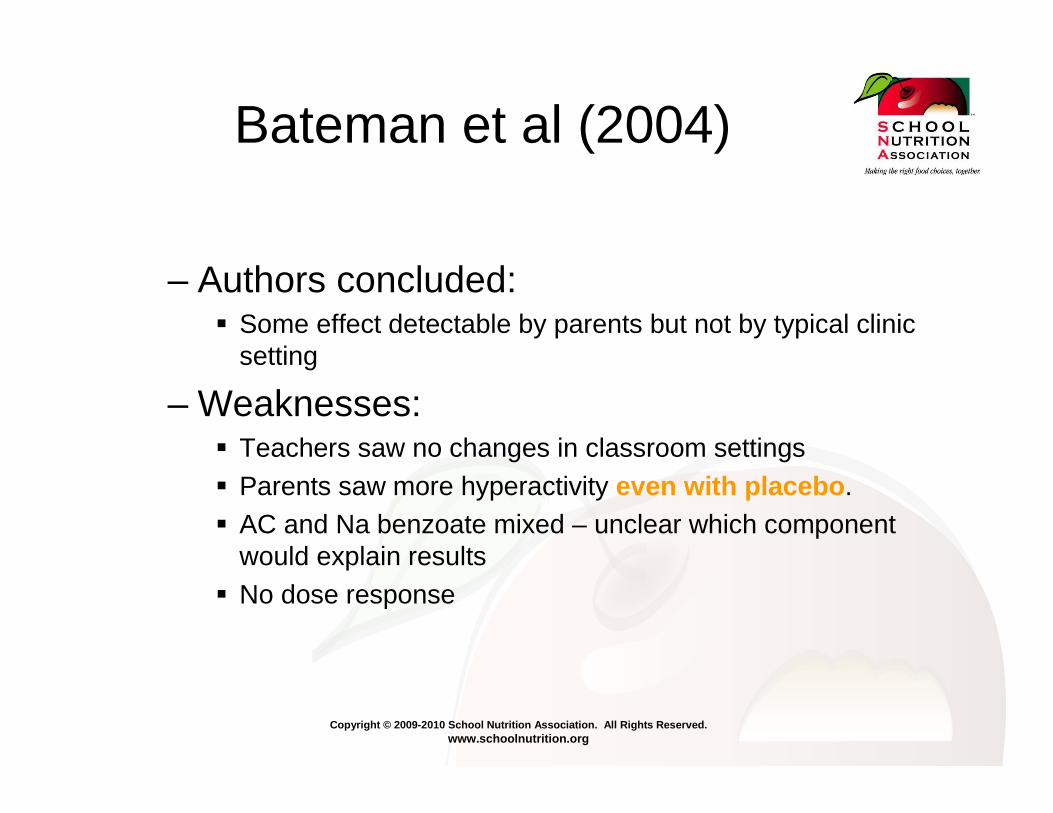
Bateman et al (2004)
– Authors concluded:� Some effect detectable by parents but not by typical clinic
setting
– Weaknesses:� Teachers saw no changes in classroom settings� Parents saw more hyperactivity even with placebo .� AC and Na benzoate mixed – unclear which component
would explain results� No dose response
Copyright © 2009-2010 School Nutrition Association. All Rights Reserved. www.schoolnutrition.org
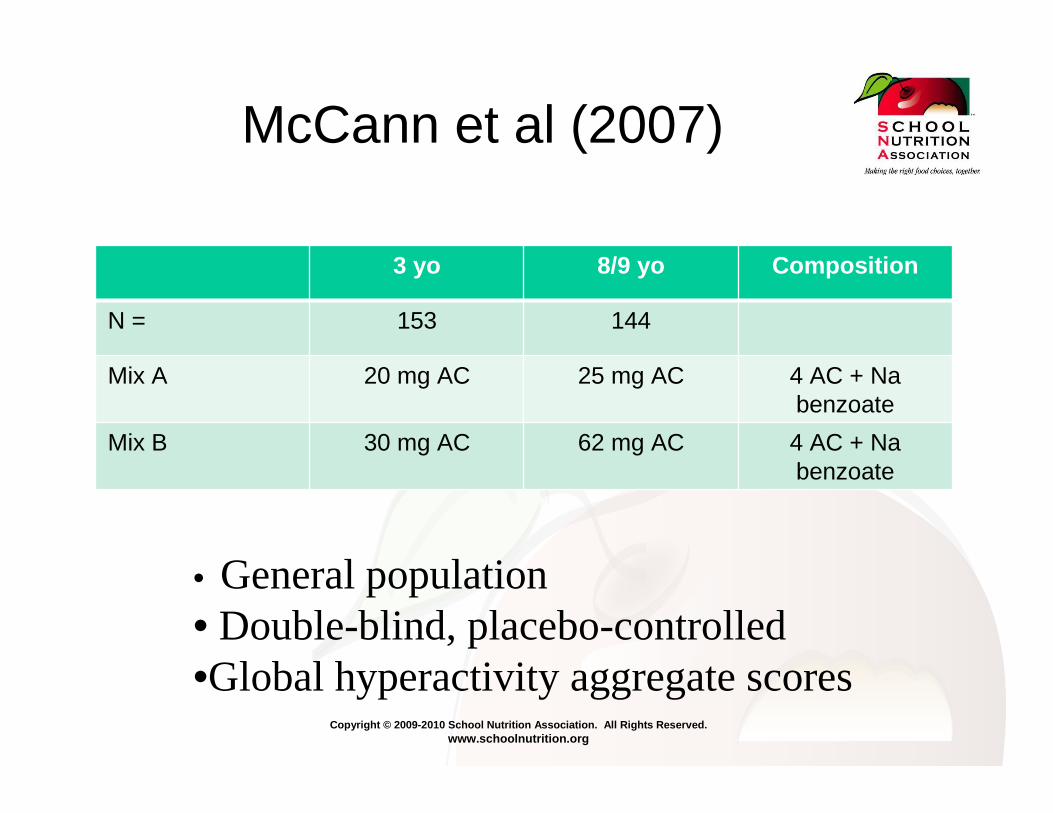
McCann et al (2007)
3 yo 8/9 yo Composition
N = 153 144
Mix A 20 mg AC 25 mg AC 4 AC + Na benzoate
Mix B 30 mg AC 62 mg AC 4 AC + Na benzoate
• General population• Double-blind, placebo-controlled•Global hyperactivity aggregate scores
Copyright © 2009-2010 School Nutrition Association. All Rights Reserved. www.schoolnutrition.org
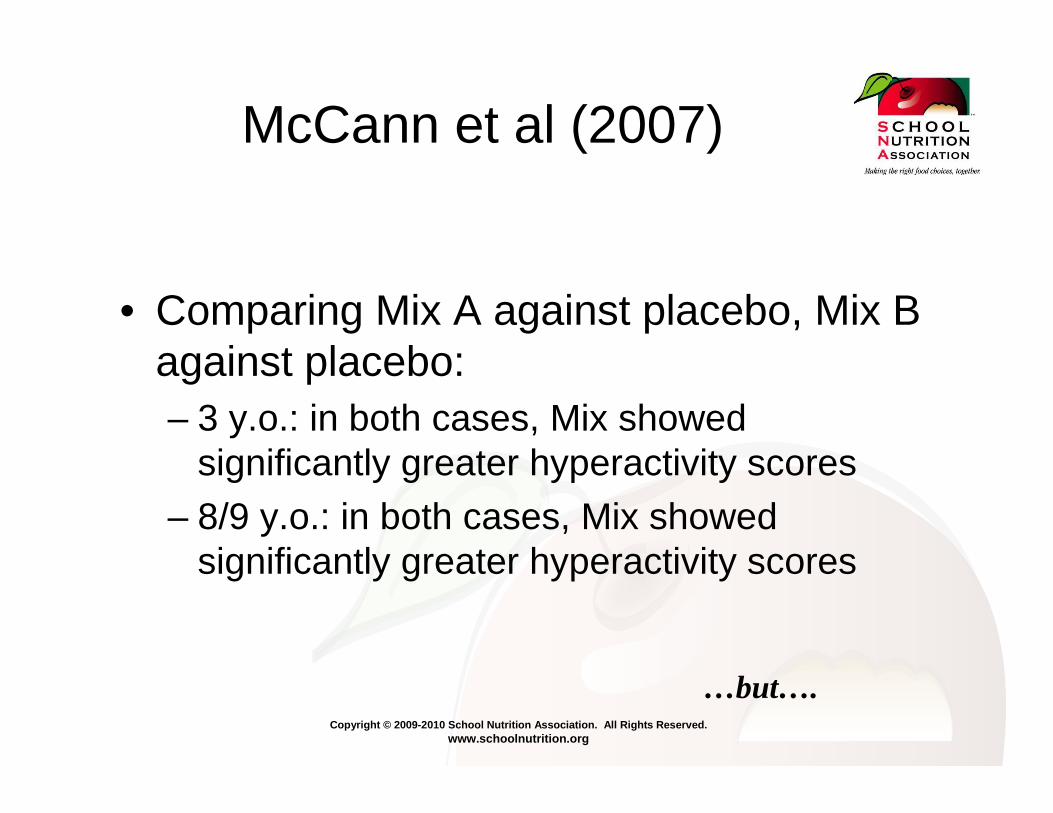
McCann et al (2007)
• Comparing Mix A against placebo, Mix B against placebo:– 3 y.o.: in both cases, Mix showed
significantly greater hyperactivity scores
– 8/9 y.o.: in both cases, Mix showed significantly greater hyperactivity scores
…but….
Copyright © 2009-2010 School Nutrition Association. All Rights Reserved. www.schoolnutrition.org
McCann et al (2007)
• When adjusted for: – Week during trial– Sex
– Maternal education– SES
– GHA in baseline week– Pretrial diet………
Copyright © 2009-2010 School Nutrition Association. All Rights Reserved. www.schoolnutrition.org
McCann et al (2007)
• Effect in 8/9 y.o., was significant only at highest dose (Mix B)
• Effect in 3 y.o. was significant only at the lower dose (Mix A).
Copyright © 2009-2010 School Nutrition Association. All Rights Reserved. www.schoolnutrition.org
McCann et al (2007)
Among authors’ conclusions:
“…substantial individual differences in the response of children to the additives.”
Copyright © 2009-2010 School Nutrition Association. All Rights Reserved. www.schoolnutrition.org
Conclusions of EFSA panel
• Mixes make it impossible to know effects/lack thereof of individual colors
• Inconsistency in results re: age, sex, type of observer
www.efsa.europa.eu
Copyright © 2009-2010 School Nutrition Association. All Rights Reserved. www.schoolnutrition.org
Conclusions of EFSA panel
• “…the study provides limited evidence that the two mixtures had a small and statistically significant effect on activity and attention.”
• They also concluded that the McCann study did not provide an acceptable basis for altering the ADI for colors.
EFSA Journal, 2008
Copyright © 2009-2010 School Nutrition Association. All Rights Reserved. www.schoolnutrition.org
Guidance
• Perceived or real, some subset of children may be especially sensitive or high-responders to ACs
• Look at quantity/frequency– 4 oz. of candy for a 3-year-old and– 8 oz. of candy for an 8-y.o. is EXCESSIVE
– Smaller amounts may matter little or none
• Assess context, setting, situation
Copyright © 2009-2010 School Nutrition Association. All Rights Reserved. www.schoolnutrition.org
Guidance
• Most ACs appear in “treat” foods & soda.• Focus on limiting treats
– and intake of ACs will decline
– Diet quality may improve
• Only applies to Certified colors – exempt colors are not implicated
Copyright © 2009-2010 School Nutrition Association. All Rights Reserved. www.schoolnutrition.org
SUGARSUGARSUGAR
Copyright © 2009-2010 School Nutrition Association. All Rights Reserved. www.schoolnutrition.org
The buzz
• Sugar gets kids hyperactive• Sugar makes kids overweight• HFCS: The new trans fat. It gives you
diabetes, metabolic syndrome, etc.• Fructose causes high blood pressure.
Copyright © 2009-2010 School Nutrition Association. All Rights Reserved. www.schoolnutrition.org
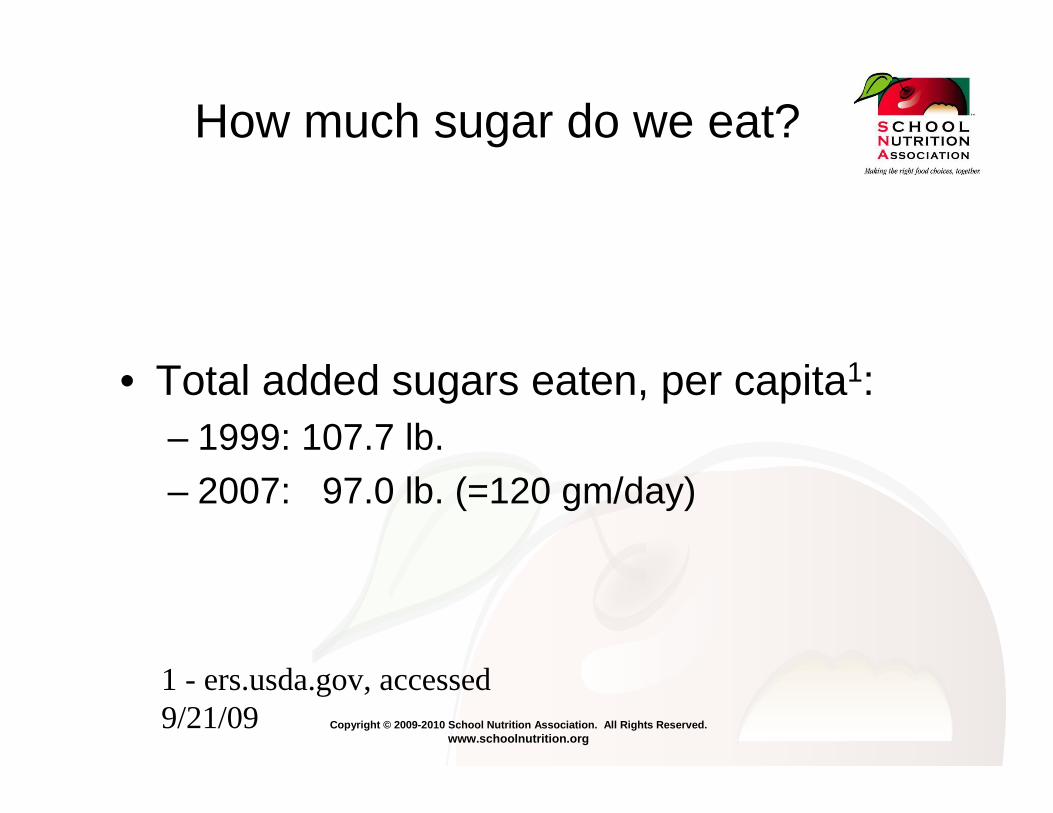
How much sugar do we eat?
• Total added sugars eaten, per capita1:– 1999: 107.7 lb.– 2007: 97.0 lb. (=120 gm/day)
1 - ers.usda.gov, accessed 9/21/09
Copyright © 2009-2010 School Nutrition Association. All Rights Reserved. www.schoolnutrition.org
NHANES 2001-02
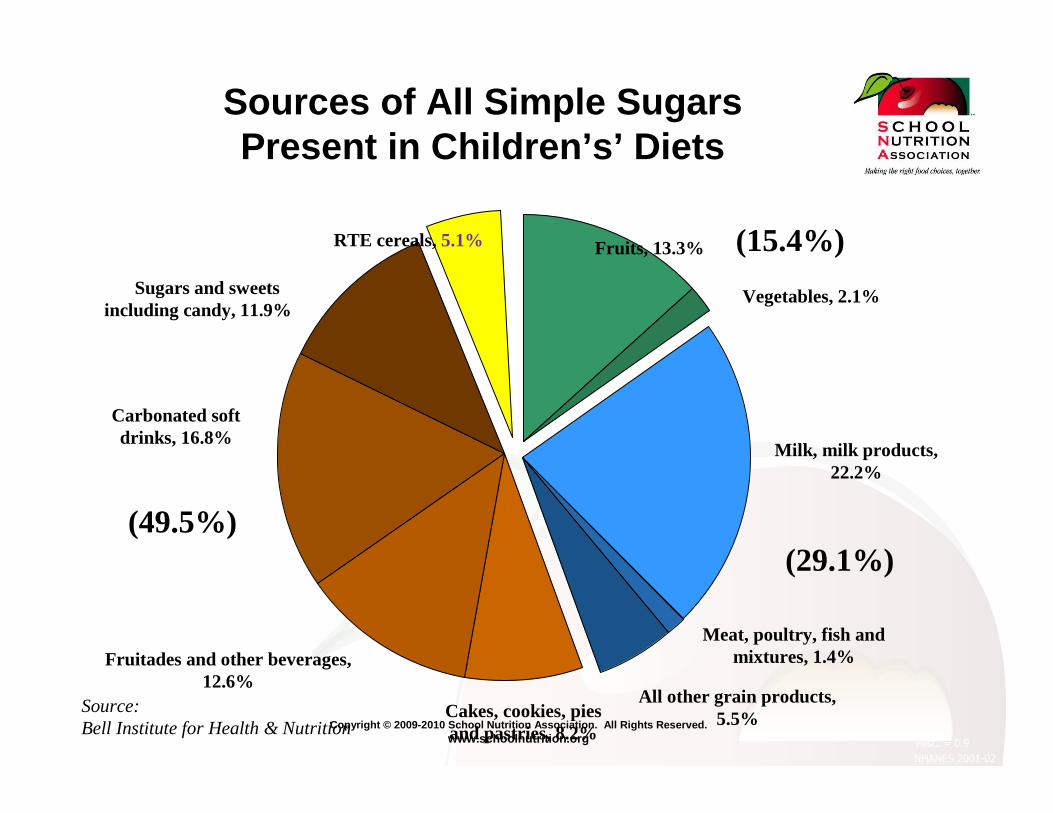
Sources of All Simple Sugars Present in Children’s’ Diets
Fruits, 13.3%
Vegetables, 2.1%
(15.4%)
Milk, milk products,22.2%
Meat, poultry, fish andmixtures, 1.4%
All other grain products,5.5%
(29.1%)
Cakes, cookies, piesand pastries, 8.2%
Sugars and sweetsincluding candy, 11.9%%
Carbonated softdrinks, 16.8%
Fruitades and other beverages,12.6%
(49.5%)
RTE cereals, 5.1%
Misc. = 0.9
Source:Bell Institute for Health & Nutrition
Copyright © 2009-2010 School Nutrition Association. All Rights Reserved. www.schoolnutrition.org
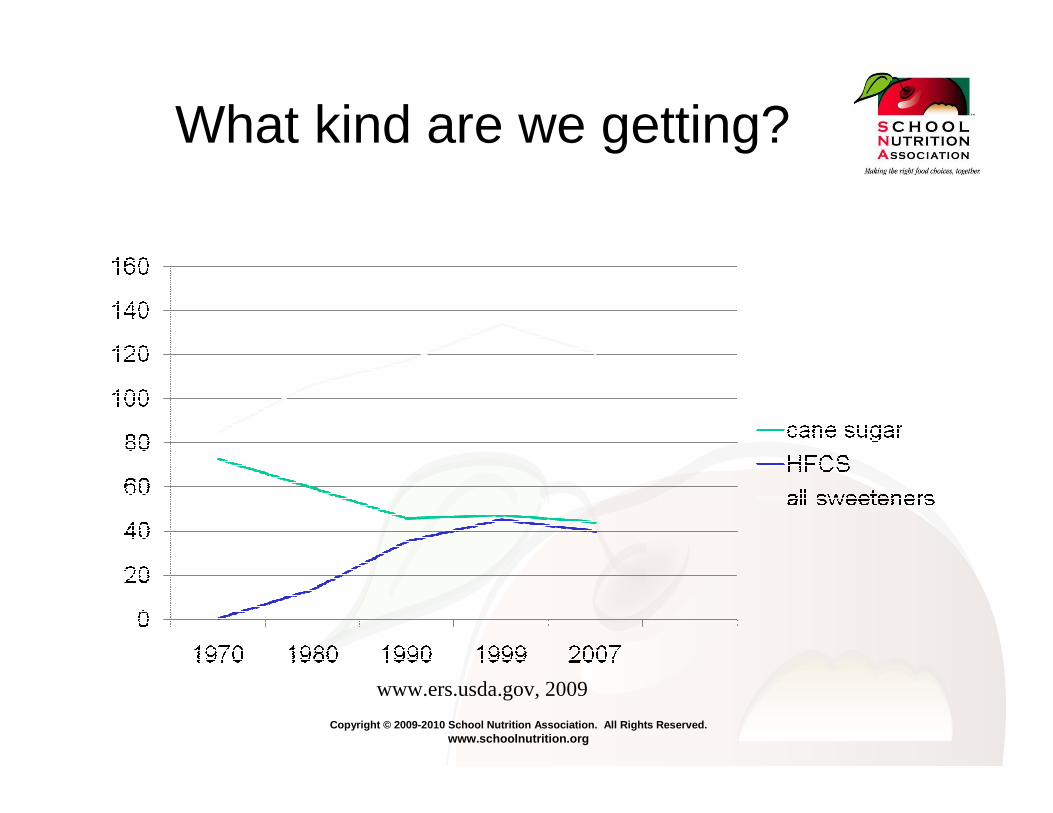
What kind are we getting?
www.ers.usda.gov, 2009
Copyright © 2009-2010 School Nutrition Association. All Rights Reserved. www.schoolnutrition.org
HFCS: the evil of the moment
• 2 basic kinds: – HFCS 42: 42% fructose
– HFCS 55: 55% fructose
• Cane sugar (sucrose): – 50% fructose
• Take-away message: HFCS is really not high in fructose
Copyright © 2009-2010 School Nutrition Association. All Rights Reserved. www.schoolnutrition.org
What IS high in fructose:
• Apple juice: – 65% fructose, 35% glucose
• Pear juice: – 74% fructose, 26% glucose
Copyright © 2009-2010 School Nutrition Association. All Rights Reserved. www.schoolnutrition.org
Sugar, HFCS, and obesity?
• Evidence suggests otherwise
• IOM report (2002):– Higher intakes of sugar are
associated with lower rates of obesity
– “No clear and consistent association between increased intake of added sugars and BMI.”
Copyright © 2009-2010 School Nutrition Association. All Rights Reserved. www.schoolnutrition.org
Sugar & HFCS and obesity -- NOT
• Inverse relationship found between sugar intake and bodyweight or BMI:– Saris (2003)– Hill & Prentice (1995)
• Inverse relationship between total sugar intake and total fat intake:– Gibson (1996)

Copyright © 2009-2010 School Nutrition Association. All Rights Reserved. www.schoolnutrition.org
Sucrose and weight loss, satiety
• 42 women – two groups – All on low-fat, low calorie diets
– 1 group consumed 43% of energy as sugar
• Result: – No differences in weight loss, mood, hunger,
stress level– Equal decreases in BP, %BF, plasma lipids
Surwit, AJCN 1997
Copyright © 2009-2010 School Nutrition Association. All Rights Reserved. www.schoolnutrition.org
Sugar & hyperactivity: How the rumors started
• Case study of 1 child by Crook (1974)– Sugar was removed, behavior improved
• Controlled studies unable to replicate results
Copyright © 2009-2010 School Nutrition Association. All Rights Reserved. www.schoolnutrition.org
Sugar and behavior
• Negative associations generally dismissed by the scientific community1
• Perception of sugar by parents and consumers continues to defy years of sound science and logic.
• Some evidence that behavior is positively affected by sugar.
1 – IOM, Dietary carb, 2002
Copyright © 2009-2010 School Nutrition Association. All Rights Reserved. www.schoolnutrition.org
Meta-analysis by Wolraich, et al (1995)
• 23 studies– Double blinded, placebo-controlled– Known quantity of sugar– Reported statistics useful for computing
dependent measures

Copyright © 2009-2010 School Nutrition Association. All Rights Reserved. www.schoolnutrition.org
Meta-analysis by Wolraich, et al (1995)
• Conclusion:– “Sugar does not affect the behavior or
cognitive performance of children. The strong belief of parents may be due to expectancy and common association.”
In fact…….
Copyright © 2009-2010 School Nutrition Association. All Rights Reserved. www.schoolnutrition.org
Sugar can even IMPROVE behavior and performance
• Decrease in activity after sucrose1 or glucose2
• Sugar-containing snack can enhance ability to stay on task3
• Glucose enhances long-term verbal and spatial memory4
1 – Behar et al (1994); 2- Saravis et al (1990)3 – Busch et al (2002); 4- Sunram-Lea et al (2001)
But….
Copyright © 2009-2010 School Nutrition Association. All Rights Reserved. www.schoolnutrition.org
How much is too much?
• 2005 DGA allow for added sugars and fats
• Discretionary calories include BOTH sugar and fat and assume that both are consumed
Dietary Guidelines for Americans 2005
Copyright © 2009-2010 School Nutrition Association. All Rights Reserved. www.schoolnutrition.org
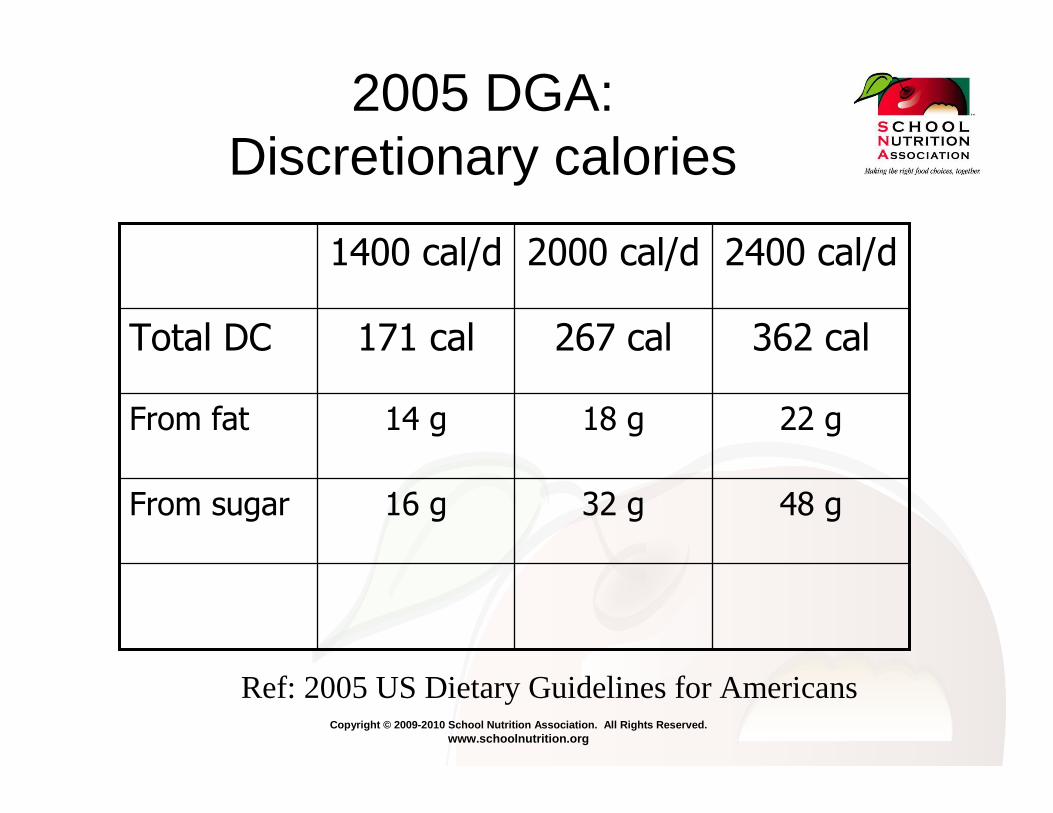
2005 DGA:Discretionary calories
1400 cal/d 2000 cal/d 2400 cal/d
Total DC 171 cal 267 cal 362 cal
From fat 14 g 18 g 22 g
From sugar 16 g 32 g 48 g
Ref: 2005 US Dietary Guidelines for Americans
Copyright © 2009-2010 School Nutrition Association. All Rights Reserved. www.schoolnutrition.org
The sugar shake-down
• Sugar’s not “angel food” but it’s not “devil’s food” either
• It does NOT get kids “hyper”– More likely to be situational
• Not a matter of “good” or “bad” but “how much” and “how often”
Copyright © 2009-2010 School Nutrition Association. All Rights Reserved. www.schoolnutrition.org
Recommendations
• Spend wisely• Quantity matters,
frequency matters• Type of sugar doesn’t
matter• Most kids need to reduce
their added sugar intake• WON’T make kids
hyperactive!Dietary Guidelines for Americans 2005

Copyright © 2009-2010 School Nutrition Association. All Rights Reserved. www.schoolnutrition.org
AAP Policy Statement: Prevention of pediatric overweight & obesity
“Dietary practices should be fostered that encourage moderation rather than overconsumption, emphasizing healthful choices rather than restrictive eating patterns.”
Copyright © 2009-2010 School Nutrition Association. All Rights Reserved. www.schoolnutrition.org
AAP Policy Statement: Soft drinks in schools
• Each 12-oz sugared soft drink consumed daily has been associated with a 0.18-point increase in a child’s BMI and a 60% increase in risk of obesity, associations not found with "diet" (sugar-free) soft drinks. Sugar-free soft drinks constitute only 14% of the adolescent soft drink market.
American Academy of Pediatrics, 2004
Copyright © 2009-2010 School Nutrition Association. All Rights Reserved. www.schoolnutrition.org
BOTTOM LINE
• Sugar’s OK• Not too much• Mostly fruit
Copyright © 2009-2010 School Nutrition Association. All Rights Reserved. www.schoolnutrition.org
Copyright © 2009-2010 School Nutrition Association. All Rights Reserved. www.schoolnutrition.org
Copyright © 2009-2010 School Nutrition Association. All Rights Reserved. www.schoolnutrition.org
Copyright © 2009-2010 School Nutrition Association. All Rights Reserved. www.schoolnutrition.org
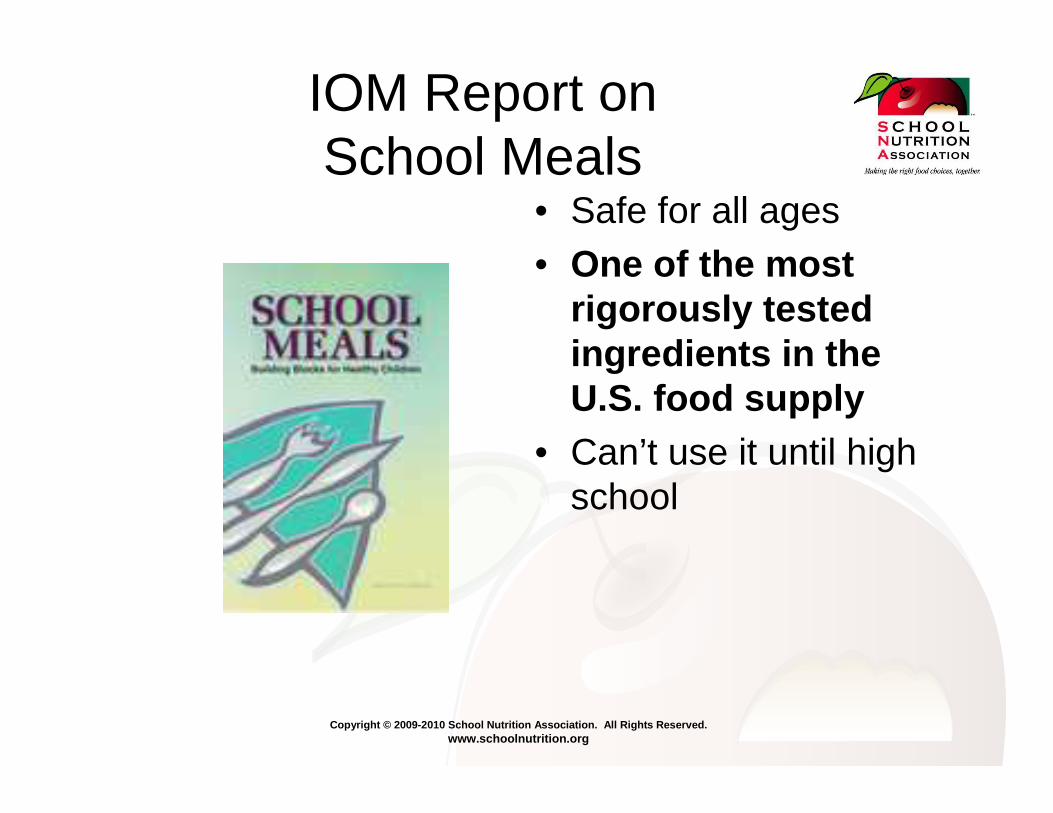
IOM Report on School Meals
• Safe for all ages• One of the most
rigorously tested ingredients in the U.S. food supply
• Can’t use it until high school
Copyright © 2009-2010 School Nutrition Association. All Rights Reserved. www.schoolnutrition.org
Non-nutritive Sweeteners: Acceptable Daily Intake (ADI)
• ADI: weight of sweetener/kg bw that a person can safely consume every day over a lifetime without risk
• ADI is a conservative estimate:– Approximately1/100 of maximum level that
produces no adverse effects

Copyright © 2009-2010 School Nutrition Association. All Rights Reserved. www.schoolnutrition.org
Acceptable Daily Intake (ADI):What does this mean to consumers?
SweetenerADI
Mg/kg body wt/day
ADI Equivalent150 lb person
Saccharin 15 mg8.5 packets of sweetener
Aspartame 50 mg20 cans of diet soda, OR almost 100 Equal packets
Acesulfame K 15 mg 20 cans of diet soda
Sucralose 5 mg 28 Splenda packets
Copyright © 2009-2010 School Nutrition Association. All Rights Reserved. www.schoolnutrition.org
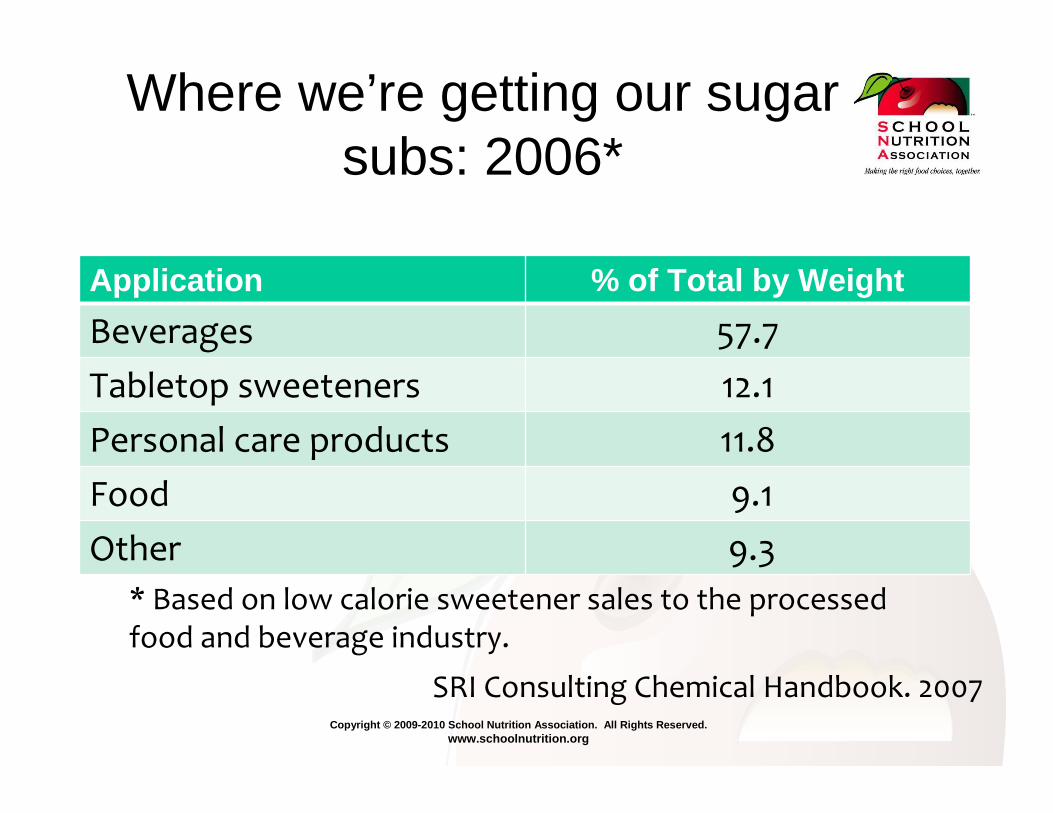
Where we’re getting our sugar subs: 2006*
Application % of Total by Weight
Beverages 57.7
Tabletop sweeteners 12.1
Personal care products 11.8
Food 9.1
Other 9.3
* Based on low calorie sweetener sales to the processed food and beverage industry.
SRI Consulting Chemical Handbook. 2007
Copyright © 2009-2010 School Nutrition Association. All Rights Reserved. www.schoolnutrition.org
Aspartame: Product History
• Approved in 1981• 180-200 times sweeter than sucrose• In more than 6,000 products and is
consumed by over 200 million people globally, including:
• One of the most rigorously tested ingredients in the U.S. food supply
www.aboutaspartame.com
Copyright © 2009-2010 School Nutrition Association. All Rights Reserved. www.schoolnutrition.org
Aspartame: Metabolism & Excretion
• Aspartame is metabolized to 3 (and ONLY 3) common dietary components:– Aspartic acid– Phenylalanine – Methanol
• Absorption and metabolism of constituents the same whether derived from aspartame or other food products*
*Stegink et al. The Clinical Evaluation of a Food Additive. New York, NY. CRC Press; 1996.
Copyright © 2009-2010 School Nutrition Association. All Rights Reserved. www.schoolnutrition.org
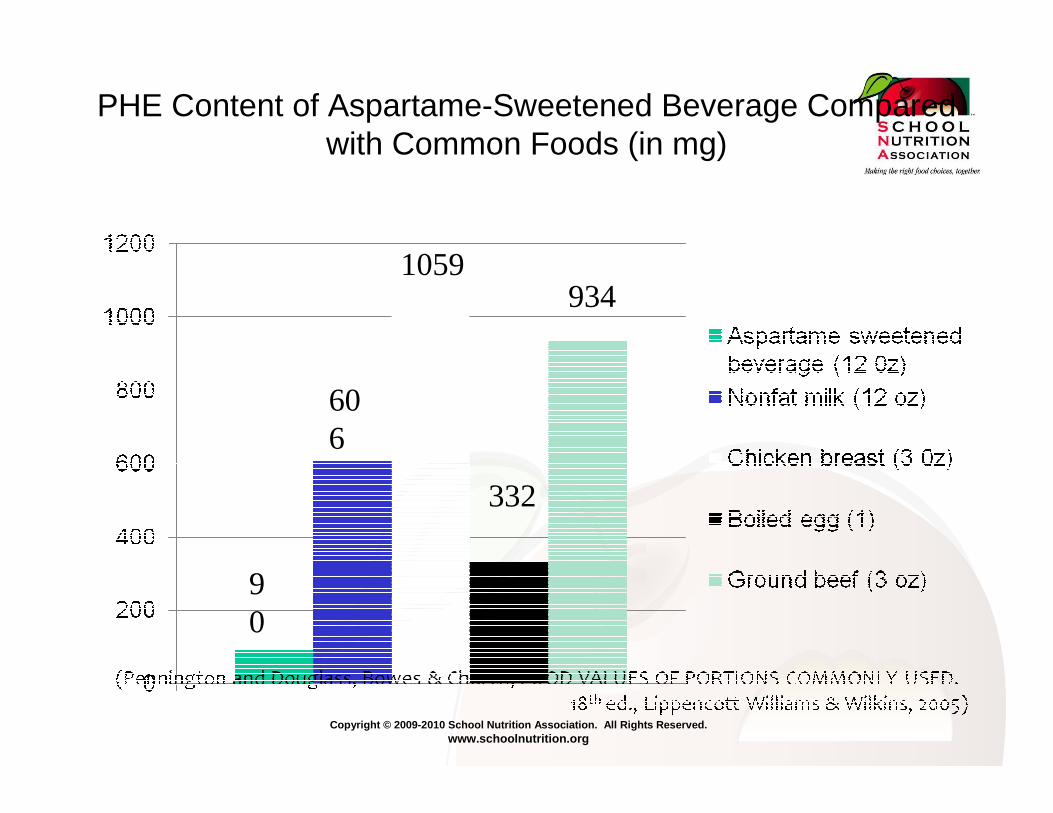
PHE Content of Aspartame-Sweetened Beverage Compared with Common Foods (in mg)
90
606
1059
332
934
Copyright © 2009-2010 School Nutrition Association. All Rights Reserved. www.schoolnutrition.org
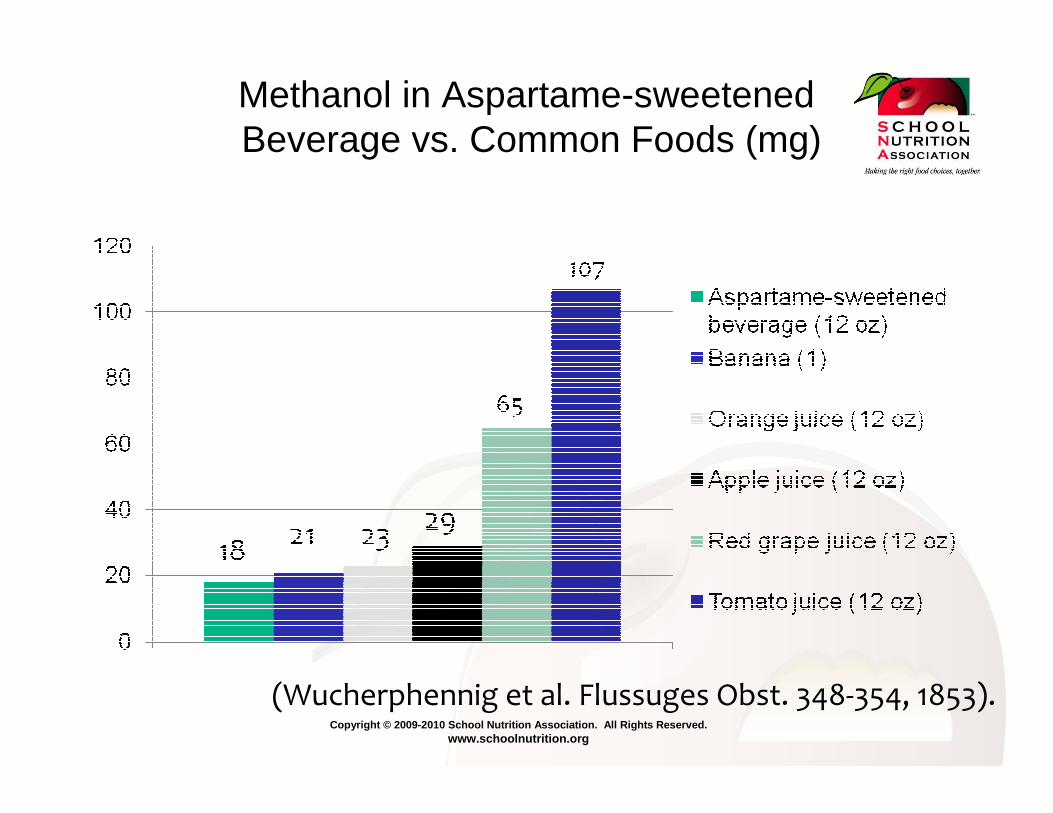
Methanol in Aspartame-sweetenedBeverage vs. Common Foods (mg)
(Wucherphennig et al. Flussuges Obst. 348-354, 1853).
Copyright © 2009-2010 School Nutrition Association. All Rights Reserved. www.schoolnutrition.org
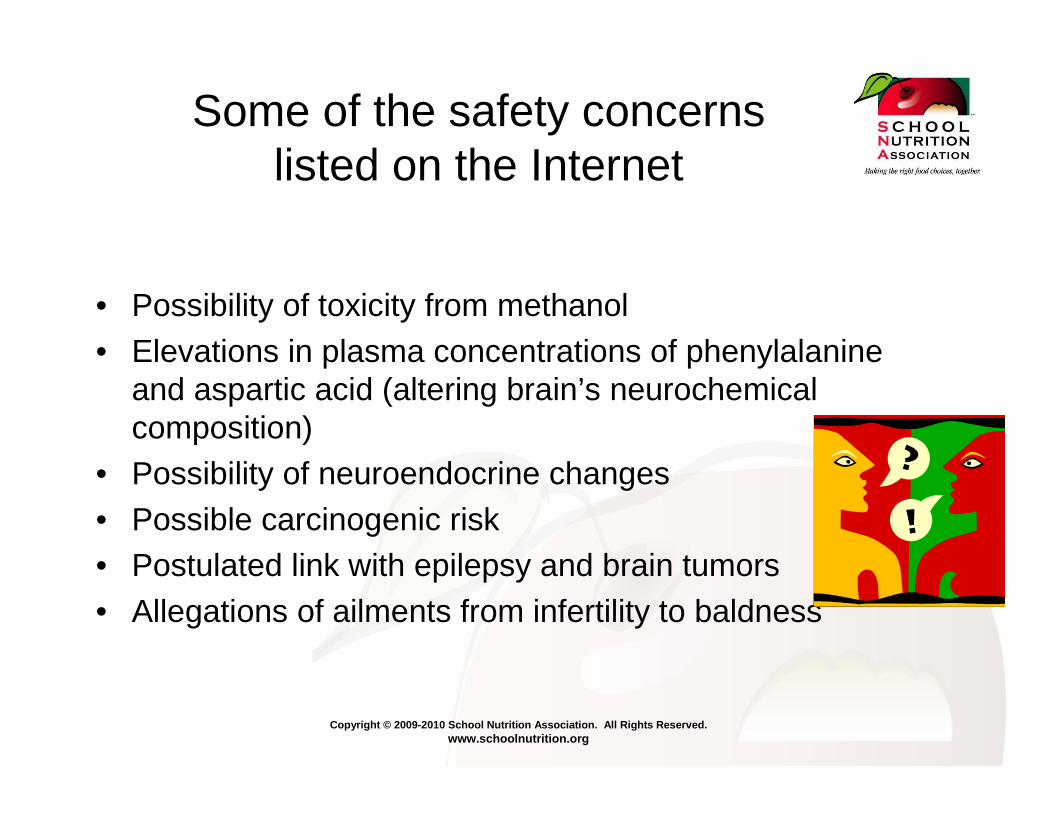
Some of the safety concerns listed on the Internet
• Possibility of toxicity from methanol• Elevations in plasma concentrations of phenylalanine
and aspartic acid (altering brain’s neurochemical composition)
• Possibility of neuroendocrine changes• Possible carcinogenic risk• Postulated link with epilepsy and brain tumors• Allegations of ailments from infertility to baldness
Copyright © 2009-2010 School Nutrition Association. All Rights Reserved. www.schoolnutrition.org
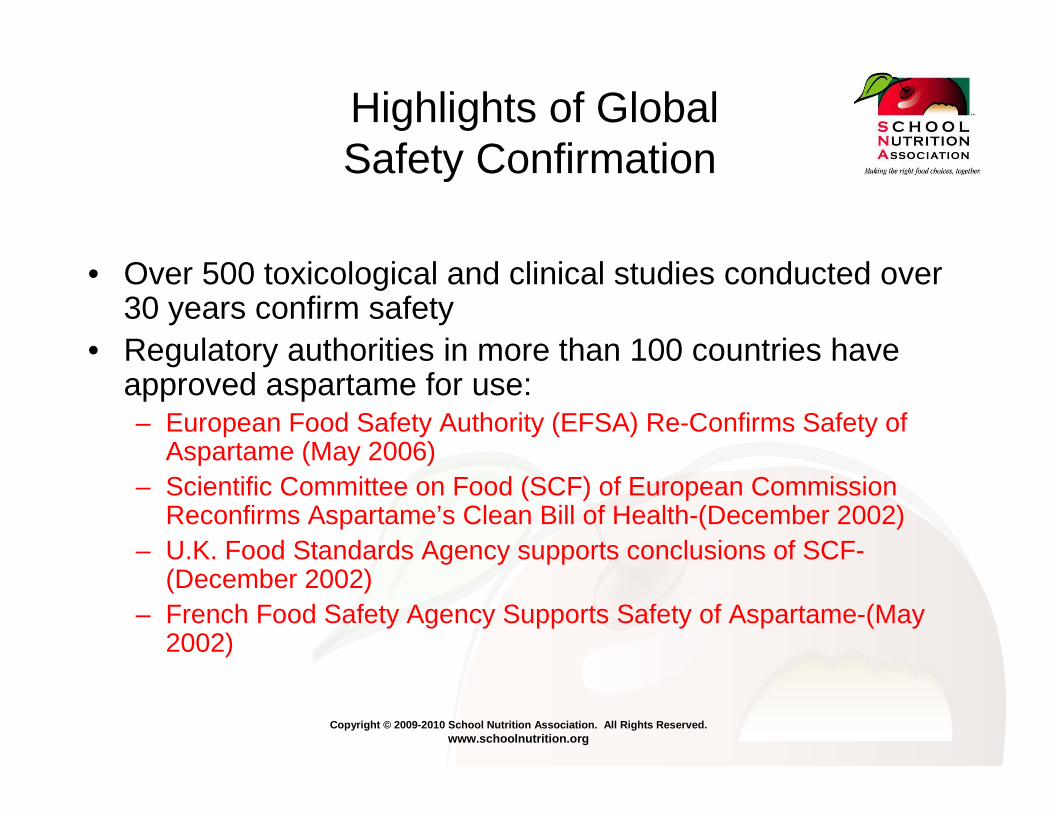
Highlights of GlobalSafety Confirmation
• Over 500 toxicological and clinical studies conducted over 30 years confirm safety
• Regulatory authorities in more than 100 countries have approved aspartame for use:– European Food Safety Authority (EFSA) Re-Confirms Safety of
Aspartame (May 2006)– Scientific Committee on Food (SCF) of European Commission
Reconfirms Aspartame’s Clean Bill of Health-(December 2002)– U.K. Food Standards Agency supports conclusions of SCF-
(December 2002)– French Food Safety Agency Supports Safety of Aspartame-(May
2002)
Copyright © 2009-2010 School Nutrition Association. All Rights Reserved. www.schoolnutrition.org
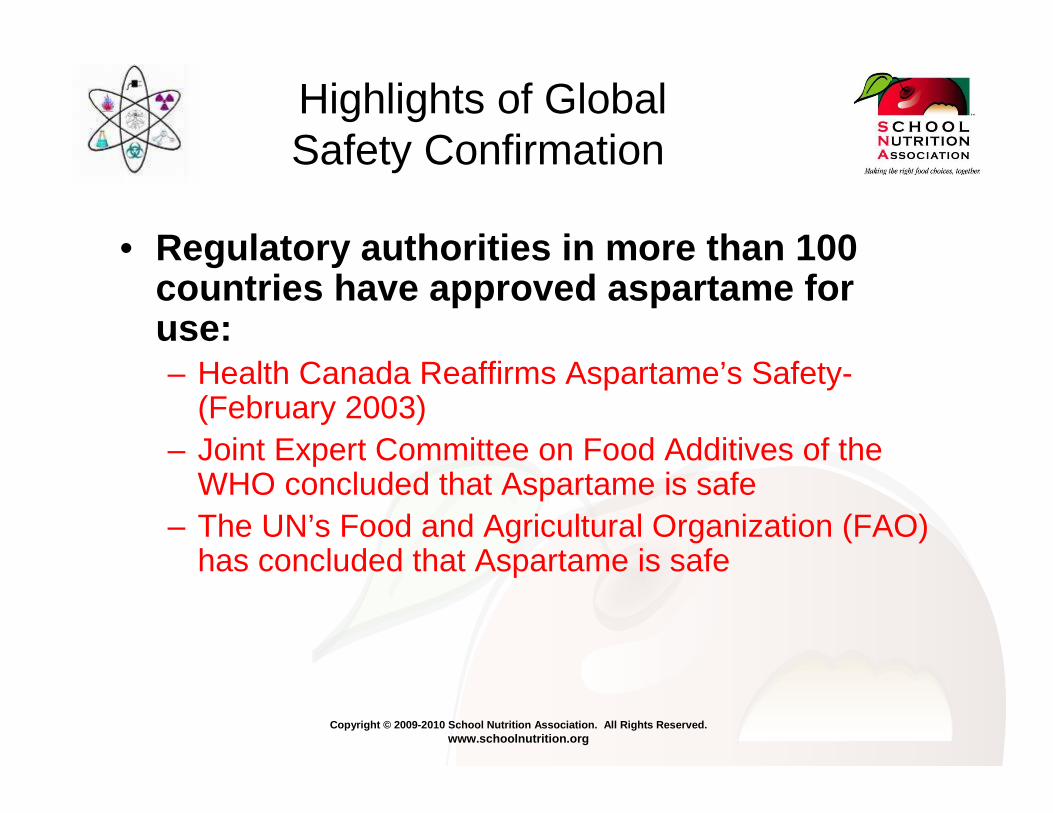
Highlights of GlobalSafety Confirmation
• Regulatory authorities in more than 100 countries have approved aspartame for use:– Health Canada Reaffirms Aspartame’s Safety-
(February 2003)– Joint Expert Committee on Food Additives of the
WHO concluded that Aspartame is safe– The UN’s Food and Agricultural Organization (FAO)
has concluded that Aspartame is safe
Copyright © 2009-2010 School Nutrition Association. All Rights Reserved. www.schoolnutrition.org
Safety Confirmation: USA
• American Diabetes Association• American Dental Association
• ADA Position Paper, “Use of Nutritive and Non-Nutritive Sweeteners”
• American Medical Association Council on Scientific Affairs
• American Academy of Pediatrics, Committee on Nutrition
• American Cancer Society
Copyright © 2009-2010 School Nutrition Association. All Rights Reserved. www.schoolnutrition.org
Assessed Across Many Subgroups
Copyright © 2009-2010 School Nutrition Association. All Rights Reserved. www.schoolnutrition.org
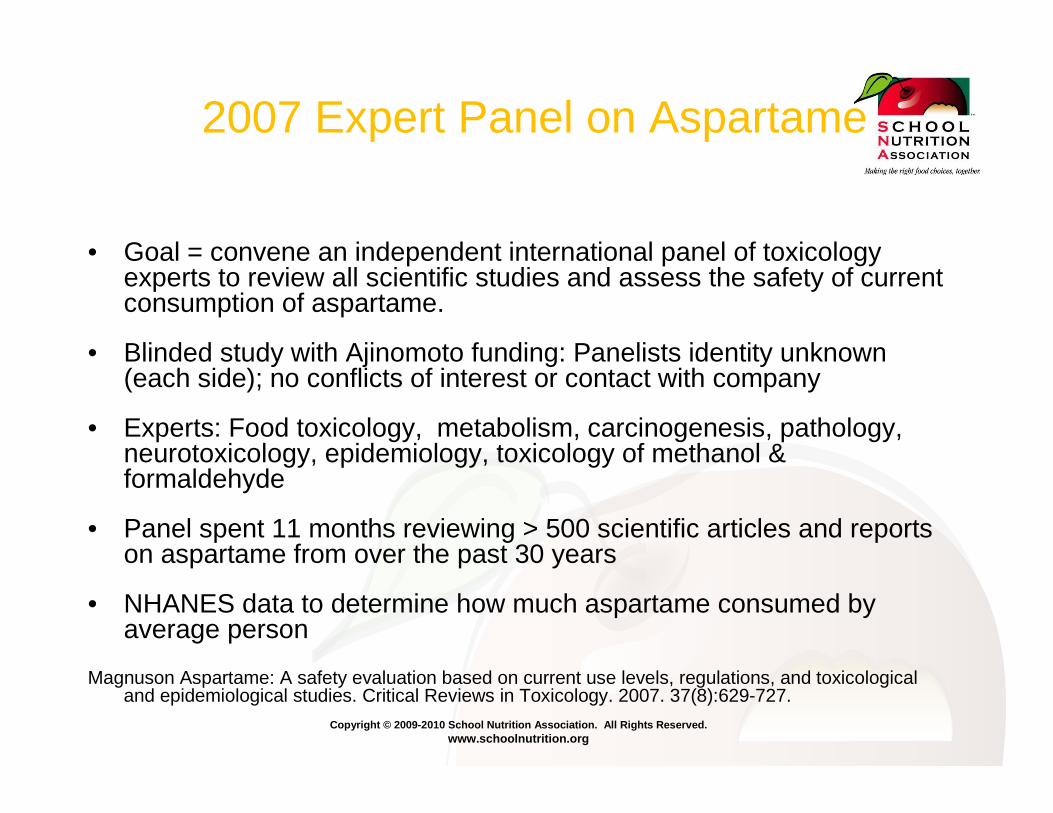
2007 Expert Panel on Aspartame
• Goal = convene an independent international panel of toxicology experts to review all scientific studies and assess the safety of current consumption of aspartame.
• Blinded study with Ajinomoto funding: Panelists identity unknown(each side); no conflicts of interest or contact with company
• Experts: Food toxicology, metabolism, carcinogenesis, pathology, neurotoxicology, epidemiology, toxicology of methanol & formaldehyde
• Panel spent 11 months reviewing > 500 scientific articles and reports on aspartame from over the past 30 years
• NHANES data to determine how much aspartame consumed by average person
Magnuson Aspartame: A safety evaluation based on current use levels, regulations, and toxicological and epidemiological studies. Critical Reviews in Toxicology. 2007. 37(8):629-727.
Copyright © 2009-2010 School Nutrition Association. All Rights Reserved. www.schoolnutrition.org
Expert Panel Findings-Safe across Population Groups
• No credible evidence aspartame is carcinogenic or has any cancer-causing properties
• Extensive human studies: No link to memory loss, learning problems or any other neurological effects
• No effect on behavior, brain function or seizures in any of the groups studied
• No adverse effects on reproduction or lactation• Safe for use by people with diabetes and may help them
adhere to a lower-carbohydrate diet program to bett er control blood sugars
Magnuson Aspartame: A safety evaluation based on current use levels, regulations, and toxicological and epidemiological studies. Critical Reviews in Toxicology. 2007. 37(8):629-727.
Copyright © 2009-2010 School Nutrition Association. All Rights Reserved. www.schoolnutrition.org
The Ramazzini Study
• Largest (and worst) animal study ever done on Aspartame.
• 1,800 (male and female) 8 wk old rats• Very low to very high concentrations:• “Statistically significant dose-related increase in
lymphomas and leukemias in females”• No significant increase in brain tumors
Soffriti et. al. Aspartame induces lymphomas and leukemias in rats. Eur. J. Oncol., vol. 10, no. 2, pp. 108-116.
Copyright © 2009-2010 School Nutrition Association. All Rights Reserved. www.schoolnutrition.org
Copyright © 2009-2010 School Nutrition Association. All Rights Reserved. www.schoolnutrition.org
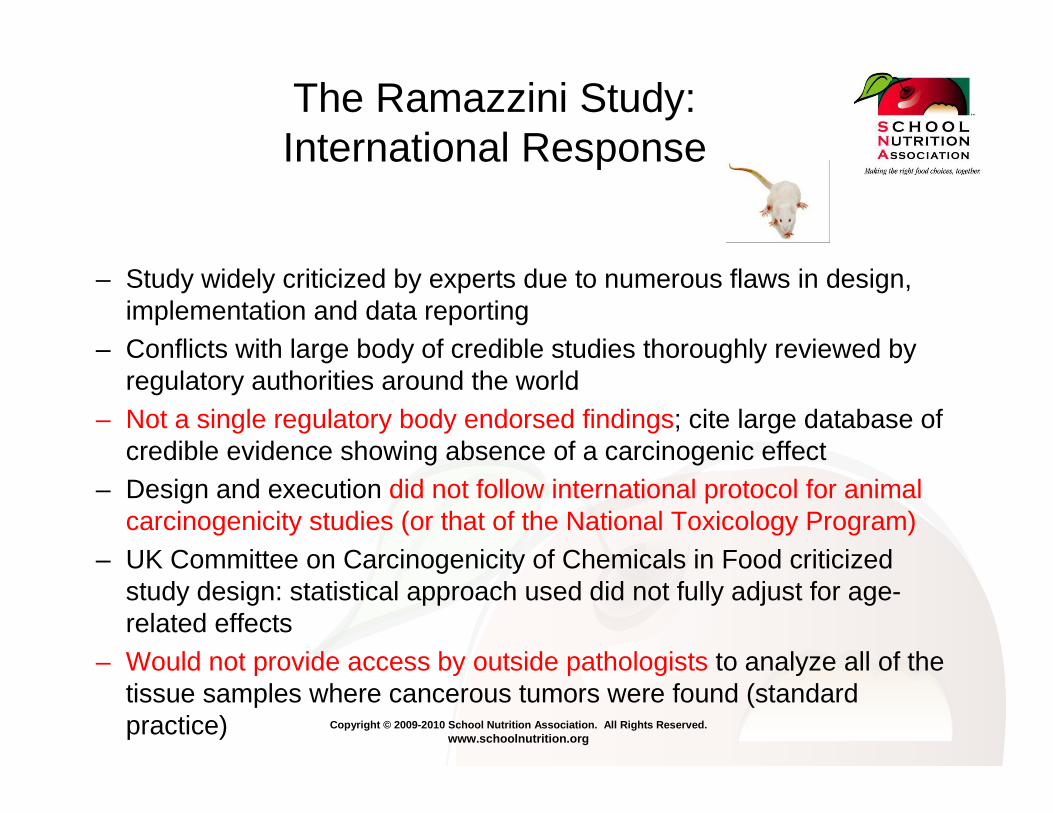
The Ramazzini Study:International Response
– Study widely criticized by experts due to numerous flaws in design, implementation and data reporting
– Conflicts with large body of credible studies thoroughly reviewed by regulatory authorities around the world
– Not a single regulatory body endorsed findings; cite large database of credible evidence showing absence of a carcinogenic effect
– Design and execution did not follow international protocol for animal carcinogenicity studies (or that of the National Toxicology Program)
– UK Committee on Carcinogenicity of Chemicals in Food criticized study design: statistical approach used did not fully adjust for age-related effects
– Would not provide access by outside pathologists to analyze all of the tissue samples where cancerous tumors were found (standard practice)
Copyright © 2009-2010 School Nutrition Association. All Rights Reserved. www.schoolnutrition.org
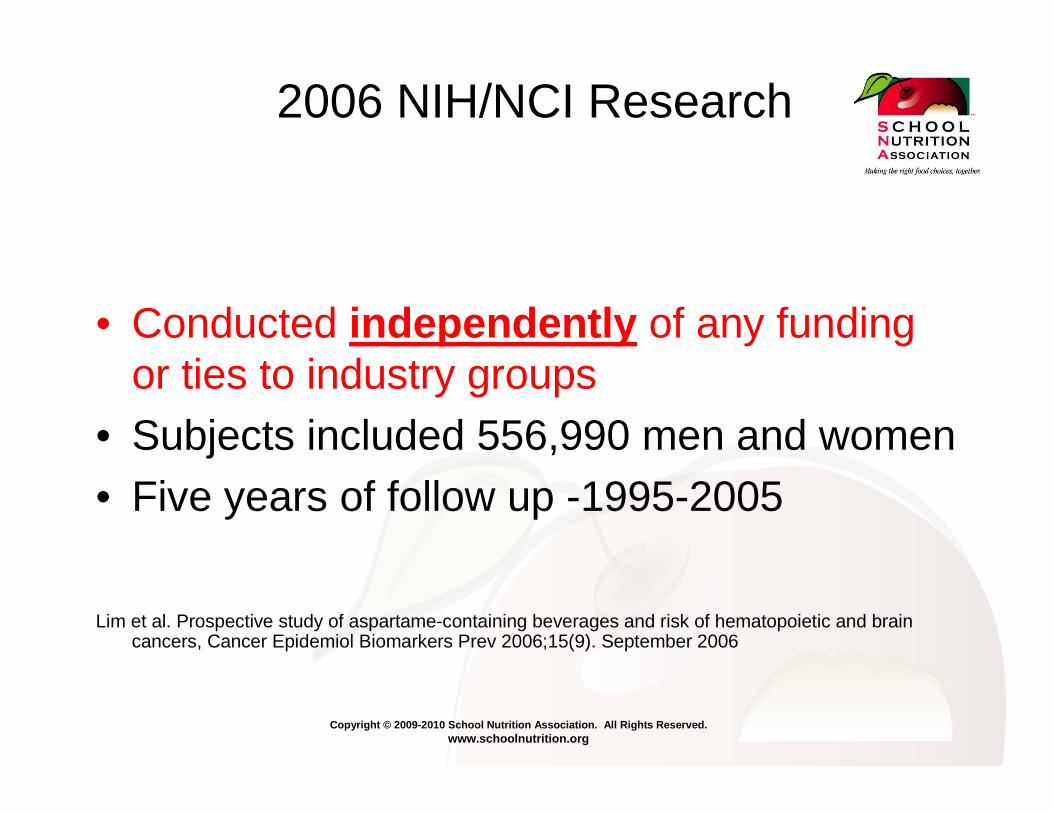
2006 NIH/NCI Research
• Conducted independently of any funding or ties to industry groups
• Subjects included 556,990 men and women• Five years of follow up -1995-2005
Lim et al. Prospective study of aspartame-containing beverages and risk of hematopoietic and brain cancers, Cancer Epidemiol Biomarkers Prev 2006;15(9). September 2006
Copyright © 2009-2010 School Nutrition Association. All Rights Reserved. www.schoolnutrition.org
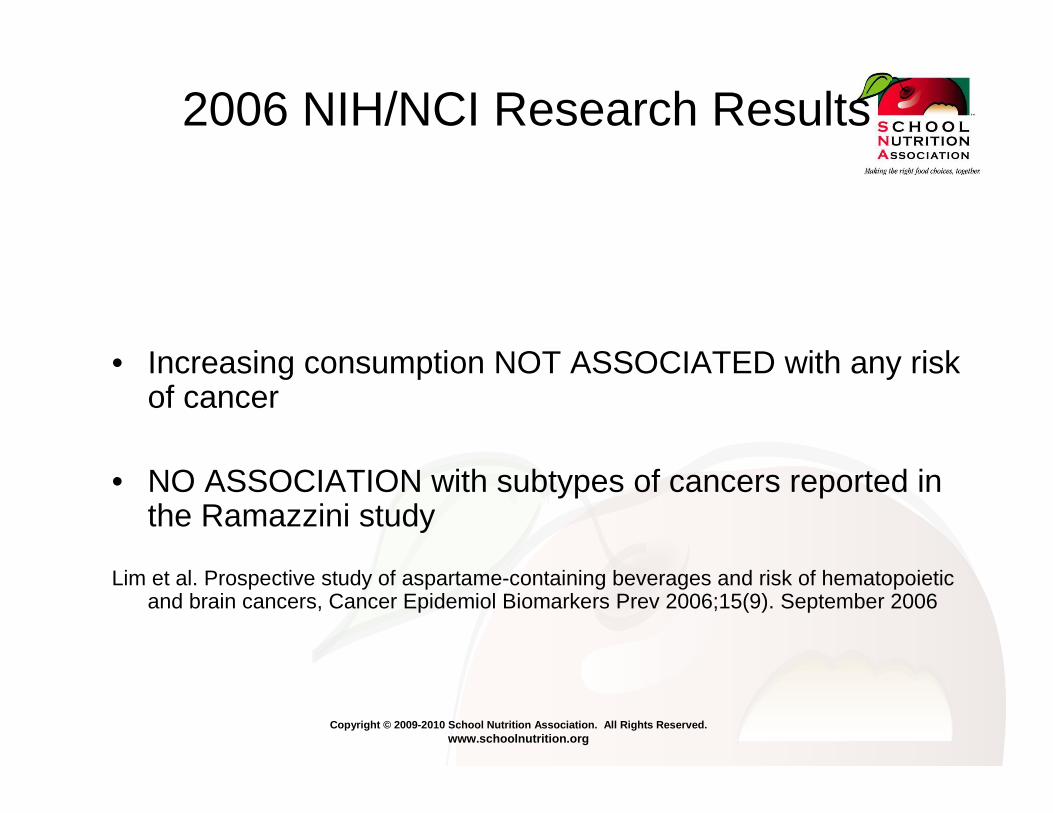
2006 NIH/NCI Research Results
• Increasing consumption NOT ASSOCIATED with any risk of cancer
• NO ASSOCIATION with subtypes of cancers reported in the Ramazzini study
Lim et al. Prospective study of aspartame-containing beverages and risk of hematopoietic and brain cancers, Cancer Epidemiol Biomarkers Prev 2006;15(9). September 2006
Copyright © 2009-2010 School Nutrition Association. All Rights Reserved. www.schoolnutrition.org
Aspartame & better diet quality
• “Reported Use of Reduced-Sugar Foods and Beverages Reflects High-Quality Diets”– “Reduced-sugar food users” consistently reported
significantly higher intakes of fruit, similar or higher micronutrient intakes, lower energy intakes and lower intake of discretionary fat and added sugars.
-J Food Sci. Vol. 70, Nr.1, 2005, S42-S46.

Copyright © 2009-2010 School Nutrition Association. All Rights Reserved. www.schoolnutrition.org
So…
Going forward, there are challenges…
Copyright © 2009-2010 School Nutrition Association. All Rights Reserved. www.schoolnutrition.org
The challenge• Acknowledge there’s difference between
philosophy/ideology and sound science• Provide the facts about high-emotion
topics, based info on SOUND science• Advocate for science-based legislation!