nutritional management of the transition period to optimize fertility in dairy cattle
TRANSCRIPT

Proceedings 3rd Florida & Georgia Dairy Road Show (2006) 1
Nutritional Management of the Transition Period to Optimize Fertility in Dairy Cattle
Pedro Melendez, DVM, MS, PhD
College of Veterinary Medicine University of Florida, Gainesville, FL
The transition period in dairy cows is defined as the last three weeks before parturition to three weeks after parturition (Grummer, 1995). It is characterized by tremendous metabolic and endocrine adjustments that the cows must experience from late gestation to early lactation (Drackley et al., 2001). Perhaps the most important physiological change occurring during this period is the decrease in dry matter intake around parturition and the sudden increase in nutrients that cows need for milk production (Drackley, 1999; Ingvartsen and Andersen 2000). As a result of these remarkable changes, most of the infectious diseases and metabolic disorders occur during this time (Goff and Horst, 1997b; Drackley, 1999). Milk fever, ketosis, retained fetal membranes (RFM), metritis and displacement of the abomasum (DA) primarily affect cows within the first two weeks of lactation (Drackley, 1999). Physical and metabolic stresses of pregnancy, calving and lactation contribute to the decrease in host resistance during the periparturient period (Mallard et al., 1998). During two weeks before and after parturition the T-cells populations exhibit a significant decline, which contribute to the immunosuppession in dairy cows at calving (Kimura et al., 1999). This immunosuppression during the periparturient period leads to increased susceptibility to mastitis and other infectious diseases (Mallard et al., 1998). Other diseases that are not clinically apparent during the first two weeks of lactation (laminitis, ovarian cysts, endometritis) can be traced back to insults that occurred during early lactation (Goff and Horst, 1997b). Physiological and Metabolic Changes during the Transition Period Dry Matter Intake
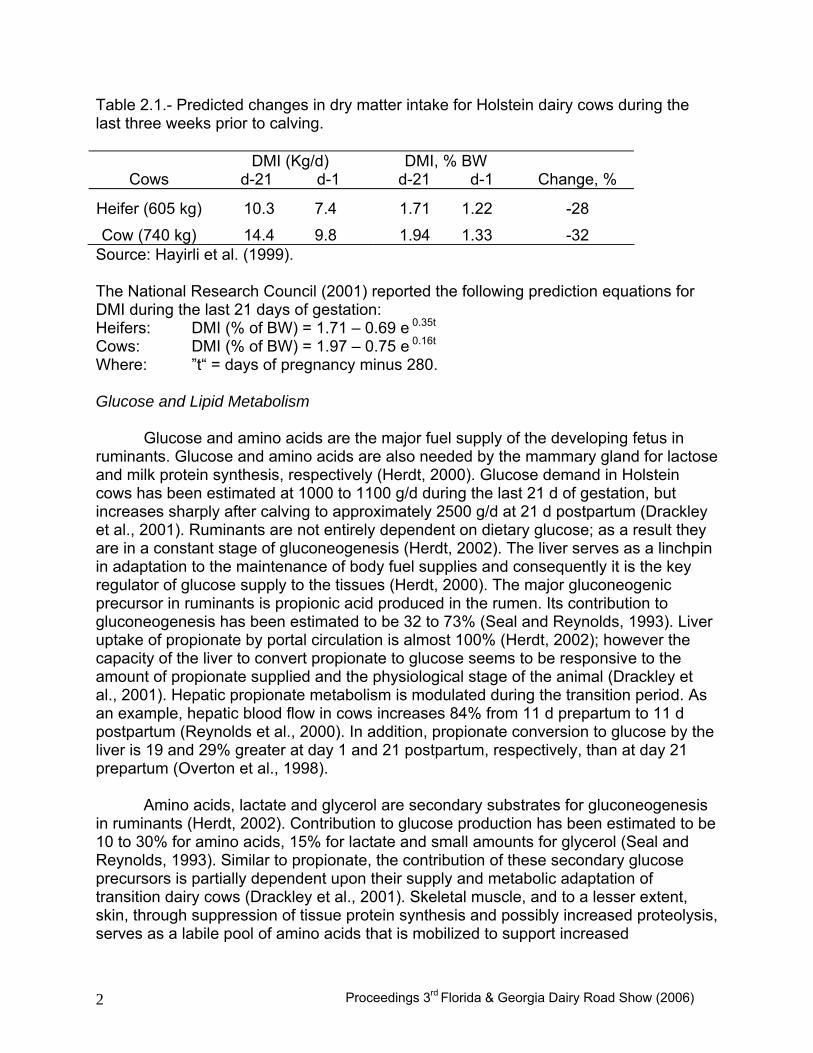
Dry matter intake (DMI) is a function of animal and dietary factors affecting hunger and satiety (Allen, 2000). Dry matter intake starts to decrease a few weeks before parturition with the lowest level occurring at calving (Ingvartsen and Andersen, 2000). Average values for the prefresh transition period have been reported to range between 1.7 and 2.0% of body weight (BW) (Hayirli et al., 1999). However this is not a constant value and it can be influenced by the ration that is fed (concentration of nutrients), the stage of the transition period, body condition score (BCS) and parity (Hayirli et al., 2002). Dry matter intake decreases about 32% during the final three weeks of gestation, and 89% of that decline occurs at five to seven days before calving (Hayirli et al., 2002). Most cows rapidly increase DMI for the first three weeks after calving (Ingvartsen and Andersen, 2000). As a percentage of body weight, heifers consume less feed than cows at 21 days before calving. By the time of calving, intake is more similar (Table 2.1) (Hayirli et al., 1999).
Proceedings 3rd Florida & Georgia Dairy Road Show (2006) 2
Table 2.1.- Predicted changes in dry matter intake for Holstein dairy cows during the last three weeks prior to calving.
Cows DMI (Kg/d)
d-21 d-1 DMI, % BW
d-21 d-1 Change, %
Heifer (605 kg) 10.3 7.4 1.71 1.22 -28
Cow (740 kg) 14.4 9.8 1.94 1.33 -32 Source: Hayirli et al. (1999). The National Research Council (2001) reported the following prediction equations for DMI during the last 21 days of gestation: Heifers: DMI (% of BW) = 1.71 – 0.69 e 0.35t
Cows: DMI (% of BW) = 1.97 – 0.75 e 0.16t Where: ”t“ = days of pregnancy minus 280. Glucose and Lipid Metabolism Glucose and amino acids are the major fuel supply of the developing fetus in ruminants. Glucose and amino acids are also needed by the mammary gland for lactose and milk protein synthesis, respectively (Herdt, 2000). Glucose demand in Holstein cows has been estimated at 1000 to 1100 g/d during the last 21 d of gestation, but increases sharply after calving to approximately 2500 g/d at 21 d postpartum (Drackley et al., 2001). Ruminants are not entirely dependent on dietary glucose; as a result they are in a constant stage of gluconeogenesis (Herdt, 2002). The liver serves as a linchpin in adaptation to the maintenance of body fuel supplies and consequently it is the key regulator of glucose supply to the tissues (Herdt, 2000). The major gluconeogenic precursor in ruminants is propionic acid produced in the rumen. Its contribution to gluconeogenesis has been estimated to be 32 to 73% (Seal and Reynolds, 1993). Liver uptake of propionate by portal circulation is almost 100% (Herdt, 2002); however the capacity of the liver to convert propionate to glucose seems to be responsive to the amount of propionate supplied and the physiological stage of the animal (Drackley et al., 2001). Hepatic propionate metabolism is modulated during the transition period. As an example, hepatic blood flow in cows increases 84% from 11 d prepartum to 11 d postpartum (Reynolds et al., 2000). In addition, propionate conversion to glucose by the liver is 19 and 29% greater at day 1 and 21 postpartum, respectively, than at day 21 prepartum (Overton et al., 1998).
Amino acids, lactate and glycerol are secondary substrates for gluconeogenesis in ruminants (Herdt, 2002). Contribution to glucose production has been estimated to be 10 to 30% for amino acids, 15% for lactate and small amounts for glycerol (Seal and Reynolds, 1993). Similar to propionate, the contribution of these secondary glucose precursors is partially dependent upon their supply and metabolic adaptation of transition dairy cows (Drackley et al., 2001). Skeletal muscle, and to a lesser extent, skin, through suppression of tissue protein synthesis and possibly increased proteolysis, serves as a labile pool of amino acids that is mobilized to support increased

Proceedings 3rd Florida & Georgia Dairy Road Show (2006) 3
gluconeogenesis during the transition period (Bell, 1995; Bell et al., 2000). Alanine and glutamine account for 40 to 60% of the glucogenic potential of all the amino acids; therefore they typically make the greatest contribution to glucose synthesis (Drackley et al., 2001). Alanine conversion to glucose at 1 and 21 days postpartum was 198 and 150%, respectively, of that at 21 day prepartum (Overton et al., 1998). Lactate utilization for gluconeogenesis primarily represents recycling of carbons because most circulating lactate is formed either during catabolism of glucose by peripheral tissues or by partial catabolism of propionate by visceral peripheral tissues (Drackley et al., 2001). However, when non-forage fiber sources and monensin were fed to transition prepartum cows, pyruvate carboxylase expression was significantly induced at calving, suggesting an increased capacity of peripartum cows for gluconeogenesis from lactate (Williams et al., 2003).
Non-esterified fatty acids (NEFA) concentrations are maximum at parturition (0.9
to 1.2 mEq/L) with a slow decrease after 3 days postpartum (Melendez et al., 2002). This finding corroborates the elevated fat mobilization occurring around parturition in dairy cattle. Extreme rates of lipid mobilization lead to increased uptake of NEFA by liver and increased triglyceride (TG) accumulation (Drackley, 1999). When blood glucose concentrations increase lipogenesis predominates over lypolysis. This results in suppression of NEFA release from adipose tissue (Herdt, 2000). The effect of glucose on adipose tissue is related to insulin secretion and its role in glycerol synthesis, which is essential for triglyceride assembly (Herdt, 2000). When glucose concentration decreases, as occurs just after calving, NEFA mobilization from adipose tissue is stimulated (Herdt, 2000; Melendez et al., 2002). When blood glucose levels are sufficient, glucose flow is favored into the Krebs cycle, therefore its precursors are slowly accumulated in mitochondria. In liver, the excess of citrate is mobilized out of the mitochondria and converted to malonyl CoA. This intermediate inhibits the enzyme carnitine acyltransferase I (CAT I), which inhibits the oxidation of fatty acids and indirectly stimulates TG synthesis. Contrary, when glucose is low, malonyl CoA decreases, CAT I is activated, favoring the transport of NEFA into the mitochondria, with the consequent increase in ketogenesis (Nelson and Cox, 2000).
Endocrine regulation of gluconeogenesis, ketogenesis and lipid metabolism
includes insulin, glucagon, somatotropin, catecholamines, cortisol, thyroid hormones and leptin (Herdt, 2000, Drackley et al., 2001). Glucose levels in a prepartum dairy cow are high (Grum et al., 1996). As a result, insulin concentrations are higher before calving than after calving and glucagon experiences the opposite pattern (Nelson and Cox, 2000). Somatotropin is lower before calving than post calving with a peak at parturition (Grum et al., 1996). Calving-Related Disorders
The majority of diseases that affect dairy cows occur during the peripartum period, consequently they are also called calving-related disorders (Risco and Melendez, 2002). In general, health disorders present low heritabilities (h2= 0 - 0.05) and environmental management plays the most important role in decreasing or

Proceedings 3rd Florida & Georgia Dairy Road Show (2006) 4
preventing their incidence. Some exceptions are lameness (h2 =0.16) and ketosis (h2 = 0.39) and the selection on conformation traits can help reduce the incidence of disease, although genetic correlations are low (Van Dorp et al., 1998).
There are several studies that have described the relationship and risk factors
among calving-related disorders in dairy cattle (Table 2.2) (Curtis et al., 1984; Curtis et al., 1985; Erb et al., 1985; Gröhn et al., 1989; Erb and Gröhn, 1988; Correa et al., 1990; Correa et al., 1993; Bruun et al., 2002; Melendez et al., 2003a; Melendez et al., 2003b). Results in general have been consistent, but some weaknesses of these studies have been the variability of the case definition. In an effort to homogenize criteria definitions, Kelton et al. (1998) recommended some guidelines for recording and calculating selected clinical diseases in dairy cattle (Table 2.3).
Calving-related disorders result in significant economic losses to dairy producers
through reduction in reproductive performance and milk yield during the subsequent lactation, cost of treatments and increased culling (Risco and Melendez, 2002). The most relevant calving-related disorders are hypocalcemia, retained fetal membranes, metritis, ketosis, displacement of the abomasum, mastitis and lameness (Goff and Horst, 1997b; Risco and Melendez, 2002). Table 2.2 Summary of relationships among calving-related disorders.
Author Disease Risk factors Association Curtis et al., 1984 Milk Fever
− Parity − Estimated transmitted
ability − Increased Crude
Protein in dry period
− Positive − Positive
− Negative
Erb et al., 1985 RFM Milk Fever Metritis
− Milk fever − Parity
− Parity
− Milk fever − RFM
− OR= 2.0 − Positive
− Positive
− OR= 1.6 − OR= 5.8

Proceedings 3rd Florida & Georgia Dairy Road Show (2006) 5
Table 2.2 continued Author Disease Risk factors Association
Curtis et al., 1985 Milk Fever RFM Metritis LDA Ketosis
− Parity
− Milk fever − Parity
− RFM − LDA
− Ketosis
− LDA − RFM − Milk fever
− Positive
− OR= 4.0 − Positive
− OR= 5.7 − OR= 3.6
− OR= 11.9
− OR= 53.5 − OR= 16.4 − OR= 23.6
Gröhn et al., 1989
Ketosis − Parity − Milk yield − Milk Fever − LDA − Metritis − Mastitis − Lameness
− Positive − Positive − OR= 1.6 − OR= 2.5 − OR= 2.3 − OR= 1.4 − OR= 2.4
Correa et al., 1990 Milk Fever RFM Metritis LDA Ketosis Mastitis
− Lead Feeding
− Low Ca diets − Farmer treatments
− Dystocia − RFM
− Metritis − Leading feeding
− Milk Fever − Dry fat cows
− RFM − Milk Fever
− OR= 2.4
− OR= 1.7 − OR= 1.7
− OR= 5.6 − OR= 86.5
− OR= 43.7 − OR= 4.4
− OR= 41.5 − OR= 3.1
− OR= 8.7 − OR= 31.3

Proceedings 3rd Florida & Georgia Dairy Road Show (2006) 6
Table 2.2 continued Author Disease Risk factors Association
Correa et al., 1993 RFM Metritis Ketosis LDA Dystocia
− Dystocia − Twinning
− Dystocia − RFM − Ketosis
− Milk Fever
− Milk Fever − Ketosis − Dystocia
− Twinning − Milk Fever
− OR= 2.2 − OR= 3.4
− OR= 2.1 − OR= 6.0 − OR= 1.7
− OR= 2.4
− OR= 2.3 − OR= 13.8 − OR= 2.3
− OR= 10.5 − OR= 2.6
Collard et al., 2000 Laminitis
Digestive
− Energy balance postpartum
− Energy balance
postpartum
− Negative
− Negative
Bruun et al., 2002 Metritis − Dystocia − Reproductive disease − Retained placenta
− Positive − Positive − Positive
Schnier et al., 2002
Mastits Metritis
− Warm housing system
− Cold housing system
− Positive
− Negative
Melendez et al., 2003a
Ovarian cysts − Lameness
− Positive
Proceedings 3rd Florida & Georgia Dairy Road Show (2006) 7
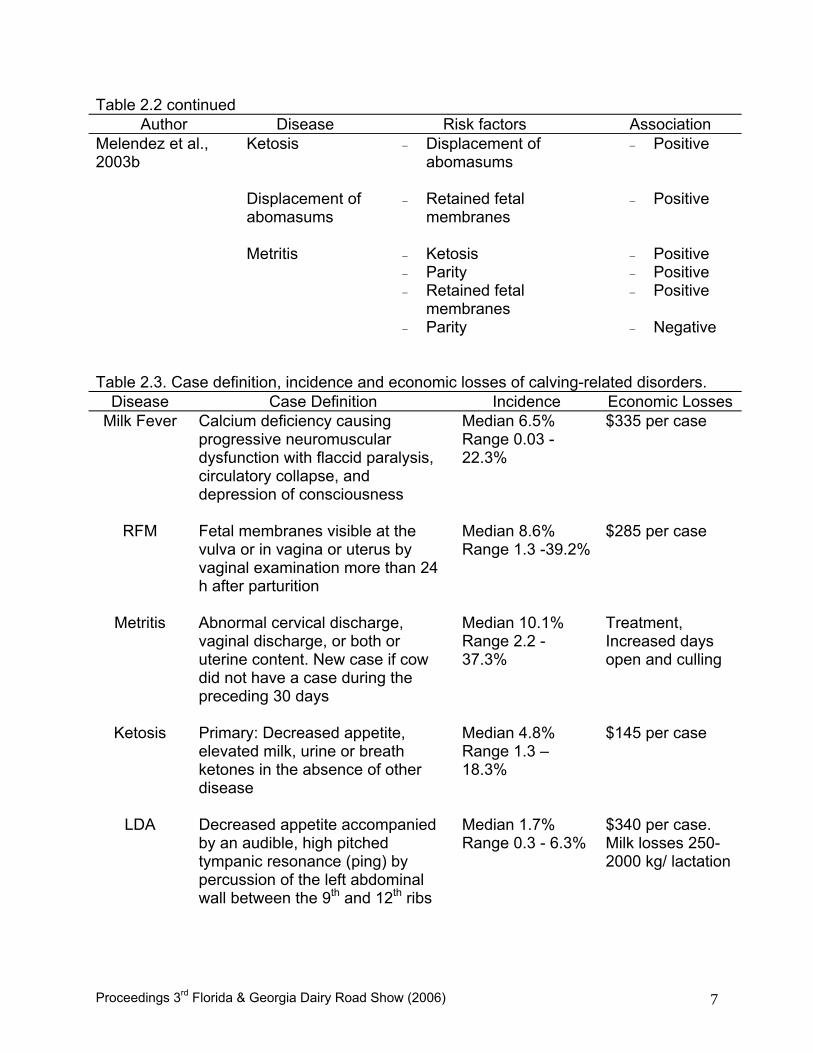
Table 2.2 continued Author Disease Risk factors Association
Melendez et al., 2003b
Ketosis Displacement of abomasums Metritis
− Displacement of abomasums
− Retained fetal
membranes
− Ketosis − Parity − Retained fetal
membranes − Parity
− Positive − Positive
− Positive − Positive − Positive − Negative
Table 2.3. Case definition, incidence and economic losses of calving-related disorders.
Disease Case Definition Incidence Economic Losses Milk Fever Calcium deficiency causing
progressive neuromuscular dysfunction with flaccid paralysis, circulatory collapse, and depression of consciousness
Median 6.5% Range 0.03 -22.3%
$335 per case
RFM Fetal membranes visible at the vulva or in vagina or uterus by vaginal examination more than 24 h after parturition
Median 8.6% Range 1.3 -39.2%
$285 per case
Metritis Abnormal cervical discharge, vaginal discharge, or both or uterine content. New case if cow did not have a case during the preceding 30 days
Median 10.1% Range 2.2 - 37.3%
Treatment, Increased days open and culling
Ketosis Primary: Decreased appetite, elevated milk, urine or breath ketones in the absence of other disease
Median 4.8% Range 1.3 –18.3%
$145 per case
LDA Decreased appetite accompanied by an audible, high pitched tympanic resonance (ping) by percussion of the left abdominal wall between the 9th and 12th ribs
Median 1.7% Range 0.3 - 6.3%
$340 per case. Milk losses 250-2000 kg/ lactation

Proceedings 3rd Florida & Georgia Dairy Road Show (2006) 8
Ovarian cysts
Smooth, rounded structure greater than 25 mm in diameter in one or both ovaries non pregnant cows
Median 8.0% Range 1.0 -16.0%
$39 per case
Lameness Episode of abnormal gait attributable to either the foot or leg regardless of etiology or duration
Median 7.0% Range1.8 -30%
$302 per case
Mastitis Visually abnormal milk secretion from one or more quarters with or without signs of inflammation of the udder. New case following 8 days of normal milk
Median 14.2% Range 1.7 -54.6%
-
Source: Kelton et al. (1998) Milk Fever, Parturient Paresis, Hypocalcemia
Milk fever (MF) is a non-febrile metabolic disease affecting milking cows in which acute calcium deficiency causes progressive neuromuscular dysfunction with flaccid paralysis, circulatory collapse, and depression of consciousness (Oetzel and Goff, 1999).
The reported frequency of MF, based on 33 citations from 1979 to 1995 ranged
from 0.03% to 22.3%. The median lactational incidence was 6.5% (Kelton et al., 1998). However, Oetzel and Goff (1999) established that annual incidence rate within herds may vary from 2% to 60%. The incidence of MF reported in a Florida commercial dairy herd using anionic diets during the prepartum period was 0.42% (2/477) (Melendez et al., 2003b). Approximately 75% of all cases of MF occur within 24 hours of calving. An additional 12% occur 24 to 48 hours after calving. Some cases (about 6%) occur at the time of delivery and cause dystocia because hypocalcemia induce uterine atony (Oetzel and Goff, 1999). Only 3% of cases occur prepartum, and only 4% occur more than 48 hours postpartum (Oetzel, 1988).
Hypocalcemia may be clinical or subclinical. Clinical signs of MF are not seen
until calcium is about 4 mg/dL (Goff and Horst, 1997b). Subclinical hypocalcemia affects about 50% of all adult dairy cattle. In this case, plasma Ca concentration of periparturient cows remained < 7.5 mg/dL, even up to 10 days after calving (Goff et al., 1996). This condition may lead to decreased DMI after calving, increased risk of secondary diseases, decreased milk production and decreased fertility (Goff and Horst, 1997b).
Economic losses from MF include prophylactic or clinical treatment, lost milk production, poor reproductive performance, and culling, which are estimated to total approximately $335 per case (Dohoo and Martin, 1984; Erb et al., 1985; Bigras-Poulin et al., 1990; Guard, 1994; Gröhn et al., 1998; Kelton et al., 1998).

Proceedings 3rd Florida & Georgia Dairy Road Show (2006) 9
Several risk factors related to MF have been identified. Breed, age and milk yield are the most important risk factors for MF in dairy cattle. Jersey and Guernsey cows are the most susceptible to MF; Holstein and Brown Swiss are moderately susceptible; and Ayrshire and Milking Shorthorns are the least susceptible (Oetzel and Goff, 1999). The incidence of MF increases with parity and with higher levels of milk production, regardless of breed (Oetzel and Goff, 1999).
Most cows are in negative Ca balance during the early weeks of lactation
because more Ca leaves the body via milk, endogenous fecal loss, and urine than is absorbed from the diet. This is because the intestinal mechanisms for absorbing calcium are not fully adapted to lactation and also because DMI is less than favorable (Oetzel and Goff, 1999). Bone Ca mobilization is stimulated by a concerted effort of PTH and 1,25(OH)2D, but intestinal Ca absorption is controlled by 1,25(OH)2D alone. During the dry period, these mechanisms for replenishing plasma Ca are relatively inactive. Thus, nearly all cows experience some degree of hypocalcemia during the first days after calving as the intestine and bone adapt to lactation (Goff et al., 1996). The adaptation process begins with dramatic increases in the plasma concentrations of PTH and 1,25(OH)2D at the onset of hypocalcemia. About 24 hours of 1,25(OH)2D stimulation is required before intestinal Ca transport is increased significantly. Bone Ca resorption (recruitment and activation of osteoclasts) is not significantly increased until after about 48 hours of PTH stimulation. In cows with MF, these adaptive processes can be even more prolonged (Horst et al., 1994). Magnesium status is another factor influencing the risk of hypocalcemia. Low blood magnesium levels can reduce PTH secretion from the parathyroid glands and can also alter the responsiveness of tissues to PTH. High dietary potassium reduces ruminal magnesium absorption (Oetzel and Goff, 1999). Increase dietary P intake (> 80 mg/day) increases the P in blood (~ 8 mg/dL), which has a direct inhibitory effect on the renal enzymes that catalyze production of 1,25(OH)2D. This reduced production of 1,25(OH)2D further reduces intestinal Ca absorption mechanism prepartum (Horst et al., 1994; Oetzel and Goff, 1999).
One of the most important determinants of MF risk is the acid-base status of the
animal at the time of parturition. Metabolic alkalosis appears to alter the physiologic activity of PTH so that bone resorption and production of 1,25(OH)2D are impaired, thus reducing the ability of the animal to successfully adjust to increased calcium demands (Oetzel and Goff, 1999).
Milk fever is confirmed by low serum calcium concentrations. Clinical signs may
begin as total blood calcium values fall below 7.5 mg/dL (< 1.8 mmol/L). However more than half of all mature dairy cows will have total blood calcium concentrations below 7.5 mg/dL (< 1.8 mmol/L) after calving without any evidence of clinical signs (Goff, 1999a; Oetzel and Goff, 1999). Generally, cows that are recumbent and unable to rise as a result of low blood Ca will have plasma Ca concentration less than 5 mg/dL, and some will be down as low as 2 mg/dL; below this level is generally incompatible with life (Goff, 1999a). Milk fever presents three stages of clinical symptoms. Animals in stage I usually have levels of 5.5 to 7.5 mg/dL of Ca. Animals in stage II typically have a total Ca

Proceedings 3rd Florida & Georgia Dairy Road Show (2006) 10
concentration of 3.5 to 6.5 mg/dL. Animals in stage III may have Ca levels as low as 1.0 mg/dL. Blood concentrations of P are typically below normal and magnesium concentrations are usually high. The most important differential diagnosis is related to the downer cow syndrome (Oetzel and Goff, 1999).
Stage I may be treated with either oral calcium supplements or intravenous
calcium salts. Animals in stage II or III require immediate treatment with intravenous calcium salts (Oetzel and Goff, 1999). The fastest way to restore normal plasma Ca concentration is to administer an intravenous injection of Ca salts (Goff, 1999a). Calcium gluconate or borogluconate is the standard intravenous treatment in cows. Five hundred ml of these products provide 10.8 g of calcium. Commercial preparations usually supply between 8.5 to 11.5 g Ca/500 ml. They may also contain Mg, phosphite and glucose. All the preparations effectively raise total and ionized Ca concentrations in blood (Goff, 1999a; Oetzel and Goff, 1999). Intravenous Ca should always be administered slowly to prevent sudden cardiac arrest due to hypercalcemia (Oetzel and Goff, 1999). Calcium should be administered at a rate of 1 g/minute (Goff, 1999a). Approximately 60% of recumbent animals affected with uncomplicated MF will get up within 30 minutes after a single intravenous dose with calcium salts. Another 15% can be expected to rise within the next 2 hours. Full restoration of normal calcium homeostasis usually requires 2 or 3 days. About 10% of dairy cows with MF stay recumbent for over 24 hours but eventually recover (Oetzel and Goff, 1999). Ca salts can also be injected subcutaneously. The serum Ca concentration achieved is not the same as with intravenous administration with similar dose. However, as with intravenous Ca injection, the subcutaneous dose of Ca increases Ca in blood for 4 to 5 hours only (Goff, 1999a). Greater amount of Ca can cause local tissue necrosis; then Ca injections should be limited to 1 to 1.5 g Ca (50 to 75 mL of most commercial preparations) per site. Calcium chloride solutions are not well tolerated subcutaneously. Ca solutions containing glucose may also be slightly more injurious. Preparations are available for intramuscular administration of Ca in the form of calcium levulinate or calcium lactate, which tend to be less injurious to tissues than other forms of calcium (Goff, 1999a).
A variety of oral calcium salt preparations are available for cattle (Oetzel and Goff, 1999). Oral Ca supplement must be readily soluble in water (digestive fluids) to reach the minimum amount for passive transport (~ 6 mmol/L) (Goff, 1999a). About 4 g of calcium will be absorbed and enter the bloodstream of a cow given an oral solution containing 50 g of calcium chloride (Oetzel and Goff, 1999). Calcium chloride is the most soluble of the Ca salts; calcium propionate, calcium formate, calcium acetate, calcium gluconate and calcium lactate are also soluble enough. Calcium hydroxide, calcium oxide and calcium carbonate are relatively insoluble and unsuitable for treating hypocalcemia. Ca that is not absorbed by passive diffusion is still available for absorption by active Ca transport in the small intestine, but this absorption is not rapid enough to be of aid in the treatment of hypocalcemia (Goff, 1999a). Oral Ca products typically contain between 25 and 100 g of Ca (Oetzel and Goff, 1999). Calcium chloride and calcium propionate are the most common products used in the treatment and prevention of hypocalcemia in cattle (Goff, 1999a). Oral administration of 50 g of

Proceedings 3rd Florida & Georgia Dairy Road Show (2006) 11
calcium from calcium chloride as a drench in 250 mL of water raises plasma Ca concentrations to the same extent as 4 g of Ca as calcium chloride administered intravenously. Conversely, 100 g of Ca orally is equivalent to between 8 and 10 g of calcium administered intravenously. Calcium chloride increases plasma Ca better than calcium propionate (Goff and Horst, 1993). Calcium chloride is slightly more effective and takes up less volume than calcium propionate; it also is an acidifying agent. This mild metabolic acidosis can help enhance Ca homeostasis. However, severe metabolic acidosis can be produced when repeated treatments of calcium chloride are administered. Furthermore, calcium chloride is very irritating to mucous membranes and lesions can be produced in the upper digestive tract, rumen and abomasum (Goff 1999a). Calcium absorption in the rumen is less efficient than in the intestine because the volume of fluid in rumen will rapidly dilute the Ca concentration to a value less than 6 mmol/L required for passive absorption. Pastes and gels reduce the amount of Ca likely to bypass the rumen. Thus, in general, more Ca must be administered by gel or paste to obtain the same rise in plasma Ca as is achieved by an oral Ca drench. However, drenches present the disadvantage that some cows will aspirate the solution, which can lead to severe aspiration pneumonia (Goff, 1999a). Calcium propionate is effective and less irritating to tissues than is calcium chloride. It does not induce metabolic acidosis, so larger amounts of Ca can be given. Furthermore, it supplies the cow with a gluconeogenic precursor (propionate) (Goff, 1999a). Oral treatments increase Ca within 30 to 60 minutes of administration, and plasma Ca concentrations remain elevated for about 6 hours. Calcium chloride acts a little faster, but calcium propionate may act a little longer (Goff, 1999a).
For many years, the traditional method of preventing MF in dairy cows was the
restriction of dietary intake of Ca during the prepartum period. Ca diets with < 15-20 g of Ca/d fed during the last 10 days of gestation, followed by a postpartum diet that is high in Ca have been recommended. These diets will greatly reduce the risk of MF (Horst et al., 1994; Joyce et al., 1997; Vagnoni and Oetzel, 1998 ; Oetzel and Goff, 1999). According to NRC (2001), the requirements of Ca for a 680 kg mature dry pregnant cow (maintenance plus last 2 month of gestation) is 0.45% dry matter basis.
Oral and intramuscular doses of vitamin D3 have also prevented MF
successfully. However, repeated treatments may lead to toxicity (Jorgensen, 1974; Markusfeld, 1989). Parathyriod hormone has been also reported to prevent parturient paresis in dairy cows. Parathyroid hormone administration increases plasma concentration of 1,25 dihydroxy vitamin D and hydroxyproline prior to parturition, suggesting that both intestinal Ca absorption and bone Ca resorption are increased by administration of the hormone (Goff et al., 1989).
Dietary cation-anion difference has been defined as the difference in
milliequivalents of cations and anions per kilogram of dry matter and has a direct impact on blood acid-base metabolism (Block, 1994). Important dietary cations are sodium (Na), potassium (K), calcium (Ca) and magnesium (Mg); important dietary anions are chloride (Cl), sulfur (S) and phosphorus (P). Several methods of calculating DCAD have been utilized, including the following equations:

Proceedings 3rd Florida & Georgia Dairy Road Show (2006) 12
DCAD (mEq)= (Na + K) – (Cl + S) (1) DCAD (mEq)= (Na + K) – (Cl) (2) DCAD (mEq)= (Na + K + 0.15 Ca + 0.15 Mg) – ( Cl + 0.2 S + 0.3 P) (3) DCAD (mEq)= (Na + K + 0.15 Ca + 0.15 Mg) – ( Cl + 0.25 S + 0.5 P) (4)
The first two equations are used more commonly, but it must be kept in mind that Ca, Mg, and P absorbed from the diet will also influence blood pH. The latter equations take into account new data on the bioavailability of all the potential strong ions. Theoretically it should be the most accurate, but it is has not been widely applied (Goff and Horst, 1998a; Oetzel and Goff, 1999).
In lactating dairy cows, increasing dietary cation-anion difference increased DMI
and milk production in early and midlactation. These effects were not observed in late lactation. However, increased DCAD affected acid-base parameters in urine at all stages of lactation (Delaquis and Block, 1995).
Diets fed prior to parturition that evoke an acidic response in the animal reduce
MF risk, whereas diets that evoke an alkaline response increase it. Thus, low DCAD diets cause metabolic acidosis and reduce the risk of MF. A diet can have a low DCAD because it is low in cations, high in anions, or a combination of both (Oetzel and Goff, 1999). As DCAD decreases, H+ increases, HCO-3 decreases and pH decreases. These changes are accompanied by a reduction in urinary HCO-3 excretion and urinary pH as compensatory mechanisms. Furthermore, low DCAD prepartum can mitigate hypocalcemia via increased urinary Ca reabsorption, serum ionized Ca, and responsiveness to Ca homeostatic hormones (Block, 1994; Vagnoni and Oetzel, 1998). Typical diets fed to dry cows have a DCAD of about +50 to +250 mEq/kg of diet dry matter (using equation 1). In common feedstuffs, potassium is the most variable of the ions in the DCAD equation and it is usually the most important determinant of DCAD in non-supplemented feed (Oetzel and Goff, 1999). The successful use of dietary anions to prevent MF has suggested that diets that are high in cations, especially Na and K, increase the susceptibility of cows to MF (Goff and Horst, 1997a). A good first step in formulating a low DCAD prepartum diet is to reduce dietary potassium to less than 1.5% of dry matter. Once the cation content has been reduced as much as possible by diet selection, anions can then be added to further reduce DCAD to the desired end point (Oetzel and Goff, 1999). Commonly used anion sources are calcium chloride, ammonium chloride, magnesium sulfate, ammonium sulfate, and calcium sulfate. Anionic salts can be unpalatable and are always accompanied by a cation, which, depending on its rate of absorption, will counteract some of the effects of the anions (Goff and Horst, 1998a, 1998b). Other anion sources include mineral acids such as hydrochloric or sulfuric acid (Oetzel and Goff, 1999). However these acids in a liquid form are corrosive and dangerous to handle. Commercial preparations of HCl mixed into common feed ingredients as a premix could offer an inexpensive, safe and palatable alternative to anionic salts (Goff and Horst, 1998b). Optimal acidification generally occurs when anions are added to achieve a final DCAD (using equation 1) between –50 to –150 mEq/kg of dry matter. The strong negative relationship (r2=0.95)

Proceedings 3rd Florida & Georgia Dairy Road Show (2006) 13
between urinary pH and net acid excretion by cows fed the diets containing anionic salts suggests that urinary pH measurement might be a useful tool to assess the degree of metabolic acidosis that is imposed by dietary anionic salts (Vagnoni and Oetzel, 1998). An advantage of this approach is that it accounts for inaccuracies in mineral analyses and for unexpected changes in forage mineral content. Urinary pH can be evaluated by obtaining urine from a group representing about 10% of the pre-calving cows. Urinary pH values below 5.5 indicate overacidification and DCAD should be increased. The optimal urinary pH is between 6.0 and 6.5 for Holstein cows and between 5.8 and 6.2 for Jersey cows. Over 6.5 is considered inadequate acidification and suggests that a lower DCAD is required. In herds experiencing MF the urine of close-up dry cows will be very alkaline with a pH above 8.0. Most accurate results will be obtained by collecting urine samples at a standard time, preferably within a few hours after feeding (Goff and Horst, 1998a; Oetzel and Goff, 1999). Retained Fetal Membranes - Metritis Complex
Retained Fetal Membranes is defined as the lack of detachment of fetal membranes from the maternal caruncles within the first 12 to 24 hours after calving (Grunert, 1986; Eiler, 1997). Van Werven et al., (1992) reported that 77.3% of cows expel the fetal membranes by 6 hours. Normal expulsion of fetal membranes requires that the maternal and fetal tissues undergo maturation and a loosening process, which is completed by 2 to 5 days before the end of an average gestation. These changes include collagenization of connective tissue, reduction in blood supply, appearance of polynuclear giant cells, loosening of tissues, and contraction of the uterine musculature (Grunert, 1986; Youngquist and Braun, 1993). Fifty-nine percent of RFM were spontaneously expelled between 5 and 7 days postpartum and 94% at days 11-13 postpartum (Van Werven et al., 1992). Most RFM are expelled by 4 to 10 days postpartum after sufficient necrosis of the caruncular tissue (Youngquist and Braun, 1993). Significant changes in the placentome must take place before expulsion of the fetal membranes can occur. Increased collagenase and other protease activities have been described in the normal uterus. This has resulted in a massive breakdown of collagen and other proteins during uterine involution (Sharpe et al., 1990). However, in cows experiencing RFM collagenolysis and proteolysis is diminished (Eiler, 1997). Some studies have reported an average incidence of RFM from 4 to 11% with a range of 2-55% (Paisley et al., 1986; Joosten et al., 1988). The incidence of RFM, based on 50 citations from 1979 to 1995 ranged from 1.3% to 39.2%. The median was 8.6% (Kelton et al., 1998). Economic losses of a case of RFM, including direct cost such as treatment (32%), lost milk production (40%), increased culling rate (19%) and increased days open (9%), have ranged from $106 to $285 (Barlett et al., 1986a;Joosten et al., 1988; Guard, 1994).
Joosten et al. (1991) have reported a number of risk factors for RFM such as dystocia, parity, abnormal gestation duration, season and sire of the calf. In other studies, cows that developed parturient paresis were 4.0 to 4.2 times more likely to experience RFM than normal cows (Curtis et al., 1985; Erb et al., 1985).

Proceedings 3rd Florida & Georgia Dairy Road Show (2006) 14
Hypocalcemia has been related to dystocia, RFM and uterine prolapse in dairy cattle (Curtis et al., 1983; Risco et al., 1984; Correa et al., 1993; Risco et al., 1994a). Erb et al., (1985) determined that cows suffering hypocalcemia were 4.2 times and 2.0 times more likely to have dystocia and RFM, respectively.
A recently explored, but old concept related to RFM is the immunological aspect
involved in the pathogenesis of this reproductive condition. The old theory suggests that fetal membranes must be recognized as "foreign" tissues and rejected by the immune system after parturition to cause expulsion of fetal membranes (Gunnink, 1984). Neutrophils isolated from cows that experienced RFM had significantly lower function than cows without RFM, before calving and during the first 2 weeks postpartum. In addition, Interleukin-8, a potent neutrophil chemoattractant, was lower at calving in cows with RFM (51±12 pg/ml) than cows without RFM (134±11 pg/ml). These findings suggest that neutrophil function around parturition is a determining factor for the development of RFM in dairy cattle (Kimura et al., 2002).
Retained fetal membranes have been the major factor that predispose cattle to
metritis. The majority of affected cows show no serious clinical signs other than a transient decrease in appetite and milk production. However, 20% to 25% of cows affected by RFM develop moderate to severe metritis (Joosten et al., 1988).
The relative risk of cows with RFM developing metritis was 2.8 and the
attributable risk was 28% as compared with cows without RFM (Bartlett et al., 1986a). In several epidemiological studies using path analysis methodology cows with RFM have been around 6.0 times more likely to develop metritis than normal cows (Correa at al., 1993; Curtis et al., 1985; Erb et al., 1985). Overall, studies using path analysis and risk assessment indicated consistently that dystocia, nutrition, metabolic disorders and mainly RFM increased the likelihood that a cow would develop metritis (Lewis, 1997; Bruun et al., 2002; Melendez et al., 2003b).
Uterine infections are one of the most frequent disorders affecting dairy cows
during the post partum period (Youngquist and Shore, 1997). They are a major cause of economic losses to the cattle industry being related with systemic disease, decrease reproductive efficiency, reduced milk production, increased replacement costs and reduced genetic progress (Kelton et al., 1998). The total cost to producers for each lactating dairy cow with a uterine infection was estimated at $106 (Barlett et al., 1986a). In a review by Fourichon et al., (1999), only two studies out of ten showed losses in milk production between 100 to 270 kg per lactation in cows with metritis. Typically, no milk loss was associated with metritis. Rajala-Schultz and Gröhn (1998) using data from 37,776 Finish Ayrshire dairy cows determined that when metritis was treated as one disease complex, regardless of the time of its occurrence, metritis had no significant effect on milk yield. However, when early and late metritis were analyzed separately, the time of disease occurrence had an effect on milk yield. Late metritis was not associated with milk loss yet early metritis accounted for 46.2 kg less milk in cows with metritis within 28 days after calving.

Proceedings 3rd Florida & Georgia Dairy Road Show (2006) 15
Barlett et al. (1986a) in Michigan herds determined that cows with metritis were 1.3 times more likely to be culled than were cows without metritis. A more recent study in Holstein cows in New York State demonstrated that metritis had no effect on the risk of culling. In contrast, other diseases such as mastitis, MF, RFM, LDA, ketosis and ovarian cysts significantly affected culling at different stages of lactation (Gröhn et al., 1998).
The diagnosis of metritis has been very subjective and has been applied to
clinical conditions that range from cows that are nearly normal to those affected by severe, life threatening sepsis (Youngquist and Shore, 1997). Metritis has been defined as an inflammation of all layers of the uterus typically developed within a few days to several weeks after calving. The condition is characterized by an abnormal cervical discharge, vaginal discharge, or both (Lewis, 1997; Youngquist and Shore, 1997; Kelton et al., 1998). The condition may be local or systemic. A condition called toxic or gangrenous metritis, that occurs almost exclusively in the puerperal period and is often associated with clostridial infections, is characterized by foul-smelling, watery uterine discharge, severe drop in milk production and systemic symptomatology (Gilbert and Schwark, 1992; Olson et al., 1986; Smith et al., 1998).
Several microbiological risk factors have been associated with uterine infections.
The uterus has an anaerobic environment. Cows with RFM present a higher incidence of coliforms, and other environmental bacteria, clostridia, Actynomyces pyogenes (now Archenobacter pyogenes), and gram-negative anaerobes than normal cows (Olson et al., 1986). Recent studies have confirmed that A. pyogenes, either alone or in combination with anaerobic bacteria (Fusobacterium necrophorum and Bacteroides spp.) can act to induce uterine infections in cows during the puerperal or luteal phase (Del Vecchio et al., 1992). These bacteria produce postpuerperal metritis or a more delayed typical endometritis (Olson et al., 1986; Lewis, 1997; Youngquist and Shore, 1997). Postpuerperal metritis eventually become a chronic problem. Affected cattle do not present a systemic disease but they may have a mucopurulent, fetid vulvar discharge.
The incidence of uterine infections varies considerably among studies, and the
average incidence is not an especially meaningful statistics (Lewis, 1997). This variation is due to poorly described diagnostic methods and lack of good definition of a case. Based on 43 citations from 1979 to 1995, the frequency of metritis ranged from 2.2% to 37.3%. The median was 10.1% (Kelton et al., 1998). Gröhn et al., (1998) determined an incidence of metritis of 4.2% in 7523 dairy cows in New York state.
Uterine infections can reduce the reproductive efficiency of dairy cows thereby
increasing herd health cost (Lewis, 1997). Metritis increased days from calving to first estrus by 6.9 days, 7.3 days calving to first service interval, 15.4 days first to last service interval, 0.3 services per conception and 18 days calving to conception interval (Barlett et al., 1986a). Uterine infections alter uterine involution and reduce ovarian follicular development during the early postpartum period, which may prolong the interval from
Proceedings 3rd Florida & Georgia Dairy Road Show (2006) 16
calving to estrus and AI, but the mechanism and the repeatability of the effect of the condition on ovarian follicles is unclear (Del Vecchio et al., 1994; Lewis, 1997).
Uterine infections are a highly complex process. The exact causes of uterine
infections are unknown, but several predisposing factors have been associated with the disease (Lewis, 1997). Cows with dystocia, RFM, twins or still-births, overconditioning and various metabolic and digestive disorders increase the risk of metritis (Curtis et al., 1985; Erb et al., 1985; Olson et al., 1986; Correa et al., 1993; Lewis, 1997; Youngquist and Shore; 1997; Bruun et al., 2002; Melendez et al., 2003b). Other risk factor that might be associated with the pathogenesis of metritis is the immunosupression occurring around parturition. T-cell sub-populations have been demonstrated to decline at calving and they do not return to pre-calving levels until two weeks after parturition (Kimura et al., 1999).
Treatment of RFM has been based on different protocols. Removal by gentle
traction has long been the conventional method, but the procedure may be followed by severe uterine infections and impaired fertility (Bolinder et al., 1988). A single dose of oxytocin does not reduce the presence of RFM (Miller and Lodge, 1984). Exogenous estrogen is of questionable therapeutic value because plasma concentrations of estrogen are elevated in cows when the placenta is retained (Pimentel et al., 1987). Analogs of Prostaglandin F2 alpha are recommended as well, but Fenprostalene does not change myometrial activity between days 1 and 4 after calving, suggesting that uterotonic agents are unlikely to promote placental expulsion. In addition, the levels of PGFM are higher in cows with RFM than control cows (Burton et al., 1987; Risco et al., 1994b). Treatment of cows with RFM with intrauterine tetracycline may reduce fertility (Youngquist and Braun, 1993). Parenteral administration of antibiotic agents is indicated in cases of sepsis associated with RFM (Smith et al., 1998), however, the residues in milk must be considered (Dinsmore et al., 1996).
Treatment of the uterine infections traditionally has been based on the use of
local and/or systemic antibacterial compounds. However, according to different trials, the results have been controversial (Gilbert and Schwark, 1992; Youngquist, and Braun, 1993; Pugh et al., 1994; Smith et al., 1998).
Uterine infections should be prevented by proper nutritional management during
the dry period, allowing cows to calve in an uncontaminated environment, and employing strict sanitation if assistance is required during delivery (Youngquist and Braun, 1993; Lewis 1997). Ultimately, the competence of the immune system has to be considered in the prevention of the metritis complex. Uterine trauma, such as dystocia, manual removal of RFM and intrauterine infusions, reduced the phagocytic activity of uterine and blood neutrophils (Cai et al., 1994). Changes in immune function are consistent with changes in estradiol and progesterone concentrations around calving and during the estrous cycle of cows and ewes. Prostaglandins and other arachidonic acid metabolites might be important mediators of resistance or susceptibility to uterine infections (Lewis 1997; Goff and Horst, 1997b). Repeated doses of prostaglandin F2alpha beyond 7 days postpartum in cows with metritis resulted in less acute response

Proceedings 3rd Florida & Georgia Dairy Road Show (2006) 17
protein concentrations and lower diameter of uterine horns. This response might be explained for the effect of PGF2alpha on smooth musculature contraction of the uterus (Melendez et al., 2003c). Abomasal Disorders
Displacements, dilatations, and volvulus of the abomasum are the most commonly encountered disorders of the gastrointestinal tract in modern dairy operations (Trent, 1990). Displacement can be on the left side (LDA) or the right side (RDA). (Fecteau et al., 1999). Omental attachments of the abomasum prevent true torsion around the long axis of the abomasum, with rotation occurring around an axis through the supporting lesser omentum. Therefore, a more accurate term for the syndrome is “abomasal volvulus”, rather than torsion. Any right-sided displacement that requires further manipulation to free the pylorus and duodenum may be considered for practical purposes to be a volvulus (Trent, 1990).
The prevalence of abomasal displacement among dairy herds is variable
depending on geographic location, management practices, climate and other factors (Fecteau et al., 1999). Left displacement is the most common of the three syndromes, constituting 85 to 95.8% of the total cases of displacements or volvulus (Trent, 1990). Left Displacement of Abomasum
In LDA, the abomasum slides under the rumen and dorsally along the left body wall. The result is a partial impairment of abomasal outflow, leading to abomasal gas accumulation, electrolyte pooling with subsequent systemic alterations, and depressed gastrointestinal motility and appetite (Fecteau et al., 1999). A simple case definition is a cow with decreased appetite accompanied by a progressive decrease in milk production. An audible, high pitched tympanic resonance (ping) produced by percussion of the left abdominal wall between the 9th and 12th ribs is a characteristic used to diagnose this condition (Kelton et al., 1998). Feces are often softer than normal. Rectal temperature, respiratory and heart rate are generally normal (Fecteau et al., 1999).
Left displacement of the abomasum occurs most commonly two weeks pre- to 8
weeks postpartum. The incidence of LDA, based on 22 citations from 1982 to 1995 ranged from a postpartum incidence rate of 0.3% to 6.3%. The median incidence rate was 1.7% (Kelton et al., 1998). Detilleux et al., (1997), in New York State, determined an incidence of LDA that ranged from 2.1 to 8.7%. The mean number of days of lactation at which LDA was diagnosed was 20.6. In New York state, Gröhn et al., (1998) observed a lactational incidence risk of LDA of 5.3%. Cameron et al., (1998) in 1170 multiparous Holstein cows from 67 high producing dairy herds in Michigan, found an incidence of LDA of 6% in primiparous and 7% in multiparous cows. Cows with twins presented an incidence of 11 to 12 %. Østergaard and Gröhn (1999) in three Danish research herds (4414 lactations) determined an incidence of LDA in first lactation cows of 0.6% and in older cows 1.2%, with a first diagnosis at 19 days in milk (mean) or 17
Proceedings 3rd Florida & Georgia Dairy Road Show (2006) 18
days in milk (median). In Florida, Massey et al, (1993) and Melendez et al. (2003b) found an LDA incidence of 2.4% and 3.9%, respectively.
Economic losses from LDA include lost milk production and the cost of the
surgery which is estimated to total approximately $340 per case (Guard, 1994; Kelton et al., 1998). The effect of LDA on test day milk yields of Holstein cows have been studied by several authors. Detilleux et al., (1997) in New York State and using 12,572 Holstein cows between parity 1 and 6, determined that from calving to 60 days after diagnosis, cows with LDA yielded on average 557 kg less milk than did cows without LDA. Thirty percent of losses occurred before diagnosis and milk loss increased as parity and productivity increased. In each parity, the lactation curves of cows with LDA were depressed in early lactation compared with the curves for cows without LDA. Cows with LDA experienced severe losses of milk yield because the disease occurred during peak yield, which might explain the severity of the losses. Milk yield returned to a normal range at 20 to 45 d after diagnosis. Furthermore, cows with LDA were 1.8 times more likely to have another disease than healthy cows. Østergaard and Gröhn (1999), in Denmark, found that cows with LDA compared with healthy cows had an average milk loss within the first 6 weeks after diagnosis of 4.6 and 5.2 kg/d for primiparous and multiparous cows, respectively. Three weeks before diagnosis, only multiparous cows with LDA showed lower milk yield than normal cows (approximately 4.0 kg/d). Also, this study demonstrated cows that experienced LDA presented the highest body weight loss (69 kg) and the pre-disease level for accurate estimation of losses has to be considered.
Displaced abomasum is also a risk factor for culling in early lactation (1 to 30
days), but not in late lactation. Cows with LDA had a relative risk of culling 2.4 times higher than normal cows during the first 30 days of lactation. After that period of lactation the differences were not significant (Gröhn et al.,1998).
Left displacement of the abomasum is a multifactorial disease where different
risk factors have been established. Several epidemiological and clinical trials have been conducted to determine association among factors and physiopathological mechanism. Cows experiencing MF, dystocia and ketosis increased the odds for LDA by 2.3, 2.3 and 13.8 respectively, when compared to normal cows (Correa et al., 1993). In another study conducted by Cameron et al., (1998) in Michigan, individual cow and herd risk factors were examined. Significant factors associated with an increased risk of LDA in the individual cow model included high body condition score, winter season, and plasma NEFA concentration > 0.3 meq/L between 35 and 3 d prepartum. The risk of LDA decreased as lactation number increased. At the level of the herd, factors associated positively with risk of LDA were Predicted Transmitted Ability (PTA) for milk production, BCS, winter and summer seasons, and precalving rations containing energy densities > 1.65 Mcal of Enl/kg of DM. Feed bunk management considering bunk space, feed availability and freshness was associated negatively with the risk of LDA.
Nutrition has been implicated as one of the most important risk factors in the
etiology of LDA. The transition period from two weeks prepartum through two to four wk

Proceedings 3rd Florida & Georgia Dairy Road Show (2006) 19
postpartum is the major risk period for the occurrence of LDA (Shaver, 1997). This might be explained by a low feed consumption during the transition period where rumen fill is decreased. The decline of dry matter intake is about 35% over the final week prepartum (Bertics et al., 1992). Furthermore, as pregnancy progresses, the growing uterus occupies an increasing amount of the abdominal cavity. This forces the abomasum forward and slightly to the left side of the cow. After calving, if the smaller rumen does not move into its normal position on the left ventral floor of the abdomen, the abomasum is able to slide under it (Goff and Horst, 1997b).
In Florida, Massey et al., (1993) reported that hypocalcemic cows at parturition
(total serum calcium < 7.9 mg/dl) were 4.9 times more likely to develop LDA than normocalcemic cows. Hypocalcemia is known to cause abomasal atony. Abomasal atony is an absolute prerequisite to LDA (Fecteau et al., 1999). Strategies to prevent hypocalcemia at parturition may be useful for the prevention of LDA (Shaver, 1997).
Ketosis is the strongest identified risk factor associated with LDA. Curtis et al.,
(1985) reported that cows with uncomplicated ketosis were 11.9 times more likely to develop an LDA than normal cows. Correa et al., (1993) found that cows with ketosis were 13.8 times more likely to develop an LDA than normal cows. Melendez et al. (2003b) found that cows with clinical ketosis were ~ 50 times more likely to develop LDA than cows without ketosis. However this is not a cause-effect relationship. Ketosis is a typical metabolic disease explained by low DMI, low levels of glucose, negative energy balance and a high level of fat mobilization in early postpartum cow (Herdt and Gerloff, 1999; Herdt 2000; Risco and Melendez, 2002). Cows with low DMI at day 1 prepartum had reduced DMI at day 21 postpartum (Grummer, 1995). Body condition score at calving is another factor related with DMI and health status of the dairy cows. Cows with excess BCS at parturition are at increased risk to hypocalcemia, ketosis and LDA (Cameron et al., 1998; Heuer et al., 1999). In addition, cows with longer and more extreme period of negative energy balance have increased risk of digestive problems, including LDA and laminitis (Collard at al., 2000).
The review of Shaver (1997) establishes that there are no conclusive studies
reporting that increasing concentrate intake during the last two to three weeks prepartum reduces postpartum disorders. Curtis et al. (1985), reported that cows with increased concentrate consumption during the dry period were at lower risk of LDA (OR=0.3 to 0.4) and ketosis (OR=0.2 to 0.8), respectively. However, Correa et al. (1990), reported that cows exposed to diets in concentrates were at increased risk of LDA (OR=4.4) and MF (OR=2.4). Shaver (1997) recommends that until more data are available, an adequate prepartum concentrate level should be 0.5% of body weight with an upper limit of 0.75% of body weight. Pre-calving rations containing energy densities > 1.65 Mcal of NEL/kg of DM are associated positively with risk of LDA. These diets are richer in concentrate than diets < 1.65 Mcal of NEL/kg of DM (Cameron et al., 1998). High concentrate diets, rapid introduction of concentrate in the immediate pre or postpartum period, rations high in corn silage or low in crude fiber are factors that affect abomasal motility or enhance gas production (Nocek et al., 1983; Markusfeld, 1986; Trent, 1990). Dawson et al. (1992), reported that cows fed ground alfalfa hay and

Proceedings 3rd Florida & Georgia Dairy Road Show (2006) 20
concentrate in a TMR in early postpartum were at higher risk for LDA than were cows fed the standard herd ration of sorghum silage and concentrate mixed plus loose alfalfa hay. The lack of physical form reduces chewing activity, ruminal fill, motility and fiber mat formation and increases ruminal VFA concentration, all of which may affect the etiology of LDA. Concentrate DM can be increased at the rate of 0.20 to 0.25 kg/d until peak lactation is reached. Concentrates should be fed three to four times daily. Feeding a TMR to control forage:concentrate ratio is recommended. A transition group TMR with a higher effective fiber content for early postpartum cows is also recommended. The importance of physical form of fiber as a risk factor for LDA is likely to be greatest during the early postpartum period because of the physiologic and metabolic changes in the transition period. The lack of physical form reduces chewing activity, ruminal fill, motility, fiber mat formation, and increases ruminal VFA concentration, all of which may affect the etiology of LDA (Shaver et al., 1986; Bauchemin, 1991; Mertens, 1992; Muller, 1992; Shaver, 1997; Varga et al., 1998; Heinrichs et al., 1999).
Different forage program for dry cows are used under field conditions, but data
are limited regarding their impact on the incidence of LDA (Shaver, 1997). Nocek et al. (1983) evaluated three dry cow forage programs consisting of long hay, hay and corn silage (50% each one) and corn silage. The incidence risk for LDA was 3.0, 4.3 and 6.3%, respectively. The incidence risk for ketosis was 9.1%, 6.3 and 6.4%, respectively. Shaver (1997) recommends that rations with 100% corn silage as forage source should not be fed to dry cows. The controlled use of corn silage as a component of forage programs for dry cows may be beneficial.
The importance of bunk management practices that limit feed intake in the
etiology of LDA is likely to be greatest during the early postpartum period because of the coinciding events of the transition period. TMR mixing can alter the physical form of the fiber in the diet. Excess TMR mixing may grind coarse particles and cause a lack of fiber physical form. Furthermore, excess particle size can allow the cows to sort the TMR in the feed bunk which can also cause the same problem (Shaver, 1997; Vargas et al., 1998; Heinrichs et al., 1999; Melendez et al., 2002b; Melendez et al., 2003d). Right Dilatation of the Abomasum and Abomasal Volvulus (RDA-AV)
Right displacement and volvulus are less common conditions constituting 5 to 15% of the total cases of displacements or volvulus (Trent, 1990).
Cattle with AV are more likely to appear systemically affected than those with
RDA or LDA. Shock, hypovolemia and pain may be present associated with distention and necrosis of the abomasum, or severe electrolyte and acid-base imbalances, or both. There is an abrupt decline in milk production. Feces are scant and often dark and diarrhreal (Fecteau et al., 1999).
Many of the predisposing factors suggested for LDA, such as those that act by
altering motility or promoting gas build up, have been suggested as causative for RDA as well. Right displacement of the abomasum is more diffusely distributed throughout

Proceedings 3rd Florida & Georgia Dairy Road Show (2006) 21
the lactation period than are LDAs (Trent, 1990). Both RDA and AV typically result in hypochloremic, hypokalemic, metabolic alkalosis, paradoxical aciduria and are frequently associated with hypocalcemia. However these metabolic changes are more pronounced in AV than RDA (Fecteau et al., 1999). Ketosis and Fatty Liver
Ketosis is defined as a metabolic disease characterized by high levels of ketone bodies affecting cattle, sheep and goats. Ketosis affects dairy cows in the period from parturition to 6 weeks postpartum (Herdt and Gerloff, 1999). There are two types of ketosis, primary and secondary. Cattle with primary clinical ketosis havea decreased appetite and elevated serum, milk, urine or breath ketones in the absence of another concurrent disease (Kelton et al., 1998).
The ketone bodies, acetone, acetoacetate, and ß-hydroxybutyrate (BHB), are
formed in the liver during oxidation of fatty acids (Nelson and Cox, 2000). Acetone, a 3 carbon compound, is produced in small quantities and is exhaled to the environment. The first produced ketone body is acetoacetate (4 carbons), which either is reversibly reduced to BHB in mitochondria, or is enzymatically or spontaneously decarboxylated to acetone (Nelson and Cox, 2000).
Ketosis may be clinical or subclinical. Subclinical ketosis is defined as a
preclinical stage characterized by elevated blood ketone body concentrations without clinical signs such as loss of appetite, hard feces, or dullness (Anderson, 1988; Duffield, 2000; Geishauser et al., 2001).
The lactational incidence rate of clinical ketosis, based on 36 citations from 1979
to 1995, ranged from 1.3% to 18.3%. The median lactational incidence rate was 4.8% (Kelton et al., 1998). Rajala-Shultz et al., (1999) reported in Finish Ayrshire cattle an overall incidence of 3.3%, however, in some herds, ketosis can be a particular problem and can affect a large proportion of at-risk cows (Herdt and Gerloff, 1999). Gröhn et al., (1998) reported an overall incidence of 5.0% in New York Holstein cattle. They determined a range between 4 to 22% among 8 herds as well (Gröhn et al. (1999). Østergaard and Gröhn, (1999), in Danish cattle determined an incidence of ketosis of 2.0% in primiparous cows and 10.0% in multiparous cows. Al-Rawashdeh, (1999) in Jordanian dairy cattle determined an overall prevalence of mild ketonemia (0.9 – 1.7 mmol/l of BHB) of 22% and severe ketonemia (> 1.7 mmol/l of BHB) of 3.8%.
More than 90% of subclinical ketosis cases occur in the first and second months
after calving. During this period, approximately 40% of all cows are affected by subclinical ketosis at least once, although the incidence and prevalence are highest in the first and second weeks after parturition (Duffield, 2000; Geishauser et al., 2001). In a Finish study, the odds of contracting ketosis during the first 39 days in milk was higher than cows beyond 39 days postpartum (Schnier et al., 2002).

Proceedings 3rd Florida & Georgia Dairy Road Show (2006) 22
Economic losses from ketosis include treatment of clinically ill cows, lost milk production, increased days open, and increased culling, and were estimated to total approximately $145 per case (Guard, 1994). Seven studies found short- or long- term reduction in milk yield associated with clinical ketosis, whereas four reported no losses (Fourichon et al., 1999). Five studies found losses associated with ketotic status according to a diagnostic test, whereas two reported no losses (Fourichon et al., 1999). These discrepancies might be explained by the different statistical methods used to analyze the effect of the disease on milk production. Rajala-Shultz et al. (1999), using repeated measures, based on a mixed model with a special parametric structure for the covariance matrices, found a significant negative effect of ketosis on milk production. The milk-reducing effect started even before the diagnosis of clinical ketosis. Milk losses continued for at least 2 weeks after diagnosis and the overall losses during the entire lactation ranged from 126 kg in parity 1 to 535 kg in parity 4 and an average total loss per cow of 353 kg. Daily milk loss within the first two weeks after diagnosis was 3.0, 4.0, 3.3, and 5.3 kg/d for parities 1, 2, 3, and 4 or higher, respectively. In parity 4 or higher, the milk loss continued for the rest of the lactation. This could be an indication that the energy requirements of the cow were not met. However, healthy cows overall produced less milk than ketotic cows in the same parity. This might indicate that cows with ketosis are, in general, higher yielding and that the milk loss often is only temporary. The same conclusion was observed in New York Holstein cattle when they did a modeling of the effect of ketosis on milk yield, using a mixed model with four different covariance structures Gröhn et al., (1999). By using projected 305-day milk yield, ketosis had no effect on milk production; but by using a monthly test-day milk as a repeated measurements and four covariance structures, ketotic cows yielded significantly less milk per day both before and immediately after diagnosis than did non-ketotic cows. In another study, Østergaard and Gröhn (1999), in Danish cattle, found that ketotic cows had significantly higher milk yield before the disease that did healthy cows. Multiparous cows lost between 1.5 and 4.2 kg/day of milk between 1 to 4 weeks after diagnosis of ketosis. Furthermore, the body weight of cows with ketosis was lower after diagnosis than was that of healthy cows. In Swiss cattle, a significant decrease in milk production (442 to 654 kg of energy-corrected milk/305-day period per cow) was associated with acetone or BHB in excess of threshold values of > 0.40 mmol/L and > 2.3 mmol/L, respectively (Reist et al., 2003).
The effect of ketosis on fertility has been described by Andersson et al., (1991).
They found, in Swedish cattle, that the interval from calving to first service was about 5 days longer in cows with acetone concentrations > 2.0 mmol/L, while the interval to the last service was shortest at 0.40 to 1.0 mmol/L. The risk for cystic ovaries was markedly increased (odd ratio = 8.7) in first lactation cows with acetone concentrations > 2.0 mmol/L. In herds with a high incidence of ketosis, primiparous cows had a period 6 days longer from calving to first service and the period from calving to the last service was 12 days longer than normal cows. Recently, Gillund et al. (2001), found in a Norwegian herd producing 6,175 kg milk/cow/lactation that 20% of the animals were ketotic as measured by an Acetone test. The mean days in milk for the first occurrence of ketosis was 29.4. Cows that did not experience an event of ketosis before first insemination were 1.6 times more likely to conceive than cows that were ketotic during this early

Proceedings 3rd Florida & Georgia Dairy Road Show (2006) 23
postpartum period. Ketotic cows had higher BCS than healthy cows before the disease was diagnosed and lost more BCS than did the latter after ketosis had occurred. Finally, the interval from calving to conception or number of services per conception did not differ between ketotic and nonketotic cows. In a Swiss study (Reist et al., 2003), high milk acetone concentration (>0.4 mmol/L) was associated with 3.2 times higher risk of endometritis. Low plasma glucose, high serum BHB (> 2.3 mmol/L) and high milk acetone concentrations (> 0.4 mmol/L) during the first week after parturition were indicators of increased risk for ketosis later during lactation. High BCS (> 3.5; scale 1-5) prior to parturition was associated with high concentrations of ketones in both milk (acetone > 0.4 mmol/L) and serum (BHB > 2.3 mmol/L). Cows with high BCS prepartum were 3.77 (CI 95%: 1.63-8.71) times more likely to have milk acetone levels > 0.4 mmol/L and 6.54 (CI 95%: 2.0-21.4) times more likely to have serum BHB levels > 2.3 mmol/L during the first week postpartum.
The effect of ketosis on culling was determined described in Holstein cattle in
New York State by two groups of researchers in two different time periods (Milian-Suazo et al., 1988; Gröhn et al., 1998) They found that ketotic cows were more likely to be culled throughout lactation than were nonketotic cows. However, Gillun et al. (2001) in Norway found no difference in culling rate between ketotic and nonketotic cows.
During early lactation dairy cows experience a typical negative energy balance
characterized by mobilization of NEFA from adipose tissue (Goff and Horst, 1997b; Herdt and Gerloff, 1999; Herdt, 2000). This is explained by low DMI at parturition and slower increase in DMI than in milk production during the early postpartum period. Energy required for maintenance and milk production exceeds the amount of energy the cow can obtain from dietary sources (Goff and Horst, 1997b).
Herdt and Gerloff, (1999) establish that distinct metabolic types of ketosis might
exist dependent upon hepatic patterns of NEFA metabolism. Glucose availability is an important factor in the pathogenesis of clinical ketosis. When glucose availability is very low, entry of NEFA into a ketogenic liver pathway is favored, but when glucose is high, esterification and fat deposition are favored (Herdt, 2000). Two factors determine glucose availability: (1) rate of gluconeogenesis and (2) availability of gluconeogenic substrate. Rate of gluconeogenesis is increased by the abundance of pyruvate carboxylase during the early transition period followed by increased abundance of phosphoenol pyruvate carboxykinase (PEPCK) during the postpartum period (Greenfield et al., 2000). Rate of gluconeogenesis may be impaired in those cases of ketosis that develop within the first week postpartum. Evidence suggests that hepatic fat accumulation prior to calving may interfere directly or indirectly with gluconeogenesis. It has been reported that activity of PEPCK is decreased in cows that developed fatty liver postpartum (Rukkwamsuk et al., 1999b). In addition, lipid accumulation dramatically decreases ureagenesis with increased blood ammonia concentrations, which decreases gluconeogenesis from propionate but not from alanine (Overton et al., 1999).
The entire process of ketogenesis, from adipose mobilization to mitochondrial
fatty acid transport, appears to be affected by the opposing actions of insulin and
Proceedings 3rd Florida & Georgia Dairy Road Show (2006) 24
glucagon, making the insulin:glucagon (I:G) ratio an important determinant of ketogenesis. Cows in early lactation have low serum insulin concentrations in the face of normal glucagon concentrations, resulting in a reduction in the I:G ratio. This low I:G ratio promotes adipose tissue mobilization and ketogenesis. Ketone bodies, however, appear to stimulate insulin secretion and therefore may raise the I:G ratio, creating a negative feedback on ketone body production (De Boer et al., 1985; Herbein et al., 1985; Herdt, 2000). The net result of these changes and balances is that during periods of negative carbohydrate and energy balances, ruminants normally have moderately elevated blood ketone body concentrations and moderately depressed blood glucose concentrations (Herdt and Emery, 1992; Herdt, 2000).
In average in cows, dry matter intake decreases precipitously by 30% on day 1 or
2 before calving and does not recover until 1 to 2 days after calving. Liver triglycerides (TG) are increased 6 fold by the day of calving (11.8% DM) as compared before calving. By 4 weeks into lactation the liver TG are 5 fold higher than before calving (10.2% DM). Plasma NEFA are 5 (1.1 mEq/L) and 1.5 (0.36 mEq/L) times prepartum levels (25 d prepartum; 0.2 mEq/L) at calving and 35 days postpartum, respectively (Bremmer et al., 2000). Triglyceride and lipid accumulation in the liver is a much earlier phenomenon than previously assumed. Elevation of plasma NEFA concentrations starts prior to DMI depression, on day 5 before parturition. Liver TG infiltration does not occur until the concentration of plasma NEFA is maximized on day 1 after calving (Vazquez-Añon et al., 1994). One explanation for this phenomenon is that the rate of hepatic acid esterification exceeds the rate of TG disappearance via hydrolysis plus the export of newly synthesized TG as very low density lipoprotein (Grummer, 1993; Hocquette and Bauchart, 1999). Identification of the biochemical mechanism that limits efficient hepatic oxidation of fatty acids remains elusive (Goff and Horst, 1997b). One of the theories was that microsomal TG transfer protein (MPT), which is responsible for transfer of TG into the growing VLDL particle, might be deficient or inactive in ruminant liver. However, Bremmer et al (2000) found no correlation between MTP activity, mass, or mRNA with either liver TG or plasma NEFA on d 2 postpartum. They concluded that MTP probably does not play a role in the etiology of fatty liver that occurs in dairy cows at calving. Fatty liver can occur very rapidly. Within 48 hours, hepatic TG levels can increase from less than 5% wet weight to more than 25% under conditions of extreme adipose mobilization (Gerloff and Herdt, 1999).
Ketosis cases that develop later during lactation, near the time of peak milk
production, may be of a different metabolic type. Gluconeogenic substrates are simply insufficient to meet the demands of milk production. This results in high NEFA concentrations, with a large portion being directed into ketogenesis, rather than esterification. This kind of ketosis is not responsive to experimental glucagon therapy (Herdt and Gerloff, 1999). Plasma glucose increased 11.5 and 9.0 mg/dl during week 1 and 2 after glucagon infusions. Nonesterified fatty acids and BHB were not affected (She et al., 1999; Hippen et al., 1999a). However, in another experiment, Hippen et al. (1999b), demonstrated that glucagon decreased the degree of fatty liver in early lactation and the incidence of ketosis after alleviation of fatty liver. Membrane fatty acid composition in liver could impact regulation of NEFA and glucose metabolism in the

Proceedings 3rd Florida & Georgia Dairy Road Show (2006) 25
liver (Drackley et al., 2001). In cows with fatty liver, content of C 18:1 increased and C 18:2 decreased relative to prepartum values. In addition, elevated concentration of circulating NEFA is associated with increased liver concentrations of palmitic, oleic, and linoleic acids, but not stearic acid (Rukkwamsuk et al., 1999c; 2000).
Methods of diagnosis of ketosis-fatty-liver complex deserve attention. Ketosis is
usually diagnosed based on clinical sings and the level of ketone bodies in urine or milk. Subclinical ketosis is determined not simply by the presence of ketone bodies, but an abnormal level of circulating ketone bodies (Duffield, 2000). Ketone bodies can be measured in blood, urine and milk. In Table 2.4 ketone body concentration from different studies are reported.
Table 2.4. Ketone body concentrations for clinical and subclinical ketosis according to different authors.
Reference Class Ketone body and level Sauer et al., 1989 Anderson et al., 1991 Gustafsson et al., 1993 Gustafsson and Emanuelson, 1996 Shpigel et al., 1996 Duffield,et al., 1998a Geishauser et al., 1998 Jorritsma et al., 1998 Al-Rawashdeh, 1999 Green et al., 1999 Herdt and Gerloff, 1999 Geishauser et al., 2000 Heuer et al., 2001 Melendez et al., 2002a
subclinical hyperketonemic hyperketonemic hyperketonemic clinical subclinical subclinical subclinical mild ketonemia severe ketonemia subclinical clinical subclinical subclinical hyperketonemia
lood,ketones >0.9 mmol/L milk, Ac > 0.4 mmol/L milk, Ac > 2.0 mmol/L milk, Ac > 1.4 mmol/L urine, AcAc > 60 mg/dL serum, BHB >1.2 mmol/L serum BHB > 1.2 mmol/L milk, BHB 1.0 mmol/L serum, BHB 0.9-1.7 mmol/L serum, BHB > 1.7 mmol/L serum BHB > 1.2 mmol/L serum, ketones >35 mg/dL serum, BHB > 25 mg/dL seru, BHB > 1.4 mmol/L milk Acetone > 0.4 mmol/L plasma, BHB > 10 mg/dL

Proceedings 3rd Florida & Georgia Dairy Road Show (2006) 26
Table 2.4 continued Reference Class Ketone body and level
Reist et al., 2003 subclinical milk, Acetone > 0.4 mmol/L serum, BHB > 2.3 mmol/L
Ac= Acetone AcAc= acetoacetate BHB= β-hydroxy butyrate Ketones= total ketone bodies (Ac, AcAc, BHB)
When ketone bodies are measured quantitatively, a defined threshold must be used to separate normal animals from those with subclinical ketosis (Duffield, 2000). Several field testing kits have been developed with different sensitivity and specificity values. In Table 2.5 two studies are summarized.
Subclinical ketosis may start at serum BHB concentrations above 1.0 mmol/L
(10.4 mg/dL) and clinical ketosis at 2.6 mmol/L (27 mg/dL), however these levels are extremely variable among animals (Duffield, 2000). Serum concentration of 1.4 mmol/L of BHB (15 mg/dL) or greater in the first 2 weeks postpartum was found to cause a three fold greater risk for cows to subsequently develop either clinical ketosis or abomasal displacement. In addition, cows having serum BHB concentrations at or above 2.0 mmol/L (21 mg/dL) within 7 days prior to the first Dairy Herd Improvement (DHI) test produced over 4 kg less milk on DHI test day (Duffield, 1997). Despite its instability, blood acetoacetate levels have been used by some authors to identify animals with subclinical ketosis (Duffield, 2000). A threshold of 500 µmol/L (5.0 mg/dL) of blood acetoacetate in cows with clinical ketosis has been reported (Baird, 1982). This threshold would approximate 3.9 mmol/L (40 mg/dL) of BHB.

Proceedings 3rd Florida & Georgia Dairy Road Show (2006) 27
Table 2.5. Ketone body field test comparison. Product Ketone body Sample sen(1) spec(2) PV(+)(3) PV(-)(4) Ketolac® (†)
≥ 50 ≥ 100 ≥ 200 ≥ 500 ≥ 1000 Ketolac® (**)
≥ 50 ≥ 100 ≥ 200 ≥ 500 ≥ 1000 Ketostix® (†)
Ketostix® (**)
≥ trace ≥ small ≥ moderate ≥ large ≥ very large Ketocheck®(†)
Utrecht powder® (†)
Bioketone ® (†)
Pink Test® (#) ≥100 ≥300 Ketolac® (#) ≥50 ≥100 ≥200 Uriscan® (#)
≥500 Rapignost® (#) ≥500
BHB (µmol /L ) BHB (µmol /L ) Acetoacetate (*) Acetoacetate (*) Acetoacetate (*) Acetoacetate (*) Acetoacetate (*) Acetoacetate (µmol /L ) BHB (µmol /L ) Acetoacetate (µmol /L ) Acetoacetate (µmol /L )
Milk Milk Urine Urine Milk Milk Milk Milk Milk Milk Milk
91.9 72.4 44.8 17.2 3.4
88 73 27 3 2
4.6
90 78 49 12 4
27.6
42.5
33.3
76 38
91 80 59
13
3
54.9 89.4 96.8 100 100
90 96 99
100 100
100
86 96 99
100 100
100
100
99.8
93 98
56 76 90
100
100
28.8 42.7 73.6 100 100
100
100
100
96.7
60 78
21 30 43
0
0
97.2 94.3 89.8 85.9 84.0
84.2
87.5
89.8
88.4
96 92
98 97 94
90
91
(1): Sensitivity; (2) : Specificity; (3) : Positive Predictive Value; (4) : Negative predictive Value; (†) : Geishauser et al., (1998); (#) : Geishauser et al., (2000); (**) : Carrier et al., (2004); (*) : Qualitative test (yes/no)

Proceedings 3rd Florida & Georgia Dairy Road Show (2006) 28
Potential therapeutic approaches to fatty liver include (1) limiting the fatty acid supply by limiting adipose mobilization, (2) limiting hepatic fractional extraction (uptake) of fatty acids, (3) increasing oxidative metabolism of fatty acids, or (4) increasing the rate of triglyceride secretion from the liver (Herdt and Emery, 1992).
Treatment of ketosis is based on agents that reestablish a normal appetite and
restore normal blood concentrations of glucose and ketone bodies (Herdt and Gerloff, 1999).
Administration of 500 mL of 50% glucose or dextrose solution, intravenously, is a
common therapy for bovine ketosis (Herdt and Emery, 1992). Other therapeutic alternatives are glucose precursors. They can be administered orally to ruminants. These include glycerol, propylene glycol and propionate. Glucocorticoid therapy is also effective. Ketotic cows treated with glucocorticoids are less subject to relapses than are those treated with IV glucose alone, although relapses can still occur (Herdt and Gerloff, 1999). Dexamethasone and 9-Flurprednisolone acetate at a dose of 1.33 mg/45 kg body weight and Flumethasone at a dose of 0.33 mg/45 kg of body weight are recommended (Herdt and Emery, 1992). Insulin, in conjuction with glucocorticoids, may be a more effective therapy. Insulin is a powerful antiketogenic agent and also suppresses NEFA mobilization. A long acting form of insulin should be used at a dose of 200 to 300 IU per animal, repeated as necessary at 24 to 48 hours intervals. Glucocorticoids or other agents have to be provided to counteract the hypoglycemic effects of insulin (Herdt and Gerloff, 1999).
To prevent ketosis-fatty liver complex, fat cows at parturition should be avoided.
Dry cows should be fed a diet to maintain weight, not to lose weight (Gerloff and Herdt, 1999). Cows overfed during the dry period have higher concentrations of plasma postpartum NEFA as a result of greater lipolysis after parturition. Cows experiencing more severe negative energy balance results in a high liver TG concentration (Grummer, 1993; Rukkwamsuk et al., 1998, Rukkwamsuk et al., 1999a). Rukkwamsuk et al. (1999a) demonstrated that cows overfed before parturition, had lower percentages of oleic acid and higher percentages of linoleic acid than normal cows in liver, but percentages of other fatty acids were similar. One week after parturition the percentages of palmitic and oleic acids were higher than one week before parturition. They concluded that the increased lipolysis after calving increased the hepatic TG concentration and shifted hepatic fatty acid composition. Kaneene et al. (1997) showed that metabolic events related to negative energy balance were related to increased risk of metritis and RFM. Higher energy consumption during the last weeks of the dry period (more grain content of the ration) was related to reduced disease risk at parturition. Finally, they concluded that serum NEFA and cholesterol concentrations have potential as indicators of disease risk in dairy cows.
Scoring the body condition of the cows at dry-off and managing the nutritional
program of transition cows is a useful tool to avoid fatty liver development and related problems (Gerloff and Herdt, 1999). Two adequate body condition score charts are available for Holstein dairy cattle. One chart was developed by Edmonson et al. (1989)
Proceedings 3rd Florida & Georgia Dairy Road Show (2006) 29
and the other was developed by Ferguson et al. (1994). It has been demonstrated that high body condition score at parturition negatively affects reproductive parameters, milk yield and health of the cows during the current lactation (Butler and Smith, 1989; Domecq et al., 1997a; Domecq et al., 1997b; Markusfeld et al., 1997; Heuer et al., 1999).
Niacin is a vitamin belonging to the B group. As an additive it can reduce lipid
mobilization during early lactation, minimize incidence of ketosis and improve milk yield and fat synthesis (Hutjens, 1991). In several studies in which 6 to 12 g/day of niacin was supplemented to dairy cows fed diets with added fat, niacin increased milk production and concentration of milk fat and protein. Niacin or nicotinic acid has been also suggested as a treatment or preventive for fatty liver in dairy cows during the prepartum period; but there is little research evidence to confirm its use as a preventive agent for fatty liver (Gerloff and Herdt, 1999). Niacin is antilipolytic and may decrease plasma concentrations of NEFA and BHB (Dufva et al., 1983). Nevertheless, in another study, niacin either alone or in combination with high dietary non-fiber carbohydrates (NFC), did not influence lactation performance or metabolic status of cows. Increased dietary NFC significantly lowered plasma NEFA and BHB concentrations, and significantly elevated liver glycogen (Minor et al., 1998). In another study, Drackley et al. (1998) determined that nicotinic acid increased NEFA when it was added to a control diet but decreased NEFA when it was added to a diet supplemented with fat. Although data seem to be controversial with respect to niacin in transition cows, the addition of 6 to 12 g/d of niacin to diets during the first 2 to 3 month of lactation has been recommended. Heavier dairy cows (BCS > 3.5) have shown optimal response; thin cows are less responsive. Niacin should be supplemented 2-3 weeks before parturiton to 10-12 weeks after parturition, but it should be analyzed on a cost vs response basis (Hutjens, 1992).
Propylene glycol is a glucogenic compound used to treat ketosis in postpartum
dairy cows (Studer et al., 1993). A high proportion of propylene glycol by-passes the rumen and is absorbed in the small intestine; the rest is metabolized to propionate. Ruminal molar percentage of acetate decreased and acetate to propionate ratio also decreased as propylene glycol dose was increased, indicating ruminal conversion of propylene glycol to propionate (Grummer et al., 1994; Christensen et al., 1997). In liver, propylene glycol is converted to glucose, primarily via the lactaldehyde pathway and subsequent oxidation to lactate (Nelson and Cox, 2000).
Recommended doses of propylene glycol have been in the range of 250 to 400
g, administered orally, twice a day (Herdt and Gerloff, 1999). Toxicity has been seen with higher doses. Neurological symptoms develop in 2 to 4 hours and resolved by 24 hours after dosing. Ataxia is typical. Depression and recumbence are also experienced. Serum and cerebrospinal fluid osmolality is increased. The median toxic dose of propylene glycol in cattle is 2.6 g/kg of body weight (Pintchuk et al., 1993).
Administration of propylene glycol before parturition has demonstrated to
decrease hepatic fat accumulation and ketone bodies formation. One liter of propylene glycol given orally once daily during the last 10 days prepartum increased plasma

Proceedings 3rd Florida & Georgia Dairy Road Show (2006) 30
glucose in the treated group before parturition, but glucose levels were similar between treated and control group, after calving. Plasma NEFA concentration was 403 and 234 �M, and plasma insulin concentrations were 0.354 and 0.679 ng/ml for control and treated cows, respectively from 1 to 7 days prepartum. Plasma NEFA tended to be lower in treated cows at 1 to 21 days post partum. In the treated group, hepatic TG accumulation was reduced 32 and 42% at 1 and 21 days post partum, respectively. Prepartum plasma glucose, NEFA, BHB and insulin were strongly correlated with liver TG at 1 day postpartum (r = -0.49, 0.45, 0.36, and -0.49, respectively). Milk production and composition through 21 days postpartum were not different between the treated and control groups (Studer et al., 1993). Grummer et al., (1994) conducted an experiment to determine the effectiveness of various doses of propylene glycol in reducing plasma NEFA concentrations during restriction of feed intake in pregnant Holstein heifers 90 days prior to calving. The results showed that propylene glycol linearly increased glucose and insulin and decreased BHB and NEFA in blood. They concluded that the dose of 296 ml of propylene glycol was almost as effective as a dose of 887 ml in reducing lipid mobilization during restricted feed intake. After that, the same research group (Christensen et al., 1997) demonstrated that administration of propylene glycol as an oral drench or mixed with concentrate resulted in higher serum insulin and lower plasma NEFA concentrations than did feeding propylene glycol as part of a TMR system. Finally, Laranja da Fonseca et al. (1998) found that cows fed 300 mg/d propylene glycol orally had an increased milk yield of 2.5 kg/day, glucose was similar, BHB was lower by almost 2 mg/dl and NEFA were lower by 0.031 mEq/L than cows without the supplement; however these differences were not statistically significant.
Propionate is produced in the rumen after fermentation of starch, fiber, and
protein. It is the major glucose precursor in ruminants that are in positive energy balance and is the major substrate used for gluconeogenesis, followed by lactate and amino acids. Its contribution to total glucose production has been consistently measured at 30 to 50%. Most of the propionate absorbed from the rumen is metabolized in the rumen epithelium or liver. (Herdt, 1988). A small portion escapes hepatic and rumen epithelial metabolism, passes into the systemic blood circulation, and is extracted by peripheral tissues (Miettinen and Huhtanen, 1996).
After being absorbed by the rumen epithelial wall, propionate is transported via
the portal vein to the liver where it is converted to glucose via pyruvate and oxaloacetate. Propionate decreases the ruminal absorption of acetate and butyrate. Propionate is incorporated into the Krebs cycle through succinyl coenzyme A and is converted to oxaloacetate and finally to glucose by the liver (Casse et al., 1994). In Figure 2.1 major energy biochemical pathways in cattle are summarized.
Nutritionally, propionate can be supplied orally in the form of sodium propionate
or calcium propionate. Calcium propionate has been studied as a calcium-energy substrate for dairy cows (Melendez et al., 2002a). Calcium propionate is a gluconeogenic precursor as well as a source of calcium, which will be absorbed by the small intestine and may help to prevent clinical and subclinical hypocalcemia (Goff et al., 1996). Calcium propionate is a compound poorly fermented by the rumen

Proceedings 3rd Florida & Georgia Dairy Road Show (2006) 31
microorganism. At parturition, calcium propionate increases blood glucose 24 hrs after its administration, and reduces BHB and NEFA during the first two days postpartum. Furthermore, calcium propionate increases blood calcium, reduces the incidence of clinical and subclinical hypocalcemia and increases milk yield by 3.8 kg/d during the first 2 weeks after calving (Higgins et al., 1996). In transition cows fed anionic salts prepartum, a calcium propionate (510 g) plus propylene glycol (400 g) drench did not affect postpartum concentrations of Ca, P, Mg, glucose, NEFA, or BHB (Melendez et al., 2002a).
Transition Cow Feed Management
Feeding a cow during the transition period is a challenge due to the nutritional
and physiological changes that occur during this period (Grummer, 1999). Just recently nutrient requirements for transition dairy cows have been defined (NRC, 2001). This information was possible based on research that has been abundant during the past five years. There have been tremendous changes in how to approach dry cow nutrition, particularly in the areas of dry matter intake, protein and energy requirements, metabolic diseases and the most effective ways to group and manage dry cows. Critical physiologic events that have to be targeted during the transition period include adaptation of the rumen to the higher energy diet that will be fed in early lactation, maintenance of normal blood calcium concentration, a strong immune system throughout the peripartum period, and maintenance of a slightly positive energy balance up to the time of calving (Goff and Horst, 1997b; Oetzel, 1998).
Energy
Energy balance of a transition cow is determined by subtracting energy requirements for maintenance and gestation from energy intake. During the transition period, feed intake is decreasing at a time when energy requirements are increasing due to growth of the conceptus. Consequently, to maintain the energy balance the energy density of the diet should increase (Grummer, 1999). In Figure 2.2 the net energy of lactation (NEl) needed in diets of cows and heifers to meet requirements for maintenance and gestation during the transition period is shown. Heifers need higher dietary energy density due to lower feed intake and the additional energy requirements to support growth (NRC, 2001).
Increasing energy density may stimulate papillae growth and increase acid
absorption from the rumen, adapt the microbial population to higher starch diets, increase blood insulin, decrease fatty acid mobilization from adipose tissue and increase dry matter intake (Grummer, 1999).
Grain has to be introduced to the cow’s ration for at least 3 weeks before the due
date and for heifers this should be 5 weeks. The energy density should be between 1.56-1.62 Mcal/kg of NEl (NRC, 2001).

Proceedings 3rd Florida & Georgia Dairy Road Show (2006) 32
Increasing dietary NFC or decreasing NDF during the transition period stimulates DMI. When energy density of the diet increased from 1.3 to 1.54 Mcal ENl/kg DM and crude protein increased from 13 to 16% at about 3 weeks prior to calving, DMI increased in 30% (Emery, 1993). Plasma fatty acids decreased from 346 to 228 �M and liver triglyceride decreased from 15 to 9 mg/g wet tissue (Dyk et al., 1995; VandeHaar et al., 1995). In another study, cows fed high NFC (40-42%) diets consumed more dry matter during the prepartum period, had lower plasma NEFA, had reduced BHB level and there was a reduction in liver triglyceride (Minor et al., 1996). Finally, VandeHaar et al. (1999) found that increasing nutrient-density of prepartum diets did not decrease DMI. There were less NEFA in plasma (176 ws. 233 �M) and more insulin-like growth factor-I (472 vs. 390 ng/ml plasma) during the last two weeks prepartum and less triglyceride in liver at parturition (0.9 vs. 1.5% wet tissue basis). They concluded that increasing the energy and protein density up to 1.6 Mcal of NEl/kg and 16% CP in diets during the last month before parturition improves nutrient balance of cattle prepartum and decreases hepatic lipid content at parturition.
Protein
The results about crude protein levels in precalving cows are controversial. Curtis et al. (1985) indicated that feeding protein above NRC (1989) during the final 3 weeks prepartum decreased the risk of RFM and uncomplicated ketosis. Mahanna (1997) recommends increasing CP to 14.5% - 15.5% to begin preparing for high DMI during the lactation phase. However, Santos et al. (1999a,b) found precalving heifers fed CP up to 14.7% benefited with higher milk yield and milk fat production, but precalving cows did not benefit from a diet with more than 12.7% CP. In other studies, feeding higher protein during the transition period reduced feed intake or milk yield postpartum (Crawley and Kilmer, 1995; Donkin et al., 1998).
Minerals and Vitamins
Minerals are essential for production, reproduction and life of the animals. The daily dietary requirement is dependent on the amount of dietary mineral that is absorbed into the tissues (Goff, 2000). The requirement of the cow can be described by: Dietary Requirement = maintenance + pregnancy + growth + lactation
Absorption co-efficient In this equation, the upper portion can be obtained from NRC (2001) or other
table requirements. However the real challenge is to determine the co-efficient of absorption for the minerals.
Coefficient of absorption for Ca was 0.38 in NRC (1989) and 0.45 in NRC (1978).
ARC (1980) determined a co-efficient of 0.68. Maybe a single coefficient is not appropriate. Availability of Ca in forages, concentrates or mineral supplements is different (Goff, 2000).

Proceedings 3rd Florida & Georgia Dairy Road Show (2006) 33
Coefficient of absorption for P was 0.50 in NRC (1989) and 0.65 in NRC (1978). Rest of the world use 0.60 to 0.75.
The average coefficient of absorption for Mg from a wide variety of natural
feedstuffs fed to ruminants averaged 0.294 with a standard deviation of 0.135. The co-efficient of absorption for Mg from inorganic sources should be 0.50 based on Mg oxide. The coefficient for Mg absorption should be decreased when K is high in the diet (Goff, 2000).
Dietary Cl is absorbed with at least 80% and closer to 100% efficiency. Often Cl
anions accompany the movement of Na cations (Goff, 2000). Plants contain only small amount of Na. Salt needs to be added to the diet, otherwise cows produce less milk. Animals can tolerate very high levels of salt in the diet if water is provided and kidneys are functioning. High dietary NaCl will reduce feed intake in animals (Goff, 2000).
Nearly all of the dietary K is absorbed. Intracellular uptake of K following a meal
helps buffer blood K concentration. The factorial approach as described for Ca, P and Mg does not work for Na, K and Cl (Goff, 2000).
Rumen microbes need 0.2-0.22% S to operate efficiently. Excessive dietary S
can interfere with absorption of Cu and Se and may become toxic (Goff, 2000). Cobalt is a component of vitamin B12. Microbes in rumen are the only natural
source of vitamin B12. Rumen microbes need 0.11% Co to perform efficiently (Goff, 2000).
Between 1 and 5% of dietary Cu will be absorbed by adult cattle. A diet high in
Zn (>1000 mg/kg), S and Mo can block Cu absorption. The Cu:Mo ratio should be 2:1 (Goff, 2000).
Selenium is part of glutathione peroxidase and in conjunction with vitamin E act
as antioxidant compounds. Selenium is also critical to thyroid hormone metabolism. Selenium can cause deficiency or toxicity. Diets containing 0.1 ppm of Se are recommended but field studies suggest this is not enough. Legally Se can be added up to 0.3 ppm (Goff, 2000).
Depending on the DMI the dietary requirement of iodine should be about 0.25-0.5
mg/kg DM (Goff, 2000). Iron excess (250-500 mg Fe/kg DM) interfere with Cu and Zn absorption. NRC
(1989) recommends dietary Fe not to exceed 1000 mg/kg DM. This may be too high (Goff, 2000).
Chromium is essential for normal glucose metabolism. The amount of Cr
required in the diet for optimal performance is unclear. More research is required (Goff, 2000).

Proceedings 3rd Florida & Georgia Dairy Road Show (2006) 34
The dietary coefficient of absorption for Zn is estimated to be 0.15. The major dietary factors that can modify the efficiency of absorption of dietary Zn are interactions of Zn with other metal ions (Cu, Fe) and the presence of organic chelating agents in the diet (Goff, 2000).
The proportion of Mn absorbed from the diet generally is between 0.5 and 1%.
High dietary Ca, K or P increase Mn excretion in feces (Goff, 2000). Mahanna (1997) recommends 0.3 ppm of Se dry matter basis. Potassium should
be not over 1.0% in the total ration for dry cows, but K , Na and Mg should be 1.5, 0.5 and 0.35% of DM respectively in milking cows during heat stress. Nitrogen to sulfur ratio should be 11 to 13:1 in the total ration to meet rumen bacterial needs. Goff and Horst (1998a) recommend that dietary magnesium should be set at 0.4% (higher than NRC, 1989). Magnesium sulfate or magnesium chloride is recommended because they could be an effective source of anions and magnesium.
Furthermore, the diet should supply between 35 to 50 g of phosphorus daily
(~0.4%). More than 80 g of P/day will inhibit renal synthesis of 1,25-dihydroxyvitamin D which can induce MF. Dietary S should not exceed 0.4%. Adding more sulfate is a poor choice because it is fairly ineffective acidifying agent. Dietary Cl can nearly always be raised to 0.5% with little effect on dry matter intake. High dietary Ca concentrations (1.0-1.2%) are desirable with anionic salts. Good results have been achieved by feeding as high as 180 g Ca/day . In one study, Joyce et al. (1997) determined that pre-calving cows fed diets based on alfalfa (typically high in Ca) with a DCAD of – 7 had the lowest urine pH prepartum and the highest concentrations of ionized Ca in blood. Also, this group experienced the lowest incidence of calving related disorders. Results indicated that alfalfa when supplemented with anionic salts is a viable forage for prepartum dairy cows.
Vitamin levels should be met to optimize milk production. Vitamin A should be
provided at rate of 3600 IU per kg DM/day. Vitamin D 900 IU per kg/DM day and vitamin E 14 IU per kg/DM day (Mahanna, 1997).

Proceedings 3rd Florida & Georgia Dairy Road Show (2006) 35
Table 2.6. Minimum requirements for dry, prepartum and fresh cows. Nutrient Far-off Close-up Fresh
Dry matter intake (kg/day) 14.4 13.7 16.1 Net Energy for lactation (Mcal/day) 1.25 1.54-1.62 1.73
Maximum crude fat (%) 5 6 6 Crude Protein (%) 13 14-15 16.5-17.5
Undegradable intake protein (% CP) 25 32 40 Acid detergent fiber (%) 21 17-21 17-21
Neutral detergent fiber (%) 33 25-33 25-33 Minimum Forage NDF (%) 30 22 20
Maximum NFC (%) 36-43 36-43 36-44 Minimum Calcium (%) 0.44 0.45 0.75
Phosphorus (%) 0.22 0.3-0.4 0.3-0.4 Ca:P ratio 1.5:1 to 5:1 1.5:1 to 5:1 -
Magnesium (%) 0.20 0.35-0.4 0.23-0.29 Potassium (%) 0.55 0.55 1.2
Sulfur (%) 0.11 0.11 0.2 Sodium (%) 0.10 0.10 0.32 Chlorine (%) 0.20 0.8-1.2 0.30
DCAD (mEq/kg) - < 0 Source: NRC (2001). Table 2.7. Minimum trace mineral and vitamins requirements for dry, prepartum and fresh cows.
Nutrient Far-off Close-up Fresh
Cobalt (ppm) 0.11 0.11 0.11 Copper (ppm) 16 16 16 Iodine (ppm) 0.4 0.4 0.8 Iron (ppm) 26 26 20
Manganese (ppm) 22 22 17-21 Selenium (ppm) 0.30 0.30 0.3
Zinc (ppm) 30 30 77-73 Vitamin A (IU/kg) 5500 6500 5500 Vitamin D (IU/kg) 1500 1700 1500 Vitamin E (IU/kg) 80 88 40
Source: NRC (2001). Dry Cow Feed Management and Body Condition Score
Body condition scoring is a useful tool for monitoring the nutritional management
of dairy cows (energy density and intake). Using a scale 1 to 5 (Edmonson et al., 1989; Ferguson et al., 1994) a program can be established. Beede (1997) recommends that, at dry-off, cows should have a BCS 3.0 to 3.25. If BCS is lower, the ration should be adjusted during the last 100 days of lactation and not during the dry period. If many

Proceedings 3rd Florida & Georgia Dairy Road Show (2006) 36
cows are over-conditioned, a fat cow group for late lactation should be established and a diet containing 1.54 Mcal/Kg NEl/DM or less should be fed. If many cows are underconditioned a thin cow group should be established and a diet with proper NEl content to target the desired weight gain should be fed (one unit BCS ≈ 57 kg BW).
Cows should have a total dry period length of at least 6 to 8 weeks. A dry period
of less than 6 weeks results in lower milk yields in the next lactation (Funk et al., 1987). Two groups of dry cows are recommended; the early dry group (8 to 3 weeks
before expected calving) and a close-up group (3 weeks to calving). If early dry cows are in proper condition and eating more than predicted to meet their requirements, it may be necessary to lower the energy and nutrient density of the ration by re-formulating the diet. Never try to reduce BCS or body weight of dry cows during any stage of the dry period ( Beede, 1997). If BCS is correct at dry-off (3.0-3.25) then cows should gain about 0.3-0.45 kg/d to increase BCS by 0.25 to 0.35 units during the early period.
In the close-up period, if DMI is around 11.3 kg or higher, a diet containing 1.6
Mcal/kg NEl but no higher, and 14-15% of Crude Protein should be fed (NRC, 2001). A separate close-up group for pregnant heifers might be a beneficial management strategy in farms if adequate facilities are available (Grant and Albright, 1995). Diet formulation should be based on 10 to 11 kg of DM intake. If cows are overeating it is not a big problem because this is a short period of time. Cows should be in a positive energy status and not losing weight. Feed should always be available in the bunk (24 h a day) in a form of TMR to ensure adequate control of nutrient composition and consumption. Fermentable grains (coarsely ground dry corn, hominy, or high moisture corn) to enhance development of the ruminal epithelia should be fed (Beede, 1997). Cows should calve with a BCS of 3.5-3.75 and heifers 3.25-3.5 to minimize obstetrical trauma (Beede, 1997; Studer, 1998; Grummer, 1999).
Fresh Cow Feed Management and Body Condition Score
The primary goal for early fresh cows is to maximize carbohydrate, protein and nutrient intake and provide adequate fiber to meet requirements for increasing milk production (Beede, 1997).
Mahanna (1997) recommends that cows should reach maximun daily DMI no
later than 10 weeks postpartum. Cows milked three times a day should eat about 5 to 6% more DM per day. For every 1 kg of expected milk production cows should eat at least 0.45 kg of DM. Eating less than this causes excessive body condition loss. Forage DM intake should be near 2% of the cow’s BW. Acid detergent fiber should be at least 19-21% and NDF at least 28-30% or 0.9% of BW. Particle size should be long enough to stimulate 30 minutes of cud chewing time per kg of DM. Total mixed ration DM content should be between 50 to 75%. Cows should reduce their DMI about 3.3% for every 1°C over 24°C. Heat stress starts when the temperature exceeds 26.7 °C and

Proceedings 3rd Florida & Georgia Dairy Road Show (2006) 37
relative humidity exceeds 80%. Clean water should be provided expecting cows to drink 2 liters for each 0.45 kg of milk. Enough feed bunk space should be also provided.
Cows should peak in milk production 8 to 10 weeks after calving. First-calf
heifers should peak within 75% the production of older cows. For each extra 1 kg of milk at peak production the average cow will produce 200 to 220 kg more milk for the entire lactation period. Milk protein:fat ratio should be near 0.85-0.88 for Holstein cows. Forage intake using a good quality roughage should be maximized.
Energy density of the top cows should be 1.76 Mcal/kg of ENl. Non fiber
carbohydrates levels should be between 35 and 42% with 25 and 35% starch in the total ration.
Cows should not lose more than 1 BCS during early lactation. Last third of
lactation should be used to replace lost body condition. In Table 2.11 target BCS according to Byers (1999) are shown. Table 2.8. Target Body Condition Scores (BCS) Scale 1-5.
Stage Ideal BCS Range Dry-off 3.5 3.25-3.75 Calving 3.5 3.25-3.75
Early lactation 3 2.5-3.25 Mid-lactation 3.25 2.75-3.25 Late lactation 3.5 3.0-3.5
Growing Heifers 3 2.75-3.25 Heifers at calving 3.5 3.25-3.75
Source: NRC(2001).
Reference List
Agricultural Research Council. 1980. The nutrient requirements of ruminant livestock. Slough, U.K.: Commonwealth Agricultural Bureaux.
Al-Rawashded, O.F. 1999. Prevalence of ketonemia and associations with herd size, lactation stage, parity and postparturient diseases in Jordanian dairy cattle. Prev. Vet. Med. 40:117-125.
Allen, M. S. 2000. Effects of diet on short-term regulation of feed intake by lactating dairy cattle. J. Dairy Sci. 83:1598-1624.
Anderson, L. 1988. Subclinical ketosis in dairy cows. Vet. Clin. North Am. Food Anim. Pract. 4:233-251.
Andersson, L., A. H. Gustafsson, and U. Emanuelson.1991. Effect of hyperketonaemia and feeding on fertility in dairy cows. Theriogenology 36:521-536.
Baird, D.G. 1982. Primary ketosis in the high producing dairy cow: Clinical and subclinical disorders, treatment, prevention and outlook. J. Dairy Sci. 65:1-10.

Proceedings 3rd Florida & Georgia Dairy Road Show (2006) 38
Barlett, P. C., J. H. Kirk, M. A. Wilke, J. B. Kaneene, and E. C. Mather. 1986a. Metritis complex in Michigan Holstein-Friesan cattle: incidence, descriptive epidemiology and estimated economic impact. Prev. Vet. Med. 4:235-248.
Barlett, P. C., G. Y. Miller, C. R. Anderson, and J. H. Kirk. 1990. Milk production and somatic cell count in Michigan dairy herds. J. Dairy Sci. 73:2794-2800.
Bauchemin, K. A. 1991. Indigestion and mastication of feed by dairy cattle. Vet. Clin. North Am. Food Anim. Pract. 7:439-464.
Beede, D. K., C. Wang, G. A. Donovan, L. F. Archbald, and W. K. Sanchez. 1991. Dietary cation-anion difference (electrolyte balance) in late pregnancy. Pages 51-55, in Proceedings of 28thAnnual Florida Dairy Production Conference, April 10, 1991, Univ. Florida, Gainesville.
Beede, D. K. 1997. Nutritional management of transition and fresh cows for optimal performance. Pages 19-25. In Proceedings of 34th Annual Florida Dairy Production Conference. University of Florida, Gainesville, April 8-9.
Bell, A. W.1995. Regulation of organic nutrient metabolism during transition from late pregnancy to early lactation. J. Anim. Sci. 73:2804-2819.
Bell, A. W.; W. S. Burhans, and T. R. Overton. 2000. Protein nutrition in late pregnancy, maternal protein reserves and lactation performance in dairy cows. Proc. Nutr. Soc. 59:119-126.
Bertics, S. J., R. R. Grummer, C. Cadorniga-Valino, D. W. LaCount, and E. E. Stoddard. 1992. Effect of prepartum dry matter intake on liver triglyceride concentration and early postpartum lactation. J. Dairy Sci. 75:1914-1922.
Bigras-Poulin, M., A. H. Meek, and S. W. Martin. 1990. Interrelationships of health problems and age on milk production in selected Ontario Holstein cows. Prev. Vet. Med. 8:3-13.
Block, E. 1984. Manipulating dietary anions and cations for prepartum dairy cows to reduce incidence of milk fever. J. Dairy Sci. 67:2939-2948.
Block, E. 1994. Manipulation of dietary cation-anion difference on nutritionally related production diseases, productivity, and metabolic responses of dairy cows. J. Dairy Sci. 77:1437-1450.
Bolinder, A., B. Seguin, H. Kindhal. 1988. Retained fetal membranes in cows: manual removal versus nonremoval and its effect on reproductive performance. Theriogenology 30:45-56.
Bremmer, D. R., S. J. Bertics, S. A. Besong, and R. R. Grummer. 2000. Changes in hepatic microsomal triglyceride transfer protein and triglyceride in periparturient dairy cattle. J. Dairy Sci. 83:2252-2260.
Bruun, J., A. K. Ersbøll, L. Alban. 2002. Risk factors for metritis in Danish dairy cows. Prev. Vet. Med. 54:179-190.
Burton, M. J., R. C. Herschler, and H. E. Dziuk.1987. Effect of fenprostalene on postpartum myometrial activity in dairy cows with normal or delayed placental expulsion. Br. Vet. J. 143:549-554.
Busato, A., D. Faissler, U. Küpfer, and J.W. Blum. 2002. Body condition scores in dairy cows: associations with metabolic and endocrine changes in healthy dairy cows. J. Vet. Med. A 49:455-460.
Butler, W. R., and R. D. Smith.1989. Interrelationship between energy balance and postpartum reproduction function in cattle. J. Dairy Sci. 72:767-783.

Proceedings 3rd Florida & Georgia Dairy Road Show (2006) 39
Cai, T. Q., P. G. Weston, L. A. Lund, B. Brodie, D. J. McKenna, and W. C. Wagner. 1994. Association between neutrophil functions and periparturient disorders in cows. Am. J. Vet. Res. 55:934-943.
Cameron, R. E. B., R. B. Dyk, T. H. Herdt, J. B. Kaneene, R. Miller, H. F. Bucholtz, J. S. Liesman, M. J. Vandehaar, and R. S. Emery. 1998. Dry cow diet, management and energy balance as risk factors for displaced abomasum in high producing dairy herds. J. Dairy Sci. 81:132-139.
Casse, E. A., H. Rulquin, and G. B. Huntington. 1994. Effect of mesenteric vein infusion of propionate on splanchnic metabolism in primiparous Holstein cows. J. Dairy Sci. 77:3296-3303.
Chassagne, M., J. Barnouin, and J.P. Chacornac. 1999. Risk factors for stillbirth in Holstein heifers under field conditions in France: a prospective survey. Theriogenology 51:1477-1488.
Christensen J. O., R. R. Grummer, F. E. Rasmussen, and S. J. Bertics.1997. Effect of method of delivery of propylene glycol on plasma metabolites of feed-restricted cattle. J. Dairy Sci. 80:563-568.
Collard, B. L., P. J. Boettcher, J. C. M. Dekkers, D. Petitclerc, and L. R. Schaeffer. 2000. Relationships between energy balance and health traits of dairy cattle in early lactation. J. Dairy Sci. 83:2683-2690.
Correa, M. T., C. R. Curtis, H. N. Erb, J. M. Scarlett, and R. D. Smith. 1990. An ecological analysis of risk factors for postpartum disorders of Holstein-Friesian cows from thirty-two New York farms. J. Dairy Sci. 73:1515-1524.
Correa, M. T., H. Erb, and J. Scarlett. 1993. Path analysis for seven postpartum disorders of Holstein cows. J. Dairy Sci. 76:1305-1312.
Crawley, D. D., and L. H. Kilmer. 1995. Effect of level and source of rumen degradable protein fed prepartum on postpartum performance of dairy cows. J. Dairy Sci. 78(Suppl. 1):266.
Curtis, C. R., H. N. Erb, C. J. Sniffen, and R. D. Smith.1984. Epidemiology of parturient paresis: predisposing factors with emphasis on dry cow feeding and management. J. Dairy Sci. 67:817-825.
Curtis, C. R., H. N. Erb, C. J. Sniffen, R. D. Smith, and D. S. Kronfeld. 1985. Path analysis of dry period nutrition, postpartum metabolic and reproductive disorders, and mastitis in Holstein cows. J Dairy Sci. 68:2347-2360.
Curtis, C. R.; H. N. Erb, C. J. Sniffen, R. D. Smith, P. A. Powers, M. C. Smith, M. E. White,, R. B. Hillman, and E. J. Pearson. 1983. Association of parturient hypocalcemia with eight periparturient disorders in Holstein cows. J. Amer. Vet. Med. Assoc. 183:559-561.
Dawson, L. J., E. P. Aalseth, L. E. Rice, and G. D. Adams. 1992. Influence of fiber form in a completed mixed ration on incidence of left displaced abomasum in postpartum dairy cows. J. Amer. Vet. Med. Assoc. 200:1989-1992.
De Boer, G., A. Trenkle, and J. W. Young. 1985. Glucagon, insulin, growth hormone, and some blood metabolites during energy restriction ketonemia of lactating cows. J. Dairy Sci. 68:326-337.
Dechow, C.D.; G.W. Rogers, and J.S. Clay. 2001. Heritabilities and correlations among body condition scores, production traits, and reproductive performance. J. Dairy Sci. 84:266-275.

Proceedings 3rd Florida & Georgia Dairy Road Show (2006) 40
Del Vecchio, R. P., D. J. Matzas, T. J. Inzana, D. P. Sponenberg, and G. S. Lewis.1992. Effect of intrauterine bacterial infusions and subsequent endometritis on prostaglandin F2 alpha metabolite concentrations in postpartum beef cows. J. Anim. Sci. 70:3158-3162.
Del Vecchio, R. P., D. J. Matsas, S. Fortin, D. P. Sponenberg, and G. S. Lewis. 1994. Spontaneous uterine infections are associated with elevated prostaglandin F2 alpha metabolite concentrations in postpartum dairy cows. Theriogenology 41:413-421.
Delaquis, A. M., and E. Block. 1995. Dietary cation-anion difference, acid-base status, mineral metabolism, renal function, and milk production of lactating cows. J. Dairy Sci. 78:2259-2284.
Deluyker, H. A., J. M. Gay, L. D. Weaver, and A. S. Azari. 1991. Change of milk yield with clinical diseases for a high producing dairy herd. J. Dairy Sci. 74:436-445.
Detilleux, J. C., Y. T. Gröhn, S. W. Eicker, and R. L. Quaas. 1997. Effect of left displaced abomasum on test day milk yields of Holstein cows. J. Dairy Sci. 80:121-126.
Dinsmore, R. P., R. Stevens, M. Cattell, M. Salman, and F. Sundlof. 1996. Oxytetracycline residues in milk after intrauterine treatment of cows with retained fetal membranes. J. Amer. Vet. Med. Assoc. 209:1753-1755.
Dohoo, I. R., and S. W. Martin. 1984. Disease, production and culling in Holstein-Friesian cows. IV. Effects of disease on production. Prev. Vet. Med. 2:755-770.
Domecq, J. J., A. L. Skidmore, J. W. Lloyd, and J. B. Kaneene.1997a. Relationships between body condition scores and milk yield in a large dairy herd of high yielding Holstein cows. J. Dairy Sci. 80:101-112.
Domecq, J. J., A. L. Skidmore, J. W. Lloyd, and J. B. Kaneene.1997b. Relationships between body condition scores and conception at first artificial insemination in a large dairy herd of high yielding Holstein cows. J. Dairy Sci. 80:113-120.
Donkin, S. S., M. J. Cecava, and T. R. Johnson. 1998. Protein requirements of transition dairy cows. J. Dairy Sci. (Midwest Section Abstracts):79.
Drackley, J. K., D. W. LaCount, J. P. Elliot, T. H. Klusmeyer, T. R. Overton, J. H. Clark, and S. A. Blum. 1998. Supplemental fat and nicotinic acid for Holstein cows during an entire lactation. J. Dairy Sci. 81:201-214.
Drackley, J. K. 1999. Biology of dairy cows during the transition period: the final frontier?. J. Dairy Sci. 82:2259-2273.
Drackley, J. K., T. R. Overton, and G. N. Douglas. 2001. Adaptations of glucose and long-chain fatty acid metabolism in liver of dairy cows during the periparturient period. J. Dairy Sci. 84(E. Suppl.):E100-E112.
Duffield, T. 2000. Subclinical ketosis in lactating dairy cattle. Vet. Clin. North Am. Food Anim. Pract. 16:231-253.
Duvfa, G. S., E. E. Bartley, A. D. Dayton, and D. O. Riddell. 1983. Effect of niacin supplementation on milk production and ketosis of dairy cattle. J. Dairy Sci. 66:2329-2336.
Dyk, P. B., R. S. Emery, J. L. Liesman, H. F. Bucholtz, and M. J. VandeHaar. 1995. Prepartum non-esterified fatty acids in plasma are higher in cows developing periparturient health problems. J. Dairy Sci. 78(Suppl.1):264.
Edmonson, A. J., I. J. Lean, L. D. Weaver, T. Farver, and G. Webster. 1989. A body condition scoring chart for Holstein dairy cows. J. Dairy Sci. 72:68-78.

Proceedings 3rd Florida & Georgia Dairy Road Show (2006) 41
Eiler, H. 1997. Retained placenta. Pages 340-348. In Current Therapy in Large Animal Theriogenology. R. Youngquist. W.B. Saunders Company.
Emery, R. S. 1993. Energy needs of dry cows. Page 35 in Proc. Tri-State Dairy Nutr. Conf. Ohio State Univ., Michigan State Univ., and Purdue Univ., Ft. Wayne, IN.
Erb, H. N., R. D. Smith, P. A. Oltenacu, C. L. Guard, R. B. Hillman, P. A. Powers, M. C. Smith, and M. E. White. 1985. Path model of reproductive disorders and performance, milk fever, mastitis, milk yield, and culling in Holstein cows. J. Dairy Sci. 68:3337-3349.
Erb, H. N. and Y. T. Gröhn. 1988. Epidemiology of metabolic disorders in the periparturient dairy cow. J. Dairy Sci. 71:2557-2571.
Fecteau, G., N. Sattler, and D. M. Rings. 1999. Abomasal physiology, and dilatation, displacement, and volvulus. Pages 522-527 in Current Veterinary Therapy 4. Food Animal Practice. J. Howard and R. Smith. W.B. Saunders Company.
Ferguson, J. M., D. T. Galligan, and N. Thomsen. 1994. Principal descriptors of body condition score in Holstein cows. J. Dairy Sci. 77:2695-2703.
Fourichon, C., H. Seegers, N. Bareille, and F. Beaudeau. 1999. Effects of disease on milk production in the dairy cow: a review. Prev. Vet. Med. 41:1-35.
Funk, D. A., A. E. Freeman, and P. J. Berger.1987. Effects of previous days open, previous days dry, and present days open on lactation yield. J. Dairy Sci. 70:2366-2373.
Gaishauser, T., K. Leslie, J. Tenhag, and A. Bashiri. 2000. Evaluation of eight cow-side ketone tests in milk for detection of subclinical ketosis in dairy cows. J. Dairy Sci. 83:296-299.
Geishauser, T., Leslie, K., Kelton, D., Duffield, T. 2001. Monitoring for subclinical ketosis in dairy herds. Compendium Cont. Educ. Food Anim. 23:S65-S71.
Gerloff, B. J. 2000. Dry cow management for the prevention of ketosis and fatty liver in dairy cows. Vet. Clin. North Am. Food Anim. Pract. 16:283-292.
Gerloff, B. J., and T. H. Herdt. 1999. Fatty liver in dairy cattle. Pages 230-233 in Current Veterinary Therapy 4. Food Animal Practice. J. Howard and R. Smith. W.B. Saunders Company.
Gilbert, R. O., and W. S. Schwark. 1992. Pharmacological considerations in the management of peripartum conditions in the cow. Vet. Clin. North Am. Food Anim. Pract. 8:29-56.
Gillund, P., Reksen, O., Gröhn , Y. T., and Karlberg, K. 2001. Body condition related to ketosis and reproductive performance in Norwegian dairy cows. J. Dairy Sci. 84:1390-1396.
Goff, J. P., M. E. Kehrli, and R. L. Horst. 1989. Periparturient hypocalcemia in cows: Prevention using intramuscular parathyroid hormone. J. Dairy Sci. 72:1182-1187.
Goff, J. P., R. L. Horst, F. J. Mueller, J. K. Miller, G. A. Kiess, and H. H. Dowlen. 1991. Addition of chloride to a prepartal diet high in cations increases 1,25-dihydroxyvitamin D response to hypocalcemia preventing milk fever. J. Dairy Sci. 74:3863-3871.
Goff, J. P., R. L. Horst.1993. Oral administration of calcium salts for treatment of hypocalcemia in cattle. J. Dairy Sci. 76:101-108.

Proceedings 3rd Florida & Georgia Dairy Road Show (2006) 42
Goff, J. P., R. L. Horst, P. W. Jardon, C. Borelli, and J. Wedam. 1996. Field trials of an oral calcium propionate paste as an aid to prevent milk fever in periparturient dairy cows. J. Dairy Sci. 79:378-383.
Goff, J. P., and R. L. Horst. 1997a. Effects of the addition of potassium or sodium but not calcium, to prepartum rations on milk fever in dairy cows. J. Dairy Sci. 80: 176-186.
Goff, J. P., and R. L. Horst.1997b. Physiological changes at parturition and their relationship to metabolic disorders. J. Dairy Sci. 80:1260-1268.
Goff, J. P., and R. L. Horst. 1998a. Factors to concentrate on to prevent periparturient disease in the dairy cow with special emphasis on milk fever. Proceedings 31th Conference of American Association of Bovine Practitioners, Spokane, WA , 31:154-163.
Goff, J. P., and R. L. Horst. 1998b. Use of hydrochloric acid as a source of anions for prevention of milk fever. J. Dairy Sci. 81:2874-2880.
Goff, J. P. 1999. Treatment of calcium, phosphorus, and magnesium balance disorders. Vet. Cl. North Amer. Food Anim. Pract. 15: 619-639.
Goff, J. P. 2000. Determining the mineral requirement of dairy cattle. Pages 106 – 132. In Proceedings 11th Annual Florida Ruminant Nutrition Symposium, University of Florida. Gainesville, FL.
Grant, R. J., and J. L. Albright. 1995. Feeding behavior and management factors during the transition period in dairy cattle. J. Anim. Sci. 73:2791-2803.
Geishauser, T., K. Leslie, D. Kelton, and T. Duffield. 1998. Evaluation of five cowside test for use with milk to detect subclinical ketosis in dairy cows. J. Dairy Sci. 81: 438-443.
Greenfield, R. B., M. J. Cecava, and S. S. Donkin. 2000. Changes in mRNA expression for gluconeogenic enzymes in liver of dairy cattle during the transition to lactation. J. Dairy Sci. 83:1228-1236.
Gröhn, Y. T., H. N. Erb, C. E. McCulloch, and H. S. Saloniemi. 1989. Epidemiology of metabolic disorders in dairy cattle: Association among host characteristics, disease, and production. J. Dairy Sci. 72:1876-1885.
Gröhn, Y. T., H. N. Erb, C. E. McCulloch, and H. S. Saloniemi. 1990a. Epidemiology of reproductive disorders in dairy cattle: associations among host characteristics, disease and production. Prev. Vet. Med. 8:25-39.
Gröhn, Y. T., S. W. Eicker, V. Ducrocq, and J. A. Hertl.1998. Effect of diseases on the culling of Holstein dairy cows in New York state. J. Dairy Sci. 81:966-978.
Gröhn, Y. T., J. J. McDermott, Y. H. Schukken, J. A. Hertl, and S. W. Eicker. 1999. Analysis of correlated continuous repeated observations: modelling the effect of ketosis on milk yield in dairy cows. Prev. Vet. Med. 39:137-153.
Grum, D. E., J. K. Drackley, R. S. Younker, D. W. LaCount, and J. J. Veenhuizen. 1996. Nutrition during the dry period and hepatic lipid metabolism of periparturient dairy cows. J. Dairy Sci. 79:1850-1864.
Grummer R. R., J. C. Winkler, S. J. Bertics, and V. A. Studer. 1994. Effect of propylene glycol dosage during feed restriction on metabolites in blood of prepartum Holstein heifers. J. Dairy Sci. 77:3618-3623.
Grummer, R. R. 1993. Etiology of lipid-related metabolic disorders in periparturient dairy cows. J. Dairy Sci. 76:3882-3896.

Proceedings 3rd Florida & Georgia Dairy Road Show (2006) 43
Grummer, R. R. 1995. Impact of changes in organic nutrient metabolism on feeding the transition dairy cows. J. Anim. Sci. 73:2820-2833.
Grummer, R. R. 1999. Energy and protein nutrition of the transition dairy cow. In Dry cow nutrition. 35th Annual Conference of the American Association of Bovine Practitioners. Nashville, TN.
Grunert, E. 1986. Etiology and pathogenesis of retained placenta. Pages 237-In Current Therapy in Theriogenology 2. D. A. Morrow .Philadelphia, WB Saunders.
Guard, C. L. 1994. Cost of clinical disease in dairy cows. Page In Proc. Annual Cornell Conf. Vet. Ithaca, NY. Cornell Univ., Ithaca, NY.
Gunnink, J. W. 1984. Retained placenta and leukocytic activity. Vet. Q. 6:49-51. Gustaffson, A. H., L. Andersson, and U. Emanuelson. 1993. Effect of hyperketonemia,
feeding frequency and intake of concentrate and energy on milk yield in dairy cows. Anim. Prod. 56:51-60.
Gustaffson, A. H., and U. Emanuelson. 1996. Milk acetone concentration as an indicator of hyperketonemia in dairy cows: the critical value revised. Anim. Sci. 63:183-188.
Hayirli, A., R. R. Grummer, E. Nordheim, P. Crump, D. K. Beede, M. J. VandeHaar, L. H. Kilmer,, J. K. Drackley, D. J. Carroll, G. A. Varga, and S. S. Donkin. 1999. Prediction equations for dry matter intake of transition cows fed diets that vary in nutrient composition. J. Dairy Sci. 82(Suppl. 1):113.
Hayirli, A., R. R. Grummer, E. V. Nordheim and P. M. Crump. 2002. Animal and Dietary Factors Affecting Feed Intake During the Prefresh Transition Period in Holsteins. J. Dairy Sci. 85:3430-3443.
Heinrichs, A. J., D. R. Buckmaster, and B. P. Lammers. 1999. Processing, mixing, and particle size reduction of forages for dairy cattle. J. Anim. Sci. 77:180-186.
Herbein J. H., R. J. Aiello, and E. L. Eckler. 1985. Glucagon, growth hormone, and glucose concentrations in blood plasma of lactating dairy cows. J. Dairy Sci. 68: 320-325.
Herdt, T. H. 1988. Fuel homeostasis in the ruminant. Vet. Clin. North Am. Food Anim. Pract. 4:213-231.
Herdt, T. H. 2000. Ruminant adaptation to negative energy balance. Influences on the etiology of ketosis and fatty liver. Vet. Clin. North Am. Food Anim. Pract. 16:215-230.
Herdt, T. H. 2002. Gastrointestinal physiology and metabolism. Postabsorptive nutrient utilization. Pages 303-322 in Textbook of Veterinary Physiology. Third Edition. J. Cunningham. W.B. Saunders Company.
Herdt T. H., R. S. Emery. 1992. Therapy diseases of ruminant intermediary metabolism. Vet. Clin. North Am. Food Anim. Pract. 8: 91-106.
Herdt, T.H. and B.J. Gerloff. 1999. Ketosis. Pages 226-230 in Current Veterinary Therapy 4. Food Animal Practice. J. Howard and R. Smith. W.B. Saunders Company.
Heuer, C., Y. H. Schukken, and P. Dobbelaar.1999. Postpartum body condition score and results from the first test day milk as predictors of disease, fertility, yield, and culling in commercial dairy herds. J. Dairy Sci. 82:295-304.
Heuer, C., A. Wangler, Y.H. Schukken, and J.P.T.M. Noordhuizen. 2001. Variability of acetone in milk in a large low-production dairy herd: a longitudinal case study. The Vet. J. 161:314-321.

Proceedings 3rd Florida & Georgia Dairy Road Show (2006) 44
Higgins, J. J., W. K. Sanchez, M. A. Guy, and M. L. Anderson. 1996. An oral gel of calcium propionate plus propylene glycol is effective in elevating calcium and glucose levels in periparturient dairy cows. J. Dairy Sci. 79(Suppl. 1):130.
Hippen, A. R., P. She, J. W. Young, D. C. Beitz , G. L. Lindberg, L. F. Richardson, and R. W. Tucker. 1999a. Metabolic responses of dairy cows and heifers to various intravenous dosages of glucagon. J. Dairy Sci. 82:1128-1138.
Hippen, A. R., P. She, J. W. Young, D. C. Beitz , G. L. Lindberg, L. F. Richardson, and R. W. Tucker. 1999b. Alleviation of fatty liver in dairy cows with 14-day intravenous infusions of glucagon. J. Dairy Sci., 82:1139-1152.
Hippen, A. R. 2000. Glucagon as a potential therapy for ketosis and fatty liver. Vet. Clin. North Am. Food Anim. Pract. 16:267-282.
Hocquette, J.F., and D. Bauchart. 1999. Intestinal absorption, blood transport and hepatic and muscle metabolism of fatty acids in preruminant and ruminant animals. Reprod. Nutr. Dev. 39:27-48.
Horst, R. L., J. P. Goff, T. A. Reinhardt. 1994. Calcium and vitamin D metabolism in the dairy cow. J. Dairy Sci. 77:1936-1951.
Hutjens, M. F. 1991.Feed additives. Vet. Clin. North Am. Food Anim. Pract. 7(2): 525-540. Hutjens, M. F. 1992. Selecting feed additives. Pages 309-317. In Large Dairy Herd
Management. H. H. Van Horn and C. J. Wilcox. American Dairy Science Association, 301 West Clark St., Champaign, IL 61820.
Ingvartsen, K. L. and J. B. Andersen. 2000. Integration of metabolism and intake regulation: a review focusing on periparturient animals. J. Dairy Sci. 83:1573-1597.
Johnson, M. M. and J. P. Peters. 1993. Technical note: An improved method to quantify nonesterified fatty acids in bovine plasma. J. Anim. Sci. 71:753-756.
Joosten I, Stelwagen J, Dojkhuizen AA. 1988. Economic and reproductive consequences of retained placenta in dairy cattle. Vet. Rec. 123:53.
Joosten I., P. van Eldik, and G. J. W. van der Mey. 1991. Factors affecting retained placenta in cattle. Effect of sire on incedence. Anim. Repro. Sci. 25:11-22.
Jorgensen, N. A. 1974. Combating milk fever. J. Dairy Sci. 57:933-944. Jorritsma, R., S. J. Baldee, Y. H. Schukken, T. Wensing, and G. H. Wentink. 1998.
Evaluation of a milk test for detection of subclinical ketosis. Vet. Q. 20:108-110. Joyce, P. W., W. K. Sanchez, and J. P. Goff. 1997. Effect of anionic salts in prepartum
diets based on alfalfa. J. Dairy Sci. 80:2866-2875. Kaneene, J. and H. Hurd. 1990. The National Animal Health Monitoring System in
Michigan I. Design, data and frequencies of selected dairy cattle diseases. Prev. Vet. Med. 8:103-114.
Kaneene, J. B., R. A. Miller, T. H. Herdt, and J. C. Gardiner. 1997. The association of serum nonesterified fatty acids and cholesterol, management and feeding practices with peripartum disease in dairy cows. Prev. Vet. Med. 31:59-72.
Kelton, D. F., K. D. Lissemore, and R. E. Martin. 1998. Recommendations for recording and calculating the incidence of selected clinical diseases of dairy cattle. J. Dairy Sci. 81:2502-2509.
Kimura, K., J. P. Goff, M. E. Kehrli, and J. A. Harp. 1999. Phenotype analysis of peripheral blood mononuclear cells in peripartum dairy cows. J. Dairy Sci. 82:315-319.

Proceedings 3rd Florida & Georgia Dairy Road Show (2006) 45
Kimura, K., J. P. Goff, M. E. Kehrli, and T. A. Reinhardt. 2002. Decreased neutrophil function as a cause of retained placenta in dairy cattle. J. Dairy Sci. 85:544-550.
Laranja da Fonseca, L. F., C. S. Lucci, P. H. M. Rodriguez, M. V. Santos, and A. P. Lima. 1998. Supplementation of propylene glycol to dairy cows in periparturient period: Effects on plasma concentration of BHBA, NEFA, and glucose. J. Dairy Sci. 81(Suppl. 1):320.
Lewis, G.S. 1997. Uterine health and disorders. J. Dairy Sci. 80:984-994. Mallard, B. A., J. C. Dekkers, M. J. Ireland, K. E. Leslie, S. Sharif, C. Lacey Vankampen,
L. Wagter, and B. N. Wilkie. 1998. Alteration in immune responsiveness during the peripartum period and its ramification on dairy cow and calf health. J. Dairy Sci. 81:585-595.
Markusfeld, O. 1986. The association of displaced abomasum with various periparturient factors in dairy cows. A retrospective study. Prev. Vet. Med. 4:172-183.
Markusfeld, O. 1989. The evaluation of a routine treatment with 1a-hydroxyvitamin D3 for the prevention of bovine parturient paresis. Prev. Vet. Med. 7:1-9.
Markusfeld, O., N. Galon, and E. Ezra.1997. Body condition score, health, yield and fertility in dairy cows. Vet. Rec. 141:67-72.
Mahanna, B. 1999. Dairy cow nutritional guidelines. Pages 193-198. In Current Veterinary Therapy 4. Food Animal practice. J. Howard and R. Smith. W.B. Saunders Company.
Massey, C. D., C. Wang, G. A. Donovan, and D. Beede. 1993. Hypocalcemia at parturition as a risk factor for left displacement of the abomasum in dairy cows. J. Amer. Vet. Med. Assoc. 203:852-853.
Melendez, P., A. Donovan, C. A. Risco, M. B. Hall, R. Littell, and J. Goff. 2002a. Metabolic responses of transition Holstein cows fed anionic salts and supplemented at calving with calcium and energy. J. Dairy Sci. 85:1085-1092.
Melendez, P., O. Rodriguez, S. Madrid, A. Donovan. 2002b. The association between forage particle size at initial feeding and the weigh back and chewing activity in dairy cattle. The Bovine Practitioner 36: 66-70.
Melendez, P., J. Bartolome, L. Archbald, A. Donovan. 2003a. Association between lameness, ovarian cysts and fertility in lactating dairy cows. Theriogenology, 59: 927-937.
Melendez, P., A. Donovan, C. A. Risco, R. Littell, J. Goff. 2003b. Effect of calcium-energy supplements on calving-related disorders, fertility and milk yield during the transition period in cows fed anionic diets. Theriogenology 60:843-854.
Melendez, P, J. McHale, J. Bartolome, A. Sozzi, S. Lanhart, A. Donovan. 2003c. The effect of pgf2α at day 8 post partum on uterine involution and acute response proteins in Holstein cows with acute puerperal metritis. Tenth International Symposium on Veterinary Epidemiology and Economics (submitted).
Melendez, P., N. Back, S. Lanhart, A. Donovan. 2003d. Particle size, feed intake, milk yield and chewing activity in Holstein cows. J. Dairy Sci. 86 (Suppl. 1):W227 (Abstr.).
Mertens, D. R. 1992. Nonstructural and structural carbohydrates. Pages 219-235 In Large Dairy Herd Management. H. H. Van Horn and C. J. Wilcox. American Dairy Science Association, 301 West Clark St., Champaign, IL 61820.

Proceedings 3rd Florida & Georgia Dairy Road Show (2006) 46
Muller, L. D.1992. Feeding management strategies. Pages 326-335 In Large Dairy Herd Management. H. H. Van Horn and C. J. Wilcox. American Dairy Science Association, 301 West Clark St., Champaign, IL 61820.
Miettinen, H., and P. Huhtanen. 1996. Effects of the ratio of ruminal propionate to butyrate on milk yield and blood metabolites in dairy cows. J. Dairy Sci. 79:851-861.
Milian-Suazo, F., H. N. Erb, and R. D. Smith. 1988. Descriptive epidemiology of culling in dairy cows from 34 herds in New York state. Prev. Vet. Med. 6:243-251.
Miller, B. J., and J. R. Lodge.1984. Postpartum oxytocin treatment of retained placenta. Theriogenology 22:385-
Miller, G., and C. Dorn. 1990. Cost of dairy cattle diseases to producers in Ohio. Prev. Vet. Med. 8:171-182.
Minor, D. J., R. R. Grummer, R. D. Shaver, and S. L. Trower. 1996. Effect of niacin, and nonfiber carbohydrate on the metabolic status during the transition period and lactation performance. J. Dairy Sci. 79(Suppl. 1):199.
Minor, D. J., S. L. Trower, and B. D. Strang. 1998. Effects of nonfiber carbohydrate and niacin on periparturient metabolic status and lactation of dairy cows. J. Dairy Sci. 81: 189-200.
National Research Council. 1978. Nutrient requirements of dairy cattle, 5th revised edition. Washington, D.C.: National Academy of Sciences.
National Research Council. 1989. Nutrient requirements of dairy cattle, 6th revised edition. Washington, D.C.: National Academy Press.
National Research Council. 2001. Nutrient requirements of dairy cattle, 7th revised edition. Washington, D.C.: National Academy Press.
Nelson, D. L. and M. M. Cox. 2000. Oxidation of fatty acids. Pages 598-622. In Lehninger Principles of biochemistry. Third edition. Worth Publishers, New York, NY 10010.
Nocek, J. E., J. E. English, and D. G. Braund. 1983. Effects of various forages feeding programs during dry period on body condition score and subsequent lactation health, production and reproduction. J. Dairy Sci. 66:1108-1118.
Oetzel, G. R. 1988. Parturient paresis and hypocalcemia in ruminant livestock. Vet. Clin. North Am. Food Anim. Pract. 4:351-364.
Oetzel, G. R. 1998. Nutritional management of dry dairy cows. Compend. Contin. Educ. Prac. Vet. 20:391-396.
Oetzel, G.R. 2000. Management of dry cow for the prevention of milk fever and other mineral disorders. Vet. Clin. North Am. Food Anim. Pract. 16:369-386.
Oetzel, G. R., and J. P. Goff. 1999. Milk fever in cows, ewes and doe goats. Pages 215-218 in Current Veterinary Therapy 4. Food Animal Practice. J. Howard and R. Smith. W.B. Saunders Company.
Olson, J. D., K. Bretzlaff, R. G. Moltimer, and L. Ball. 1986. The metritis-pyometra complex. Pages 227-236 In Current therapy in theriogenology. D.A. Morrow. W.B. Saunders, Co., Philadelphia, PA.
Østergaard, S., and Y. T. Gröhn.1999. Effects of diseases on test day milk yield and body weight of dairy cows from Danish research herds. J. Dairy Sci., 82:1188-1201.
Overton, T. R., J. K. Drackley, G. N. Douglas, L. S. Emmert, and J. H. Clark. 1998. Hepatic gluconeogenesis and whole-body protein metabolism of periparturient dairy cows as affected by source of energy and intake of the prepartum diet. J. Dairy Sci. 81(Suppl. 1):295. (Abstr.).
Proceedings 3rd Florida & Georgia Dairy Road Show (2006) 47
Overton, T. R., J. K. Drackley, C. J. Otteman-Abbamonte, A. D. Beaulieu, L. S. Emmert, and J. H. Clark. 1999. Substrate utilization for hepatic gluconeogenesis is altered by increased glucose demand in ruminants. J. Anim. Sci. 77:1940-1951.
Paisley, L. G., W. D. Mickelson, and P. B. Anderson. 1986. Mechanisms and therapy for retained fetal membranes and uterine intections of cows: A review. Theriogenology 25:353-381.
Peeler, E. J., M. J. Otte, and R. J. Esslemont. 1994. Inter-relationships of periparturient diseases in dairy cows. Vet. Rec. 134: 129-132.
Pimentel, S., S. G. Evans, W. C. Wagner.1987. Placental synthesis of estrogens at parturition and placental retention in the cow. Theriogenology 28:755-766.
Pintchuk, P. A., F. D. Galey, L. W. George. 1993. Propylene toxicity in adult dairy cows. J. Vet. Intern. Med. 7:150.
Pugh, D. G., M. Q. Lowder, and J. G. Wenzel. 1994. Restrospective analysis of the management of 78 cases of postpartum metritis in the cow. Theriogenology 42:455-463.
Rajala-Shultz, P. J., and Y. T. Gröhn. 1998. Effects of dystocia, retained placenta and metritis on milk yield in dairy cows. J. Dairy Sci. 81:3172-3181.
Rajala-Shultz, P. J., and Y. T. Gröhn. 1999a. Culling of dairy cows. Part II. Effects of diseases and reproductive performance on culling in Finnish Ayrshire cows. Prev. Vet. Med. 41:279-294.
Rajala-Shultz, P. J., and Y. T. Gröhn. 1999b. Culling of dairy cows. Part III. Effects of diseases, pregnancy status and milk yield on culling in Finnish Ayrshire cows. Prev. Vet. Med. 41:295-309.
Rajala-Shultz, P. J., Y. T. Gröhn, and C. E. McCulloch. 1999. Effects of milk fever, ketosis and lameness on milk yield in dairy cows. J. Dairy Sci. 82:288-294.
Reist, M., Erdin, D., von Euw, D, Tschümperlin, K., Leuenberger, H., Hammon, H., Künzi, N., and Blum, J. 2003. Use of threshold serum and milk ketone concentrations to identify risk for ketosis and endometritis in high-yielding dairy cows. Am. J. Vet. Res. 64:188-194.
Reynolds, C. K., P. C. Aikman, D. J. Humphries, and D. E. Beever. 2000. Splanchnic metabolism in transition dairy cows. J. Dairy Sci. 83(Suppl. 1): 257. (Abstr.)
Risco, C. A., J. P. Reynolds, and D. Hird. 1984. Uterine prolapse and hypocalcemia in dairy cows. J. Amer. Vet. Med. Assoc. 185:1517-1519.
Risco, C. A., L. F. Archbald, J. Elliott, T. Tran, and P. Chavatte. 1994a. Effect of hormonal treatment on fertility in dairy cows with dystocia or retained fetal membranes at parturition. J. Dairy Sci. 77:2562-2569.
Risco, C. A., M. Drost, W. W. Thatcher, J. Savio, M. J. Thatcher. 1994b. Effects of calving-related disorders on prostaglandin, calcium, ovarian activity and uterine involution in postpartum dairy cows. Theriogenology 42:183-203.
Risco, C. A. and P. Melendez. 2002. Periparturient disorders. Pages 2309-2314. In Encyclopedia of Dairy Science. H. Roginski, J. Fuquay, P. Fox. Academic Press.
Rowlands, G., A. Russell, and L. Williams.1985. Effects of stage of lactation, month, age, origin and heart girth on lameness in dairy cattle. Vet. Rec. 117:576-580.
Rukkwamsuk, T., T. Wensing, and M. J. H. Geelen. 1998. Effect of overfeeding during the dry period on regulation of adipose tissue metabolism in dairy cows during the periparturient period. J. Dairy Sci. 81:2904-2911.

Proceedings 3rd Florida & Georgia Dairy Road Show (2006) 48
Rukkwamsuk, T., T. Wensing, and M. J. H. Geelen. 1999a. Effect of overfeeding during the dry period on the rate of esterification in adipose tissue of dairy cows during the periparturient period. J. Dairy Sci. 82:1164-1169.
Rukkwamsuk, T., T. Wensing, and M. J. H. Geelen. 1999b. Effect of fatty liver on hepatic gluconeogenesis in periparturient dairy cows. J. Dairy Sci. 82:500-505.
Rukkwamsuk, T., T.A.M. Kruip, G.A.L. Meijer and T. Wensing. 1999c. Hepatic fatty acid composition in periparturient dairy cows with fatty liver induced by intake of a high energy diet in the dry period. J. Dairy Sci. 82:280-287.
Rukkwamsuk, T., M.J.H. Geelen, T.A.M. Kruip, and T. Wensing. 2000. Interrelation of fatty acid composition in adipose tissue, serum, and liver of dairy cows during the development of fatty liver postpartum. J. Dairy Sci. 83:52-59.
Santos, J. E. P., P. W. Jardon, E. J. DePeters, and J. T. Huber. 1999a. Effect of prepartum crude protein level on performance of primiparous Holstein cows. Page 200. In Proceedings 32th Annual Convention America Association of Bovine Practitioners. Nashville, TN.
Santos, J. E. P., P. W. Jardon, E. J. DePeters, and J. T. Huber. 1999b. Effect of prepartum crude protein level on performance of multiparous Holstein cows. Page 201. In Proceedings 32th Annual Convention America Association of Bovine Practitioners. Nashville, TN.
Santos, J. 1999. Feed additives in transition diets:Effects on metabolism and performance. In Dry cow nutrition. 35th Annual Conference of the American Association of Bovine Practitioners. Nashville, TN.
Seal, C.J., and C.K. Reynolds.1993. Nutritional implications of gastrointestinal and liver metabolism in ruminants. Nutr. Res. Rev. 6:185-208.
Schelling, G.T. 1984. Monensin mode of action in the rumen. J. Anim. Sci. 58:1518-1527. Schnier, C., S. Hielm, H. S. Saloniemi. 2002. Comparison of the disease incidences of
dairy cows kept in cold and warm loose-housing systems. Prev. Vet. Med. 53:247-261.
Sharpe, K. L., H. Eiler, F. M. Hopkins. 1990. Changes in the proportion of type I and type III collagen in the developing and retained bovine placentome. Biol. Reprod 43:229-
Shaver, R. D. 1997. Nutritional risk factors in the etiology of left displaced abomasum in dairy cows: a review. J. Dairy Sci. 80:2449-2453.
She, P., A. R. Hippen, J. W. Young, G. L. Lindberg, D. C. Beitz, L. F. Richardson, and R. W. Tucker. 1999. Metabolic responses of lactating dairy cows to 14-day intravenous infusions of glucagon. J. Dairy Sci. 82:1118-1127.
Shpigel, N. Y., R. Chen, Y. Avidar. 1996. Use of corticosteroids alone or combined with glucose to treat ketosis in dairy cows. J. Amer. Vet. Med. Assoc. 208:1702-1704.
Smith, B. I., G. A. Donovan. C. Risco, R. Littell, C. Young, L. H. Stanker, and J. Elliot. 1998. Comparison of various antibiotic treatments for cows diagnosed with toxic puerperal metritis. J. Dairy Sci. 81:1555-1562.
Stevenson, J. S., and E. P. Call. 1988. Reproductive disorders in the periparturient dairy cow. J. Dairy Sci. 71:2572-2583.
Studer, E. 1998. A veterinary perspective of on-farm evaluation of nutrition and reproduction. J. Dairy Sci. 81:872-876.

Proceedings 3rd Florida & Georgia Dairy Road Show (2006) 49
Studer V. A., R. R. Grummer, S. J. Bertics, and C. K. Reynolds. 1993. Effect of prepartum propylene glycol administration on periparturient fatty liver in dairy cows. J. Dairy Sci. 76:2931-2939.
Trent, A. M. 1990. Surgery of the bovine abomasum. Vet. Clin. North Am. Food Anim. Pract. 6:399-448.
United States Department of Agriculture – Animal and Plant Health Inspection Service – Veterinary Services. 1997. Papillomatous digital dermatitis on U.S. dairy operations. NAHMS Dairy 96. USDA-APHIS-VS, Ft. Collins, CO. 28 p.
Vagnoni, D. B., and G. R. Oetzel. 1998. Effects of dietary cation-anion difference on the acid-base status of dry cows. J. Dairy Sci. 81:1643-1652.
VandeHaar, M. J., B. K. Sharma, G. Yousif, T. H. Herdt, R. S. Emery, M. S. Allen, and J. S. Liesman. 1995. Prepartum diets more nutrient-dense than recommended by NRC improve nutritional status of peripartum cows. J. Dairy Sci. 78(Suppl. 1):264.
VandeHaar, M. J., G. Yousif, B. K. Sharma, , T. H. Herdt, R. S. Emery, M. S. Allen, and J. S. Liesman. 1999.Effect of energy and protein density of prepartum diets on fat and protein metabolism of dairy cattle in the periparturient period. J. Dairy Sci. 82:1282-1295.
Van Dorp, T. E., J. C. M. Dekkers, S. W. Martin, and J. P. Noordhuizen. 1998. Genetic parameters of health disorders, and relationships with 305-day milk yield and conformation traits of registered Holstein cows. J. Dairy Sci. 81:2264-2270.
Van Werven, T., Y. H. Schukken, J. Lloyd, A. Brand, H. Heeringa, and M. Shea. 1992. The effect of duration of retained placenta on reproduction, milk production, postpartum disease and culling rate. Theriogenology 37:1191-1203.
Varga, G. A., H. M. Dann, V. A. Ishler. 1998. The use of fiber concentrations for ration formulation. J. Dairy Sci. 81:3063-3074.
Vazquez-Añon, M., S. Bertics, M. Luck, R. R. Grummer and J. Pinheiro. 1994. Peripartum liver triglyceride and plasma metabolites in dairy cows. J. Dairy Sci. 77:1521-1528.
Veerkamp, R.F., E.P.C. Koenen, G. de Jong. 2001. Genetic correlations among body condition score, yield, and fertility in first-parity cows estimated by random regression models. J. Dairy Sci. 84: 2327-2335.
Waltner, S.S., J.P. McNamara, and J.K. Hillers. 1993. Relationships of body condition score to production variables in high producing Holstein dairy cattle. J. Dairy Sci. 76:3410-3419.
Youngquist, R. S., W. F. Braun. 1993. Abnormalities of the tubular genital organs. Vet. Clin. North Am. Food Anim. Pract. 9:309-322.
Youngquist, R.S.; and M. D. Shore. 1997. Postpartum uterine infecctions. Pages 335-340 In Current therapy in large animal theriogenology. R.S. Youngquist. W.B. Saunders Company. Philadelphia, PA.

Proceedings 3rd Florida & Georgia Dairy Road Show (2006) 50
Notes