nutritional (vit-a,e,minerals & fiber) comparison of fresh, frozen & canned fruits &...
TRANSCRIPT
This presentation implies “A REVIEW ON NUTRITIONAL COMPARISON OF FRESH,FROZEN & CANNED FRUITS &
VAGETABLES ”having two partsI.Vitamins C , B & phenolic compounds.
II.Vitamin A & carotenoids, vitamin E , minerals & fiber.…………….by Joy C Rickman , Christine M Bruhn & Diane
M Barrett.Dept. of Food Science & Technology, University of
California , USA.Now the second part of the article(Vitamin A & carotenoids, vitamin E , minerals & fiber) is going to be represented by
Ashraf ElahiFaculty of food science & technology
Chittagong Veterinary & Animal Sciences University

Why this presentation?ObjectivesTo analyze the published article.To inform the methodological & empirical study on the mentioned topic.To invent idea & apply or sustain the solution of causes hampering efficient consumption.What are the basic agenda of the article?•Vitamin A and carotenoid, vit.E, minerals & fiber.•Detection of losses of the component in fresh , frozen & canned fruits & vegetables.•Qualitative & quantitative Comparison of presence of these nutrient after processing(cooking , canning , storage , freezing etc.)

Vitamin A & carotenoid
• The active form of vitamin A is retinol. It’s precursor is β-carotene, found in colored(specially yellow) fruits & vegetables.
• Two other carotenoids are α-carotene and β-cryptoxanthin have notable provitamin A activity.
• Lycopene don’t show provitamin A activity, though a carotenoid. But it provide a greater antioxidant capacity & stronger inhibition of cancer cell proliferation than other carotenoids.
• Sources of carotenoids are tomato ,spinach , carrots , apricots and so other colored fruits & vegetables.
Effect of processing on vitamin A & carotenoids
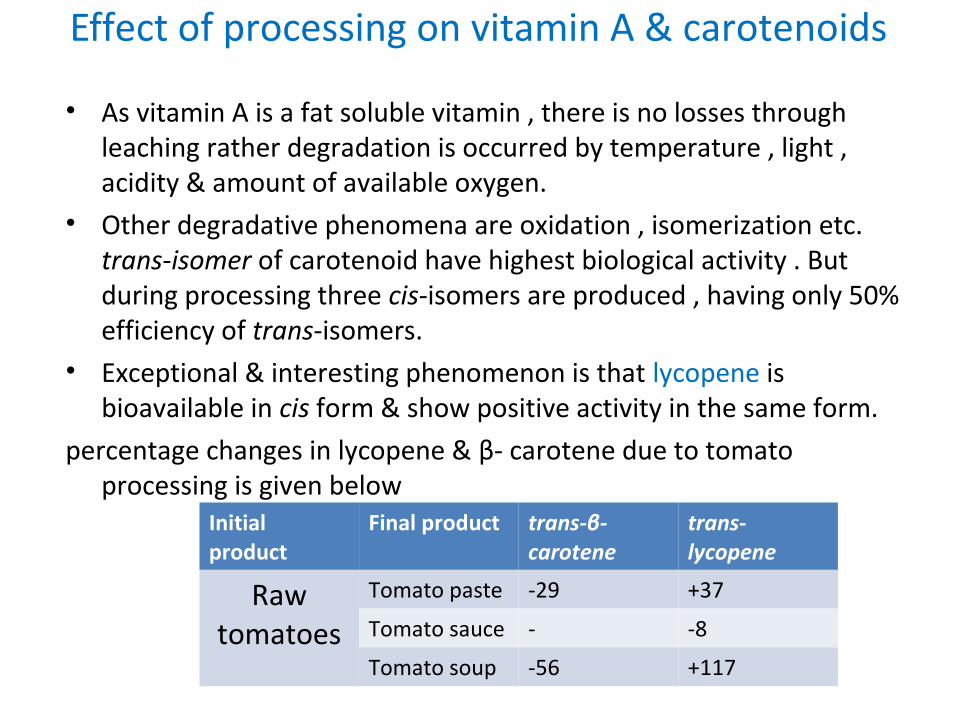
• As vitamin A is a fat soluble vitamin , there is no losses through leaching rather degradation is occurred by temperature , light , acidity & amount of available oxygen.
• Other degradative phenomena are oxidation , isomerization etc. trans-isomer of carotenoid have highest biological activity . But during processing three cis-isomers are produced , having only 50% efficiency of trans-isomers.
• Exceptional & interesting phenomenon is that lycopene is bioavailable in cis form & show positive activity in the same form.
percentage changes in lycopene & β- carotene due to tomato processing is given below
Initial product
Final product trans-β-carotene
trans-lycopene
Raw tomatoes
Tomato paste -29 +37
Tomato sauce - -8
Tomato soup -56 +117

canning• Let observe a data on table ,percent change of total β-
carotene & other provitamin due to canning
commodity β-carotene α-carotin β-cryotoxanthin Total provitamin
carrots +7 +33 - +16
Collard greens +50 - - +50
peaches -50 - -40 -49
spinach +19 _ - +19
Sweet potatoes +22 _ _ +22
tomato -13 __ _ _13

There we observed that the change in carotenoids are inconsistent, where peaches & tomatoes losses. Observing other study it is found that , degradation of oxidative enzymes & increase in trans
& cis isomer is also inconsistent depending dry weight basis & wit weight basis. Let observe %change of carotenoids due to blanching & freezing
commodity time trans-β-carotene
Total β-carotene
α-& β-carotene
year
broccoli Year 1
-22 - -
1999Year 2
-48 - -
carrots Year 1
-10 - -
Year 2
-36 - -
Green bean - -5 - -8
Green peas - - - -161970spinach - - - -12
corn - - +6 ,+189 - 2005
Fiddlehead greens
- - -19 - 1985
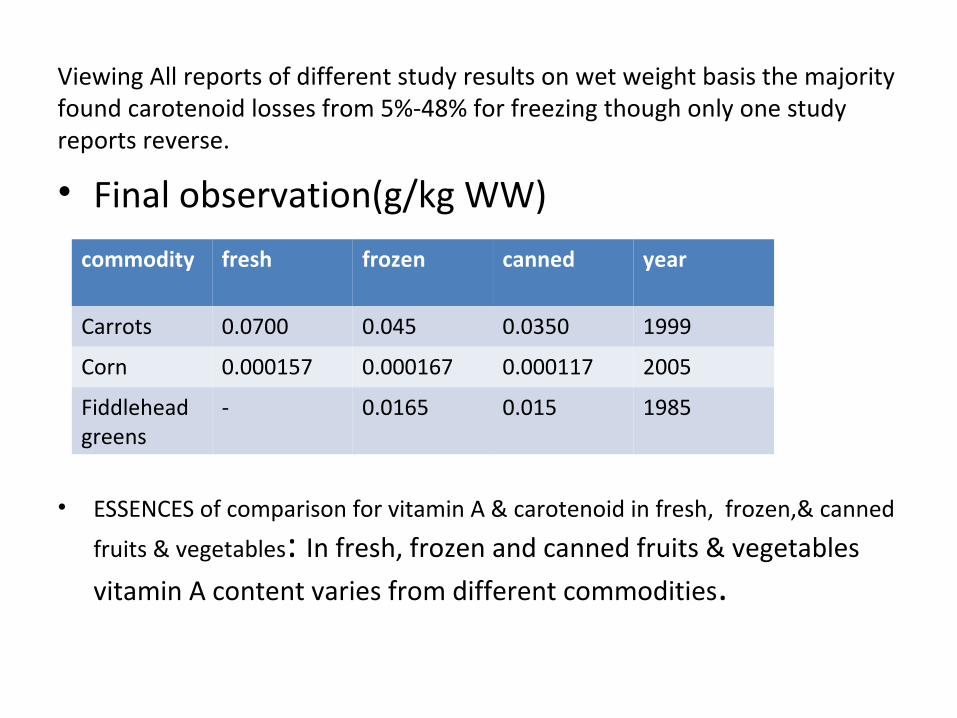
Viewing All reports of different study results on wet weight basis the majority found carotenoid losses from 5%-48% for freezing though only one study reports reverse.
• Final observation(g/kg WW)
• ESSENCES of comparison for vitamin A & carotenoid in fresh, frozen,& canned
fruits & vegetables: In fresh, frozen and canned fruits & vegetables
vitamin A content varies from different commodities.
commodity fresh frozen canned year
Carrots 0.0700 0.045 0.0350 1999
Corn 0.000157 0.000167 0.000117 2005
Fiddlehead greens
- 0.0165 0.015 1985

STORAGE
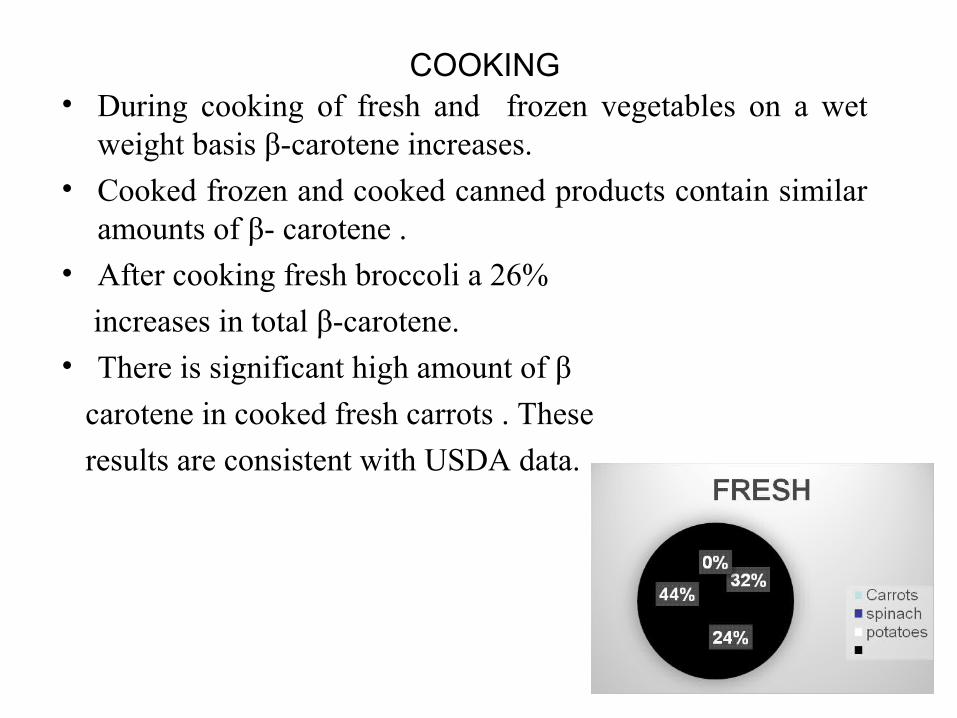
COOKING• During cooking of fresh and frozen vegetables on a wet
weight basis β-carotene increases.• Cooked frozen and cooked canned products contain similar
amounts of β- carotene .• After cooking fresh broccoli a 26%
increases in total β-carotene.• There is significant high amount of β
carotene in cooked fresh carrots . These
results are consistent with USDA data.

RETAIL MARKET PRODUCT AND USDA DATABASE
• Carotenoid levels in market purchased fresh; frozen ; canned food have compared.
• Cooked frozen green peas contain high levels of β-carotene than cooked fresh and cooked canned.
• Vegetables that contain high level of β-carotene
are still good source of vitamin A.• A variety of fresh tomatoes for lycopene content
have purchased.

CONCLUSION• Due to oxidation and isomerization ; carotenoids and lycopene
appear to be lost.• During thermal degradation ;release of carotenoids from cellular
matrices due to loss of moisture.• The need for a standard reporting method seems especially
imperative for future interpretation of carotenoid studies.

Vitamin E
FRESH FROZEN
commodity
uncooked cooked uncooked cooked canned
Tomato .0054 .0056 ------------- ----------- .0071
Spinach .0203 .0208 .0290 .0354 .0194
Asparagus .0113 .0150 ------------- .0120 .0031
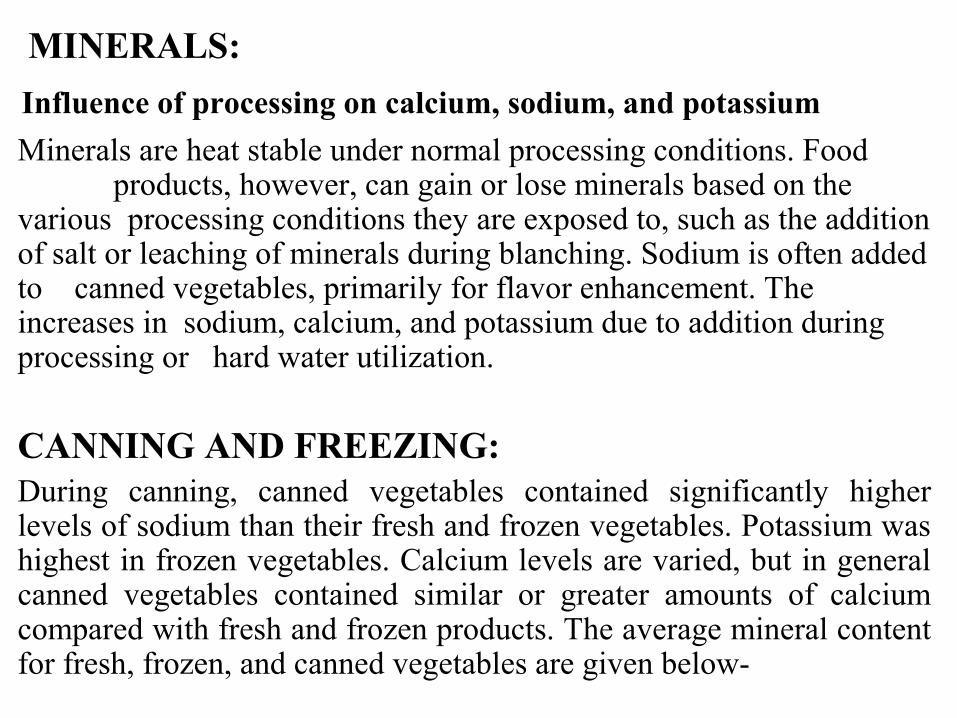
MINERALS:
Influence of processing on calcium, sodium, and potassium
Minerals are heat stable under normal processing conditions. Food products, however, can gain or lose minerals based on the various processing conditions they are exposed to, such as the addition of salt or leaching of minerals during blanching. Sodium is often added to canned vegetables, primarily for flavor enhancement. The increases in sodium, calcium, and potassium due to addition during processing or hard water utilization.
CANNING AND FREEZING:During canning, canned vegetables contained significantly higher levels of sodium than their fresh and frozen vegetables. Potassium was highest in frozen vegetables. Calcium levels are varied, but in general canned vegetables contained similar or greater amounts of calcium compared with fresh and frozen products. The average mineral content for fresh, frozen, and canned vegetables are given below-

Table: Average selected mineral content of fresh, frozen, and canned vegetables
STORAGE:Minerals are generally unaffected during storage, except for iron and copper in canned foods. Iron can increase in foods canned in tin-plated steel cans, copper can decrease due to reaction with tin. Sodium, calcium, and potassium are not changes during storage.
Commodity
Sodium Potassium CalciumFresh Frozen Canned Fresh Frozen Canned Fresh Frozen Canned
Corn 0.032 0.010 2.288 1.73 2.475 2.515 0.009 0.025 0.017
Beans 0.011 0.008 2.143 1.942 2.634 1.328 0.255 ----- 0.236
Green peas 0.047 0.427 2.150 1.913 2.582 1.632 0.141 0.146 0.163

COOKING:Minerals can be lost during cooking by leaching into the cooking liquid. While this is a negative consequence for potassium and calcium, sodium loss is not nutritionally detrimental for most Americans.Table: Mineral losses due to cooking fresh green beans and peas (% ww)
Commodity Sodium Potassium Calcium
Green beans 0 -60 -29
Green peas -50 -44 -42

Retail market products and USDA database
Since most minerals are stable during storage. However, since cultivar, growing region, climate, processing location and other variables can influence mineral content in food.
Table: Selected mineral content in retail purchased green beans and peas
Sodium Potassium CalciumCooked from fresh
Cooked from frozen
Cooked from canned
Cooked from fresh
Cooked from frozen
Cooked from canned
Cooked from fresh
Cooked from frozen
Cooked from canned
Green beans 0.03 0.02 3.30 0.80 0.76 0.83 0.30 0.33 0.32
Green peas 0.01 0.03 2.30 1.40 1.20 1.20 0.18 0.27 0.27
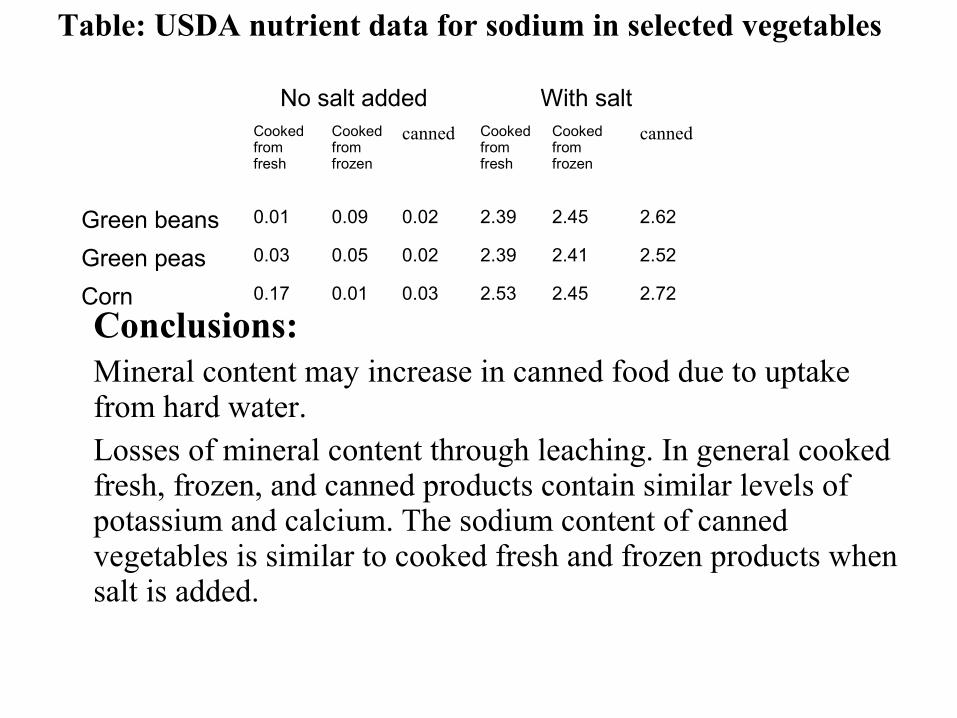
Table: USDA nutrient data for sodium in selected vegetables
Conclusions:Mineral content may increase in canned food due to uptake from hard water.Losses of mineral content through leaching. In general cooked fresh, frozen, and canned products contain similar levels of potassium and calcium. The sodium content of canned vegetables is similar to cooked fresh and frozen products when salt is added.
No salt added With salt Cooked from fresh
Cooked from frozen
canned Cooked from fresh
Cooked from frozen
canned
Green beans 0.01 0.09 0.02 2.39 2.45 2.62
Green peas 0.03 0.05 0.02 2.39 2.41 2.52
Corn 0.17 0.01 0.03 2.53 2.45 2.72
FIBER:
Fiber is a general term for plant cell wall components that are poorly digested by humans, such as cellulose and lignin.
Crude fiber may only represent 10-50% of the total dietary fiber available in food.
Although the recovery rates of crude fiber methods are low, crude fiber is still reported by some researchers.
Newer analytical methods assay dietary fiber, which includes both water soluble and water insoluble.
Since fruit and vegetables are good sources of fiber, it is important to analyze any effects processing may have on this component.
Fiber can be lost during processing, during separation steps such as peeling, filtration or stem removal.
Sometimes heat processing can change the solubility and other physiochemical properties of fiber.
However most studies analyzing crude and dietary fiber reported no significant changes in crude or dietary fiber after canning and freezing.

Fiber loss during processing
Canning and freezing:In the studies the canning process resulted in a significant loss of fiber only in those vegetables that underwent some physical separation.
Soluble, insoluble and total fiber did not change significantly after canning or freezing.
Bushway studied the effects of canning and freezing on fiddlehead greens.
On a wet weight basis, they found slight crude fiber losses of 7% and 8% respectively.
Storage:Significant changes in dietary fiber on a dry weight basis during refrigerated (27 days) and frozen (10 months) storage.
Bushway reported crude fiber losses of around 25% in both canned and frozen fiddlehead greens after 10 months storage.
Cooking:Apparent changes in fiber content during cooking have been attributed to changes in moisture content.
Wills reported slight (2-7%ww) losses in dietary fiber after cooking fresh green peas and beans, due to increase in moisture content.
Retail market products and USDA database:Wills purchased fresh, frozen, and canned green peas and green beans from a retail market. They found 25-35% higher dietary fiber levels in the cooked frozen and cooked canned vegetables than in cooked fresh products.
According to the USDA nutrient database, raw, frozen, and canned peaches all contained similar levels of total dietary fiber, around 0.015 /kg of fruit.
Conclusions:Changes in fiber during processing, storage, and cooking appear to be minimal for intact fruits and vegetables.
The stability of fiber during storage depends on commodity. In general fresh, frozen and canned fruits and vegetables contained similar amounts of fiber.

THANKS TO ALL