nwc - defense technical information center density axisymmetric jet into still air ... effect of...
TRANSCRIPT

NWC TP 6307
Effect of Turbulent Fluctuations onInfrared Radiation From a Tactical
Missile Plume<l! Final Report for Period 29 April 1980
Through 9 February 1981
byBlaine E. PearceAshok K. Varma
Aeronautical Research Associates of Princeton, Inc.
for the
Ordnance Systems Department
FEBRUARY 1982
NAVAL WEAPONS CENTERCHINA LAKE, CALIFORNIA 93555
Nwc
Approved for public release; distribution unlimited
Lw DTIC-. l ELECTE
2JUL 10201982
82 07 09) 016

Naval Wea sCenterAN ACTII/rY OF THE NA/AL MATERAL COMMAND
FOREWORD
This report presents results of an analytical investigation to assess the effects ofturbulent fluctuations on the infrared thermal emission from a rocket exhaust plume.The work reported herein was conducted from 29 April 1980 through 9 February1981 by Aeronautical Research Associates of Princeton, L•., under Contract No.N60530-80-C-0165 to the Naval Weapons Center.
The effort described herein was supported by the Naval Air Systems Commandunder the Missile Propulsion Technology Block Program (AIRTASK A03W3300/008B/0F31300000). Mr. Lee N. Gilbert is the NWC technology manager for this program.
Mr. A. C. Victor, the technical coordinator for this contract, has reviewed thisreport for technical accuracy. This report is released for information at the workinglevel and does not necessarily reflect the views of NWC.
Approved by Under authority ofC. L. SCHANIEL, Head J., J. LAHROrdnance Systems Department Capt., U.S. Navy28 January 1982 Commander
Released for publication bytR. M. HILLYER
Technical Director
NWC ec nical Publication 6307
Published by .•........,......... Technical Information DepartmentCollation ...................... ... Cover, 51 leavesFirst printing ... ....... ...... •.. 290 unnumbered copies)¶

UNCLASSIFIED1ECURITY CLASSIFICATION Of THIS PAGE ("oPhn Ot. ntewred)
REPORT DOCUMENTATION PAGE BEFORE C0ST UCTIONSBEOECOMPLE TJN•I. REPORT NUMBER %. OVT ACCESSION NO. 3. RECIPIENT*S CATALOG NUMBER
NWC TP 6307 A4-A9/i74, TITLE (and Subtitle) &. TYPE OF REPORT & PERIOD COVER1ED
EFFECT OF TURBULENT FLUCTUATIONS ON INFRARED Final ReportRADIATION FROM A TACTICAL MISSILE PLUME. 29 April 1980-9 February 1981FINAL REPORT FOR PERIOD 29 APRIL 1980 THROUGH A. PERFORMING DOR. REPORT NUMB•R9 FEBRUARY 1981 ARAP Report No. 445
7. AUTH4OR(#) is CONTRICT7 OR GRANT NUMexR~e)
Blaine E. PearceAshok K. Varma N60530-80-C-0165
9. PERFORMING ORGANIZATION NAME AND ADDRESS 10. PRGRAM ELEMENT, PROJECT TAIAREA B WORK UNIT NUMBERS"
Aeronautical Research Associates of Princeton, Inc.Princeton, New Jersey AIRTASK A03W3300/008B/0F31300000
II. CONTROLLING OFFICE NAME AND ADDRESS 12. REPORT DATE
Naval Weapons Center February 1982
China Lake, California 93555 IS. NUMBER Of PAGES100
14. MNITO11INQ AGEFACY NAME & AOORESS(iH different from Controlling Office) Is. SECURITY CLASS. (of this "pant)
UNCLASSIFIED
If&. O CL.ASSFICATION/GOWNGRArOINGSCHEDUL.E
IS. DISTRIBUTION STATEMENT (of this Report)
Approved for public release; distribution unlimited.
17. DISTRIBUTION STATEMENT (of the setrect ennteedit Block 20. If dilfferent boo Repor
IS. SUPPLEMENTARY NOTES
IS. KEY WORDS (Contknue on reoter. oide It noceewsy mid Identif7p by block ntinbee)Infrared Radiation
Radiation TransferRocket Plumes
Turbulent Fluctuations
20. ABSTRACT (Coatftnma. n revere. eide it nooseeavy and idmntif? by block owumbot)
See back of form.
.JAN 147 COITION OF I NOV6 IS OBLCTZ UNCLASSIFIEDS/N 0102-LF,014.-601 SECUITrY CLASSIFCATI@M OP '11115PA8 Date
IiCUT CIAUPuTI1 aOr TO Is an w •s

UNCLASSIFIED
SItCUAIY CLAttMFCAtON Of "14$S PAOZ (Men Do* EMthem
(U) Effect of Turbulent Ftuctuafons on Infitw Radat.,n From aTactical Mi*ile Pluhne Final Report for Period 29 April 1980 Through 9February 1981, by Blaine E. Pearce and Ashok K. Varma, AeronauticalResearch Associates of Princeton, Inc. China Lake, Calif., Naval WeaponsCenter, February 1982.. 100 pp. (NWC TP 6307, publication UNCLASSI-FIED.)
(U) Predictions of the effect of turbulent fluctuations of temper-ature and species concentrations on the infrared thermal emission froman afterburning exhaust plume of a tactical missile are summarized. Thehigh spectral resolution emissions from portions of the 4.3 /m CO 2 bandare examined. A consistent set of mean flow and turbulence properties inthe plume obtained from a second-order closure model of the turbulentflow is used in the calculation. A precise closure model of the turbulentflow is used in the calculation. A precise formulation of the meanradiance is given which includes contributions of second-order turbulencecorrelations and explicitly identifies the contribution of two-point spatialcorrelations along the line of sight. These correlations are shown toaffect the structure of individual spectral lines for non-optically thinpaths. Total plume intensities in narrow 5 cm- 1 wide spectral intervalsin the CO2 blue and red spike regions are not significantly augmented bythe turbulent fluctuations for this class of afterburning plumes. Turbu-lence augmentation is most important in the lower temperature outeredges of the plume and regions of downstream decay. The situationswhere turbulence augmentation could be an important contributor tototal plume intensities and to exhaust plume diagnostics are identified.
Accession ForN•TIS GRA&I -DTIC TAB
Just ification
By.Distribut ion/
i F A;;1abilit'Y Codes
[ •,all and/or ---
jDist Special OI
A ~copy: D
UNCLASSIFIEDs1cUOT ,A r oS"ICAIM •s O PAOSNI Dt tAIMS

NWC TP 6307
CONTENTS
Introduction 7. 7
Background .................................... ..................... 8
Flowfield Calculations ........................................ * ....... 9
Review of Available ades ......................................... 9
BOAT Computer Program ......................................... 10
RSL Computer Program .............................................. 10
Comparison of Computer Programs .................................. 10
Comparison of Results of The Two Codes forNonreacting Flows .............................................. 11
Constant Density Axisymmetric Jet Into Still Air .............. 12
Heated Axisymmetric Jet Into Still Air ..................... 15
Hydrogen Axisymmetric Jet Into A Moving Air Stream ............ 18
Summary of RSL - BOAT Comparisons for Non-Reacting Flows ...... 21
Reacting Flow Calculations ..................................... 21
Turbulence-Chemistry Interaction ............................... 24
Comparison of Turbulence Quantities ................... 23
Radiation from a Fluctuating Flame .................................... 33
Examination of the Correlation Terms ........................... 41
Radiation from a Turbulent Exhaust Plume ........................... 43Isolated Spectral Line ............................................ 43
In-Band Radiance -CO 2 Blue Spike ...... ....... 53
In-Band Radiance- CO2 Red Spike .................... 68
,i

NWC TP 6307
Summary and Conclusions ............................................... 76
Recommendations ....................................................... 78
References ............................................................ 80
Appendixes:
A - Numerical Evaluation of Integrals ................................. 82
B - Derivatives of the Planck Function and Spectral AbsorptionCoefficient ............................ .......................... 85
Nomenclature .......................................................... 95
Figures:
1. Predictions and Measurements ot the Axis Velocityin a Constant Density, Low Speed, Inert JetExhausting into Still Air. NASA Test Crse 6,uj = 211 m/sec, rj = .031 m .............................. 13
2. Effect of Varying the iSL Turbulence Length ScaleConstant on Axial Velocity Decay. InitialTurbulence Level Matched to BOAT Run at x = 4rConstant Density, Low Speed, Inert Jet Exhaustinginto Still Air ........................................... 14
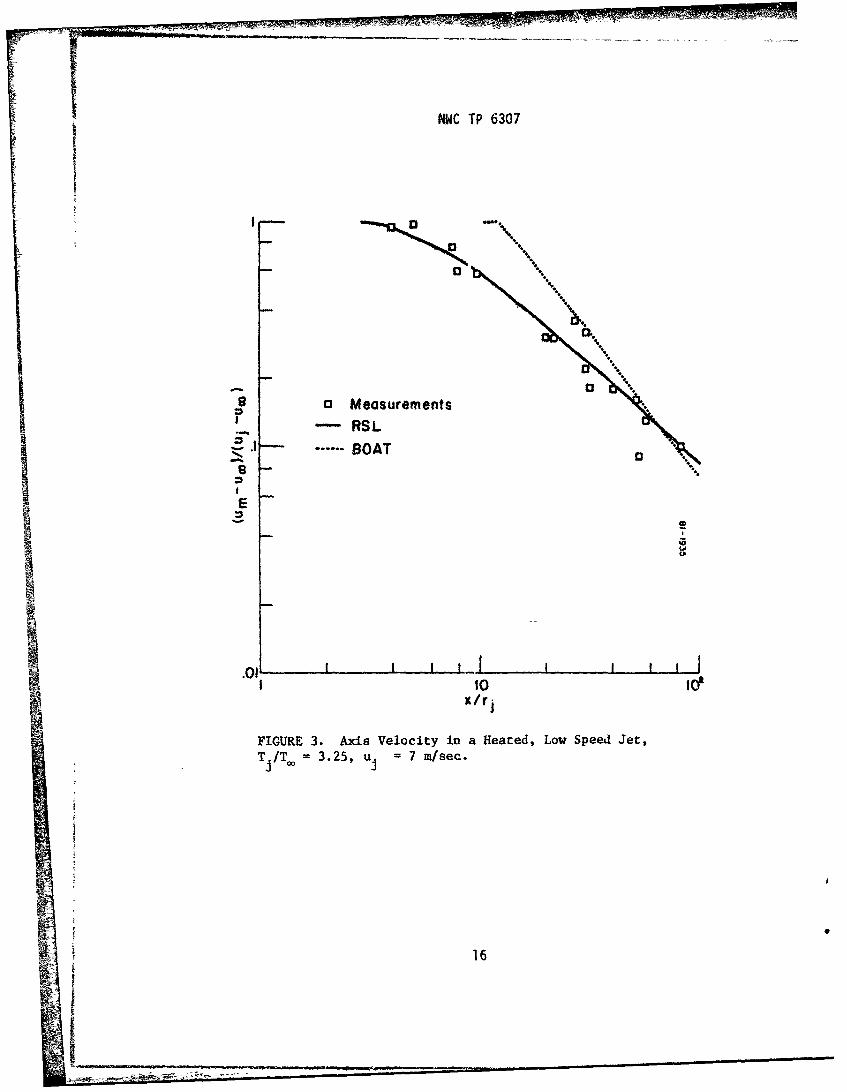
3. Axis Velocity in a Heated, Low Speed Jet,Tj/T, = 3.25, uj = 7 m/sec ............................... 16
4. Effect of Varying Turbulence Length Scale Constantin a Heated, Low Speed Jet. BOAT, RSL Matched atx/r 3 = 15.32. Tj/T, = 3.25, u. = 7 m/sec ............... 17
5. Axis Velocity in a Hydrogen Jet in a CoflowingStream. NASA Test Case 12, uj = 1074 m/sec,rj = .0058 m, u, : 394 m/sec ............................. 19
6. Axis Hydrogen Mass Fraction in a Hydrogen Jet in aCoflowing Stream. NASA Test Case 12 ..................... 20
7. Peak Temperature in the Model AfterburninZ ExhaustPlume. Temperature Normalized by a ReferenceTemperature of 300 K ..................................... 23
2

NWC TP 6307
Figures (Contd.)
8. Peak Ten, rature in the Model Afterburning FxhaustPlume for Various Length Scale Constants. PeakTemperature Normalized by a Reference Temperatureof 300 K ........... ............................. * 5
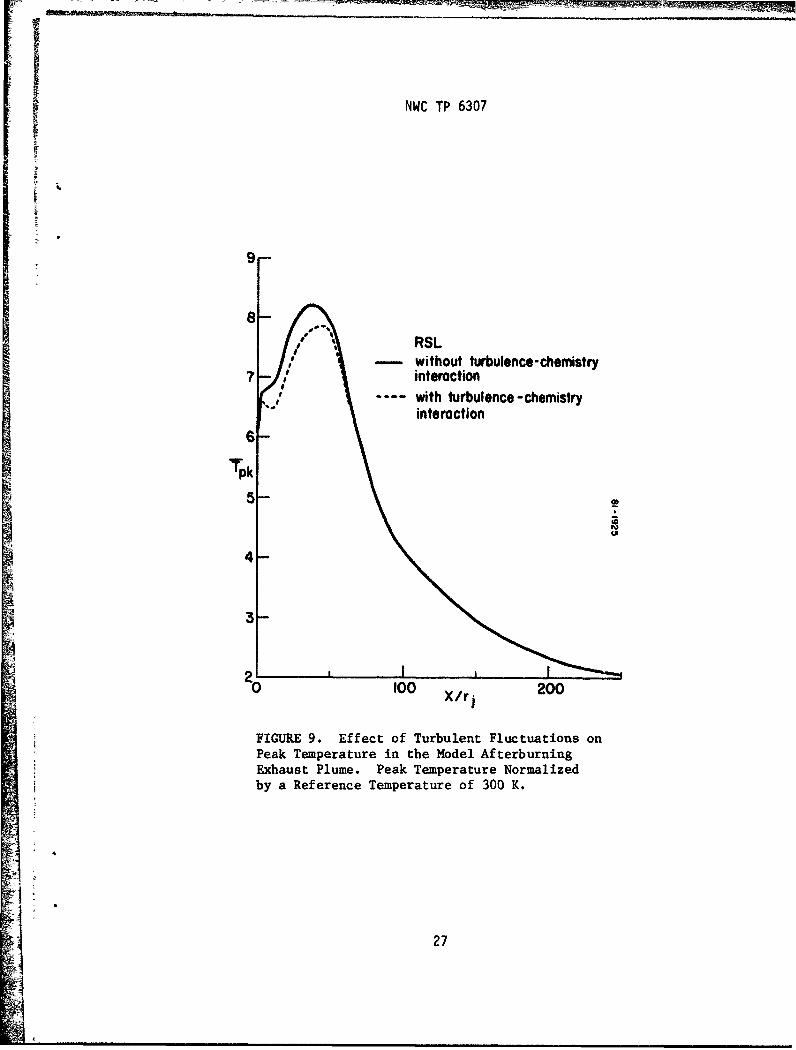
9. Effect of Turbulent Fluctuations on PeakTemperature in the Model Afterburning ExhaustPlume. Peak Temperature Normalized by a ReferenceTemperature of 300 K ..................................... 27
10. Radia. Distribution of Mean and FluctuatingProperties Predicted by RSL Code for the Model
-Afterburning Exhaust Plumu at x/rj 40.
Temperature and Velocity Normalized by ReferenceValues of 300 K and 2500 m/sec, Respectively ............. 29S11. Radial Distribution of Mean and FluctuatingProperties Predicted by RSL Code for the Model
Afterburning Exhaust PlMe at x/rj = 100.Temperature and Velocity Normalized by ReferenceValues of 300 K and 2500 m/sec, Respectively ............. 30
12. Radial Profiles of Mean and Fluctuating PropertiesPredicted by the BOAT Code without aCompressibility Correction for the ModelAfterburning Exhaust Plume at x/rj = 40 and 100.
A Temperature and Velocity Normalized by ReferenceValues of 300 K and 2500 m/sec, Respectively ............. 31
13. Radial P-ofiles of Mean and Fluctuating PropertiesPredicted by the BOAT code with a CompressibilityCorreccion for the Model Afterburning Exhaust Plumeat x/r3 = 40 and 100. Temperature and VelocityNormalized by Reference Values of 300 K and 2500m/sec, Respectively ...................................... 32
14. Radial Profiles of Mean and Fluctuating Propertiesin the Model Afterburning Plume at x/rj = 40. RSLPredictions, Nominal Start Conditions andTurbulence Length Scale ................................ 44
15. Spectral Structure of Isolated Lorentz Line.Broadside Line of Sight Off the Plume Axis atx/rj = 40, A 14.03 cm.. .................. ........ 45
3I' U3

NWC TP 6307
Figures (Contd.)
16. Spectral Structure of Isolated Lorentz Line.Broadside Line of Sight Through the Plume Axis atx/rj = 40, A= 4.03 cm ................................... 47
17. Integrated Radiance of an Isolated Spectral Linefor Various Correlation Lengths. Broadside Line ofSight at x/rj = 40. rp(x) = 0.429 m ..................... 48
18. Spectral Structure of Isolated Lorentz Line.Broadside Line of Sight Through the Plume Axis atx/rj = 40. A = 4.03 am .................................. 50
19. Spectral Structure of Isolated Lorentz Line.Broadside Line of Sight Off the Plume Axis at
x/rj = 40. A = 4.03 am .................................. 51
20. Integated Radiance of an Isolated Spectral Linefor Various Correlation Lengths. Broadside Line ofSight at x/rj = 40, rp(x) = .429 m ....................... 52
21. Radial Profiles of Mean and Fluctuating Propertiesin the Model Afterburning Plume at x/r- - 4. 0 RSLPredictions, Nominal Start Conditions andTurbulence Length Scale .................................. 55
22. Radial Profiles of Mean and Fluctuating Propertiesin the Model Afterburning Plume at x/r 20. RSLPredictions, Nominal Start Conditions andTurbulence Length Scale .................................. 56
23. Radial Profiles of Mean and Fluctuating Propertiesin the Model Afterburning Plume at x/r- = 100. RSLPredictions, Nominal Start Conditions andTurbulence Length Scale .................................... 57
24. Radial Profiles of Mean and Fluctuating Propertiesin the Model Afterburning Plume at x/r- - 200. RSLPredictions, Nominal Start Conditions andTurbulence Length Scale ............................... 58
25. Radial Distribution of In-Band Source RadianceAcross the Plume at x/rj= 10 ............................ 59
26. Radial Distribution of In-Band Source RadianceAcross the Plume at x/ri : 40 ............................ 60
4
-i

NWC TP 6307
Figures (Contd.)
27. Radial Distribution of In-Band Source RadianceAcross the Plume at x/rj 100........................61
28. Axial Distribution of In-Band Source StationRadiation for the Model Afterburning Exhaust Plume.CO2 Blue Spike Region ............................. 63
29. Source Snectral Radiance for a Line of Sight at theArial Location x/r = 10 and Off the Plume Axis atr = 0.4rp. CO2 Blue Spike Region ........................ 64
30. Source Spectral Radiance for a Line of Sight at theAxial Location x/rj = 20 and Off the Plume Axis atr=0.4rp. CO2 Blue Spike Region ........................ 65
31. Source Spectral Radiance for a Line of Sight at theAxial Location x/rj = 40 and Off the Plume Axis atr = 0.4rp. CO2 Blue Spike Region ........................ 66
32. Source Spectral Radiance for a Line of Sight at theAxial Location x/r 3 = 100 and Off the Plume Axis atr = 0.4rp. CO2 Blue Spike Region ...................... 67
33. Radial Distribution of In-Band Source RadianceAcross the Plume at x/rj = 100 ........................... 69
34. Axial Distribution of In-Band Source Station
Radiation for the Model Afterburning Exhaust Plume.CO2 Red Spike Region ..................................... 71
35. Source Spectral Radiance for a Line of Sight at t'ieAxial Location x/r- = 10 and Off the Plume Axis atr = 0.4rp. CO2 Red.Spike Region ......................... 72
36. Source Spectral Radiance for a Line of Sight at theAxial Location x/r 3 = 20 and Off the Plume Axis atr = 0.4rp. CO2 Red Spike Region ......................... 73
37. Source Spectral Radiance for a Line of Sight at theAxial Location x/rj = 40 and Off the Plume Axis atr=O.4rp. CO2 Red Spike Region .................. 74
38. Source Spectral Radiance for a Line of Sight at thejAxial Location x/r 100 and Off the Plume Axis atf Sr = O.4rp. CO 2 F4A Spike Region .... .... . ................. 75
4 54...........7

NWC TP 6307
Figures (Contd.)
B-I. Normalized Derivatives of the Spectral AbsorptionCoefficient: Single Line, Lorentz Line Shape,EO = 1500 cm- 1 , T = 300 K ................................ 89
B-2. Normrlized Derivatives of the Spectral AbsorptionCoefficient: Single Line, Lorentz Line Shape,Eo = 1500 cm- 1 , T = 1000 K .......................... .... 90
B-3. Normalized Derivatives of the Spectral AbsorptionCoefficient: Single Line, Lorentz Line Shape,Eo = 1500 cm- 1 , T = 2000 K ............................... 91
B-4. Normalized Derivatives of the Spectral AbsorptionCoefficient: Single Line, Lorentz Line Shape,Eo = 4500 cm-1, T = 300 K.............................92
B-5. Normalized Derivatives of the Spectral AbsorptionCoefficient: Single Line, Lorentz Line Shape,Eo = 4500 cm-1 , T = 1000 K ............................ 93
B-6. Normalized Derivatives of the Spectral AbsorptionCoefficient: Single Line, Lorentz Line Shape,E0 :4500 cm- 1 , T = 2000 K ............................... 94
Tables:
1. Initial Conditions for Model Afterburning Plume ............ 21
2. Average Turbulence Scale Constants, A/2rj .................. 24
3. Axial Locations and Plume Dimension for theRadiance Calculation ..................................... 54
ACKNOWLEDGMENT
This work was performed forrthe Naval Weapons Center, China Lake, CAunder Contract No. N60530-804-0165 monitored by Mr. A.C. Victor. Wethank our A.R.A.P. colleagues Dr. Guido Sandri and Dr. Robert McCulloughfor helpful discussions, and Ms. Susan Schiller for her carefulpreparation of the Manuscript. Dr. R.P. Rhodes of A.R.O., kindly made acopy of Reference 13 available before publication.
L6

NWL TP 6307
INTRODUCTION
This report summarizes the results of a study to assess the effectsof turbulent fluctuations on the infrared thermal emission from a rocket
exhaust plume. The propellant composition, length scales, and flightconditions are typical of those for a small tactical miasile. Weconsider emission from the CO2 molecule in the 4.3 gm wavelength region.This chemical species is formed in the afterburning region where thehigh velocity, high temperature, fuel rich rocket exhaust mixes with theambient air. The region where the plume and ambient air mix is highlyturbulent, with random fluctuations in temperature and radiating speciesconcentration. The goal of this study was to determine how thesefluctuating properties affect the gaseous thermal emission from thisclass of flows.
Our approach was to utilize the available turbulent flowfieldcomputational capability that has evolved from the higher-orderturbulence modeling efforts at Aeronautical Research Associates ofPrinceton. 1-3 The computational codes developed during these studiespredict the second-order correlations of the fluctuating temperature andchemical species in addition to the mean (time-averaged) properties ofthe flow. These predictions allow the time-averaged radiance to beevaluated with contributions from these fluctuations as well as the meanproperties of the exhaust plume flow.
The results of the study are presented in the following sequence. Abrief background and motivation for the work is provided in theremainder of the Introduction. The second section presents a discussionof the flowfield calculations, which includes a systematic comparison ofthe higher-order closure results with those obtained from the BOAT
1Donaldson, C. duP., "Atmospheric Turbulence and Dispersal ofAtmospheric Pollutants," Environmental Protection Agency, March 1973.(EPA-R4-73-016a, publication UNCLASSIFIED.)
2Fishburne,E.S., R.A.Beddini, and A.K. Varma, "The Computation ofAfterburning Rocket Exhaust Plumes," Aeronautical Research Associates ofPrinceton, Inc., July 1976. (A.R.A.P. Report No. 283, publicationUNCLASSIFIED.)
3Varma, A.K., E.S. Fishburne, and R.A. Beddini, "A Second-Order ClosureAnalysis of Turbulent Diff,'.ion Flames," NASA Langley Research Center,
' June 1977. (NASA CR-14522b, publication UNCLASSIFIED.)
7I

NWC TP 6307
module of the JANNAF Standard Plume Flowfield code (SPF). 4 This
comparison is included because the SPF will be the industry-wide tool
for predicting exhaust plume flows. The SPF predictions provide a
reference against which the more detailed, second-order closure results
can be compared. We also include in this section an assessment of the
importance of the turbulent fluctuations on the chemical reactions. A
derivation of the equation for the fluctuation augmented radiance is
given in the third section. The results of the radiance predictions are
given and discussed in the fourth section. In all cases, the radiance
with fluctuations is compared with that ignoring the fluctuations. A
summary and the conclusions are given in the final section. 5
BACKGROUND
Infrared signature codes currently available for routine use,
now5 or in the near future, 6 account only for emission from the mean
properties of the flow. However, the highly non-linear dependence of
the emission and absorption on temperature suggests that the true,
time-averaged* radiance should be different from that evaluated at the
mean properties:
N (T,c) i N (Tc) (i)
A simple quantitative example is easy to construct. Assume that Che
temperature dependence of the Planck function B,(T) can be approximated
by a simple power law of the form aTm (m = 4 exactly for the total
radiance, and 2 < m < 10 for the spectral radiance, depending on the
wavelength region and temperature). The time-averaged radiance,
4 Dash, S.M., et al., "Operational Instructions for a Preliminary Version
of the JANNAF Standard Plume Flowfield Model (SPF/1)," June 1980.
(A.R.A.P. Report No. 415, publication UNCLASSIFIED.)
5 Pergament, H.S., et al., "The Naval Weapons Center Target Signature
Code," February 1979. (A.R.A.P. Report No. 380, publication
UNCLASSIFIED.)
6 Ludwig, C. et al., "Development and Validation of a Standardized
Infrared Radiation Model (SIRRM)," JANNAF Standard Plume Model Workshop,
U.S. Army Missile Command, Huntsville, AL, 2-3 April 1981. (paper,
UNCLASSIFIED.)
*Averaged over times long compared to the time scale of the turbulent
fluctuations.
8
o

NWC TP 6307
accounting for the fluctuations T' about the mean temperature T is.approximately,
W ()/N (T) = 1 + 1/2 m(m - 1) L2 O(T4'4
12mm- 1)--+ - + ... . (2)
For afterburning rocket plumes, and many other turbulent flows,' T/T2 0.1, suggesting that the temperature fluctuations alone can
substantially enhance the radiance over that evaluated at the meantemperature. For example, if m = 5, the spectral mean radiance isdoubled by the temperature fluctuations. Of course, the actualsituation in a partially transparent volume of molecular emitters ismore complicated. The species and temperature sensitivity of themolecular absorption can be either positive or negative, and there arespatial correlations between fluctuations along the line of sight thatboth augment and diminish the radiance. A precise evaluation of the netchange in radiance requires that these additional factors be included.That is the goal of this study.
FLOWFIELD CALCULATIONS
REVIEW OF AVAILABLE CODES
Two state-of-the-art computer programs for the calculation ofturbulent reacting flows are available to us for predicting theflowfield properties of missile plumes of interest. The studies arerestricted to flowfields involving constant pressure mixing andreactions. One is the BOAT 7 code - the constant pressure turbulentmixing module of the JANNAF Standard Plume Model. The other code is theA.R.A.P. reacting shear layer (RSL) code. 2 The program has also beencalled the multi-equation turbulent reacting code (METREC) in someprevious publications. 8 Some features of the two codes of interest inthe current study are described below.
'Dash, S.M., and H.S. Pergament, "A Computational Model for thePrediction of Jet Entrainment in the Vicinity of Nozzle Boattails (TheBOAT Code)," NASA Langley Research Center, 1978. (NASA CR-3175,publication, UNCLASSIFIED.)
8Fishburne, E.S., and A.K. Varma, "Investigations of Chemical Reactionsin a Turbulent Media," Acta Astronautica, Vol. 6, 1979, pp. 297-308.
U9

NWC TP 6307
BOAT COMPUTER PROGRAM
The BOAT code solves a parabolic axisymmetric, steady viscous flowin which the turbulence is described by a two-equation, turbulencekinetic energy model. The code is capable of handling multi-species,multi-step chemistry. However, it does not calculate the correlationsbetween the various fluctuating scalar quantities such as, speciesconcentrations and between species concentrations and temperature thatare expected to be important in turbulence-chemistry andturbulence-radiation interactions. The program calculates only twoturbulence guantities: the turbulent kinetic energy,1/2q2 =/2(iN'?+ v -- + w 2 ), and the dissipetion rate, e. Thechemistry calculations in BOAT neglect the effect of the turbulentfluctuations on the reactions, and only the mean species andtemperatures are used to calculate the chemical source terms.
RSL COMPUTER PROGRAM
The RSL code solves a parabolic, two-dimensional (planar oraxisymmetric), steady, viscous flow that includes the conservationequations for the mean properties and all the independent second-ordercorrelations for a simple reacting system. The code has been designedto handle a total of three chemical species undergoing a one-stepforward reaction, a + 0 + y. The use of the basic shear layerassumptions leads to a set of 23 independent, coupled,_ partialdifferential equations; equations for the mean variables, p, ui, H, a,and p, and the second-order correlations. The computer program actuallysolves a total of 29 equations for a three-species system. Theadditional equations provide a chack on the mass conservation in theprogram and on the accuracy of the numerical 3cheme.
A major objective of the RSL code development was to provide aresearch tool to study the interactive effects of turbulence andchemistry. In the current application, the effect of all thesecond-order correlations on the chemical source term for the one-stepreaction can be included in the calculation. The interaction effectscan also be ignored and only tke mean variables used in the chemistrycalculation. A comparison of the two procedures will provide a measureof the importance of the turoulence-chemistry interaction for the flowunder study.
COMPARISON OF COMPUTER PROGRAMS
The two programs have different strengths and weaknesses as far asthe objectives of the current study are concerned. The objective is toevaluate the effect of turbulent fluctuations of species and temperatureon the mean gaseous radiation from an afterburning plume. The BOAT code
10
-4m•

NWC TP 6307
can handle the multi-step chemistry of the large number of species in atactical missile plume with the neglect of turbulence-chemistryinteraction effects. However, the BOAT code is unable to directlyprovide the values of various scalar correlations of species andtemperature in the flow which have to be known to calculate their effecton the radiation. In the two-equation turbulence model approach, thesescalar correlations will have to be estimated in some consistent mannerfrom 1/2q 2 and e. The RSL code solves modeled equations for thesescalar correlations and, therefore, directly provides their valuesacross the flowfield, without the need for additional assumptions.However, the RSL code has been designed for a simple one-step chemicalraiction. A modeling approach for multi-species, multi-step chemistryhas been formulated for use within the framework of the RSL code, 2 butthe approach requires many assumptions, and has not been extensivelytested. It was decided that the salient features ofturbulence-chemistry and turbulence-radiation interactions can bestudied in a simple chemically reacting flow that models one aspect ofafterburning in a real plume. The reaction parameters and flowconditions were chosen to simulate properties of the actual plume ofinterest. With the use of a simple one-step chemical reaction, it ispossible to compare the results of the BOAT and RSL codes for the sameflow conditions.
COMPARISON OF RESULTS OF THE TWO CODES FOR NONREACTING FLOWS
We emphasize that the comparison of predictions from these two codes§ was not a primary objective of this study. The decision was made to use
the RSL code to provide both the mean and fluctuating properties of theplume because we believe that to be the best available code thatprovides all these quantities. In addition, it was an initial objectiveto provide predictions from the current codes in use throughout theindustry for comparison, for both the flowfield and radiation. Anj,.itial calculation of a turbulent reacting axisymmetric jet of carbonwaonoxide (CO) in a coflowing air stream with the BOAT and RSL codesshowed very significant differences between the results from the twocodes. The parameter of the flow and the results are discussed later inthis section. The differences between the codes for the reacting flownecessitated a more extensive comparison of the two codes for simplerflows, and a number of such flowfields were studied in order to isolatethe reasons for these differences and also to compare the predictionswith measurements. The results of these tests are discussed below. Weinclude this comparison here because it serves at least two usefulpurposes. It establishes the validity of the mean flow predictions fromRSL for this type of plume by comparison with the results from the morefamiliar SPF/1. Secondly, the overall validity of both codes isassessed by comparison with experiment.

NWC TP 6307
Constant Density Axisyqmetric Jet Into Still Air
The data selected for this test was that obtained by maestrello andMoDaid, and was Test Case 6 of the NASA Free Turbulent Shear FlowsConference. 9 The initial mean velocity profile was measured at alocation 1 jet diameter (x/rj = 2) downstream of the exit, and was usedto start both the codes. The BOAT code used the standard k-e 0
turbulence model. The q 2 and e profiles at the initial station arederived with the use of a mixing length model. The RSL code is normallystarted with a cosine shaped profile for the turbulence kinetic energy,q2/2, with an arbitrary maximum value of .003(u. - u,,)2 . The lengthscale, A, is related to the shape of the q 2 profile; for an axisymmetricjet it is calculated as a constant times the distance from the jet axisto the point where q 2 is 25% of its maximum value. The standard valueof the constant is 0.2. The results from the two codes are shown inFigure 1 along with the experimental results for the decay of the jetvelocity on the centerline. Predictions from both the codes arereasonably satisfactory for this flow. The RSL code predicts a shortercore, but shows better agreement farther downstream.
The results for the two codes shown in Figure 1 are based ondifferent initial turbulence levels and scales. It is feasible to matchthe initial turbulence levels and profiles in the two codes, but in thecurrent formulation it is not possible to match the turbulence scalesover the entire flowfield. Currently, RSL does not incorporate atransport equation for the scale. The scale is algebraically related tothe local q profile, and is constant across the profile at every axialstation. A number of RSL runs were made after matching the meanvelocity and turbulence kinetic energy profiles to the results obtainedfrom the BOAT code at x = 4r . The e profile was used to estimate theaverage turbulence scale [(q 2/f) 3 / 2/c] and indicated the proper constantto be - 0.13 at the initial station. It must be remembered that thevalue of the scale constant will have to be changed at other stations tocontinue to match the scale being used in the BOAT code, and this cannotbe accomplished in the current RSL code. The RSL runs used three scaleconstants, 0.1, 0.15, and 0.2. The results are shown in Figure 2. Theresults show that by selecting a smaller scale constant that is in linewith the scale in the BOAT code, the RSL code result4 .*or the length ofthe core are in good agreement with the BOAT code. Farther downstream,it appears that the scale constant should increase towards 0.2, thenominal value used in standard RSL runs.
ree Turbulent Shear Flows, Vols. I & II, NASA Langley Research Center,July 1972. (NASA SP-321, publication UNCLASSIFIED.)
*The common terminology for the turbulence kinetic energy is k = 1/2q 2 .Two-equation turbulence model codes are therefore referred to as k-Emodels.
A 12

R -7
NWC TP 6307
I a0 00 06F
Eo Measurements, NASA Test Case 6- RSL,normal start
....... BOAT, k-c turbulence model
!U
Ii I I- I I I --1010
x/rj
FIGURE 1. Predictions and Measurements of the Axis Velocityin a Constant Density, Low Speed, Inert Jet Exhausting intoStill Air. NASA Test Case 6, uj = 211 m/sec, rj .031 m.
13

97PIMER ',f--ý77M2__
NWC TP 6307
0
NO %
NO
0 Measurements, NASA Test Case 6RSL Predictions
- Scale constan-t = 0.10=O. 15
ZO-C-
.0 L I10 0e
X/rj
FIGURE 2. Effect of Varying the RSL Turbulence LengthScale Constant on Axial Velocity Decay. Initial TurbulenceLevel Matched to BOAT Run at x = 4rj. Constant Density,Low Speed, Inert Jet Exhausting into Still Air.
14

NWC TP 6307
In summary, both the codes are in reasonably good agreement with theexperimental data for low speed isothermal jets when they each use theirnormal start procedures for the turbulence parameters. The results ofthe two codes also appear to be consistent with one another when thebasic differences in the length scales used in the programs are takeninto account.
Heated Axisymmetric Jet Into Still Air
Measurements of the decay of the axial velocity in heatedaxisymmetric jets into still air are reported in Abramovich.10 Theinitial ratio of jet temperature to the ambient is 3.25. Both the codeswere started with basically top hat mean profiles at the exit plane ofthe jet.* The length scale A is the same as in the isothermal jetstudy; 0.2 times the distance from the jet axis to the point where q2
drops to 25% of its maximum value. This procedure will overestimate thescale to some degree in the potential core region where the turbulenceis restricted to the shear layer region, but the scale specificationwill be correct farther downstream. The results from the two codes areshown in Figure 3. The RSL results are in better agreement with thedata for this flow. The BOAT code predicts a much smaller effect of thelower density of the jet fluid compared to the results for theisothermal, constant density flow.
Tht major reason for the differences in the results obtained fromthe two codes for this flow is the different choices for the initialturbulence intensity and length scale. Some of the differences are alsodue to different modeling of density fluctuation terms in the fullsecond-order closure turbulence model and the two-equation model. SomeRSL runs were started with the initial conditions for the mean velocity,mean temperature, and turbulence kinetic energy matched to the resultsfrom the BOAT code at x = 15.32rj, after the end of the potential core.The average A across the profile at this axial position in the BOATresults corresponds to the use of a scale constant of 0.25 in RSLinstead of the normal value of 0.2 used in RSL for axisymmetric jetproblems. RSL runs were made with the scale constant set equal to 0.2and 0.25, and the results are shown in Figure 4. The results of theseRSL runs with initial conditions matched to BOAT at x = 15.32r 3 showmuch better agreement with the downstream results obtained from BOAT,than the results shown earlier in Figure 3. The RSL run with the scaleconstant of 0.25, that approximately matches the initial scales in thetwo codes, deviates somewhat from the BOAT results, while much better
10Abramovich, G.N., The Theory of Turbulent Jets, The MIT Press,
Cambridge, MA, 1963, Chapter 7.
*The initial q2 profile in RSL was chosen to be s arply peaked near thejet radius, with a maximum value of .0O3(uj - us,)
-15
NWC TP 6307
9 13 Measurements-RSL
-... ......BOAT
E
.013
IO toI II
x/ri
FIGURE 3. Axis Velocity in a Heated, Low Speed Jet,T IT. 3.25, u.j 7 rn/sec.
16
II

5A_
NWC TP 6307
-- 000 0
oau
- 0"
g~
a MeasurementsE - RSL, scale constant a 0.2
.3 o-. -RSL, scale constant = 0.25....-.- BOAT, ke turbulence modelS-4
1 1 10'x/rj
FIGURE 4. Effect of Varying Turbulence Length Scale Constantin a Heated, Low Speed Jet. BOAT, RSL Matched at x/rj - 15.32.T /T, = 3.25, uj 7 m/sec.
17

IWNC TP 6307
agreement is shown by the run with scale constant of 0.2. Thedifferences between the RSL and BOAT runs with the matched initialscale3 may be due to a) differences in turbulence models in the codes,b) lack of agreement among the scales at downstream locations, orc) differences due to scale variation across the profile in BOAT, whileRSL currently uses a constant scale across the profile for a jet flow.
In summary, the RSL code demonstrates significantly better agreementwith the experimental data when it uses its normal start procedure. TheBOAT code shows a very small effect of the density variation on theaxial velocity decay profile, and is not in good agreement with thedata.
Hydrogen Axisymmetric Jet Into A Moving Air Stream
Eggers 9 made measurements of mixing in relatively high speed streamsof hydrogen and air. The centerline variation of the axial velocity andhydrogen mass fraction was measured. The initial velocity profile atthe nozzle exit shows the presence of wall boundary layers, and has asubstantial velocity defect. The RSL code has some difficultiesstarting from this initial profile due to the problem of specifying theproper turbulence scale distribution. A BOAT run was carried out fromthe initial profile, and then an RSL run was started using the resultsof the BOAT code at an axial station 4 radii downstream from the nozzleexit. The RSL run matched the mean velocity, mean speciesconcentration, and the turbulent kinetic energy profile at the initialstation. The average turbulent length scale across the profile at thisaxial station in the BOAT results corresponds to the use of a scaleconstant of 0.2 in RSL. The axis velocity and hydrogen mass fractionsobtained from the BOAT and RSL codes (C = 0.2) are shown in Figures 5and 6, respectively along with the experimental data. The BOAT codepredictions are in good agreement with the data. The RSL results startout in good agreement with the BOAT resulti (as expected for matchedinitial conditions) but then deviate from them. We compared the lengthscales in the two codes at x/r - 40 and found that the average scaleacross the flow in BOAT was 501 higher than that in RSL. Fartherdownstream, at x/rj = 100, the scales in the two codes are againcomparablz. We made another RSL run using a scale constant C = 0.3, andthese results art. also plotted in the figures. The velocity decay datais bounded by the RL. results with the two length scales. The speciesmass fraction is overpredicted at large distances, even with the largerscale constant. It is clear from these comparisons that much of the
A difference between the mean flow predictions of these two codes for thisparticular test case is due to the different length scales. Due tolimitations in the length scale model currently being used in RSL, theRSL results for this flow are not very satisfactory. The results of tneBOAT code for this flow are in good agreement with the data.
ij18

NWC TP 6307
o MeIsurements, NASA Test Case 12
."--BOAT, k- model-- RSL, scale constant x 0.2o -0 . RSL, scale constant x 0. 3
\0
% \ %
0 - \
FIGURE 5. Axis Velocity in a Hydrogen Jet in a CoflowingStream. NASA Test Case 12, u = 1074 rn/sec, r .0058 m,u. 394 rn/sec.3,, 19

NWC TP 6307
o Measurements, NASA Test Case 12BOAT, k-e model
-- RSL, scale constont - 0.2-- RSL, scale constant a 0.3
- b1%. %
"o \
0
00C"I
0'0 x *
FIGURE 6. Axis Hydrogen Mass Fraction in a Hydrogen Jetin a Coflowing Stream. NASA Test Case 12.
S20
.0 0L0

NWC TP 6307
Summary of RSL -. BOAT Comparisons For Non-Reacting Flows
V• - The three test cases carried out here show mixed results. Both thecodes are satisfactory for the constant density jet flow, but for thetwo variable density flows, RSL does better for the heated jetexperiments while BOAT performs better for the light species jet.Further tests on more complex flows will have to be carried out todocument the superiority of one code over the other. The predictions ofthe codes are in reasonable agreement with each other when the initialconditions for the turbulence scale and turbulent kinetic energy arematched.
REACTING FLOW CALCULATIONS
The 'wo computer codes were used to calculate the flowfieldproperties of a turbulent reacting axisymmetric jet of carbon monoxidein a coflowtng stream of air.* The initial conditions for thecalculations were as follows:
TABLE 1. Initial Conditions for ModelAfterburning Plume
Jet Stream External Stream
uj = 2500 m/sec u. = 300 m/sec
1D = 0.13 m T. = 3000Kki
Tj = 1200 0 K
Species Mass Fraction Species Mass Fraction
CO = 0.25 02 = 0.23
N2 = 0.75 N2 = 0.77
Vchosen to simulate the exhaust plume from a small (5000 lbf thrust)tactical missile using a non-aluminized solid propellant.
21
I

I4WC -rP 6307
For both cases, the initial velocity a-d species profiles werecosine curves between the jet and external stream values. The initialtemperatAre profile had a peak- temperature of 1836 K in the mixingregion to ionite the CO jet. The BOAT code used its conventional startprocedure (a mixing length model) to calculate the initial profiles ofturbulence kinetic energy, 1/2q 2, and the dissipation rate, e. The BOATcode incorporates an empirical compresetibility correction model to beused for high speed flows, and the calculations for the CO jet were madeboth with and without the use of this correction. The RSL code was alsostarted with its normal start procedure. A cosine shaped profile forthe turbulence kinetic energy 1/2q 2 is used with a maximum value of.003(uj - u.) 2 . The length scale, A is b-ised on the q 2 profile with ascale constant of 0.2.
The carbon monoxide reaction with atmospheric oxygen is assumed tobe an overall one-step irreversible reaction
kfa + Y (3)
with a the air species (N2 ,0 2 ),
C the plume species (CO,N 2 ),
y the products (C02 ,N2 ).
13k 2 x 10 exp(-15000/RT) (4)f.
This reaction mechanism is a significant simplification of themulti-step elementary reactions that are believed to take place. Thechemical source terms in the BOAT code are calculated using the meanspecies concentrations and the mean temperature, and neglecting theeffect of turbulent fluctuations on the chemistry. RSL calculationswere carried out in two different ways; one using only the mean values,and the other including the effect of second-order species fluctuationcorrelations and mean square temperature fluctuations on the chemicalsource terms.
The axial variation of the maximum temperature in the flow obtainedfrom the BOAT and RSL computer programs is plotted in Figure 7. The useof the compressibility correction in the BOAT predictions decreases therate of mixing and extends the reaction zone to some degree. The RSLcalculations shown here used only the mean scalar variables to calculatethe chemical source terms, that is, the same procedure as in the BOATcode. The predictions of the RSL r-n with the normal value of the scaleconstant, C 0.2 for axinymmetric jet flows, are significantly
22

NWC TP 6307
S9- "--"RSL
BOAT, r model, with compressibility
correction8 - BOAT, ke model, without comp. corr.
II
7
6
5 ,
4 -
SIT
3 --
6- 01 20
t, \
3,23I
20 100 X/j200
FIGURE 7. Peak Temperature in the Model After-burnintg Exhaust Plume. Temperature Normalized byj ~a Reference Temperature of 300 K.
• 23

Wt, TP 6307
different from both the BOAT predictions. A comparison of the values ofthe turbulence scale in the two codes at different axial stations wascarried out, and the results are tabulated below.
TABLE 2 - Average Turbulence Scale Constants, A/2rj
BOAT RSL
scale constants
x/r3 with comp W/o comp C=0.15 C=0.2 C=0.25
0 0.10 0.10 0.13 0.17 0.2120 0.33 0.37 0.15 0.21 0.2740 0.66 0.58 0.19 0.31 0.47
100 1.08 0.87 0.36 0.72 1.12
At the initial station, the RSL scale length is larger, but at otheraxial stations, within the afterburning region (x/r* < 100), the scalelength is significantly smaller. At around x/r= 181, the differencebecomes less than at earlier stations. Additional RSL runs were madewith the scale constant set at 0.15 and 0.25 to attempt to resolve thediscrepancy between the RSL and BOAT results. The complete set ofresults for the RSL cases is shown in Figure 8.
The scale in RSL runs with C = 0.25 is closer to the BOAT scale inthe region from 10 to 50 diameters, and so are the predictions for thepeak temperature. Still, there are other differences between the tworesults that cannot be explained by the different scales, but certainlymatching the scales improves the agreement between the predicted resultsfrom the two codes.
For the purposes of the current study, we need the consistent set ofspecies and temperature correlations provided by the RSL code. In theabsence of experimental data on reacting afterburning plume flows to fixthe empirical value of the scale constant, we will retain the standardvalue of 0.2 that we use for nonreacting axisymmetric jet flows.
TURBULENCE-CHEMISTRY INTERACTION
The non-linear dependence of the chemical reaction rate ontemperature [Eq. (4)] suggests that, like the radiant emission, the13 time-averaged chemical species production is different from thatevaluated at the mean temperature and species concentrations.
424

NWC TP 6307
9 RSL Predictions
--- Scale constant 0 0. 15
8 ��• Scale constant= 0.20SScale constant= C.25
6
4
%%, %
3
20 100 200
X/rj
FIGURE 8. Peak Temperature in the Model After-
burning Exhaust Plume for Various Length ScaleConstants. Peak Temperature Normalized by a
Reference Temperature of 300 K.
25

?NWC TP 6307
Expansions of the species production rate, keeping terms up to thesecond-order correlations are included in RSL. The rate of formulationof product 3pecies, y,i As
dy/dt = kf a (5)
If each term is expanded in _terms of a mean and fluctuating part,kf =kf + k. a= a+ , p p+ p3, then
dy/dt kfa•0( + a''/ ... ) (6)
where
kf kf(T)[1 + E(E/2 - 1)T' 2 /T 2 + ... ] (7)
The neglected terms involve second-order correlations of Hwith a', B',
and all third- and higher-order correlations. a' '/a p is the"unmixedness correlation" which defines the effect of speciesfluctuations on the reaction rate. In P diffusion flame where thereactants are initially separated (as the case for afterburning rocketplume), this correlation is negative. Limiting cases are: 8
fast chemistry: a'l' /a 0 + -1.0
slow chemistry: a'l' /a p ÷ -0.2
RSL runs have been made using the above expression for the chemicalsource term as well as using only the mean variables; that is,dy/dt = kf(T)a P. The two results are shown in Figure 9. Thecalculations show that in this simulation of an afterburning plume, thechemical reactions are virtually completed at 50 radii downstream of thenozzle exit. The fuel (CO) mass concentration has decreased from aninitial value of 0.25 to about 0.02 at this station. Furtherdownstream, the flow is simply the mixing and cooling of a hotaxisymmetric jet. The turbulence-chemistry interaction effect3 willonly be important in the initial reacting region, and the inclusion ofthe species fluctuations, as expected, acts to reduce the reaction rate,and leads to a slightly lower peak temperature. Due to the small extentof the reaction zone, turbulence-chemistry interactions are not veryimportant in this flowfield. The axial profile of the peak temperatureis virtually identical for the two runs beyond 50 radii.
26L- _
NWC TP 6307
9
8
fit/ RSL,without turbulence-chemistry
7 I interaction- with turbulence -chemistry
interaction
6
4 -ý_4
.y 3
2 I I_0 100 X/rj 200
FIGURE 9. Effect of Turbulent Fluctuations onPeak Temperature in the Model AfterburningExhaust Plume. Peak Temperature Normalizedby a Reference Temperature of 300 K.
27

NWC TP 6307
The fact that the turbulence-chemistry interaction is not a majorfactor in this particular flow can be explained by two effects. One isthat the magnitude of the "unmixedness correlation" is insufficient tosubstantially reduce the reactant production below its nominaltime-averaged value. Moreover, the effect of the temperaturefluctuations acts in the opposite direction to increase the rateconstant (for exothermic reactions). These two effects, unmixedness andtemperature fluctuations, therefore tend to cancel each other. It isimportant to note also that this result is highly dependent on thespecific reactions because the augmentation by temperature fluctuationsqepends_ on activation energy.9 For the case considered here,E = E/RT < 7.5 in the reacting layer and FT'--/T2 4 0.1. For theseconditions, the rate constant is at most tripled, which is insufficientto significantly change the mean flow properties even if there were nocompensating unmixedness correction. The detailed results for theexhaust plume certainly support these qualitative arguments. We cautionthat each flow situation and chemical system must be individuallyexamined for the relative importance of these effects. Moreimportantly, the conclusions here are based on a global reaction scheme.It is possible that a more precise specification of the chemistry, interms of the elementary reactions involving all the trace species, willbe more sensitive to the turbulence.
COMPARISON OF TURBULENCE QUANTITIES
The final comparison between the RSL and BOAT code predictions isbetween the radial profiles of mean temperature, and the turbulencequantity predicted by both codes; the turbulence kinetic energy. Themean square temperature fluctuation and product species fluctuationk* from the RSL code are also shown. The radial mein temperatureprofiles at x/rj = 40 and x/r= 100 and radial profiles of theturbulence kinetic energy, temperature and species correlations areplotted in Figures 10 and 11. The profiles for the mean temperature andthe turbulence kinetic energy at the same axial stations from the BOATcode are shown in Figures 12 and 13 without and with the compressibilitycorrection, respectively. Due to the extended reaction zone in the BOATpredictions with the compressibility correction, the mean temperatureprofiles at x/rj = 40 are quite different. The turbulence level withthe compressibility correction is increased over that without the
*This quantity is a mean square mass fraction fluctuation. Theradiation formulation requires mole fractions. The conversion from massfraction to mole fraction in this case is c' = y' c/y, approximately.In the most general case, conversion from fluctuating mass fraction tomole fraction involves correlations between all species. The largesterror in neglecting the fluctuations occurs in mixtures with specieswith disparate molecular weights (e.g., hydrogen containing mixtures).The error is negligible for the mixture considered here.
28

NWC TP 6307
9 - -3.6 -1.8
T
S8 - : 40 -3.2 -1.6
7 -- 7 -- 2.8- 1.4* '\6 --- T'I
6 'XO' 2.4- 1.2a
T qf 2
5 , - -2.0-1.0
3: 1.2- .6•-0.8-A'I *,-- , o*-.
/ qxio,
JJ
-_ /.•,0.4- .2
0 I 2 3 y/j4 5 6 0 -- 0
FIGURE 10. Radial Distribution of Mean and Fluc-tuating Properties Predicted by RSL Code for theModel Afterburning Exhaust Plume at x/rj - 40.V Temperature and Velocity Normalized by ReferenceValues of 300 K and 2500 m/sec, Respectively.
29

NWC TP- 6307
5- -2.0- 1.0
T1.6 .8
3 - X 01.2- .6
S--2
2 MP --, 4
0.4- .2
0I I 0A-0 I 23 y/ri 4 5 6
FIGURE 11. Radial Distribution of Mean and Fluctu-
ating Properties Predicted by RSL Code for the Model
Afterburning Exhaust Plume at x/rj = 100. Temperature
and Velocity Normalized by Reference Values of 300 Kand 2500 m/sec, Respectively.
30

NWC TP 6307
5 . -1.0
X=40rj
4 -.. .8
-. 6TO
_X =lOOrj -. 4
X -X 4 Or .2
I I II0 I 2 3 y/rj 4 5 6
FIGURE 12. Radial Profiles of Mean and Fluctu-ating Properties Predicted by the BOAT Codewithout a Compressibility Correction for theModel Afterburning Exhaust Plume at x/rj = 40and 100. Temperature and Velocity Normalized byReference Values of 300 K and 2500 m/sec,Respectively.
31
Li

W C TP 6307
9 - -- 3.6
8 - -3.2
7 -2.8// q = X l O0 = "
6\X=4Orj • q'XIO' 2.46,"~~ 100X= Orj
5- T- 2.0"J \k "T" X =40rj,
4- 1.6
3- -- 1.2 a
2 - T0.8
I 0.4
0 I 2 3 4 5 6•'-• •y/r 1
FIGURE 13. Radial Profile of Mean and Fluctu-ating Properties Predicted by the BOAT Code witha Compressibility Correction for the Model After-burning Exhaust Plume at x/rj = 40 and 100.Temperature and Velocity Normalized by ReferenceValues of 300 K and 2500 m/sec, Respectively.
32
i _ _

NWC TP 6307
correction, and is larger than that predicted by the RSL code.
The turbulent kinetic energy levels predicted by the RSL code arecomparable to the levels in the BOAT predictions without thecompressibility corrections in spite of the differences in the mean
= properties. This agreement is not a verification of the predictionsfrom either code, but it is an encouraging result, particularly sincethe other turbulence correlations prei4.za 4 by RSL are to be used tostudy the effect of fluctuations on the radiation, from the hot reactionproducts without benefit of a similar comparisoi. The differences inthe predictions of the mean properties in the two codes for reactingflows require further investigation and detailed comparison withexperimental measurements to assess the relative performance of the twocodes.
The RSL results for the scalar correlations, y'= and T'', and thevelocity correlation a2, show that these radial profiles are quitedifferent. It is not correct t,, directly relate these other scalarcorrelations to the turbulent kinetic energy alone. Thus, the couplingof turbulence and chemistry and/or turbilence and radiation thatrequires information about many second-order correlations, cannot beadequately studied with a flowfield code using simply the two-equation,k-e turbulence model alone. Additional turbulence equations and modelassumptions will have to be used for this task. For example,three-equation, k-c-g turbulence models, algebraic stress modeling(quasi-equilibrium models), or complete second-order closure models asused in the RSL code are required.
RADIATION FROM A FLUCTUATING FLAME
We begin with the integrated equation of transfer for the spectralradiance along a given optical path through the plume
N k(T)c [exp kf a ds' ds . (8)
JO W W
W is the spectral absorption coefficent which is due to the summationof the contribution from many rotational lines in a vibration-rotationalband. The spectral dependence of this absorption is very complicated;it varies by an order of magnitude within spectral intervals comparableto a line width (< .05 cm- 1), and there may be hundreds of lines ofvarying strength contributing to the absorption at a given wavenumber.In the typical spectral resolution of low-resolution radiance
predictions (5 - 25 cm- 1), there may be contributions from thousands oflines. There are two ways of dealing with this computational
33
NEGTp 6307
problem: one, is to perform the calculation on a purely monochromaticbasis (line-by-line approach) and accept the computational petalty; theother is to use-- a band model approach in which the absorption isspectrally averaged over many lines before the spatial integration isperformed. For homogeneous optical paths, this interchanging of thespectral and spatial integration is exact. However, for non-homogeneouspaths, it is exact only for optically thick or optically thin paths.Intermediate optical depths are essentially an interp'lation betweenthese two limits that requires spatial averages of two parameters: theabsorption coefficient, and the ratio of average line width tospacing.11, 12 These spatial averages make application of the band modelcalculation difficult to a ply when the optical path is to include thefluctuating quantities.* 1 The line-by-line approach was thereforechosen for this study. This permits the direct expansion of theradiance in terms of known mean and second-order correlations of thefluctuating properties provided by the turbulent flowfield solution.
There is a disadvantage to choosing the line-by-line formulation.The required tabulation of line properties (spectral positions,strengths, and quantum states) is incomplete. Vibrational transitionsbetween energy states that become populated only at high temperatures0> 6000K) are absent from the available compilation. 14 However, analternative source for these "hot lines" has been devised for the linear
'1 Ludwig, C.B., et al., Handbook of Infrared Radiation from CombustionGases, 1973. (NASA SP-3080, publication UNCLASSIFIED.)r 12Young, S.J., "Nonisothermal Band Model Theory," The AerospaceCorporation, September 1976. (SAMSO-TR-76-207, publicationUNCLASSIFIED.)
*Rhodes 1 3 used the clever approach of defining an ensemble average ofthe radiance over many realizations of the optical path. Properties ateach point were chosen by random selection from an assumed probabilitydensity distribution. The mean radiance was obtained by arithmetricallyaveraging the radiance for each realization of the optical path.13Rhodes, R.P., "The Effect of Turbulent Fluctuations on the InfraredRadiation from Rocket Plumes," 12th JANNAF Plume Technology Meeting,CPIA Publication 332, Vol. III, December 1980, pp. 81-97. (paper,UNCLASSIFIED.)
14MoClatchey, R.A., et al., "AFCRL Atmospheric Absorption LineParameters Compilation," Air Force Geophysics Lab., January 1973.(AFCRL-TR-73-0096, publication UNCLASSIFIED.)
34

NWC TP 6307
CO2 molecule. 15 In the optically thin limit, the band model andline-by-line computations are equivalent. The temperature sensitivityof emission from the 4.3 Mn CO2 band has recently been described in thislimit for the band model formulation. 1 6 However, the need in thepresent study was for an approach that was uniformly valid for anyoptical depth. Therefore, the line-by-line formulation was chosen.Because the pressure is atmospheric and the temperatures are moderate,we assumed a Lorentz line shape and considered only collisionbroadening.
A precise evaluation of the radiance from a fluctuating optical pathrequires a joint probability density function, PDF(T, ci, 0), for thetemperature and composition at every point in the plume, i, along theoptical path. However, the properties available are the mean values T,cj, and second-order correlations, -T1 cIT', and c'c1 at each point.The fluctuating radiance calculated here can use only these quantities.The approach was to decompose each variable into its mean andfluctuating part. For primary variables, these two components areobtained directly from the turbulent flowfield solution. Secondaryquantities such as the Planck function and absorption coefficient wereexpanded about their values at the mean temperature and composition toexpress their fluctuations in terms of the fluctuating species andtemperature.
B (T) B + B' B (Y) + T dB/dT T'/T + 1/2T2 d 2 B/dT 2 T' 2 /7T2 +() o () (9)
k (T) k + k' k (T,c) + T ak/lT T'I/T + bk/bc a'W 0 0
+ 1/2 Y2 b2 /•T 2 T, 2 /f 2 + T 62k/FTac c'T'/T + 1/2 • 2k/?c 2 c"2 +
(10)
These two expansions, along with T T + T' and c -a + c' were used inEq. 8, which was expanded retaining only terms up to and including thesecond-order correlations T', c-T', and c' -. The algebra is tedious,
IbMcCullough, R.W., "Compilation of CO2 Rotational Lines IncludingTransitions That Are Important at Temperatures up to 2000OK,Aeronautical Research Associates of Princeton, Inc., unpublished,December 1980. (paper, UNCLASSIFIED.)
16Draper, J.S., L.S. Bernstein, and W.K. Cheng, "Fluctuating Emissionfrom Molecular Vibrational-Rotational Bands," J. Quart. Spectrosc. andRadiat. Transfer, Vol. 23, 1980, pp. 323-326.
35

NWC TP 6307
and only the final reuult is given here.
The particular property of the fluctuating radiance we chose toevaluate was the time-averaged value, N,(Tc). This quantity is whatwould be measured by a sensor that has a temporal response that is slowcompared to the frequencies of the plume fluctuations. There are otherquantities of interest which define the effect of turbulentfluctuations, such as the mean square radiance fluctuation, (N.- M-)2.However, this quantity does not indicate the direction in which thefluctuations act on the radiance; enhancing or diminishing the averageradiance from the value that was obtained using only mean flowproperties.
The final result for the average radiance is given below. The stepstaken in its derivation were:
1) expand each term in the integral in terms of its mean andfluctuating component,
2) expand the transmittance integral about the mean optical path,separating out the optical depth of the mean flow; and thenexpand the fluctuating part:
exp(f c d =exp fkoC ds ex F(c',T',.... ds
exp (fkoC ds 1 fF(c',T',...)ds' + 1/2 F(c',T'...)ds]2 +
-If Jo (11)S
where F(c' ,T'...) denotes terms involving the fluctuating properties.
Note that the square of the integral within the expansion canbe expressed as a double integral over the square domain witharea s2.
3) Perform the multiplications and discard all higher-order termsbeyond the second-order correlations,
4) time-average the result.
In the time-average, all terms involving c' and T' alone have zero
36

NWC TP 6307
averages (from the definition of the fluctuations). All terms involvingproducts, T,2, c'T', ct 2, give the second-order correlations T7-7, c'T',and a'-. A special case of the second-order correlations occurs inevaluating the integral terms. The following forms of integrals must beaveraged.
A(s) T'(s) B(S') T'(s') ds ds' (12a)
fo C(s) U'A(s') T'(s') B(s") T'(s") ds' ds" ds (12b)
where A(s), B(s), and C(s) are xerms involving derivatives of B. and kevaluated at the mean flow properties at the point s. We express thesetime-averages as,
f Ajs) T,(s) B(s,) T'(s') ds' d3 A(s) B(st) T'(s) T'(s') ds' ds
fO•O (13a)
oc(s) A(s') B(s") T'(s') T'(s") ds' ds" ds
- C(s) f A(s') B(s") T'(s')T'(s") ds' ds" ds . (13b)
These averages give the two-point correlation of the turbulentfluctuations along the optical path. In the subsequent analysis, these
S. correlations are expressed in terms of the correlation coefficients,
437

NWC TP 6307
_______ -'s) E,() 1/2 1/2
T'() T(s') T,--(s) 1 T,-2(s,)] rTT(S.') (14)
There are similar correlations between c' and T', and between c' and c'In all cases, we use an exponential form of the correlation
rTT(sS') = exp(- Is - sli/Y) (15)
where I is a correlation length which we take to be the same for all thescalar correlations. It was our original intent to choose differentfunctional forms for the correlation to test the sensitivity of the meanradiance to these terms. However , this particular form2 admits aconvenient transformation that gives an accurate numerical quadrature.and so this form was maintained throughout the study. We argue thatthis term always appears as an integral and therefore, the sensitivityto the precise form of the integrand is reduced. The correlationlength, 1, is a parameter that was varied over a wide range.
Following the procedure outlined above gives the equation for thetime averaged spectral radiance from a turbulent flow. As in mostradiative transfer problems, we have taken the step of using the meanoptical path length rather than the geometric path length as thevariable of integration
"" 0 o ds' (16)
Fes) -o d )d s j F (s( -)]I drt oe Ff2 > J f k d (17)
SThe full equation for the time-averaged radiance is
38

NWC TP 6307
+ ( T5kTr/kO + PBT IT/k + . ?T2B Th1/P *
+ (fBOkT/kO +. ;T~kc/kO + TBOkT/kO-c + fhT/7c) c'T /T
+ (' Bak./k. +. 80k,/k 0;01}TdT +. (18b)
(180)
fL ( BkT/kO + TBT)(T I/-T1) 1/2_r ~ T i7i)/ T~~~' d' e d 1d-fL (YBOkrk (i/~~r(o . )--)/ rTT(as.') da' e-TdT
0 (18d)
f'L yB)-- Zy,1jy6 -+ )-Z12Tj0 BkT/k, +B/ 0'0kc 1/i rT ( 3.S') d s' e -TdT
0 cT (18e)
2L XO21/211 -(T----2\/7 1)sd"edB 0~ .,jr~~r(~~2 ]oTk T) 11'2i 2 Jr(a(1
rT diS.CC[/kT ( 0T 2jflC T. c 3 , a") d s' e~ (18f)
4T /2 TT
I

"ME TP '6,307
This expansion is uniformly valid for all optical depths, but itdoes require that the perturbations in the optical path are smallcompared to the -mean optical path because of the expansion of theexponential [Eq. (11)]. The error in this expansion vanishes as CL - 0and as +L + -. Numerical tests show that the relative error is maximumfor -L = 0(0), but that it is at most 2 percent even if theperturbations in optical depth are as large as half the mean opticaldepth. The perturbations for the levels of fluctuations examined herewere much smaller than that, and the expansion is adequate for thepresent application.
The physical interpretation of the terms in the radiance is givenbelow:
Term Physical Description
18(a) Radiance from the source function Bo, evaluatedat the mean temperature, and transmittedthrough the optical path evaluated at the meanproperties.
18(b) Radiance from the fluctuation augmented sourcefunction transmitted through the optical pathevaluated at the mean properties.
18(c), 18(h) ÷ 18(j) Radiance from source function evaluated at meantemperature transmitted by fluctuating opticalpath.
18(d) + 18(g) Radiance from fluctuating source functiontransmitted by fluctuating optical path.
Another viewpoint that may clarify the expansion is to view each term asa product of two factors: a local emission (source) term and atransmittance term. The expansion in Eq. 18 can then be schematicallyoutlined as shown below.
Terms in Eq. (18) Source Transmittance
18(a) mean mean18(b) fluctuating mean18(c) + 18(h) + 18(j) + 18(k) mean fluctuating18(d) + 18(e) + 18(f) + 18(g) fluctuating fluctuating
40
-1

NWC TP 6307
Each of these integral terms was evaluated numerically for the known
distribution of mean and fluctuating properties across the axisymmetricexhaust plume. The numerical quadrature scheme is described in AppendixA. In addition, the values of the Planck function and the absorptioncoefficient, and their various derivatives, were evaluated at eachpoint. The equations used for this purpose are given ýn Appendix B,along with some typical results to indicate the behavior of thederivative terms, which define the sensitivity of the absorption 'C
temperature and species fluctuations.
This type of expansion clarifies the contribution of each term tothe time-averaged radiance and suggests the order of the importance ofthe spatial correlations that are known to be required because of thepropagational nature of the problem. Identification of the order of thespatial correlation contribution to the radiance is a unique feature ofthis study. Radiance from a fluctuating optical path with spatialcorrelations was formulated by Tan and Foster. 17 In fact, theirformulation was evaluated exactly in elosed form (without the need for asmall perturbation expansion), when Gaussian probability densityfunctions for the fluctuations were assumed. However, they pointed outthat non-physical results (average transmittance > I at large optical
jg depths) were possible with that assumption.'
EXAMINATION OF THE CORRELATION TERMS
The precise contribution of the terms involving the two-pointcorrelations along the line of sight requires the detailed numaricalevaluation to be given in the subsequent sections. However, it ispossible to estimate their magnitude and dependence on correlationlength and optical depth in advance. The integrals can be evaluatedanalytically for the special case where both the mean and fluctuatingproperties are uniform.
f[fexp(- Is - s'I/ A~ds' e-1 dtc 1P I - exp(- sa/ ) 1e- dr
17T- an, E., and P.J. Foster, "Radiation Through a CuirbulentMedium," Sixth International Heat Transfer Conference,Toronto, Canada, V. 3, M978, pp. 4O3-408. (paper, UNCLASSIFIED.)
""his nonphysically allowed result is due to the tails of the Gaussiandistribution which admit small or negative values of the variable withfinite probability, when in reality, there is a lower bound below whichthe probý%bility density is zero.
41

fNWC TP 6307
= 4i - e-L) - ex+f •L(l + 1/-k. (19)
exp(-. Is' - 1"I/j)ds'ds" e-¶ dr=
2i2; (3/jt + eXp al j/ ".e-r ••:
(AL " .212 k +1'-.. exp T/. '1- +9 -
k C 11, L + 1% 0o; ke.1 I(20)
The correlation •oefficient has introducied an additional lengthscale into the formt.ation in addltl.n to the total path length L, andthe absorption length, kIe. The nature of this additional length isperhaps more evicaent if we loo< at thc limiting cases of small and largeoptical paths, TL. The aymptotic oeha-jior of these integrals is givenin the following tablc.
£•q. (19} Eq. (20)
I << L X >> L X << L I >> L
0 1/2 kL 2 (independently of X) 1/3 koL3 (independently of 1)
TL + k• 22 Uk 1 2k; 2
SThese limits suggest that for optically thin flows, 0), thecontribution of the correlation terms is independent of the correlationcoefficient and depends only on the total optical depth, TL, and totalgeometric path length, L. In the optically thick limit (q -)- w), thesignificance of the additional length scale, 2, becomes apparent.- WhenA. is small, it defines the order of the contribution of thecorrelations. However, when I becomes large (compared to L), the
42

NWC TP 6307
absorption length, k5l, defines the contribution, in agreement with thewell-known limiting behavior of optically thick media. These order ofmagnitude arguments, in particular, the absence of an A-dependence inthe optically thin limit, are verified in the subsequent numericalexamples.
It should be pointed out that we are dealing with one form of thecorrelation coefficient [Eq. (15)), and the precise form of the
. integrals and their dependence on the correlation length, I areparticular to this choice. However, we expect that the functionaldependence suggested by the asymptotic limits in the above table aremore general, and would hold for any physically meaningful correlationfunction.
RADIATION FROM A TURBULENT EXHAUST PLUME
ISOLATED SPECTRAL LINE
We anticipate that the predictions of the turbulence augmentedradiance from the exhaust plume will depend on the particular line ofsight through the flow (temperature and turbulence levels), the spectralI location, the type of line (transition between low or high energy
levels), and the spectral resolution. In order to examine these issuesseparately, we present the radiance for an isolated spectral line beforedealing with the competing effects of many lines in a broader bandpass.Typical exhaust plume infrared signatures are usually low resolution(2 - 5 cm- 1 at the highest), and do not resolve the features of a singleline. However, combustion diagnostics can be high resolution, and theresults for a single line are of interest for this application as wellas illustrating more general features.
As a specific example, we choose a broadside observation of theplume at an axial location 40 radii downstream from the nozzle exit.The radial profiles of mean and fluctuating properties at this locationare shown in Figure 14. This location is in the region of peakafterburning (Figure 7). Predictions of the spectral radiance fromisolated lines with different strengths and energy levels were made forlines of sight passing through the middle of the plume and alsodisplaced from the axis of symmetry (r = 0.4 r ). The latter line ofsight emphasizes the region of increased turbulence and lowertemperature that leads to the largest effect of the turbulentfluctuations. A typical result at w = 2200 cm-1 (4.5jm) is given in
• i Figure 15. The line shapes for the radiance from the mean properties•i and from the turbulence augmented radiance are given in terms of the
spectral displacement Aw = u - wo from the line center normalized by thehalf-width, ao, at the reference temperature To = 296 K. Predictions of
43
4i

NWC TP 6307
3000-x/rj "40
.10 -2000bC. cT'/T
d . C 0
a
'9-." TK
0~.5-1000-
b/
I'.)/C X 10
00 1 2 3 4 5 6
FIGURE 14. Radial Profiles of Mean and Fluc-tuating Properties in the Model AfterburningPlume at x/r =40. RSL Predictions, NominalStart Condit-tons an'd Turbulence Length Scale.
44
JIO--O0

NWC TP 6307
x/rj x4000o .2220 cm"
TL =5.4
10-4 Eo-4500cm-D ra0.4rp Integrated
Radiance"-JA w/str-cm'
-- Without Fluctuations 2.91(-5)
''----With Fluctuations 1-0 1.08(-4)
J- A 1.25(-3)10 .1-cO 1.42(-3)
U)
0 °~o:
100 2 4 6
rIGURE 15. Spectral Structure of Isolated LorentzLine. Broadside Line of Sight Off the Plume Axisat x/rj = 40, A 4.03 cm.
45

NWC TP 6307
the turbulence augmented mean radiance are given for a very largecorrelation length (perfect correlation), a correlation length equal tothe local integral velocity scale A, (our best estimate of the truecorrelation length), and a small correlation length (completelyuncorrelated scalar fluctuations). These results are for a line ofmoderate strength with a lower energy state Eo = 4500 cu- 1 , typical oflines that become important at temperatures of 600 K or more. In thisparticular example, the turbulence augmented radiance integrated overthe entire line width is more than a factor of four greater than thatevaluated at the mean properties. An additional important result isthat the integrated line radiance is not particularly sensitive to thecorrelation length, but the precise line shape is very stronglydependent on the correlation. This is a result that is potentiallyimportant for any measurement that relies on either the shape or peakintensity of single spectral lines (i.e., line reversal temperaturemeasurements, or rotational temperature measurements from relative lineintensities).
A similar prediction for a line of sight passing through the plumeaxis is given in Figure 16. This line, which is identical in strengthto that used in Figure 15, is totally self-absorbed along this line ofsight. Again, the integrated radiance is not significantly differentfor the range of correlation lengths, but the line structure is stronglyaffected. For this choice of line strength and lower energy level, theabsorption is intense and the resulting radiance is localized to thatregion of the plume where the turbulence intensity and temperaturecombine to produce a line structure that is very different from that ofa normal emission line, even when it is strongly self-absorbed.
Transition from completely correlated (I + w) to totallyuncorrelated scalar fluctuations is shown for these two lines of sightin Figure 17. In both these cases, the radiance from the meanproperties is smaller than that with the fluctuations at all correlationlengths. This comparison also points out that the off-axis line ofsight (r = 0.4 rp) through the cooler, more turbulent portion of theflow has a radiance that is more intensely augmented by the turbulentfluctuations, although its absolute level is reduced from that of theline of sight through the axis. That condition remains true for allcalculations performed in this report, regardless of axial location orspectral resolution.
These predictions are for a relatively strong spectral line.Similar calculations for a much weaker line show no effect ofcorrelation length, in agreement with the limiting cases of thecorrelation integrals identified for Eqs. (19) and (20). Moreover, foran optically thin plume, the line of sight through the axis showsessentially no contribution of the turbulent fluctuations to theradiance at axial positions where the peak turbulent fluctuations do notcoincide with the peak temperature (i.e., Figure 14). In this
46
Li[_i

NWC TP 6307
x/rj =40Wo - 2220 cm"T0 =300
Eo=4500 cm"" r = 0 Integrated
N-2 Radiance
w/str-cm'--- Without Fluctuations 6.26(-4)
S --- With Fluctuations 1-0 6.26(-4)U I A 1.01(-3)
IA3,99-3
1-0
tue
0. -
0 2 4 6aw/ao
FIGURE 16. Spectral Structure of IsolatedLorentz Line. Broadside Line of SightThrough the Plume Axis at x/rj 40,A = 4.03 cm.
I

NWC TP 6307
x/rj z40
wo z 2220 cm"E� E:4500cm-f.r=
00
-- No fluctuations, r 0.r€P
- - r= 0.4rpix)
Si0-5-
SNo fluctuations, r 0.4 rp0
A (4.03cm)
I . . , , . , 1 I I 1 '0 1 " 'I110" I 10 0o 0o
Correlation Length, cm
FIGURE 17. Integrated Radiance of an Isolated Spectral Line forVarious Correlation Lengths. Broadside Line of Sight atx/r= 40. rp(x) 0.429 m.
48

NWC TP 6307
situation, the essentially steady, but very intense radiance from thepeak temperature region is affected very little by the contributionsfrom the lower temperature outer region where the fluctuations arerelatively more intense. A line of sight through the outer edge of theplume [say at r = 0.4rp(x)] shows a substantial turbulence augmentation(factor of two for a weak line with the same lower energy level as thatin Figures 15 and 16) independently of correlation length.
An additional parameter that is as important as the optical depth isthe lower energy level of the particular spectral line. This affectsthe temperature sensitivity of the absorption. For example, the&oltzman factor defining the population of states with the energy levelEo is exp(-haEo/KT). The temperature derivatives of the absorptioncoefficient, Tak//k, and T76 2k/aT2/k (see Appendix B) thereforeinvolve terms like (hcEo/KT) and (hcEo/KT) 2 and the temperaturesensitivity is increased with increasing E0 . Other factors, such as theline strength and temperature derivatives of the vibrational partitionfunction are essentially the same for every line. Sample calculationsof the temperature sensitivity for two typical energy levels and severaltemperatures are given in Appendix B. These calculations suggest thatthe temperature derivatives change magnitude and sign according to theparticular lower energy state and temperature. These effects aresomewhat obscured by a non-homogeneous path. However, the line shapeand the effect of correlation length from a line with an energy level ofEo = 1500 cm-r are shown in Figures 18 and 19, respectively, and aredifferent from the similar predictions with Eo = 4500 cm- 1 . This lowenergy level line (typical of those which make up a large portion of thelow temperature spectrum of C02 in the 4.3 M region) is notparticularly sensitive to turbulent fluctuations. Even in the opticallythick region of the line center (Figure 18), the turbulent fluctuationshave little effect on the line shape, in contrast to the lines thatoriginate from transitions between higher energy levels (Figure 15).
Finally, we present an indication of the turbulence effect on a linewith a high energy level, Eo 7000 cm- 1 . The effect of the correlationlength on the integrated line radiance is given in Figure 20 for the twolines of sight. For this class of lines, the temperature sensitivity ishigh, but the line strengths are weak, and so the optical depths aresmall. The sensitivity to the correlation length is thereforediminished. It is interesting to note that for this class of lines, theturbulence augmented integrated line radiance for an uncorrelated path(I + 0) is actually less than that evaluated at the mean properties.However, the turbulence augmented radiance for the correct correlationlength, I = A, is greater than that for the mean properties.
These few illustrations suggest the importance of the turbulenceaugmentation of the mean radiance from the individual spectral lines ofCO2 in a small afterburning missile exhaust plume. Both the line shapeand integrated radiance are affected. The extent of the effects depends
494

NWC TP 6307
Integrated Radiancew/str-cm'
-Without fluctuations 3.44(.-4)-- With fluctuations 3.46(-4)
Cto-4 x/r1 -40
0 EO =1500 cm'
\E.6
0 2 4 6
4w4
FIGURE 18. Spectral Structure of isolatedLorentz Line. Broadside Line of Sight Throughthe Plume Axis at x/r1= 40. A =4.03 cm.
50
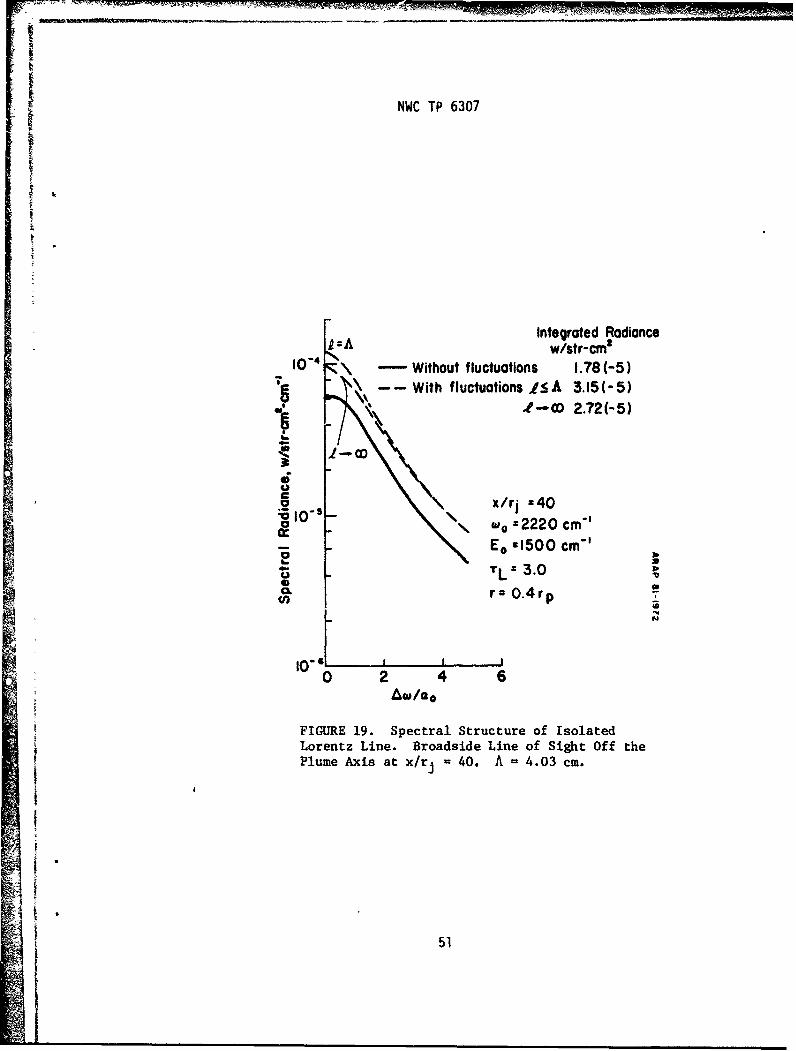
NWC TP 6307
z
- A:AIntegrated RodianceCA w/str-cma
10" , - Without fluctuations 1.78(-5)
-- With fluctuations IS A 3.15(-5)
, 4- OD 2.72(-5)
Ca o 5 •x/rj ,40
.\ uo 22220 cm
Eo x1500 cm-
"?TL C 3.0C" r= 0.4rp
IqJ 0 2 4 6Aw/ao
FIGURE 19. Spectral Structure of IsolatedLorentz Line. Broadside Line of Sight Off thePlume Axis at x/rj 40. A = 4.03 cm.
51

FM - WE ---
NWC TP 6307
r=O
" No fluctuations, r 0
o4 x/rj =40 •
X Wo 2.2220 cm"o 0o
0•
a;Eo= 7000 cm" T
v 10-u
SP No fluctuations X 10, r =0.4rp jrO.r
C -O a I --I- - - --I -I -- I I I I
10 ' 'K-1 f 1 10 10r '
A(4.03cm)
10' 1 10 10 lolCorrelation Length, cm
FIGURE 20. Integrated Radiance of an Isolated Spectral Line forVarious Correlation Lengths. Broadside Line of Sight atx/r = 40, rp (x) = .429 m.
52
jiM

NWC TP 6307
on optical depth, the particular line (energy level), and thedistribution of properties along the optical path and the extent ofcorrelation of these quantities. The largest contribution to theaugmentation comes from the additional fluctuating source terms [term bin Eq. (18)). However, the correlations between scalar properties(T',c') :%lonj the line of sight can certainly be important. Paststudies1 3,1 6 ,1 7 have correctly identified the importance of thefluctuating source term; the present study has identified the explicitcontribution of the correlations.
IN-BAND RADIANCE - CO2 BLUE SPIKE
For exhaust plume signature applications, a spectral interval widerthan a single line is of interest. The highest resolution band modelsdeal only with 0.2 - 2.0 cm- 1 resolution18 and the most widely usedcompilation is 5 cm-1 resolution. 1 1 We chose a 5 cm-1 bandpass for usehere.
An operationally important spectral region is the CO2 blue spike,located between about 2380 and 2397 am- 1 . This emission propagatesthrough long atmospheric paths and is a part of the spectral signaturefrom all tactical missile exhaust plumes. However, it is not the mostsensitive part of the spectral signature to the presence of turbulentfluctuations because of its reduced temperature sensitivity. 1 6 However,because of its technical importance, we have made predictions of theturbulence augmented emission in the 5 cam-! bandpass between 2385 and2390 cm- 1 .
The prediction of the emission from more than a single spectral linerequires a compilation for all the lines of interest for the givenbandpass. In this region, we used the AFGL Line Atlas. 14 Normally, thiscompilation is incomplete for high temperatures. It does not containthe lines that become important at high temperatures (Eo 5 3000 am-l).However, these lines are adequate for this particular spectral region upto about 1500 K. (This was verified by comparing the average absorptioncomputed with the AFGL Atlas over 5 cm-1 and 2 am-1 intervals with thatpresented in References 11 and 18, respectively.) The use of thisparticular line atlas will underestimate the turbulence augmentation inthe higher temperature regions, but it is adequate for the purpose ofthis assessment.
"Berstein, L.S., D.C. Robertson, and J.A. Conant, "Band ModelParameters for the 4.3 Pm CO2 Band from 200 to 30000 K -II. Predictions, Comparison to Experiment, and Application to PlumeEmission - Absorption Calculations," J. Quart. Spectrose. RadiativeTransfer, Vol. 23, 1980, pp. 169-185.
53

NWC TP 6307
Predictions of the tactical missile exhaust plume radiance andintensity in the 2385 - 2390 cm-' bandpass were made for various axiallocations in the plume. At each axial location, the correlation lengthwas chosen to be the local turbulence length scale, A. The length scaleand the plume radius at the axial locations at which these calculationswere made are given below.
Table 3 - Axial Locationsand Plume Dimensions
for the Radiance Calculationri = .065 m
x/r 3 A, m rp(x), m
0 .022 0.13*2 .024 .1694 .025 .182
10 .0253 .24720 .027 .29940 .0403 .429100 .093 .533200 .114 .585400 .114 .585
*Pressure equilibrated
Radial profiles of the mean and second-order correlations of thefluctuating properties have already been given for x/r* 40 inJFigure 14. We include additional profiles at the axial locationsx/rlr= 4, 20, 100, and 200 in Figures 21, 22, 23, and 24, respectively..These profiles are given to show the development and spread of the meanand turbulence quantities used in the subsequent radiance predictions.
Radial distributions of the in-band radiance in the 2385 - 2390 cm-ibandpass are given at the three axial locations x/r = 10, 40, and 100in Figures 25, 26, and 27, respectively. These locations are upstream,within, and downstream of the peak afterburning region. In all cases,the turbulent fluctuations have a negligible effect on the mean radiancenear the plume axis. As mentioned earlier, the radsance in the regionnear the axis is dominated by the high tempevature, relatively lessturbulent part of the mixing region. The turbulence contributionbecomes more important for the off-axis lines of sight and the
'1•J downstroam portion of the plume where the peak turbulence fluctuationsand peak temperatures more nearly coincide. For the three axiallocations shown, the station radiation (the radiation per unit plumelength) is augment(J by turbulence by the amounts of 22%, 20%, and 37%,
54

NWC TP 6307
x/rj *4.0 0. z
b. j!-/f,
T K
.o5-1000- '
010 1.5 2 2.5r/rj
FIGURE 21. Radial Profiles of Mean and Fluc-tuating Properties in the Model AfterburningPlume at xlr =4.0. RSL Predictions, NominalStart Conditions a~nd Turbulence Length Scale.
55

NWC TP 6307
X/rj =20
10-2000- b. TT-T 2
d. ¢ j
I• T,K 0
1005-1000-
'Ifr
,•.4- d '-."•._"-O- 0 ll=r- • , ,
0 I 2 3 4 5
r/ri
FIGURE 22. Radial Profiles of Mean andFluctuating Pioperties in the ModelAfterburning Plume at x/r = 20. RSLPredictions, Nominal Start Conditionsand Turbulence Length Scale.
4
=
AF56

7 -7,7 ,,A
NWC TP 6307
x/rj 100
. o ,0.
.10-2000- * .T'c. c T r/Td. c
%/10
T K 0 0% -,/ ~d "
S0 - 0 00 2 4 6 e 10r/rj
FIGURE 23. Radial Profiles of Mean andFluctuating Properties in the ModelAfterburning Plume at x/rj = 100. RSLPredictions, Nominal Start Conditionsand Turbulence Length Scale.
57

NWC TP 6307
x/rj 2000.
.10-2000- b. T'W/t'
d. cT
'.)
L
0S
0 2 4 6 8 10
r/rj
FIGURE 24. Radial Profiles of Mean and
Fluctuating Properties in the ModelAfterburning Plume at x/rj = 200. RSLPredictions, Nominal Start Conditionsand Turbulence Length Scale.
58
i7'

NWC TP 6307
X/rj 10
zw =2385-2390 cm'
rp(x):0.247m swim RodaawnI0"l w/str-cm
S---With Fluctualions 4.15 (-2) 18 AW/O Fuctuation 3,41 (-2)
C
_= -\ II
c I0"5 ,,1 .. S
0 .5 1.0r/rp ()
FIGURE 25. Radial Distribution of In-BandSource Radiance Across the Plume at x/rj 10.
J
59

NWC TP 6307
x/rj x-40
Aw =- 2385-2390 cIrn'
rp (x) -. 429 m Srtio RniatimI0"= w/gtr-cm
--- With Fluctuations 6.91 (-2)- W/O Fluctuations 5.78(-2)
b..b
It 10 -4lu e t0
FIGUR 26.Radial Distribution of In-Band
60

NWC TP 6307
S~ x/rj x 100
A w x2385-2390 cm"
rp(x) -. 533 m Sffivi RodiaiontO'i • w/r-Cm
--- With Fluctuatimng 3.51 (-2)(All .s)
- W/O fluctuotiors 2.56 (-2) A
10.4-
03
C
to
tO 5
-:0 .5 1.0r/rp (x)
FIGURE 27. Radial Distribution of In-Band SourceRadiance Across the Plume at x/r = 100.
61°i

NWC TP 6307
at x/rj 10, 40, and 100, respectively.
The increased radiance over the entire plume length is indicated bythe axial distribution of station radiation in Figure 28. This clearlyshows the increasing relative importance of the turbulence on plumeemission with increasing axial distance. For this particular exhaustplume and the 2385 - 2390 cm-I bandpass, the turbulence avmented meanintensity is only 24 percent greater than that calculated using only themean plume temperature and species distribution. This augmentation iscomparable to the uncertainties usually associated with total plumesignature predictions under the most favorable circumstances.
The turbulence augmentation assumes a potentially more importantrole in a spatially resolved signature. The true, turbulence augmentedradiance is significantly larger than that evaluated at the meanproperties near the outer edge of the plume. This result was emphasizedfor the single spectral lines discussed previously, and it is equallytrue for a wider bandpass. Thi spectral radiance in the 5 cm-1 bandpassis shown for an off-axis lind of sight (r = 0.4r ) at the four axial
plocations x/rj = 10, 20, 40, and 100 in Figures 29, 30, 31, and 32,respectively. At *nese lcaations, the in-band radiance is increased by72, 45, 100, and 250 percent, respectively over that evaluated withoutthe contributions of the fluctuation. The in-band radiance issubstantially enhanced for the outer edges of this particular exhaustplume. Moreover, we expect this conclusion to hold for all afterburningplumes. We point out that for plumes at higher altitude whereafterburning is reduced, the entire plume is essentially a chemicallyfrozen shear flow resembling the outer edge or downstream decayingregion of an afterburning plume. The turbulence augmentation ispotentially a much larger contribution to the total plume signature inthat case. We suggest that this is the situation for which Rhodes 13
obtained such a large effect of turbulence (factor of 200 increase instation radiation) on the signature in the 2.7 pm water vapor band.
Predictions like these were made with both very large and very smallcorrelation lengths in addition to our best estimate of I = A. Theresults were insensitive to the correlation length. The reason for thisis suggested by the results for a single spectral line. The correlationeffect is important in the turbulence augmented line structure, but notin determining the integrated radiance. Also, the lines with lowerenergy levels (Figures 18 and 19) are less sensitive to the correlationeffect. In the 2385 - 2390 cm- 1 spectral region, most of the lines areof this class. The importance of the correlation of fluctuations alongthe line of sight is therefore not important in this particular spectralregion, and the turbulence augmentation is due entirely to theadditional fluctuation induced source terms [Term b in Eq. (18)].
4 62
J.-i

NWC TP 6307
39 Atw=2385-2390cm-Cr ri .065 m
0
V
Without fluctuations--- With f luctuations
V0 (.1 A)
C
00-
1010Axiul Distance, x/rj
FIGURE 28. Axial Distribution of In-Band SourceStation Radiation for the Model AfterburningExhaust Plume. CO2 Blue Spike Region.
II2
63

NWC TP 6307
. 70E-3
x /rj =101-A
-60E-3
r/rp(x):0.4
Id .SOE-3 With FluctuationsE
b.1
.40E-3
"S Without Fluctuations-.30E-30
'Vo 1- .ZOE-3.
0.
(1) .10E-3A
2384 2385 2386 2387 2388 2389 2390 2391
W, cm"
FIGURE 29. Source Spectral Radiance for a Line ofSight at the Axial Location x/r] = 10 and Off thePlume Axis at r = 0.4rp. CO2 Blue Spike Region.
64

NWC TP 6307
I
.35E-3 X /rj =20x /r 1 .20 With Fluctuations
-30E-3.! .3e-3.r/rplx)=0.4
ft).2SE-3
-20-1S .2E-3- to
I .OE-3. ®TCL
o Ik
(1 SE4."0 01
Cf).10E-3t
Without Fluctuations
2384 2385 Z386 2387 2388 2389 2390 2391
w, cm'
FIGURE 30. Source Spectral Radiance for a Lineof Sight at the Axial Location x/rj = 20 andOff the Plume Axis at r = 0.4rp. ýO2 Blue SpikeRegion.
65

NWC TP 6307
x/rj =40 With Fluctuations=zA
.12E-3r/rp(x)=0.4
E .10E-3
.80E-4 c
40 .4E-4
. 2OE-4.
Without FluctuationsFIGUR w .. c ,m t q
Z384 Z385 2386 2387 Z388 23839 2390 2391w, cm"
FIGURE 31. Source Spectral Radiance for a Lineof Sight at the Axial Location x/r* = 40 andOff the Plume Axis at r 0.4r ýO2 Blue SpikeRegion.
66

NWC TP 6307
I -
.144F-3
x/rj 100-IsA
.12L-3r/rp(x)•0.4
"* 2 .1OE-3
=.BO- With Fluctuationsf..80E-4, N.
0 6
3.6OE-jo 3
""R'Without Fluctuations
231
1-384 Z38S Z386 2387 Z398 2389 Z390 Z391
rIIAIti= IW, cm-l
iFIGURE 32. Source Spectral Radiance for a Line of
SSight at the Axial Location x/rj - 100 and Off theSPlume Axis at r =0.4rp. C02 Blue Spike Region.
67
I

NWC TP 6307
Even for this least sensitive spectral region, the effect of theturbulent fluctuations is very important on both the magnitude andspectral detail of the emission from the edges and downstream portion ofthe flow. The line shape and relative intensities of the spectral linesare altered by the turbulence. These effects are potentially importantfor spatially resolved signature applications and in diagnostictechniques relying on line shape or relative intensities.
IN-BAND RADIANCE - CO2 RED SPIKE
An additional spectral interval of the CO2 4.3 pm band of technicalinterest is the long wavelength side of the band near 4.5 pm(2200 cm-i). This is the spectral location of the peak radiance that istransmitted through the atmosphere. We chose the 5 cm-1 spectralinterval between 2220 and 2225 cm-u. In this spectral re$ion, tbe PFGLAtlas is inadequate. Bernstein 19 has shown that lines originating fromenergy levels of 15,000 cm- 1 or more and line densities of 1000 per unitwavenumber are necessary to provide the correct absorption at hightemperatures in this spectral region. We utilized a synthetic lineatlas for this narrow spectral region that was developed at A.R.A.P.i 5
This formulation is more approximate than that developed by Bernstein.It does not go to as high energy levels or contain as many lines.However, the absorption averaged over 2 cm-1 and 5 cm-1 computed withthis synthetic compilation compared favorably with Bernstein, et il. 1 8
and the NASA compilation1 1 up to temperatures of 1500 K. At highertemperatures, it underestimates the absorption and the temperaturesensitivity of the absorption. Predictions given here, like those forthe 2385 - 2390 cm- 1 blue spike region, will therefore underestimate theradiance and the sensitivity of the radiance to turbulent fluctuationsin the higher temperature regions of the flow.
Predictions for the 2220 - 2225 cm-I bandpass were made at the sameaxial locations as those shown earlier for the blue spike region. Aradial distribution of the ia-band radiance at x/r- = 100 is given inFigure 33. Like the blue spike region, the turbulent fluctuations haveno effect on the mean radiance near the plume axis. This portion of theradiance is primarily from the high temperature, relatively lessturbulent central portion of the plume. The rel:Fti-e importance of theturbulent fluctuations increases towards the outer ,.dge of ths plume,but the absolute level is sufficiently reduced that the contribution ofthe outer edges to the station radiation is small. For example, thestation radiation at the three axial positions x/r, = 10, 40, 100 isincreased only by 10, 0, and 24 percent, respectively. These increasesare even less than those found for the blue spike region.
I 19. Bernstein, L.S., "Band Model Parameters for the Parallel Bands ofLinear Triatomic Molecules - I. Theory," J. Ouart. Spectrosc. Radiative
Ai Transfer, Vol. 23, 1980, pp. 157-167.
.1: 68
Ig

NKC IP 6307
SX/vi 1 000A 2220-2225 cm"
IO~ rplx) •.533 m s•1c Rodiiti4
With FnuctuotiOm• 4.29(2)(AII I'llS•-- -- . W/O Fluctuoalio s 353-15
"X10"
II'
p
9 . 1.0! r/rp(x)
KOX cE 33, Rad'al Dis8ribution of In-BaactSource Radiance Asross the Plume at x/rj 1 100.
6• 69

NWC TP 6307
The augmentation of the plume radiance off the axis of the plume islarger in the 2220 - 2225 cm- 1 bandpass than for the blue spike region.For example, at r = 0 4r , the in-band radiance is increased by factorsof 3.1, 2.4, and 2.4 &or the three axial locations x/rj = 10, 40, and100. The augmentation due to turbulence is nearly three times greaterin the 2220 - 2225 cm- 1 bandpass, as expected from the greatertemperature sensitivity of this region of the spectrum at temperaturelevels that correspond to afterburning exhaust plumes. However, themean radiance also has this sensitivity and the radiance near the plumeaxis is sufficiently large to make the turbulence augmentation a smalladdition in this particular wavelength and for the tactical missileclass of plumes.
The relative importance of the turbulent fluctuations over theentire plume length for the 2220 - 2225 cm"1 bandpass is shown in Figure34. In this particular example, the total plume mean intensity with theturbulent fluctuations is only 6 percent greater than that calculatedwithout the contributions from the fluctuations. This rather smallincrease is the result of the dominant contribution by the lessturbulent, higher temperature inner regions of the plume (i.e.,Figures 14, 22, and 23).
At the outer edges, the turbulent flucttuations provide an enhancedradiance. Spectral distributions in the 2220 - 2225 cm- 1 bandpass atx/r• = 10, 20, 40, and 100 are given in Figures 35, 36, 37, and 38,respectively. In these spectra, calculated at 0.01 cm-1 intervals, boththe intensity and structure of the lines are changed by the turbulence,although the individual featurej of the spectral lines are not asevident as in the blue spike region. In this spectral region, there aremany more lines contributing to the radiance (an order of magnitude ormore, depending on temperature), and the individual features arecbscurred. As mentioned previouslr- the augmentation of the in-bandradiance for these off axis lin~s of eight is greater for the2220 - 2225 cm-1 spectral interval. A3 with the 2385 - 2390 cm- 1
spectral interval, the augmentation for lower temperature,non-nfterburning plumes would be more like these results for the edgesof the plume anl' the total signature would be increased more than thatcalculated here. However, we epsct that the slight increase in totalsignature predicted here for a particular tactical missile plume to begenerally true for all low altitude, intense afterburning plumes. Weemphasize again that the augmentation at the outer edges, while notimportant for the total signature, is potentially important in spatiallyresolved signatures and diagnostic measurements.
70
E'

NWC TP 6307
0:
II
"0
3 Aw: 2220- 2225cm"
10r1 _.065m
.0
to
Axial Distance, x/rj
FIGURE 34. Axial Distribution of In-Band Source
Station Radiation for the Model Afterburning Exhaust
Plume. CO2 Red Spike Region.
71

NWC TP 6307
.35E-3. A
•3o-34 drx= 0.4
k E .2SE-3 With Fluctuations
"Without Fluctuations-.20E-3
L3 -1E3
('/3 SOE-4.
0 ........ I.......
ZZ19 ZZZO 2Zz1 ZZZZ 22Z3 Z224 ZZZ5 2226W, CM"'
FIGURE 35. Source Spectral Radiance for a Line ofSight at the Axial Location x/rA = 10 and Off thePlume Axis at r = 0.4rp. CO2 Red Spike Region.
1A
72

NWC TP 6307
.14E-3X/rj =20
.1ZE-3""r/r.(x)0.4
With Fluctuations
r:.10E-3
b...
.80E-4
0 -60t-4
0:
"O .40E-4
LCSn.20E-4
So Without Fluctuations2Z19 2220 22ZI Z2222 ;Z23 2224 22ZS 2226
w, CM'
FIGURE 36. Source Spectral Radiance for a Lineof Sight at the Axial Location x/rj 20 and Offthe Plume Axis at r 0.4rp. CO2 Red Spike Region.
Ii 73

NWC TF 6307
•70F-4
X/rj =40Z a A
GGE-4 r/rp(x 0.4
E .50E-4
With FluctuationsS-40E-4 w0
.2.30E-4I * 00
"h• .20E-4
0 , With...ut Flctaton
0r.
FIGURE ~ ~ W 3. SucSpctrlRdacmo ieo
I Sight at the Axial Location x/rj = 40 and Off the
Plume Axis at r = 0.4r-. CO 2 Rei Spike Region.
7
• 74
I

I
NWC TP 6307
.inr 4 x/rj 100
1=A.(01 -4
T r/rp(x)=0.4
",4E" .5F- 4. 'With Fluctuations
??'*.40E -4
;D
C.2.30E-4
Without Fluctuations7E.20E-4.
0O-2219 ZZ20 2221 2222 2223 i224 222S 2226i•W, cm-i I
FIGURE 38. Source Spectral Radiance for a Line ofSight at the Axial Location x/r- = 100 and Off thePlume Axis at r 0.4rp. CO2 Rld Spike Region.
75

NWC TP 6307
SUMMARY AND CONCLJSIONS
This report has presented a set of predictions for the mean radiancefrom a turbulent, afterburning exhaust plume using a consistent set ofpredictions for the mean and turbulence properties in the flow, and aprecise formulation for the turbulence augmented meai radiance.
The turbulent flow properties were obtained from A.R.A.P.'s RSLcode, which predicts the mean and second-order correlation of turbulentfluctuations using a second-order closure model. Comparisons betweenthese predictions and those for a two-equation, turbulence kineticenergy model (the constant pressure turbulent mixing portion of theJANNAF Standard Plume Flowfield Model) are in essential agreement forconstant density, low speed flows. Differences between thesepredictions begin to occur for flows with density differences due eitherto temperature or light species. A major reason for differentpredictions is the different length scale models used in the twocalculations, and there is some effect due to different choices ofinitial turbulence levels and the treatment of density fluctuations invariable density flows. For the application at hand, a primary resultis that the common turbulence quantity predicted by the two codes, theturbulence kinetic energy, is comparable. An additional result is thatthe fluctuations of other scalar quantities, such as temperature andspecies concentrations develop differently from the turbulence kineticenergy. Therefore, applications such as radiance predictions fromturbulent flows require that these additional scalar fluctuations beproperly modeled in addition to the turbulent velocity fluctuations.
For the particular flow examined here, and with the global model forthe afterburning reaction, we found that the effect of the turbulentfluctuations on the chemical reactions has only a small influence on thetemperature and species concentrations in the afterburning region.
A formulation for the mean spectral radiance accounting for theadditional fluctuating source and transmittance terms created byfluctuations in temperature and chemical species was derived. It isessentially a direct expansion of the monochromic radiance, up to andincluding second-order correlations between the fluctuations. It isuniformly valid for all optical depths but requires that the turbulentfluctuation remain small compared to their mean values, a condition thatis satisfied by the flowfield used here. A unique feature is that thecontributions of spatial correlations between fluctuating propertiesalong the line of sight are explicitly obtained.
The spectrally resolved mean radiance with and without thecontributions from the fluctuations was computed for two regions in the4.3 pm CO2 vibrational-rotational band for lines with a Lorentz lineshape. The spectral information for the line strengths and positions
76
-1

NWC TP 6307
was taken from the AFGL compilation in the 2385 - 2390 cm-1 spectralregion and from a synthetic compilation in the 2220 - 2225 cm-1bandpass. Both compilations were verified to be adequate up to about1500 K, but underpredict the absorption at higher temepratures.
Predictions for isolated spectral lines were used to determine theimportance of the correlation between fluctuating properties along theline of sight. For optically thin paths, there is no effect ofcorrelation. However, at intermediate and large optical depths, thecorrelations affect the line structure, but do not strongly affect theintegrated line radiance. An important parameter governing thesensitivity of the line to the turbulent fluctuations is the lowerenergy state of the particular line. The sensitivity increases with anincreasing lower energy level, suggesting that the least sensitiveabsorption is due to the lines that determine the low temperaturespectra, and that the most sensitive lines are those which contribute atthe higher temperatures. These observations have implications to plumedi&•'nostics that utilize properties of the individual line shape orrelative intensities of single lines.
In-band radiance for wider bandpasses (5 cm- 1 ), was predicted forthe CO2 blue spike (2385 - 2390 cm- 1 ) and red spike (2220 - 2225 am-1 )spectral regions. For the blue spike region, the station radiation inthe afterburning and downstream region was increased by at most 37percent, and the total plume intensity for broadside observation wasincreased by 24 percent by the turbulent fluctuations. The smallaugmentation is because the predominant contribution to the signaturecomes from those lines of sight passing near the plume axis, for whichthe turbulent augmentation is very small. The outer edges of the plumeare substantially augmented by the turbulence, by factors as much as 2.5times the radiance without the fluctuations. These outer regions do notcontribute significantly to the total plume intensity, but could beimportant in a spatially resolved signature.
4 In-band radiance in the red spike region, 2220 - 2225 cam- 1 , hasessentially the same behavior as that in the blue spike, except that thecenter portion of the plume is even more dominant and the augmentationby the fluctuations to the total plume intensity is even less; only 6percent for the example used here. For this bandpass the stationradiation is increased by at most 33 percent, but only downstream, wherethe effect on the total intensity is small. The augmentation of theradiance at the edges of the plume is substantial, but not important forthe total plume intensity.
The effect of the spatial correlations of the temperature andspecies concentrations was very small for the radiance in these twobandpa3ses. The correlations affect the line structure but not the linestrength and, therefore, a broader bandwidth radiance is much lesssensitive to the correlation. The turbulence augmentation of the wider
77

NWC TP 6307
bandpass radiance is due primarily to the additionl radiance sourceterms created by the single point correlations of turbulentfluctuations, and not to the fluctuation augmented transmittance, towhich the two-point spatial correlations contribute.
We conclude that, for this specific case of a typical low altitude,afterburning exhaust plume from a tactical missile, turbulentfluctuations are not important contributors to the total plume intensityin eit1."r the CO2 blue spike or red spike spectral regions. The
4 predicted augmentations in these spectral regions of 24 and 6 percent,respectively, are well within the uncertainty of contemporary flowfieldand signature predictions. We expect this conclusion to hold for theentire class of tactical missile plumes at low altitude.
However, the turbulence augmentation could be substantial fornon-afterburning plumes such as higher altitude rocket plumes and foraircraft plumes. For this class of plumes, the flow is more like the
4outer edges and downstream portions of an afterburning plume, for whichthe predicted turbulence augmentation was a factor of from two to three.Turbulence could then substantially increase the total plume intensityfrom these types of exhaust plumes. For the same reasons, turbulentaugmentation of radiation observed in the forward hemisphere isexpected. In cases of forward hemisphere observation, much of theafterburning region of the plume is blocked by the missile structure,and only the outer edges and downstream portions contribute to theobserved signature.
RECOMMENDATIONS
The results of this study suggest several extensions. There areclear implications of these results for high spectral resolutiondiagnostic techniques such as temperature measurements by line reversaltechniques and rotational temperature measurements from the distributionof line intensities. It would be worthwhile to examine the results ofthese types of measurements in experiments where the flow is turbulentwith the turbulent augmentation included.
An important contemporary plume diagnostic that would be affected bythe predicted turbulence augmentation in the wider bandpass (- 5 cm- 1 )is the emission/absorption inversion technique used to infer temperatureand radiating species profiles from axisymmetric flows. In thesemeasurements, the entire transverse profiles of emission andtransmission are utilized. The substantial turbulence augmentations at
H ]the outer edges of the plume suggest that the actual inferred propertiesV 2 are radiation weighted mean temperature and species concentrations that
could differ from the presumed normal mean properties. An examination
78

NWC TP 6307
I of experimental measurements with some indication of the augmenta ,ion ofthe emission might indicate the effect on the inferred tempe,"atAre.
- This application would require a prediction of the time-averagedfluctuation augmented transmittance, which was not given hereexplicitly, but could be easily derived.
Finally, we argue that it is probably feasible to include aprediction of the turbulence augmented radiance in the normal signaturepredictions. The missing element is a formulation of the turbulenceaugmentation for band models. Rhodes's ensemble averaging approach isprobably too time consuming for most applications. 13 This capabilitywould be most valuable for higher altitude rocket plumes or aircraftplumes. For line-by-line predictions, the formulation presented here isdirectly applicable. In all these applications, however, the primaryrequirement is a plume flowfield prediction that includes reliablemodels for the scalar fluctuating quantities that affect the plumeemission.
I7i
Ii 79

NWC TP 6307
REFERENCES
1. Donaldson, C. duP., Atmospheric Turbulence and Dispersal ofAtmospheric Pollutants, Environmental Protection Agency,EPA-R4-73-016a, March 1973.
2. Fishburne, E.S., R.A.Beddini, and A.K. Varma, "The Computation ofAfterburning Rocket Exhaust Plumes," Aeronautical ResearchAssociates of Princeton, Inc., A.R.A.P. Report No. 283, July 1976.
3. Varma, A.K., E.S. Fishburne, and R.A. Beddini, "A Second-OrderClosure Analysis of Turbulent Diffusion Flames," NASA LangleyReseach Center, NASA CR-145226, June 1977.
4. Dash, S.M., et al., "Operational Instructions for a PreliminaryVersion of the JANNAF Standard Plume Flowfield Model (SPF/1),"A.R.A.P. Report No. 415, June 1980.
5. Pergament, H.S., et al., "The Naval Weapons Center Target SignatureCode," A.R.A.P. Report No. 380, February 1979.
6. Ludwig, C. et al., "Development and Validation of a StandardizedInfrared Radiation Model (SIRRM)," JANNAF Standard Plume ModelWorkshop, U.S. Army Missile Command, Huntsville, AL, 2-3 April1981.
7. Dash, S.M., and H.S. Pergament, "A Computational Model for thePrediction of vet Entrainment in the Vicinity of Nozzle Boattails(The BOAT Code)," NASA Langley Research Center, NASA CR-3175,December 1978.
8. Fishburne, E.S., and A.K. Varma, "Investigations of Chemical1 Reactions in a Turbulent Media," Acta Astronautica, Vol. 6, 1979,
pp. 297-308.
9. Free Turbulent Shear Flows, Vols. I & II, NASA Langley ResearchCenter, July 1972. (NASA SP-321, publication, UNCLASSIFIED.)
10. Abramovich, G.N., The Theory of Turbulent Jets, The MIT Press,Cambridge, MA, 1963, "apter 7.
11. Ludwig, C.B., et al., Handbook of Infrared Radiation fromCombustion Gases, NASA SP-3080, 1973.
12. Young, S.J., "Nonisothermal Band Model Theory," The AerospaceCorporation, SAMSO-TR-76-207, September 1976.
80

NWC TP 6307
13. Rhodes, R.P., "The Effect of Turbulent Fluctuations on the InfraredRadiation from Rocket Plumes," 12th JAKINAF Plume TeL.hnologyMeeting, CPIA Publication 332, Vol. III, December 1980, pp- 81-97.
14. IcClatchey, R.A., et al., "AFCRL Atmospheric Absorptiorn LineParameters Compilation," Air Force Geophysics Lab.,AFCRL-TR-73-0096, January 1973.
15. McCullough, R.W., "Compilation of CO2 Rotational Lifea InoludingTransitions That Are Important at Temperatures up to 2000 0 K,Aeronautical Research Associates of Princeton, Inc., unpublished,December 1980. (paper, UNCLASSIFIED.)
16. Draper, J.S., L.S. Bernstein, and W.K. Cheng, "Fluctuating Emissionfrom Molecular Vibrational-Rotational Bands," J. Quart. Spectrosc.and Radiet. Transfer, Vol. 23, 1980, pp. 323-326.
17. Tan, E., and P.J. Foster, "Radiation Through a Turbulent Medium,"Sixth International Heat Transfer Conference, Toronto, Canada,Vol. 3, 1978, pp. 403-408.
18. Bernstein, L.S., D.C. Robertson, and J.A. Conant, "Band Model
Parameters for the 4.3 gm CO2 Band from 200 to 30000 K -II. Predictions, Comparison to Experiment, and Application toPlume Emission - Absorption Calculations,"J. Quart. Spectrosc. Radiative Transfer, Vol. 23, 1980,pp. 169-185.
19. Bernstein, L.S., "Band Model Parameters for the Parallel Bands ofLinear Triatomic Molecules - I. Theory,"J. Quart. Spectrosc. Radiative Transfer, Vol. 23, 1980,pp. 157-167.
81
u-

- -- -W-%-4M M M
NWC TO 6307
Appendix ANDJEIICAL EVALUATION OF INTEGEALS
There are two types of integrals to be evaluated in the expressionfor the time-averaged radiance. Ore is the integral over the optlcalpath, and the second is the integral of the correlation coefficient overthe geometric distance along the line of sight. The two integrals aretreated similarly, but the numerical quadratures are different. Eachwill be described separately.
29TEGRAL OVSR THE PATH
This integral is of the form
SI F(s)k0c exp koas) ds (A-i)
where F(s) is any form of the integrand [even including other integrals,i.e., Eq. (18)]. The independent variable is transformed to ortiaaldepth
d= koeds' (A-2)
I F(,) exp(- x)d¶; A-3)
The optical path can vary between very small and very large values,0 -z < •. Because of the exponential weighting, a single quadraturescheme may not be uniformly accurate. For example, if tL << 1, then theentire optical path makes a contribution to the integral, while if
TL " 1, only )he thin layer of plume closest to the observer determinesthe radiance. In order to correctly account for these effects in auniformly au;urate manner, the numerical evaluation of Eq. (A-3) wasperformed with two quadrature schemes, depending on the value of thetotal optical depth.
82

NWC TP 6307
Limits of Integration Integration Scheme
I 4 10 0 4 1 <Lobatto
SrL > 10 0 < T Laguerre
In the case where TL < 10, the variable of integration is • =/L, andthe integral is
I~L NI : ILF(T) e-T dr = cL F(-rI)exp(-&IrL)Wi (A-4)
i:I
where ýi are •he roots, and wi the weights of the integration. For thelarge optical path limit,
I : F() e-1 d' j ( . (A-5)
In both cases, N = 16 points [half of a 30 point scheme for the finitepath length case, Eq. (A4)]. These numerical quadratures were highlyaccurate ahd gave essentially eract results fer all optical depths whencompared to cases that could be evaluated analytically [constant valuesfor the integrand F(s)]. The results were insensitive to the choice ofcut-off between the ftn'te arn infir te optical depth limits.
INTEGRALS OVER THE SPATIAL CORRELAYION COEFFICIENT
These integrals are of the form
I F(s') exp(- Is- s'l/1)ds' (A-6)
Again, because of the exponential weighting, an arbitrary numericalquadrature (such as a trapezoidal rule) is not uniformly accurate unltsathe increments are always small compared to 1, the correlation length.To circumvent this inconvenience, the variable of integration vastranformed to
- exp(- 13 - s'i/1) ,so that
83
L A

-- Mv- -77 1~ -
NK TP 639
I it%1 F(&) dC (A-7)
This integral was evoluated by a normal, trapezoidal rule. Thenumerical evaluation gave essentially exact results for arbitrary valuesof 1. It is this convenient transformation that mitigated against usex~minlng other for-us of correlation coefficients.
84

NWC TP 6307
S~ Appendix BS~DERIVATIVES OF THE PLANCK FUNCTION ANDS~SPECTRAL ABSORPTION COEFFICIENT
PLANCK FUNCTION
B(T)3 (B-1)W =exp(hZ•/KT) - 1
Let X hZb/KT, then
T dB/dT BXeX/(exp X - 1) (B-2)
and
T2 d2 B/dT 2 2(T dB/dT)(T/B dB/dT - 1 - X/2) (B-3)
ABSORPTION COEFFICIENT
The spectral absorption coefficient for a rotational line is
ki = 3i(T)f( i) (B-4)
where SI(T) is the line strength, f(a) is the line shape function, andai the half-width for the ith spectral line with center wavenumber atwoi. We assume a Lo-ýntz line shape
f(ai) 1/n (B-5)Sci + (w - woi) 2
The line strength is given by
85

N•C TP- 6307
S oiexp(- ho- o/KT)[ 1 -- exp(- h~u/KT)]Qv (T )T /TSi(T) =PNo 0 (B-6)
QR(T)Qv(T) exp(- hto/KTo)[I - exp(- h6(JKTo)]
Sot is the line strength at the reference temperature To, and Eo is theenergy of the lower level of the particular vibrational-rotationaltransition which is responsible for the line. QR and Qv are therotational and vibrational partition functions, respectively. The firstexponential term accounts for the distribution of molecules in theenergy state Eo (the Boltzman factor), and the second exponential termaccounts for stimulated emission. The temperature ratio To/T isaxplicitly included here to account for the fact that So is defined on aper molecule basis.* The temperature ratio is conventionally carried asa separate term.
The partial derivatives of the absorption coefficient are calculatedin the following manner.
6k/ 8T 6 S/ T f + Saf/ bai Nxi/ aT(B)
bk/c -. Sbf/bai bailsc (B-8)
f- + sS -----IXi6T 2 5T2 5T bj bT T) -ziT 2 (B-9)
a2 k 6S ýf bai 52f • i()Cx i b af 62 a,- + S -- + (B-10)5 T• T 73;ýiý bal az- 6T bai BenT
g2k 2 /a2 i 2 ýf 52M
Eaob of these terms is defined below:
'*k(em=) k(molecule-l) • N kNo(N/No) kNopT.)/T where N is themolecular number density and p the pressure. We define the absorptioncoeffcient tq be kNopTo/T.
86

NWC TP 6307
) j) -zji/¶c(c? + AW2) (8-12)
Waa i - 2iqf)/ai (B-13)
2f2f/baj - 2n 2 (47taif - 311zi (B-14)
-i = (ep(To/T)11 2 (yic + yjcj) (B-15)
T bat/bT -ai/2 (B-16)
T2 a2aj/BT2 3ai/4 (B-17)
Bai/ac = aop(To/T)"/ 2 (yi - yj) (B-18)
a2ai/acbT = -1/2 ?ai/Bc (B-19)
yi and yj are constant coefficients which account for self and foreigngas broadening. In this work, yi = 1.4, yj 1.07, and cj - c. Forthese conditions,
b2ai/aC2 0 . (B-20)
3 ;Derivatives of the temperature dependent portion of the absorptioncoefficient are more complicated. First, the partition funotions are(for C02 ):
rotation: Qr(T) T/To (B-21)
vibration:
T ( xp - h_ __KT)z( /X.T - exp- hW -
(B-22)
87

NWC TP 6307
where ,= 667.379 cn- 1 , u2 1388.187 am-', 03 2349.146 am-1.
Normally, the stimulated emission term and Qv at the referencetemperature, To, (2960 K), which are nearly unity, are not explicitlyincluded in Eq. (86).
For the purpose of evaluating the derivative of S(T), we define thefollowing terms:
Xo = heEo/KT , Yo = Xoe-Xo/(1 - eXo)X = hO'w/KT , y = Xe-X/(1 - e-X)X1 = hVw/KT , Y = Xje-X1/(1 - e-Xl)
A2 = 2/KT Y2 X2 e-X2/( - e-X2)X3 =hNw/T Y3 X3e-X3/(l - e-X 3 )
then,
TS = S(T)(Xo - 2 - y 2y 1 Y2 y) (B-23)
T 2 •23 _T2ý + Tn(X0 2y )8T 2 OT 8 2 y 1- -y2 -Y 3
-X° 0+ y(l - X - y) + 2y 1(1 - 11 - yl) + y2 (1 - 2- y2) +
+ y3 (1 - X3 - y3 )] (B-24)
These derivatives determine the sensitivity of the absorption totemperature and radiating species concentration fluctuations. Theprimary parameters ar? temperature and wavelength, but another importantparameter is the energy of the lower state of the transition, Eo. Thiratio, haEo/KT, affects the temperature dependence of the absorption.It is possible for lines with different lower state energies to haveopposite temperature sensitivities. Some examples are given in FiguresA BI - B6 for typical temperatures found in the plume and for wavelengthsnear 4.5 pm. The plots are normalized by the absorption at the linecenter, ko, and the wavenumber measured from the line center,iA = w - w. is normalized by the half-width, xi =x, evaluated at thetemperature, T.
83

NWC TP 6307
2.0-
To 300KwO a 2220 cm'
i ~Eo = 1500 cm-'
1.0
xI/:0:0
bS
0 .,5 I0
-1.0
T" O'k T 62kT. k/ko C. - e. k ckb.I kkoT d./.
ko 6c ko JrC.
FIGURE B-i. Normalized Derivatives of theSpectral Absorption Coefficient: SingleLine, Lorentz Line Shape, Eo = 1500 cmi,T =300 V.
4 89__

NWC TP 6307
2.0-
TI.000
1.0.
00
k/kOT 6T ea.k/fkI c. -L -k -~
bI k I O'kko 6 d.f,
koo I T d ,
FIGURE B-2. Normalized Derivatives of theSpectral Absorption Coefficient: Single Line,Lorentz 'Line Shape, E0 1500 cm, T 1000 K.
90

NWC TP 6307
2.0:- X !/10ST= 2O000
wO Z 2220 cm"EO = 1500 cm"
Ta dek T d~k0. k/ko C. e,
ko ' ko 0 cdk1. b -T 6k I d 2k•.oo d.k;T d.± . L d'k
ko aC ko Oct=
-0
-xI/I0
FIGURE B-3. Normalized Derivatives of the SpectralAbsorption Coefficient: Single Line, Lorentz LineShape, Eo 1500 cm-', T 2000 K.
191
4
L-21

NWC TP 6307
2.0 bS. . .. .. . . x 1/ 10
T= 300KWO z 2220 cm'Eo -4500 cm
1.0
aaI\ ,~x 1/10 x/,o
%S.1
NN
I0
"4?' Tz 'k T ONka, k/kO ko 7T e dck
.TTb.koOT d. I, k L 6'kko dc ko 60
-2.0-
rA FIGURE B-4. Normalized Derivatives of theSpectral Absorption Coefficient: SingleLine, Lorentz Line Shape, E. f 4500 cm- 1 ,T = 300 K.
AI
92

NWC TP 6307
TxI000 K1.0 -Wo 22220cm"
EwE= 4500 cml
eS
a. I/k 0 _. e
d5 10
0 ----1
a. k/ko c. e.Ta'-1.0 - b. T_ ak ko WT ko~cdk
ko dT d. I k•.• f. / k
kko de
FIGURE B-5. Normalized Derivatives of theSpectral Absorption Coefficient: SingleLine, Lorentz Line Shape, Eo 4500 cm-,T 1000 K.
93

NWC TP 6307
1.0 T 2000 K
too = 2220 cm'E-0 = 4500 cm"
LeŽ m ~ - 10
C/o k/ko
b.T dk
II T'd'k
ko ck
I d k
FIGURE B-6. Normalized Derivatives of theSpectral Absorption Coefficient: Single
i j Line, Lorentz Line Shape, Eo 4500 cm-I,T = 2000 K.
94
A'

NWC TP 6307
NOMENCLATURE
B (T) Planck function, Bo B•(T)
C Scale constant for turbulent length scale
!C 1 Constant in Planck function,•iC 1 1.19088 X 10⁻¹² cj>-cm2 /str
{ Species mole fraction (primarily for the infrared
S~active species CO2 )
S~Speed of light
E Activation energy
SEo ~ ~Lowerspctaenergy leeVel of transition for an individual
iF(•) Arbitrary function
Sf(ci) Lorentz line shape function
H enthalpy
h Planck's constant
K Boltzman's constant
Skf Forward reaction rate coef~icient
Sk•(T) Spectral absorption coefficient, ko •()also denoted by k
SL Geometric length of optical path through plume
2.£ Correlation length for scalar fluctuations

NWC TP 6307
Qv,QR Vibrational and rotational partition functions
q2 Mean square turbulence velocity
R Universal gas constant
r Radial coordinate
rj Exhaust nozzle radius
rp(x) Plume radius at axial location, x
rTT, rcT, rce correlation coefficients between fluctuatingtemperature and species
S Line strength
s Distance along line of sight
T Temperature
u Mean axial velocity
ut, v?, w' Turbulence velocities in x, r, e direction
wi Weights for Gaussian Quadrature
x Axial coordinate
a Reactant mass fraction
ai Spectral line half-width
p Reactant mass fraction
y Product mass fraction
Yi Collision broadening coefficienta Turbulence energy dissipation
A Turbulence velocity integral scale
¶ Optical depth
p Fluid density
96

NWC TP 6307
Wavenumber
Variable of integration
Subscripts
jet~j Jet ex-it
Ambient
0 Reference cordition or evaluated at inean temperature
pk Peak value
m Axis value
ls', 1 s" Evaluated at the location, st, s"
ij Chemical species i,j
Superscripts
Mean (time-average)
Fluctuating (note the prime i-s also used to deýnotea dummy variable of integration
97
,I

NWC TP 6307
INITIAL DISTRIBUTION
14 Naval Air Systems CommandAIR-OOD4 (2)AIR-03A (1)AIR-03P22, A. R. Habayeb (1)AIR-330 (1)AIR-340C (1)AIR-370D, E. Hooper (])AIR-512 (1)AIR-533 (1)AIR-533, E. Cosgrove (1)AIR-536 (2)AIR-53634F, D. Caldwell (1)AIR-5492, W. Whiting (1)
2 Chief of Naval OperationsOP-35E. L. Triggs (1)OP-982Fj, Capt. L. E. Pellock (1)
7 Chief of Naval MaterialMAT-08 (1)NSP.00 (1)NSP-O1 (2)
NSP-10 (1)NSP-20 (1)PM-22, High Energy Laser (HEL) Project Office (1)
3 Naval Electronic Systems Command
NAVELEX-03G, R. Golding (1)NAVELEX-PME-107-52, A. Ritter (1)
NAVELEX-PME-107, J. O'Brian (1)9 Naval Sea Systems Command
SEA-03D (1)SEA-62 (1)SEA-62R (i)SEA-62R1, T. Tasaka (1)SEA-62R2 (1)SEA-99612 (4)
I Chief of Naval Research, Arlington (ONR-473)1 Assistant Secretary of the Navy (Research, Engineering and Systems, Dr. Hubert Wang)I David Taylor Naval Ship Research and Development Center, Bethesda (Code 2833, R. Burns)"2 Naval Intelligence Support Center
NISC-40, Perry Roberts (1)NISC-50, Hank Bowers (1)
2 Naval Ocean Systems Center, San DiegoCode 133 (1)Code 532, Dr. J. H. Richter (1)
3 Naval Ordnance Station. Indian HeadCode 5252, G. A. Buckle (1)Code DGS (1)
Technical Library (1)
98

NWC TP 6307I
4 Naval Research LaboratoryCode 1409, Dr. Kirshenstein (1)Code 5754, Dr. E. M. Alexander (1)r-ot.e 8320, L. Ruhnke (1)Technical Library (1)
2 Naval Surface Weapons Center, DahlgrenDr. G. Moore (1)Technical Library (1)
2 Naval Surface Weapons Center Detachment, White Oak Laboratory. Silver SpringCode 213, A. Hirshman (1)Code KEM (1)
3 Pacific Missile Test Center, Point MuguCode 0141.2, C. Elliott (1)Code 1233, Dr. N. Van Slyke (1)Code 1232, D. Stowell (1)
I Assisstant Navy Deputy, SAM-D/ASMS Joint Project, Redstone Arsenal1 Naval Plant Representative Office, Sunnyvale (Code SPL-3124)I Army Armament Materiel Readiness Command, Rock Island (DRSAR-LEM)I Army Armament Research and Development Command, Dover (B. Hornstein)I 1rmy Ballistics Research Laboratories, Aberdeen Proving Ground (DRDAR-TSB-S (STINFO))i 3 Redstone Arsenal
AMCPM-MDER (1)AMSMI-RDD (1)AMSMI-RDK, Dr. B. Walker (1)
I Army Missile Research & Laboratory Advanced Sensors Directorate, Redstone Arsenal (DRDMI-TEI.H.T. Jackson)
I Night Vision Laboratory, Fort Belvoir (DRSEL-NV-VI, R. Moulton)I White Sands Missile Range (ERADCOM, DELAS-EO-MO, Atmospheric Sciences Laboratory, T. Hall)I Air Force Armament Laboratory, Eglin Air Force Base (AFATL/DLMT-3. Mack Gay)3 Air Force Geophysics Laboratory, Hanscom Air Force Base
OPA. R. Fenn (1)OPI, Stop 30, R. McClatchey (1)OPR, Stop 30, B. Sanford (1)
I Air Force Rocket Propulsion Laboratory, Edwards Air Force Base (DACP, Dr. Andrepoint)1• 4 Air Force Rocket Propulsion Laboratory, Edwards Air Force Base (Plans and Programs Office)
2 Air Force Rocket Propulsion Laboratory, Edwards Air Force Base (Technical Library)2 Air Force Wright Aeronautical Laboratories, Wright-Patterson Air Force Base
AFWAL/AAWP, Dr. Richard Sanderson (1)AFWAL[1?ORA- 1, J. Fultz (I)
2 Arnold Air Force StationResearch Branch, Dr. W. K. McGregor (1)Special Projects, ETF-PO, C. R. Darlington (1)
I Arnold Engineering Development Center, Arnold Air Force Station (Dr. Herman Scott)I Directorate of Armament Development, Eglin Air Force Base1 Under Secretary of Defense for Research & Engineering, Electronics & Physical Sciences (J. MacCallum,
Room 3D11079)2 Defense Advanced Research Projects Agency, Arlington
S. Zakanycz (1)12 Defense Technical Information CenterI Department of Defense Explosives Safety Board, Alexandria (6-A-145)
99•,:

- - - ~R -1
NWC TP 6307
1 George C. Marshall Space Flight Center (S&E, Dr. T. Greenwood)1 National Aeronautics and Space Administration (Code RP)I Aerodyne Research, Inc., Bedford, MA (Dr. Draper)I Aerojet Tactical Systems, Sacramento, CA (J. Coughhn), via AFPRO2 Aeronautical Research Associates of Princeton, Inc., Princeton, NJ
B. Pearce (1)Technical Library (1)
1 Atlantic Research Corporation, Alexan~dria,.VA2 Brigham Young University, Provo, UT
Dr. D. L. Smoot (1)Dr. Lane Compton (1)
I California Institute of Technology, Jet Propulsion Laboratory, Pasadena, CAI Calspan Corporation, Buffalo, NY (W. J. Sheeran)I Environmental Research Institute of Michigan, Ann Arbor (R. Legault)1 General Applied Sciences Laboratory, Westbury, NY1 General Dynamics Corporation, Pomona Division, Pomona, CA (E. Piesik)I General Research Corporation, McLean, VA (SWL Division, Russ Rollins)2 Grumman Aerospace Corporation, Bethpage, NY
Experimental Dymamics Research Group (1)Research Department, J. Selby (1)
1 Hercules Incorporated, Allegany Ballistics Laboratory. Cumberlani, MD (G. Williams)I Hercules Incorporated, Magna, UT (R. J. Zeamer)I Hercules Incorporated, McGregor, TX1 Hughes Aircraft Company, Culver City, CA4 Institute for Defense Analyses, Arlington, VA
L. Biberman (1)W. Holzer (1)Dr. R. Oliver (1)Dr. H. Wolfhardt (1)1I Johns Hopkins University, Applied Physics Laboratory, Laurel, MD (H. Hall)
I Lockheed Missiles and Space Company, Sunnyvale, CA (R. LeCount)1 Martin-Marietta Corporation, Denver, CO (R. E. Compton, Jr.)I Martin-Marietta Orl-,io Aerospace, Orlando, FL (J. W. Fisher)2 McDonnell Douglas Astronautics, Huntinton Beach, CA
Advanced Propulsion Department, Department A-833, Group P-BBFO (1)D. Chow (I)
I Northrop Corporation, Aircraft Division, Hawthorne, CA (Lloyd Tanabe)I Raytheon Manufacturing Company, Missile Systems Division, Bedford MA (B. DeRosa)1 Rockwell International Corporation. Canoga Park, CA (R. A. Smith)I Science Applications, Inc.. Gas Dynamics and Energy Division, Santa Ana. CA (R. J. Hoffman)I Science Applications, Inc., Princeton, NJ (H. Pergament)1 Scientific Technology Associates, Inc., Princeton, NJ (CN 5203, Stokes Fishburn)I Spectral Science, Inc., Burlington, MA (Dr. D. C. Robertson)I Systems Planning Corp., Arlington, VA (D. Friedman)I TRW, Incorporated, Redondo Beach, CA (G. J. MacLeod)I The Boeing Company, Seattle, WA (Dr. J. M. Barton)I Thiokol Chemical Corporation, Huntsville Division, Huntsville, AL2 Thiokol Chemical Corporation, Wasatch Division. Brigham City, UT
N. Anderson (1)Webb (1)
100