nyserda retrofitny market characterization study: building
TRANSCRIPT

NYSERDA RetrofitNY Market Characterization Study:
Building Stock Assessment and Architectural Profiles of Predominant New York State Multifamily Building TypesAddendum to Report 20-20 | Report Number 20-20a | August 2020

NYSERDA’s Promise to New Yorkers: NYSERDA provides resources, expertise, and objective information so New Yorkers can make confident, informed energy decisions.
Mission Statement:Advance innovative energy solutions in ways that improve New York’s economy and environment.
Vision Statement:Serve as a catalyst – advancing energy innovation, technology, and investment; transforming
New York’s economy; and empowering people to choose clean and efficient energy as part
of their everyday lives.

NYSERDA RetrofitNY Market Characterization Study:
Building Stock Assessment and Architectural Profiles of Predominant New York State
Multifamily Building Types Addendum Report to Report 20-20
Prepared for:
New York State Energy Research and Development Authority
Albany, NY
Saul Brown Project Manager
Prepared by:
Pratt Institute School of Architecture
Gabrielle Brainard, AIA Principal Investigator
Can Sucuoglu Research Lead, Pratt Institute Spatial Analysis and Visualization Initiative (SAVI)
and
Syracuse University School of Architecture
Nina Sharifi, Ph.D. Principal Investigator
Research Assistants
Applied Sciences and Technology Research in Architecture (ASTRA) Lab
NYSERDA Report 20-20a NYSERDA Contract 148666 August 2020

ii
Notice This report was prepared by the Pratt Institute School of Architecture with Pratt’s Spatial Analysis and
Visualization Initiative (SAVI) and Syracuse University School of Architecture’s Applied Sciences
and Technology Research in Architecture (ASTRA) Lab in the course of performing work contracted
for and sponsored by the New York State Energy Research and Development Authority (hereafter
“NYSERDA”). The opinions expressed in this report do not necessarily reflect those of NYSERDA
or the State of New York, and reference to any specific product, service, process, or method does not
constitute an implied or expressed recommendation or endorsement of it. Further, NYSERDA, the
State of New York, and the contractor make no warranties or representations, expressed or implied,
as to the fitness for particular purpose or merchantability of any product, apparatus, or service, or
the usefulness, completeness, or accuracy of any processes, methods, or other information contained,
described, disclosed, or referred to in this report. NYSERDA, the State of New York, and the contractor
make no representation that the use of any product, apparatus, process, method, or other information
will not infringe privately owned rights and will assume no liability for any loss, injury, or damage
resulting from, or occurring in connection with, the use of information contained, described, disclosed,
or referred to in this report.
NYSERDA makes every effort to provide accurate information about copyright owners and related
matters in the reports we publish. Contractors are responsible for determining and satisfying copyright
or other use restrictions regarding the content of reports that they write, in compliance with NYSERDA’s
policies and federal law. If you are the copyright owner and believe a NYSERDA report has not properly
attributed your work to you or has used it without permission, please email [email protected]
Information contained in this document, such as web page addresses, are current at the time
of publication.

iii
Abstract New York State’s ambitious energy and retrofit goals toward decarbonization require the development
of novel approaches and technologies for integration in the State’s existing building stock. This
Addendum focuses on characterizing an additional building type representing a significant amount
of Gross Square Footage (GSF) as a percentage of New York State multifamily housing stock. For
all work completed, the methodology included the following: (1) analysis of previously collected
building data provided by New York State Energy Research and Development Authority (NYSERDA),
and (2) categorization of low- and mid-rise buildings into major types by major features, including:
vintage of original construction, exterior wall structure, cladding material, gross square footage, number
of stories, and envelope area. In addition, random samples of photographic documentation were studied
to verify details of records in the list data provided and to confirm visual details found in architectural
standards and other historical documentation. The initial results of the main study include detailed
architectural profiles of seven major multifamily building types, with further description regarding
predominant construction trends and styles in each type. This addendum includes detailed architectural
information on an eighth type, which was defined in accordance with building characteristics previously
established in the main report, and which constitutes a significant area (over 450 million square feet) of
postwar residential buildings primarily found in the New York City area.
Keywords Multifamily housing, envelope, enclosure, retrofit, façade, historical buildings, postwar
Acknowledgments The authors would like to extend thanks to the Schools of Architecture at Syracuse University
and Pratt Institute for their support of this research.

iv
Table of Contents Notice .........................................................................................................................................ii Abstract ....................................................................................................................................iii Keywords ..................................................................................................................................iii Acknowledgments ...................................................................................................................iii List of Figures ...........................................................................................................................v
List of Tables .............................................................................................................................v
Acronyms, and Abbreviations, and Definitions .....................................................................vi 1 Introduction ........................................................................................................................1
2 Data Sources and Data Accuracy .....................................................................................3 2.1 Segment Characteristics .......................................................................................................... 6 2.2 Average Building Characteristics .............................................................................................. 8 2.3 Detailed Architectural Profile: Type 8 (1940–1978, Four- to Seven-Story Masonry) .................. 8
3 Conclusion .......................................................................................................................16
Appendix A. Random Sampling of Type 8 Properties ........................................................ A-1
Appendix B. Revised Count and Floor Area of Types 1 through 8 ................................... B-1

v
List of Figures Figure 1. A Six-Story Building in a 40-Unit Complex: 785 Schenk Avenue in Brooklyn, NY .........3 Figure 2. Plot of Building Count versus Building Area .................................................................4 Figure 3. Plot of Building Area versus Building Count, Building Area Density ..............................5 Figure 4. Examples of Representative Sub-Types in Type 8 .......................................................9 Figure 5. Representative Examples Demonstrating the Range of Type 8 Variation ...................11 Figure 6. Examples of Reinforced Concrete and Steel Floor Assemblies ..................................12 Figure 7. Masonry Wall Details: Technical Notes on Brick Construction ....................................13 Figure 8. Masonry Wall Details, 1963: Technical Notes on Brick Construction ..........................14 Figure 9. Masonry Details, 1964: Technical Notes on Brick Construction ..................................15 Figure 10. Concrete Masonry Details: Technical Notes on Brick Construction ..........................15
List of Tables Table 1. Summary Characteristics of Predominant New York State Multifamily Building Types ..2 Table 2. Characterization of Type 8 from Original Report ............................................................3 Table 3. Examples of Multibuilding Complexes with Erroneously Reported Building Floor Area ..4 Table 4. Revised Characterization of Type 8 after Data Cleaning ...............................................6 Table 5. Affordable versus Market-Rate Housing in Type 8.........................................................6 Table 6. Percentage of Housing Owned by the New York City Housing Authority (NYCHA) .......7 Table 7. Characterization of Multibuilding Complexes in Type 8 .................................................7 Table 8. Estimated Facade Area in Type 8 .................................................................................7 Table 9. Average Building Characteristics in Type 8 ...................................................................8 Table 10. Key Characteristics Representative of Type 8 Buildings ............................................10

vi
Acronyms, and Abbreviations, and Definitions Affordable Housing: Housing in which at least 25% of building households
earn less than or equal to 80% of Area Median Income. Dwelling Unit (DU): This refers to an apartment, typically rental unit in multifamily
buildings, irrespective of size or number of rooms. Gross Square Footage (GSF): This refers to total horizontal building area, including
circulation and service space in addition to leasable or occupied space.
Low-Rise Building: Building with one to three stories. Mid-Rise Building: Building with four to seven stories. High-Rise Building: Building with eight or more stories. New York State (NYS): All counties in New York State, including the five boroughs
of New York City. New York City (NYC): The five boroughs of New York City (New York, Bronx,
Queens, Kings, Richmond).

1
1 Introduction This document is an addendum to the report titled NYSERDA RetrofitNY Market Characterization
Study: Building Stock Assessment and Architectural Profiles of Predominant New York State
Multifamily Building Types. It serves to examine an eighth building type: the mid-rise, postwar
vintage, which should be added to the seven considered in the main report. Although totaling fewer
buildings than the others, Type 8, characterized below, represents a significant percentage of total
building square footage in the New York State market. Information in this document is similar in
depth and detail to the information given on Types 1 through 7 described in the main report. Below
is a revised summary table inclusive of Type 8.

2
Table 1. Summary Characteristics of Predominant New York State Multifamily Building Types
Vintage Pre-1940 1940-1978Building Height
(Stories)4 to 7 4 to 7
Count, MF Bldgs in NYS2 46,258 6,124
%, MF Bldgs in NYS3 4.51% 1.00%
Total Floor Area4
(GSF)1,248,583,402 454,292,018
Total Exterior Wall Area5 (SF)
534,264,627 200,716,697
Type 1 2 3 4 5 6 7 8Structural Material
MasonryWood Frame
MasonryWood Frame
MasonryWood Frame
MasonryConcrete and
steel
Cladding Materials
Brick, stone, stucco
Brick veneer, wood, stucco
Brick, stone, stucco
Brick veneer, wood, stucco
Brick, stone, stucco
Brick veneer, wood, stucco
Brick, stone, stucco
Brick, concrete
Number of Stories
3 3 4 to 7 3 3 3 3 4 to 7
Average Bldg Floor Area (GSF)
2,400 - 6,000
1,200 - 4,800
4,800 - 45,000
9,000 - 10,800;
100,000 or more for
complexes
9,000 - 10,800;
100,000 or more for
complexes
14,400 - 22,500;
100,000 or more for
complexes
14,400 - 22,500;
100,000 or more for
complexes
40,000 - 75,000; large
complexes can reach several
million
Average Envelope Area
(SF)
1,400 - 7,200
3,500 - 6,000
2,700 - 24,000
9,100 - 10,500;
75,000 or more for
complexes
9,100 - 10,500;
75,000 or more for
complexes
11,200 - 14,000;
75,000 or more for
complexes
11,200 - 14,000;
75,000 or more for
complexes
20,000 - 30,000; large
complexes can be in the millions
Width (FT)
20 - 40 20 - 40 30 - 90 100 - 120 100 - 120 120 - 150 120 - 150
Depth (FT)
40 - 50 30 - 40 40 - 70 30 30 40 - 50 40 - 50
Height (FT)
35 35 - 405 45 - 75 35 35 35 35
# Units 2 to 4 2 to 4 4 to 45
10 to 20 per building; up
to 200 for complexes
10 to 20 per building; up
to 200 for complexes
10 to 20 per building; up
to 200 for complexes
10 to 20 per building; up
to 200 for complexes
Predominantly 50+ and
commonly 200+ for large
complexes
Unit Area (GSF)500 - 1,600
500 - 1,600
500 - 1,600 500 - 1600 500 - 1600 800 - 2000 800 - 2000 500-1600
WWR (%) 10 to 20 10 to 20 10 to 20 10 to 15 10 to 15 10 to 15 10 to 20 10 to 15R-value,
Wall2 to 4 3 to 5 2 to 5 6 to 7 3 to 5 10 to 12 12 to 15 3 to 5
R-value, Roof
2 to 4 1 to 2 2 to 4 3 to 4 2 to 4 4 to 5 22 to 24 2 to 4
Notes:
2. From Table 83. From Table 94. From Table 105. Height assumed to the ridge line (top of pitched roof)
1,164,243,036 700,535,956 355,906,065
Typical Individual Building (or Complex)
Characteristics1
These buildings are not typically rectangular
1. Average characteristics of predominant types within each segment, based on summary statistics (Tables 13 + 14) and analysis of individual building records
171,793 84,792
38.67% 16.76% 8.27%
1,160,883,262 2,683,558,039 1,112,456,713
Segment DescriptionPre-1940 1940 - 1978 1979 - 2006
1 to 3 1 to 3 1 to 3
Segment Characteristics
396,343

3
2 Data Sources and Data Accuracy As with the main report, this document refers to data compiled by ICF International as part of their
report titled New York Residential Building Stock and Energy Cost Analysis, submitted to New York
State Energy Research and Development Authority (NYSERDA) on December 22, 2017. Initial analysis
of this segment suggested a relatively small building count for four to seven story buildings built between
1940 and 1978. However, further review of data showed the building type might comprise a significant
amount of floor area compared to other segments (Table 2).
Table 2. Characterization of Type 8 from Original Report
Figure 1. A Six-Story Building in a 40-Unit Complex: 785 Schenk Avenue in Brooklyn, NY

4
Table 3. Examples of Multibuilding Complexes with Erroneously Reported Building Floor Area
To arrive at an accurate assessment of the large floor area represented by this type, a significant number
of discrepancies had to be corrected for first. Entries for large multibuilding complexes often erroneously
attribute the floor area for the entire complex to an individual building. For example, the floor area of the
six-story building at 785 Schenck Avenue in Brooklyn is reported as 3,000,000 square feet (sf)—a value
that likely represents the total floor area of the entire 40-building complex (Table 3). These errors are
compounded by the practice of duplicating records for properties containing multiple buildings on a
single lot (described on page 11 of the main report). When erroneous records are duplicated, the
reported floor area increases proportionately.
Figure 2. Plot of Building Count versus Building Area
The comparison shows the correlation of larger building count with larger building area.

5
Figure 3. Plot of Building Area versus Building Count, Building Area Density
The below chart shows an inflection point at 300,000 square feet.
Further evidence of this phenomenon is illustrated by comparing building area to the number of buildings
on the lot. Normally, we would not expect to see a correlation between building size and building count.
This is the case for smaller building counts. However, larger building counts do appear to be correlated
with larger building areas—an unexpected result suggesting that these values represent the total floor
area of the complex, not the area of an individual building (Figure 2).
Plotting the overall distribution of building area suggests that abnormal values for floor area begin
at 300,000 sf, as indicated by the black line in Figure 3. This is an upper limit for the floor area of
an individual mid-rise building, resulting in a floor plate of 43,000–50,000 sf for a six- to seven-story
building. This threshold also represents an inflection point in the data. Below 300,000 sf, the number
of buildings in the data set decreases as floor area increases, an expected result reflecting fewer instances
of very large buildings. Above 300,000 sf, this pattern reverses, suggesting potential errors within the
data. To resolve these errors, the floor area for buildings with greater than 300,000 sf was divided by
the number of buildings on the lot. These entries were not removed from the data set.
In addition to modifying building area values above 300,000 sf, outliers were removed from the data set
for the purpose of ensuring data quality when calculating average building characteristics. A conservative
approach of three standard deviations from the mean was used to remove extreme entries. In addition,

6
individual records were checked manually (by counting buildings, number of floors, and measuring
footprints) and deleted when major errors were detected. Data cleaning reduced the number of entries
to 6125 from 6685 (560 entries, or 8% of the data set were removed).
Table 4 reflects the revised characterization of the postwar, mid-rise segment, after the errors described
above were corrected and outliers removed. This shows that while both the number of multifamily
buildings and their corresponding floor area for Type 8 may be significantly lower than what the data
sets seemed to initially indicate, they still represent a significant portion of built space in New York
State. While the 6,124 buildings that fall into this category represent only 0.75% of all New York State’s
multifamily buildings, they total over 454 million gross square feet, or 5.5% of all multifamily floor area
in the State. Table 4 includes an excerpt of the revised count and floor area of Type 8 after data cleaning.
The complete table is included in Appendix 2: Revised Count and Floor Area of Types 1 through 8.
Table 4. Revised Characterization of Type 8 after Data Cleaning
2.1 Segment Characteristics
The majority of postwar, mid-rise buildings in Type 8 are located in the five boroughs of New York
City. About 33% of these buildings are affordable, defined as housing in which at least 25% of building
households earn less than or equal to 80% of the Area Median Income (Table 5). About 60% of the
affordable buildings, representing about 84,000,000 sf of floor area, are owned by the New York
City Housing Authority, or NYCHA (Table 6).
Table 5. Affordable versus Market-Rate Housing in Type 8

7
Table 6. Percentage of Housing Owned by the New York City Housing Authority (NYCHA)
In contrast to prewar, mid-rise buildings, which are typically individual buildings on urban infill lots,
postwar, mid-rise buildings are often part of multibuilding complexes on lots that occupy one or more
entire city blocks. These buildings were typically built in the modernist “towers in the park” style, in
which buildings are set back from the street and surrounded by green space. The number of buildings
per complex ranges from one to 32, with an average (mean) of four to six buildings per complex
(Table 7). Because they are not built to the lot line, buildings in complexes were often designed with
non-rectangular floor plans, described in detail below. Estimates of the facade area in Table 8, based
on assumptions described in the main report, are likely undercounts due to the variety of complex
building plan configurations present in this segment.
Table 7. Characterization of Multibuilding Complexes in Type 8
Table 8. Estimated Facade Area in Type 8
8
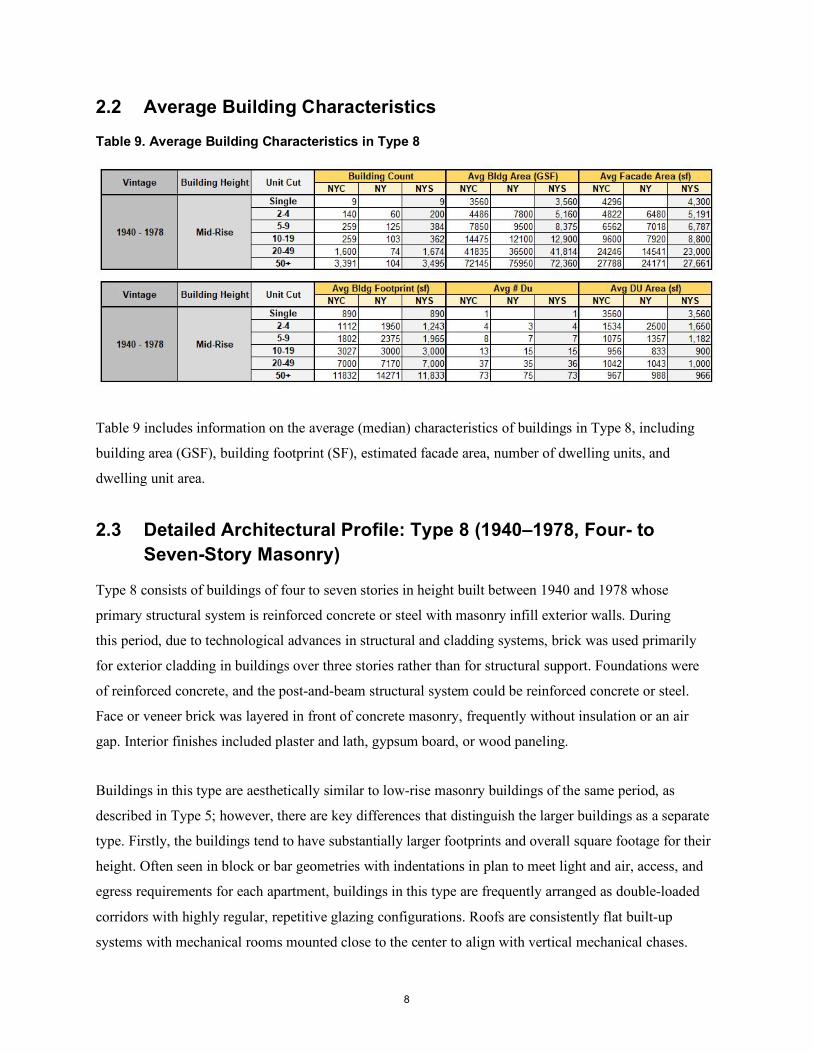
2.2 Average Building Characteristics Table 9. Average Building Characteristics in Type 8
Table 9 includes information on the average (median) characteristics of buildings in Type 8, including
building area (GSF), building footprint (SF), estimated facade area, number of dwelling units, and
dwelling unit area.
2.3 Detailed Architectural Profile: Type 8 (1940–1978, Four- to Seven-Story Masonry)
Type 8 consists of buildings of four to seven stories in height built between 1940 and 1978 whose
primary structural system is reinforced concrete or steel with masonry infill exterior walls. During
this period, due to technological advances in structural and cladding systems, brick was used primarily
for exterior cladding in buildings over three stories rather than for structural support. Foundations were
of reinforced concrete, and the post-and-beam structural system could be reinforced concrete or steel.
Face or veneer brick was layered in front of concrete masonry, frequently without insulation or an air
gap. Interior finishes included plaster and lath, gypsum board, or wood paneling.
Buildings in this type are aesthetically similar to low-rise masonry buildings of the same period, as
described in Type 5; however, there are key differences that distinguish the larger buildings as a separate
type. Firstly, the buildings tend to have substantially larger footprints and overall square footage for their
height. Often seen in block or bar geometries with indentations in plan to meet light and air, access, and
egress requirements for each apartment, buildings in this type are frequently arranged as double-loaded
corridors with highly regular, repetitive glazing configurations. Roofs are consistently flat built-up
systems with mechanical rooms mounted close to the center to align with vertical mechanical chases.

9
Low parapets typically surround the roofs. Elaborate cornices, as seen in the lower-height types,
are not typically present. Cladding is overwhelmingly brick masonry.
Figure 4. Examples of Representative Sub-Types in Type 8
LEFT: Infill block building. RIGHT: Freestanding bar building.
The majority of buildings in this type are found downstate in New York County and the surrounding
counties of Queens, Kings, and the Bronx, comprising the five boroughs of New York City. In many
examples, complexes of buildings of this type are sited on large aggregated lots containing multiple
similar, if not identical, buildings that are freestanding or partially attached to one another. Examples
of both types are seen in NYCHA’s Ravenswood Houses in Queens (35-03 12th St), on the right in
Figure 1. As mentioned, buildings in this type were often designed as “towers in the park,” and were
not built to the lot line, as was seen in many of the prewar examples. Each block or bar ranges in average
width from 100–150 ft and in depth from approximately 40–50 ft. Heights range from approximately
40–70 ft. Plan configurations of freestanding buildings are often non-rectangular, ranging from

10
U- or X-shapes to triangular star or hub-and-spoke arrangements. The average building dimensions cited
above apply equally to projects with non-rectangular plans. However, buildings with non-rectangular
plan geometry will typically have greater floor and facade area for the same overall building
dimensions. Table 1 outlines the parameters for typical rectangular buildings in Type 8.
Type 8 building are typically characterized by minimal ornamentation. Many buildings fall in the
affordable classification, which is associated with simple façade configurations and economical
construction. However, regardless of affordable or market classification, there is often virtually
no ornament, in contrast to the prewar buildings. The exception to this is the frequent presence of
balconies and fire escapes, specifically on market-rate buildings. An image array demonstrating the
range of ornamentation, façade, and plan configurations can be seen in Figure 5. In the figures that
follow are a series of standard construction details showing multiple possible configurations of
exterior enclosure assemblies for this type, from industry standards and building material institutes.
Table 10. Key Characteristics Representative of Type 8 Buildings
W (FT) D (FT) H (FT)NO. OF STORIES
FAÇADE AREA (PER
BLDG)GSF (PER
BLDG)
NO. OF BUILDINGS (COMPLEX)
TOTAL FAÇADE AREA
(COMPLEX)TOTAL GSF (COMPLEX)
LOW END 100 40 40 4 11200 16000 1 11200 16000HIGH END 150 50 70 7 28000 52500 35 980000 1837500

11
Figure 5. Representative Examples Demonstrating the Range of Type 8 Variation

12
Figure 6. Examples of Reinforced Concrete and Steel Floor Assemblies
Source: AGS, 1956 (TOP) and 1970 (BOTTOM).

13
Figure 7. Masonry Wall Details: Technical Notes on Brick Construction
Brick Institute of America, 1963.

14
Figure 8. Masonry Wall Details, 1963: Technical Notes on Brick Construction
Brick Institute of America, 1963.

15
Figure 9. Masonry Details, 1964: Technical Notes on Brick Construction
Structural Clay Products Institute, 1964.
Figure 10. Concrete Masonry Details: Technical Notes on Brick Construction
Brick Institute of America, 1978.

16
3 Conclusion While Type 8 represents a relatively small number of buildings concentrated in the five boroughs
of New York City, buildings in this segment are promising candidates for high-performance retrofits.
Data suggest that this typology represents a large amount of floor and facade area as compared to other
building types in New York State. Type 8 buildings are relatively large and often found in complexes
with multiple buildings of similar or identical design. Some complexes may have a common owner
(such as the New York City Housing Authority), which could facilitate implementation of retrofits
across an entire portfolio of buildings.
Masonry facades in Type 8 are often unornamented and not built to the lot line, simplifying logistics
of installing exterior retrofits. Exterior walls in this type are also unlikely to be insulated, improving
the cost-benefit impact of retrofit measures.
Finally, the large proportion of affordable housing in Type 8 represents an opportunity to address
equity issues by improving the quality and resilience of housing serving vulnerable populations.

A-1
Appendix A. Random Sampling of Type 8 Properties

A-2

B-1
Appendix B. Revised Count and Floor Area of Types 1 through 8
MF Bldg # MF Bldg % Bldg Area (GSF) Bldg Area % MF Bldg # MF Bldg % Bldg Area (GSF) Bldg Area % MF Bldg # MF Bldg % Bldg Area (GSF) Bldg Area %Single 84 0.0% 139,200 0.0% 113,646 19.7% 241,141,690 3.6% 113,730 13.8% 241,280,890 3.3%
2-4 84,056 34.3% 196,109,075 33.0% 164,762 28.6% 451,715,123 6.7% 248,818 30.3% 647,824,198 8.9%≥5 17,220 7.0% 45,779,465 7.7% 16,575 2.9% 225,998,709 3.4% 33,795 4.1% 271,778,174 3.7%
Single 0 0.0% 0 0.0% 164 0.0% 750,066 0.0% 164 0.0% 750,066 0.0%2-4 81 0.0% 728,000 0.1% 6,462 1.1% 32,707,496 0.5% 6,543 0.8% 33,435,496 0.5%≥5 180 0.1% 6,047,545 1.0% 39,371 6.8% 1,208,350,295 18.0% 39,551 4.8% 1,214,397,840 16.6%
Single 52 0.0% 338,520 0.1% 4 0.0% 9,268 0.0% 56 0.0% 347,788 0.0%2-4 11,518 4.7% 10,945,410 1.8% 107 0.0% 557,837 0.0% 11,625 1.4% 11,503,247 0.2%≥5 1,762 0.7% 7,338,106 1.2% 897 0.2% 154,113,694 2.3% 2,659 0.3% 161,451,800 2.2%
Single 0 0.0% 0 0.0% 22,212 3.9% 192,014,356 2.9% 22,212 2.7% 192,014,356 2.6%2-4 28,446 11.6% 70,334,700 11.8% 96,710 16.8% 1,224,300,072 18.2% 125,156 15.2% 1,294,634,772 17.7%≥5 19,948 8.1% 64,851,816 10.9% 4,477 0.8% 178,522,010 2.7% 24,425 3.0% 243,373,826 3.3%
Single 0 0.0% 0 0.0% 9 0.0% 90,133 0.0% 9 0.0% 90,133 0.0%2-4 60 0.0% 1,036,500 0.2% 140 0.0% 870,121 0.0% 200 0.0% 1,906,621 0.0%≥5 406 0.2% 13,929,266 2.3% 5,509 1.0% 438,365,998 6.5% 5,915 0.7% 452,295,264 6.2%
Single 0 0.0% 0 0.0% 4 0.0% 13,696 0.0% 4 0.0% 13,696 0.0%2-4 14,741 6.0% 14,005,451 2.4% 6,600 1.1% 205,523,499 3.1% 21,341 2.6% 219,528,950 3.0%≥5 10,807 4.4% 25,136,635 4.2% 5,408 0.9% 394,911,143 5.9% 16,215 2.0% 420,047,778 5.7%
Single 134 0.1% 176,600 0.0% 9,564 1.7% 524,027,400 7.8% 9,698 1.2% 524,204,000 7.2%2-4 10,668 4.3% 29,738,090 5.0% 50,658 8.8% 342,279,760 5.1% 61,326 7.5% 372,017,850 5.1%≥5 10,374 4.2% 50,684,683 8.5% 3,394 0.6% 165,550,180 2.5% 13,768 1.7% 216,234,863 3.0%
Single 0 0.0% 0 0.0% 108 0.0% 5,658,197 0.1% 108 0.0% 5,658,197 0.1%2-4 13 0.0% 291,400 0.0% 2,202 0.4% 125,450,434 1.9% 2,215 0.3% 125,741,834 1.7%≥5 140 0.1% 7,214,077 1.2% 3,416 0.6% 339,978,110 5.1% 3,556 0.4% 347,192,187 4.8%2-4 15,660 6.4% 11,846,220 2.0% 6,980 1.2% 7,310,647 0.1% 22,640 2.8% 19,156,867 0.3%≥5 13,821 5.6% 21,827,395 3.7% 2,918 0.5% 57,057,780 0.9% 16,739 2.0% 78,885,175 1.1%
Single 100 0.0% 125,000 0.0% 1,742 0.3% 4,634,055 0.1% 1,842 0.2% 4,759,055 0.1%2-4 937 0.4% 3,184,975 0.5% 6,843 1.2% 53,167,204 0.8% 7,780 0.9% 56,352,179 0.8%≥5 1,049 0.4% 7,015,946 1.2% 340 0.1% 11,272,675 0.2% 1,389 0.2% 18,288,621 0.3%
Single 0 0.0% 0 0.0% 27 0.0% 166,834 0.0% 27 0.0% 166,834 0.0%2-4 1 0.0% 2,200 0.0% 936 0.2% 7,605,176 0.1% 937 0.1% 7,607,376 0.1%≥5 32 0.0% 711,200 0.1% 2,497 0.4% 79,855,739 1.2% 2,529 0.3% 80,566,939 1.1%
Single 0 0.0% 0 0.0% 20 0.0% 67,064 0.0% 20 0.0% 67,064 0.0%2-4 1,318 0.5% 775,667 0.1% 529 0.1% 801,001 0.0% 1,847 0.2% 1,576,668 0.0%≥5 1,646 0.7% 4,650,029 0.8% 778 0.1% 35,455,578 0.5% 2,424 0.3% 40,105,607 0.5%
245,254 100.0% 594,963,171 100.0% 576,009 100.0% 6,710,293,040 100.0% 821,263 100.0% 7,305,256,211 100.0%
NA
Low-Rise
Mid-Rise
Pre-1940 Low-Rise
Mid-Rise
NA
Low-Rise
Mid-Rise
1940-1978
1979-2006
NA
NA
2007-Present Low-Rise
Mid-Rise
Total
Vintage Building Height Unit Cut NY Upstate NYC NYS


NYSERDA, a public benefit corporation, offers objective information and analysis, innovative programs, technical expertise, and support to help New Yorkers increase energy efficiency, save money, use renewable energy, and reduce reliance on fossil fuels. NYSERDA professionals work to protect the environment and create clean-energy jobs. NYSERDA has been developing partnerships to advance innovative energy solutions in New York State since 1975.
To learn more about NYSERDA’s programs and funding opportunities,
visit nyserda.ny.gov or follow us on Twitter, Facebook, YouTube, or
Instagram.
New York State Energy Research and
Development Authority
17 Columbia CircleAlbany, NY 12203-6399
toll free: 866-NYSERDAlocal: 518-862-1090fax: 518-862-1091

State of New York Andrew M. Cuomo, Governor
New York State Energy Research and Development AuthorityRichard L. Kauffman, Chair | Doreen M. Harris, Acting President and CEO