nz petroleum sector
TRANSCRIPT

17 April 2013
This update report forms part of the suite of material that comprises Edison’s 2012-13 New Zealand Petroleum Sector Yearbook. As well as undertaking a detailed bottom-up analysis of key recent events, themes and trends in the New Zealand oil and gas space, the report attempts to read the sector’s tea leaves to propose an outlook for the sector and its components.
This report is exclusively for the benefit of Yearbook subscribers.
The report comprises seven sections.
Section 1, our Sector wrap, draws together the analysis undertaken in the body of the report to highlight sector activity, trends and direction.
Section 2, our Supply-side activity and outlook, analyses what we consider to be the key bottom-up sector metrics and lead indicators for above-ground E&P player activity. We also present our analysis of forward below-ground work programmes and drilling slates.
Section 3, our Demand-side activity and outlook, looks at the local buy-side of each of the oils, gas and LPG sectors to tease out the main consumption themes at play.
Section 4, our NZ data room, presents an array of NZ-specific summary graphics and tables that serve to convey top-down macro trends as well as bottom-up micro performance for the major players in each of the upstream, midstream and downstream sectors.
Section 5, our Global data room, presents a set of international price and non-price markers relevant to each of the NZ oils, gas and LPG sectors.
Section 6, our Map room, charts pending firm drilling programmes for the onshore and offshore Taranaki Basin as well as frontier basins.
Section 7, our Trading room, plots performance tracks for leading regional and national indices as well as for each listed upstream player for whom their NZ operations are significant to their business. We also present our EV/mmboe screen which benchmarks comparable listed player EVs against declared 2P reserve bases.
NZ Petroleum Sector
2012-13 Yearbook Update
Brent oil
NZ$/US$
Contact
John Kidd Head of Research – NZ Ph +64 4 894 8555 Cell +64 (0)21 543 448
Simon Wilson Director Ph +64 4 894 8555 Cell + 64 (0)21 562 015
Oil & gas sector

2012-13 New Zealand Petroleum Sector Yearbook | April 2013 Update 2
Contents 1. Sector wrap 7 2. Supply-side activity and outlook 13
2.1. Above-ground 13 2.1.1. Player head count 13 2.1.2. Player permit activity 14 2.1.3. Infrastructure activity 19 2.1.4. Corporate activity 20
2.2. Below-ground 21 2.2.1. Recent drilling activity 21 2.2.2. Drilling outlook 23
3. Demand-side activity and outlook 26 3.1. Oils 26 3.2. Gas 26
3.2.1. Generation gas 26 3.2.2. Petrochemical gas 27
3.3. LPG 29 4. NZ data room 31
4.1. Upstream 31 4.1.1. Exploration and production 31
4.2. Midstream 33 4.2.1. Pipelines 33 4.2.1. Gas storage 34 4.2.2. Generator-retailers 35
4.1. Downstream 47 4.1.1. Petrochemical producers 47
5. Global data room 49 5.1. Oils 49 5.2. Gas 50 5.3. LPG 51
6. Map room 52 6.1. Offshore drilling slates 52
6.1.1. Taranaki Basin, firm 52 6.1.2. Frontier basins, firm 53
6.2. Onshore drilling slates 54 6.2.1. Taranaki Basin, firm 54 6.2.2. Frontier basins, firm 55
7. Trading room 56 7.1.1. Sector indices 56 7.1.2. NZ-active listed player share price performance 57 7.1.3. EV vs 2P screening 59
Glossary 60 Conversions 65
2012-13 New Zealand Petroleum Sector Yearbook | April 2013 Update 3
List of figures Exhibit 1: NZ electricity market concentration 8 Exhibit 2: NZ gas market concentration 8 Exhibit 3: Onshore Taranaki small/mid cap market capitalisations 11 Exhibit 4: Q213 catalyst outlook 12 Exhibit 5: NZ-active E&P players 13 Exhibit 6: New prospecting and exploration permit awards, H212-Q113 15 Exhibit 7: Permit surrenders, H212-Q113 16 Exhibit 8: Permit extensions, H212-Q113 16 Exhibit 9: Farm-in/out deals, H212-Q113 17 Exhibit 10: Known acreage marketing campaigns 18 Exhibit 11: Infrastructure build activity – production facilities, H212-Q113 19 Exhibit 12: Infrastructure build activity – pipelines, H212-Q113 19 Exhibit 13: Recent/current E&P corporate M&A activity 20 Exhibit 14: Recent/current E&P asset M&A activity 21 Exhibit 15: Oil & gas wells drilled, H212 21 Exhibit 16: Offshore Taranaki drilling programmes, H212-Q113 21 Exhibit 17: Onshore Taranaki drilling programmes, H212-Q113 22 Exhibit 18: Onshore non-Taranaki drilling programmes, H212-Q113 22 Exhibit 19: Pending drill-or-drop obligations under NZP&M permit work programmes, CY13 23 Exhibit 20: Forward firm offshore well slate 24 Exhibit 21: Forward contingent/probable/possible offshore well slate 24 Exhibit 22: Forward firm onshore well slate 24 Exhibit 23: Forward contingent/probable/possible onshore well slate 25 Exhibit 24: Gas-fired and geothermal generation, daily, CY07-CY12 26 Exhibit 25: Gas-fired thermal station annualised daily capacity factors, CY08-CY12 27 Exhibit 26: NZ LPG market, CY00-CY12 30 Exhibit 27: NZ LPG market mix CY12 30 Exhibit 28: NZ oil production, quarterly 31 Exhibit 29: NZ oil production, CY 31 Exhibit 30: NZ gas production, quarterly 31 Exhibit 31: NZ gas production, CY 31 Exhibit 32: NZ FPSO production, monthly 32 Exhibit 33: Kupe field production, monthly 32 Exhibit 34: NZ crude exports value, monthly 32 Exhibit 35: NZ crude exports volume, monthly 32 Exhibit 36: NZ onshore rig count, monthly 32 Exhibit 37: NZ offshore rig count, monthly 32 Exhibit 38: Maui (Oaonui injection point) – Maui pipeline injection, daily 33 Exhibit 39: Pohokura (Ngatimuru + Tikorangi-2 injection points) – Maui pipeline injection, daily 33 Exhibit 40: Mangahewa/McKee (Tikorangi) – Maui pipeline injection, daily 33 Exhibit 41: Turangi – Maui pipeline injection, daily 34 Exhibit 42: Delivery fields – Maui pipeline injection, daily 34

2012-13 New Zealand Petroleum Sector Yearbook | April 2013 Update 4
Exhibit 43: Ahuroa gas storage, month-end storage 34 Exhibit 44: Ahuroa gas storage, net mthly movement 34 Exhibit 45: Contact gas deployment, monthly 35 Exhibit 46: Contact gas deployment, FY 35 Exhibit 47: Contact generation mix, monthly 35 Exhibit 48: Contact generation mix, FY 35 Exhibit 49: Contact gas & LPG customers 35 Exhibit 50: Contact average cost of gas 35 Exhibit 51: Contact retail gas sales, monthly 36 Exhibit 52: Contact retail gas sales, FY 36 Exhibit 53: Contact LPG sales, monthly 36 Exhibit 54: Contact LPG sales, FY 36 Exhibit 55: TCC capacity factor, daily 36 Exhibit 56: Otahuhu-B CCGT capacity factor, daily 37 Exhibit 57: Te Rapa cogen capacity factor, daily 37 Exhibit 58: Taranaki peakers capacity factor, daily 37 Exhibit 59: Genesis gas deployment, quarterly 38 Exhibit 60: Genesis gas deployment, FY 38 Exhibit 61: Genesis generation mix, quarterly 38 Exhibit 62: Genesis generation mix, FY 38 Exhibit 63: Genesis Huntly 1-4 fuel burn, qtrly 38 Exhibit 64: Genesis Huntly 1-4 fuel burn, FY 38 Exhibit 65: Genesis Huntly 1-4 coal burn & stock, qtrly 39 Exhibit 66: Genesis Huntly 1-4 coal burn & stock, FY 39 Exhibit 67: Genesis retail gas load & customers, qtrly 39 Exhibit 68: Genesis retail gas load & customers, FY 39 Exhibit 69: Genesis LPG load & customers, qtrly 39 Exhibit 70: Genesis LPG load & customers, FY 39 Exhibit 71: Huntly-5 CCGT (e3p) capacity factor, daily 40 Exhibit 72: Huntly-6 OCGT capacity factor, daily 40 Exhibit 73: Huntly 1-4 ST capacity factor, daily 40 Exhibit 74: MRP gas deployment, quarterly 41 Exhibit 75: MRP gas deployment, FY 41 Exhibit 76: MRP retail gas sales & customers, qtrly 41 Exhibit 77: MRP retail gas sales & customers, FY 41 Exhibit 78: MRP electricity sales & customers, qtrly 41 Exhibit 79: MRP electricity sales & customers, FY 41 Exhibit 80: MRP generation mix, qtrly 42 Exhibit 81: MRP generation mix, FY 42 Exhibit 82: MRP average cost of gas, FY 42 Exhibit 83: MRP average cost of gas, quarterly 42 Exhibit 84: Southdown capacity factor, daily 42 Exhibit 85: Nova retail gas customers, quarterly 43 Exhibit 86: Nova retail gas customers, CY 43 Exhibit 87: Nova electricity customers, quarterly 43
2012-13 New Zealand Petroleum Sector Yearbook | April 2013 Update 5
Exhibit 88: Nova electricity customers, CY 43 Exhibit 89: Nova installed generation 43 Exhibit 90: Whareroa cogen capacity factor, daily 44 Exhibit 91: Kapuni cogen capacity factor, daily 44 Exhibit 92: McKee peakers capacity factor, daily 44 Exhibit 93: Meridian retail electricity customers, qtrly 45 Exhibit 94: Meridian retail electricity customers, FY 45 Exhibit 95: Meridian generation mix, qtrly 45 Exhibit 96: Meridian generation mix, FY 45 Exhibit 97: Meridian installed generation 45 Exhibit 98: Trustpower electricity customers, quarterly 46 Exhibit 99: Trustpower electricity customers, FY 46 Exhibit 100: Trustpower generation mix, quarterly 46 Exhibit 101: Trustpower generation mix, FY 46 Exhibit 102: Trustpower installed generation 46 Exhibit 103: Methanex NZ production, quarterly 47 Exhibit 104: Methanex NZ production, FY 47 Exhibit 105: Methanex NZ capacity & utilisation, qtrly 47 Exhibit 106: Methanex output pricing, monthly 47 Exhibit 107: Maui pipeline – Ngatimaru Rd withdrawal, daily 47 Exhibit 108: Ballance fertiliser sales, FY 48 Exhibit 109: International granular urea pricing 48 Exhibit 110: IMF Rock phosphate pricing 48 Exhibit 111: Regional light-sweet crude prices 49 Exhibit 112: Regional light-sweet crude forward curves 49 Exhibit 113: BHI global oil/gas rig count, mthly 49 Exhibit 114: BHI global land/offshore rig count, mthly 49 Exhibit 115: North American gas prices, monthly 50 Exhibit 116: Henry Hub forward curve, monthly 50 Exhibit 117: UK spot gas, monthly 50 Exhibit 118: Japan LNG import price, monthly 50 Exhibit 119: North American oil vs gas forward spread 50 Exhibit 120: Saudi Aramco LPG contract prices, mthly 51 Exhibit 121: US LPG spot prices, monthly 51 Exhibit 122: Firm 2013/14 offshore Taranaki Basin drilling map 52 Exhibit 123: Firm 2013/14 offshore frontier basin drilling map 53 Exhibit 124: Firm 2013/14 onshore Taranaki Basin drilling map 54 Exhibit 125: Firm 2013/14 onshore frontier basin drilling map 55 Exhibit 126: LSE oil & gas market indices 56 Exhibit 127: US oil & gas market indices 56 Exhibit 128: TSX oil & gas market indices 56 Exhibit 129: Australian oil & gas market indices 56 Exhibit 130: AWE 57 Exhibit 131: Beach Petroleum 57 Exhibit 132: Comet Ridge 57
2012-13 New Zealand Petroleum Sector Yearbook | April 2013 Update 6
Exhibit 133: Cue Energy 57 Exhibit 134: East West Petroleum 57 Exhibit 135: Horizon Oil 57 Exhibit 136: Kea Petroleum 58 Exhibit 137: Loyz Energy 58 Exhibit 138: NZ Energy Corp 58 Exhibit 139: NZ Oil & Gas 58 Exhibit 140: Octanex 58 Exhibit 141: Pan Pacific Petroleum 58 Exhibit 142: TAG Oil 59 Exhibit 143: Widespread Energy 59 Exhibit 144: EV vs 2P reserves screen 59
Cover photo supplied by New Zealand Petroleum & Minerals, www.nzpam.govt.nz

2012-13 New Zealand Petroleum Sector Yearbook | April 2013 Update 7
1. Sector wrap
It would be easy to resort to hyperbole to summarise what is currently taking shape in the New Zealand E&P sector. With multiple offshore rigs confirmed for the 2013/14 drilling season, major field development and extension programmes well underway and a strong uplift in frontier basin momentum, there is both much to be upbeat about and to look forward to.
We prefer to look at the facts, and the facts are these: Three mobile offshore drilling units (MODUs) have already been confirmed to visit NZ waters
during H213 and into 2014. Of these, one will undertake a short but sharp frontier campaign, while the other two will stay for extended Taranaki Basin work programmes.
We consider it distinctly possible that a further jackup could join the fleet during H114. In the past two years, five new or near-new land rigs either have or will shortly have entered
service in the NZ sector, each of which looks set to remain engaged on extended campaigns for an increasing number of growth-hungry onshore operators.
Our analysis of forward drill slates indicates a total of 31 wells confirmed. Unusually, a strong majority of confirmed wells lie in offshore acreage, with a minority onshore. Beyond firm slates, we count a further 80 contingent wells, 70 of which lie onshore.
Work programmes represent the full length of the E&P risk/reward spectrum, stretching from frontier basin wildcat offshore drilling through to high-probability onshore shallow production plays.
Among the upswing there is a clear theme of increasing commitment from important global majors to higher-risk but higher-reward frontier basin acreage.
There is a strong upswing in local market corporate deal making and farm-in activity with, we think, more to come.
Beyond NZ, there is a particularly interesting and potentially high-stakes play by local heavyweight Todd Energy into the North American GTL sector.
There are signs of a maturing market with major multinational service providers continuing to arrive into the local sector.
Highlights aplenty as momentum continues to build Our reporting presents an array of performance metrics and indicators from across the extended E&P sector. The aggregate picture from these bottom-up indicators lends strong support to a top-down conclusion of strengthening sector depth and breadth.
In respect of recent sector activity, we consider the highlights as: Successive decisions by Methanex to restart all available local market production capacity and
invest in debottlenecking its flagship Motunui plant to provide a further capacity increment. Embodied within Methanex’s downstream investment decisions, Todd Energy’s commitment
upstream to develop its high-impact Mangahewa field. Commencement of separate long-term campaigns to further develop the large but mature Maui
and Kapuni fields. Completion of the Cheal expansion project, which will deliver a material increment to onshore
production, both liquids and gas.
Offsetting an otherwise strongly positive news flow has been the loss of two major IOCs from the sector during H212. Petrobras and Apache were both hard-won additions and their respective departure decisions were an undeniable setback. Although negative wearing a longer-term lens, neither withdrawal materially detracts from the local sector’s aggregate near-term work programme. What the exits do serve to remind of is that player churn is a part of life in the E&P space, particularly in situations where home-market pressures and opportunities serve to weaken the investment proposition posed by fringe plays like New Zealand.
2012-13 New Zealand Petroleum Sector Yearbook | April 2013 Update 8
Oils: Supply-side upswing on gas coattails and exploration With nearly all local oil production exported to other markets, the supply-side of the local E&P sector operates largely independently of the demand-side. For reasons we explain in detail in the main Yearbook digest, much (but not all) of the local oils supply-side is instead more directly linked to gas market liquidity; as gas production rises, so does the yield of associated liquids. Official CY12 indigenous production totalled 14.7mmbbl (40.4kbbl/day), 12.6% down on the CY11 outcome of 16.6mmbbl (45.5kbbl/day). Production attrition from the young but front-loaded Maari and Tui fields weighed on the CY12 aggregate, as did an extended scheduled outage at Kupe during Q412. Offsetting this were encouraging up-ticks from each of the established Pohokura, Turangi and Cheal fields. Also evident were significant increases from the under-development Mangahewa and Copper Moki fields.
Going forward, we would expect CY13 production to at least hold at CY12 levels as onshore yields from Mangahewa, Cheal and others support attrition from maturing fields.
Beyond the near-term, the activity pipeline is very encouraging for liquids production. Near-field programmes targeting the Maui, Kapuni, Maari and Tui fields scheduled for 2013-14 are each high-probability plays that should yield material reserve and production increments. Other offshore exploration programmes already committed would likely, if successful, yield new production and reserve increments of a scale at least comparable to Tui and Maari. Other onshore exploration programmes targeting promising new plays, such as Mauku and Cardiff, would also likely yield significant condensate strips.
Gas: Methanex turning all lights back on, vacuuming near-term gas overhang The extent of improvement in gas market confidence is, in our view, the most important above-ground sector theme to have emerged over the past 18 months.
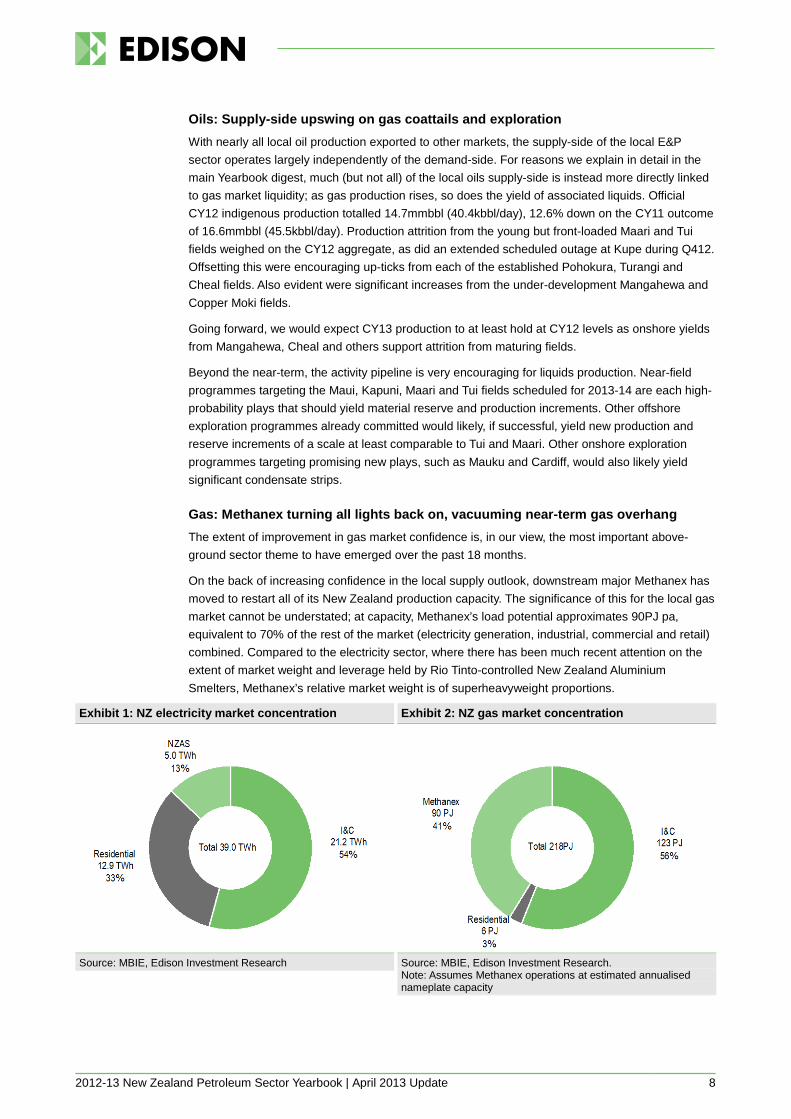
On the back of increasing confidence in the local supply outlook, downstream major Methanex has moved to restart all of its New Zealand production capacity. The significance of this for the local gas market cannot be understated; at capacity, Methanex’s load potential approximates 90PJ pa, equivalent to 70% of the rest of the market (electricity generation, industrial, commercial and retail) combined. Compared to the electricity sector, where there has been much recent attention on the extent of market weight and leverage held by Rio Tinto-controlled New Zealand Aluminium Smelters, Methanex’s relative market weight is of superheavyweight proportions.
Exhibit 1: NZ electricity market concentration Exhibit 2: NZ gas market concentration
Source: MBIE, Edison Investment Research Source: MBIE, Edison Investment Research.
Note: Assumes Methanex operations at estimated annualised nameplate capacity

2012-13 New Zealand Petroleum Sector Yearbook | April 2013 Update 9
After a period of substantial uncertainty during 2011-12 while supply- and demand-side conditions were each very fluid, how this activity relays into wellhead gas prices is becoming clearer. In mid-2012, prior to Methanex deciding to either restart (Waitara Valley), refurbish (Meth-2) and/or debottleneck (Motunui distillation) 1.5mt of its 2.2mt of total local capacity, we concluded that a NZ$5/GJ benchmark (subject to a great many variables, such as gas-to-liquid ratios, load profiles, capital and operating cost profiles) represented a fair ‘market clearing’ benchmark, based on a principle of gas price sufficiency to support new marginal projects being brought to market.
Importantly, the market clearing benchmark was grounded on an assumption of broad equilibrium between market supply and demand. In other words, that market demand and supply are in approximate balance and not distorted by a substantial supply or demand overhang. This is a major caveat. We explained in detail that due to the uniqueness of the local gas market context (particularly its shallowness and the geographic inability to trade gas with other markets) changes in supply and demand equations can serve to materially distort the local gas market, with periods of substantial swings in buyer and seller leverage the result.
In our view, this frame remains valid, however Methanex’s decisions to reinstate its full portfolio of idled capacity has delivered a major shift to market dynamics. In simple terms, Methanex’s restart and turnaround decisions taken since the start of 2013 have resulted in nearly 1.5mt of new methanol-raising capacity being added to the buy-side of the gas market, equivalent to c 55PJ pa. In electricity market terms, this increment is approximately equivalent to adding nearly three new Tiwai Point smelters to the demand equation within a 12-month period.
In our Methanex New Zealand case analysis presented in our mid-2012 analysis we concluded that, on a NPV10 screen, Methanex’s investment economics remained positive up to an average (note: not marginal) gas price of NZ$7/GJ. By pursuing a gas gathering strategy that sees it aggregate multiple gas tranches from a number of fields and sellers at different pricing structures, the effect is of Methanex spreading both delivery risk and its average portfolio gas price. In aggregate, the strategy as we see it is of Methanex leaning on its backbone tranche of (we infer) NZ$5-6/GJ Mangahewa gas, but being prepared to pay more or less depending on the circumstances for smaller tranches as it widens its gathering net. However, within this Methanex’s average cost of gas remains anchored by its Mangahewa GSA, which is highly likely to be supported by a risk sharing component on price. Notably, however, market dynamics would change substantially once more if Methanex’s investment in the now-underway Mauku-1 well (a potential 0.5-1.0tcf resource) proves successful.
What this means for other market players with more variable and therefore less-favourable (for seller) uplift profiles is still unfolding. With materially all gas continuing to trade on bilateral arrangements between players that are either private or very large multinationals, the local gas market remains effectively vacant of meaningful wholesale price proxies. While indications appear to be that contract prices for new gas may be settling above Methanex’s Mangahewa band, there are equally firm indications of gas changing hands at lower levels. In one of very few explicit public statements made by gas sellers regarding contracted gas prices, publicly listed producer TAG Oil has declared a sales gas price (albeit for small volumes) of NZ$5.40/mcf, although it is admittedly unclear just how current (in terms of the recency of the indicated GSA) this price marker is.
The incorporation of risk-sharing mechanisms, such as the indexation of gas price to international methanol pricing and forex, into GSAs also serves to substantially reduce Methanex’s commercial risk profile. Looking ahead, it is difficult to look beyond a scenario where local gas market conditions will operate independently of global methanol market conditions.
Demand from the balance of the gas market continues to erode as electricity generators reduce their thermal dispatch, leaving Methanex to vacuum the fuel overhang. In short, and as we suggested in our mid-2012 analysis, Methanex has emerged to now clearly hold the mantle of market-maker in the wholesale gas space.

2012-13 New Zealand Petroleum Sector Yearbook | April 2013 Update 10
Separate but very much related to Methanex’s buy-side dominance in the local gas space, we also see a heightening in the commercial risk profile faced by sellers of uncontracted gas. By far the most material specific risk relates to the potential impact that the closure of the world-scale Tiwai Point aluminium smelter could have on local energy markets. While the spectrum of possible market outcomes remains vast and will ultimately depend on decision-making and infrastructure (particularly high voltage electricity transmission) of entities that lie squarely outside the oil and gas space, the implications for the gas (and, therefore, oils) sector are potentially very significant. At its worst and simplest, the arrival of over 5,000GWh pa (equivalent in scale to the annual demand of the entire Canterbury region) of high-capacity, ultra-low SRMC hydroelectric generation into the wholesale electricity market would serve to fundamentally re-cast electricity dispatch strategies. Thermal plant would face the greatest risk of displacement, particularly installations that are older and less efficient. The three remaining 250MW steam turbines at Huntly would be likely to rapidly leave service. At existing gas prices, Contact Energy’s Otahuhu-B and TCC CCGTs would also face severe competitive pressure.
In this space, gas sellers with firm arrangements already in place are clearly best placed to see out the near-term risk posed by the NZAS situation. Sellers with excess product will likely find thermal generators very reluctant to discuss longer-term arrangements while the level of market uncertainty is so high. Again, this uncertainty falls squarely to the benefit of Methanex – an outcome that would likely be greatly amplified if NZAS did in fact resolve to close Tiwai Point.
Complicating this, after providing for GSAs already announced or inferred, we estimate that Methanex has c 20PJ (perhaps +/-10PJ pa) pa of buying capacity left in its gas book to meet the full c 90PJ pa fuel demand potential of its full NZ fleet. A number of possibilities exist to fill this gap, with the result industry is already asking itself what will happen to price and non-price terms for gas once Methanex’s book is full.
LPG: demand-side firming but supply-side situation still fluid As with gas, the domestic LPG picture continues to unfold. The recent-year addition of major new increments of supply-side capacity to a demand-side otherwise in sharp decline served to bring intense pressure to the local LPG market. Price-led strategies from net-long producers scrambling to place LPG into the market brought much price discounting and, therefore, margin pressure.
Against this backdrop, as 2012 has progressed there have been increasing signs that the domestic market has begun to settle. The recent-year decline in market size appears to have at least stabilised and the ability of producers to access export infrastructure has improved market depth. Margins appear to have recovered as players have adapted themselves to the new environment.
Despite this firming, in our view there remains much current uncertainty towards the makeup and extent of the local sector’s supply curve. Although production growth from the Kupe field and an expansion of Todd Energy’s McKee straddle plant will add a further 14kt to the local sector’s supply-side capacity, the situations at each of the sector’s other LPG plants at Maui, Kapuni, Waihapa and Rimu are far from certain. The reason for this is that LPG production from each will be foremostly a function of the success or otherwise of below-ground development programmes currently underway. With each plant having substantial above-ground LPG capacity headroom available, if significant success is realised from one or more of these programmes, substantial new capacity increments could materialise.
Further along the supply chain, although the market is currently in approximate supply-demand balance on an annualised basis, significant intra-year demand-side seasonality is bringing increasing pressure to player supply chains. To offset this, we see a case for further investment in storage and handling capacity, particularly if further supply-side capacity comes onstream. Again, there are a great many permutations and combinations for how this capacity could come together, and we expect this to be a major focus for Liquigas over 2013-14.
2012-13 New Zealand Petroleum Sector Yearbook | April 2013 Update 11
Financial markets: broad underperformance, particularly onshore As we noted in our most recent macro commentary (see “Prices look vulnerable”, 26 February) the oil and gas sector has underperformed the rebound seen across most markets during 2012. The New Zealand sector has tended to reflect this trend, although with significant variability. For companies listed on other exchanges but with material (for them) New Zealand-specific businesses, the trend has again been broadly to the negative, although again with a significant spread evident across players.
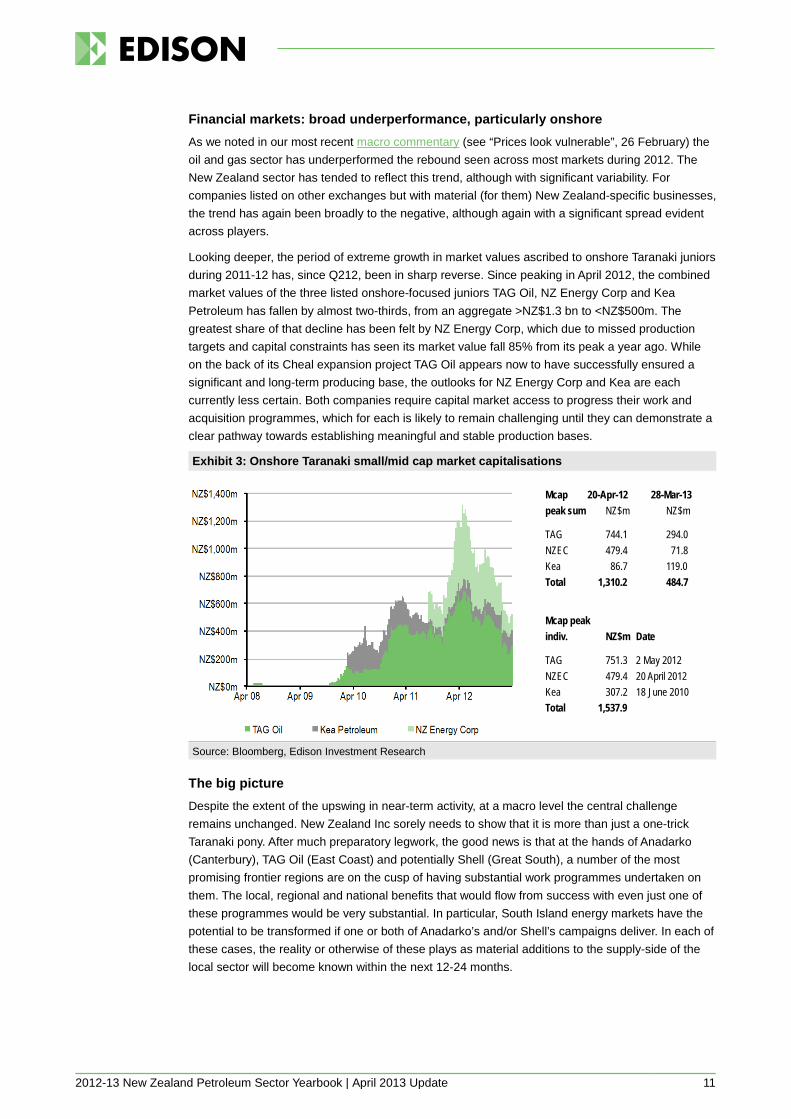
Looking deeper, the period of extreme growth in market values ascribed to onshore Taranaki juniors during 2011-12 has, since Q212, been in sharp reverse. Since peaking in April 2012, the combined market values of the three listed onshore-focused juniors TAG Oil, NZ Energy Corp and Kea Petroleum has fallen by almost two-thirds, from an aggregate >NZ$1.3 bn to <NZ$500m. The greatest share of that decline has been felt by NZ Energy Corp, which due to missed production targets and capital constraints has seen its market value fall 85% from its peak a year ago. While on the back of its Cheal expansion project TAG Oil appears now to have successfully ensured a significant and long-term producing base, the outlooks for NZ Energy Corp and Kea are each currently less certain. Both companies require capital market access to progress their work and acquisition programmes, which for each is likely to remain challenging until they can demonstrate a clear pathway towards establishing meaningful and stable production bases.
Exhibit 3: Onshore Taranaki small/mid cap market capitalisations
Source: Bloomberg, Edison Investment Research
The big picture Despite the extent of the upswing in near-term activity, at a macro level the central challenge remains unchanged. New Zealand Inc sorely needs to show that it is more than just a one-trick Taranaki pony. After much preparatory legwork, the good news is that at the hands of Anadarko (Canterbury), TAG Oil (East Coast) and potentially Shell (Great South), a number of the most promising frontier regions are on the cusp of having substantial work programmes undertaken on them. The local, regional and national benefits that would flow from success with even just one of these programmes would be very substantial. In particular, South Island energy markets have the potential to be transformed if one or both of Anadarko’s and/or Shell’s campaigns deliver. In each of these cases, the reality or otherwise of these plays as material additions to the supply-side of the local sector will become known within the next 12-24 months.
Mcap 20-Apr-12 28-Mar-13 peak sum NZ$m NZ$m
TAG 744.1 294.0 NZEC 479.4 71.8 Kea 86.7 119.0 Total 1,310.2 484.7
Mcap peak indiv. NZ$m Date
TAG 751.3 2 May 2012 NZEC 479.4 20 April 2012 Kea 307.2 18 June 2010 Total 1,537.9
2012-13 New Zealand Petroleum Sector Yearbook | April 2013 Update 12
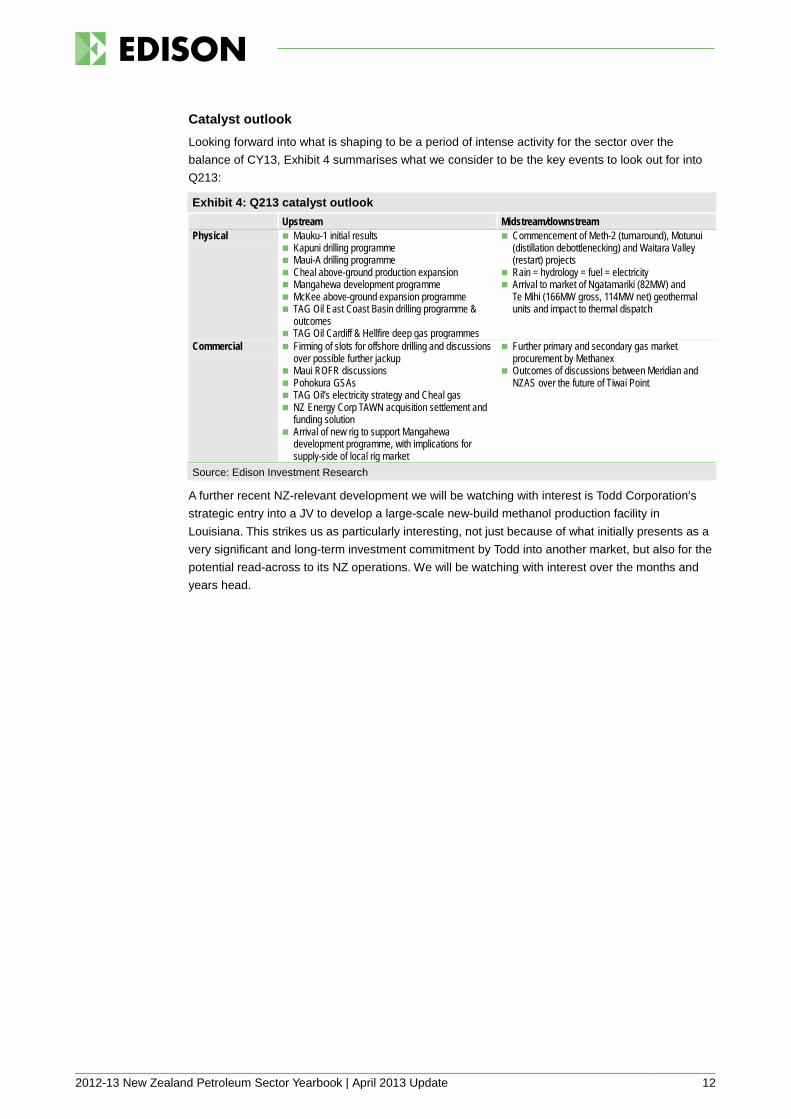
Catalyst outlook Looking forward into what is shaping to be a period of intense activity for the sector over the balance of CY13, Exhibit 4 summarises what we consider to be the key events to look out for into Q213:
Exhibit 4: Q213 catalyst outlook Upstream Midstream/downstream Physical Mauku-1 initial results
Kapuni drilling programme Maui-A drilling programme Cheal above-ground production expansion Mangahewa development programme McKee above-ground expansion programme TAG Oil East Coast Basin drilling programme &
outcomes TAG Oil Cardiff & Hellfire deep gas programmes
Commencement of Meth-2 (turnaround), Motunui (distillation debottlenecking) and Waitara Valley (restart) projects
Rain = hydrology = fuel = electricity Arrival to market of Ngatamariki (82MW) and
Te Mihi (166MW gross, 114MW net) geothermal units and impact to thermal dispatch
Commercial Firming of slots for offshore drilling and discussions over possible further jackup
Maui ROFR discussions Pohokura GSAs TAG Oil’s electricity strategy and Cheal gas NZ Energy Corp TAWN acquisition settlement and
funding solution Arrival of new rig to support Mangahewa
development programme, with implications for supply-side of local rig market
Further primary and secondary gas market procurement by Methanex
Outcomes of discussions between Meridian and NZAS over the future of Tiwai Point
Source: Edison Investment Research
A further recent NZ-relevant development we will be watching with interest is Todd Corporation’s strategic entry into a JV to develop a large-scale new-build methanol production facility in Louisiana. This strikes us as particularly interesting, not just because of what initially presents as a very significant and long-term investment commitment by Todd into another market, but also for the potential read-across to its NZ operations. We will be watching with interest over the months and years head.
2012-13 New Zealand Petroleum Sector Yearbook | April 2013 Update 13
2. Supply-side activity and outlook
2.1. Above-ground
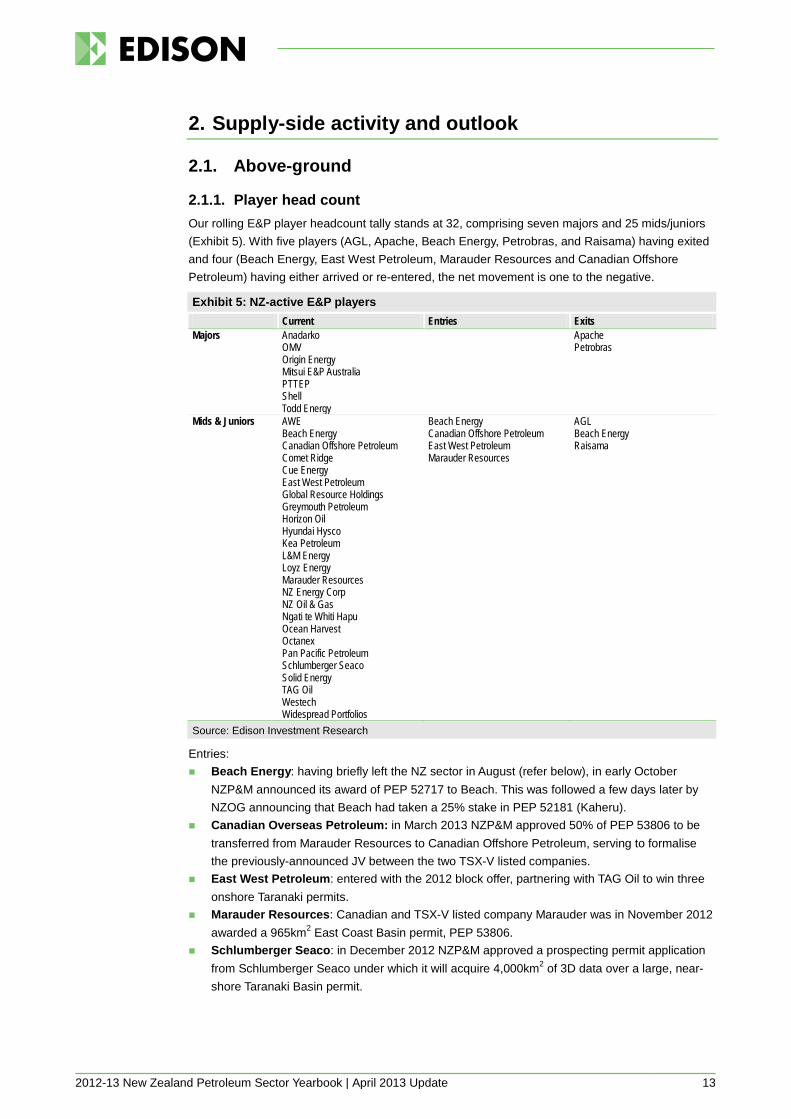
2.1.1. Player head count Our rolling E&P player headcount tally stands at 32, comprising seven majors and 25 mids/juniors (Exhibit 5). With five players (AGL, Apache, Beach Energy, Petrobras, and Raisama) having exited and four (Beach Energy, East West Petroleum, Marauder Resources and Canadian Offshore Petroleum) having either arrived or re-entered, the net movement is one to the negative.
Exhibit 5: NZ-active E&P players Current Entries Exits Majors Anadarko
OMV Origin Energy Mitsui E&P Australia PTTEP Shell Todd Energy
Apache Petrobras
Mids & Juniors AWE Beach Energy Canadian Offshore Petroleum Comet Ridge Cue Energy East West Petroleum Global Resource Holdings Greymouth Petroleum Horizon Oil Hyundai Hysco Kea Petroleum L&M Energy Loyz Energy Marauder Resources NZ Energy Corp NZ Oil & Gas Ngati te Whiti Hapu Ocean Harvest Octanex Pan Pacific Petroleum Schlumberger Seaco Solid Energy TAG Oil Westech Widespread Portfolios
Beach Energy Canadian Offshore Petroleum East West Petroleum Marauder Resources
AGL Beach Energy Raisama
Source: Edison Investment Research
Entries: Beach Energy: having briefly left the NZ sector in August (refer below), in early October
NZP&M announced its award of PEP 52717 to Beach. This was followed a few days later by NZOG announcing that Beach had taken a 25% stake in PEP 52181 (Kaheru).
Canadian Overseas Petroleum: in March 2013 NZP&M approved 50% of PEP 53806 to be transferred from Marauder Resources to Canadian Offshore Petroleum, serving to formalise the previously-announced JV between the two TSX-V listed companies.
East West Petroleum: entered with the 2012 block offer, partnering with TAG Oil to win three onshore Taranaki permits.
Marauder Resources: Canadian and TSX-V listed company Marauder was in November 2012 awarded a 965km2 East Coast Basin permit, PEP 53806.
Schlumberger Seaco: in December 2012 NZP&M approved a prospecting permit application from Schlumberger Seaco under which it will acquire 4,000km2 of 3D data over a large, near-shore Taranaki Basin permit.
2012-13 New Zealand Petroleum Sector Yearbook | April 2013 Update 14
Exits: AGL: having exited two earlier positions, AGL sold its 75% stake in PEP 53247 (Kahili) in
February 2013 to fellow Kahili JV partner L&M Energy. Apache: announced in January its decision not to proceed to the second stage of a frontier
East Coast Basin work programme with TAG Oil. Beach Energy: in August, the NZOG-operated JV holding PEP 38259 (Barque) in the offshore
Canterbury Basin announced its decision to relinquish the permit after failing to attract further partners. At the time, Barque was Beach’s only NZ holding.
Petrobras: in December 2012, Petrobras exited its only NZ position, 100%-held PEP 52707 in the Raukumara Basin.
2.1.2. Player permit activity At the start of April 2013, NZP&M logged a total of 85 permits on issue made up of 60 PEP's (27 offshore, or with some offshore component), 1 PPP (offshore) and 24 mining licenses/permits (of which 8 are either fully or partly offshore). This compares to 1 January 2012 when 96 permits were current comprising 73 PEPs (29 fully/party offshore), no PPP's and 23 mining licenses/permits (of which 8 fully/partly offshore).
During 2H12 there was a notable upswing in acreage-related activity as players sought to extend permit footprints and positions. Activity represented a mix of new-permit awards and farm-in/outs.
Permit acquisitions The announcing in December of the outcome of the 2012 Blocks Offer round saw 10 new permits awarded (Exhibit 6). We consider the main highlights as: Anadarko added to its existing 34,233km2 of Canterbury Basin acreage held jointly with
Origin Energy by acquiring outright title to a further 7,535km2 of acreage in the offshore Pegasus Basin. Anadarko’s gross New Zealand acreage now totals 41,318km2.
Shell led a JV including OMV and Mitsui to acquire a further large offshore GSB permit (PEP 54863) lying adjacent to the east of an existing permit (PEP 50119) held by a JV comprising the same three parties. In total, the two GSB permits total 25,223km2 – more than triple the size of the entire Taranaki region. While the work programme for PEP 54863 specifies only desktop and 2D/3D acquisition obligations within the first four years, the PEP 50119 JV is expected to make a drill decision before the end of 2013.
TAG Oil acquired four new onshore permits totalling a gross 153km2. With three of those permits, TAG has partnered with new entrant and fellow TSX-listed E&P company East West Petroleum, although TAG is operator in all permits. In aggregate, the work programmes require TAG to lead the drilling of 10 wells during CY13, five of which will be centred in PEP 54877, which lies adjacent to the north and east of TAG’s existing Cheal permit. A further two of the newly acquired permits also lie in close proximity to the Cheal permit.
Also during H212, three new permits were awarded under the since-abandoned Priority in Time (PIT) regime (Exhibit 6). Notably within this, global oil services heavyweight Schlumberger (via subsidiary company Schlumberger Seaco) was granted a prospecting permit over a very large Taranaki near-shore permit lying adjacent to the north of the Pohokura permit. The work programme requires Seaco to acquire a minimum 4,000km2 of 3D seismic by June 2013, which would put the programme in the same ballpark as the enormous 4,820km2 campaign led by OMV over its GSB permit PEP 50119 in 2011/12. At its discretion, Seaco could seek to acquire a further 1,600km2 of 3D before the permit expires in June 2014. Potentially, therefore, Seaco could acquire up to 5,600km2 of 3D over the 18-month term of the permit. Seaco would hold title to any acquired data for 15 years, which it will look to sell to explorers interested in the acreage. In January, the 12-streamer Western Monarch vessel owned and operated by Schlumberger subsidiary WesternGeco arrived to commence the programme.

2012-13 New Zealand Petroleum Sector Yearbook | April 2013 Update 15
Exhibit 6: New prospecting and exploration permit awards, H212-Q113 Permit Granted Permit type Basin Onshore
/offshore Yrs km2 Operator Other JV parties
2012 Blocks Offer
PEP 54857 11-12-12 Exploration Taranaki Onshore 5 525 NZOG 100% - PEP 54858 11-12-12 Exploration Pegasus Offshore 5 4,723 Anadarko 100% - PEP 54861 11-12-12 Exploration Pegasus Offshore 5 2,812 Anadarko 100% - PEP 54863 11-12-12 Exploration GSB Offshore 5 8,508 Shell 59% OMV 26%
Mitsui 15% PEP 54865 11-12-12 Exploration Taranaki Offshore 5 2,475 Todd 80% Cue 20% PEP 54867 11-12-12 Exploration Taranaki Onshore 5 111 NZ Energy Corp 60% NZOG 40% PEP 54873 11-12-12 Exploration Taranaki Onshore 5 107 TAG Oil 100% - PEP 54876 11-12-12 Exploration Taranaki Onshore 5 16 TAG Oil 50% East West 50% PEP 54877 11-12-12 Exploration Taranaki Onshore 5 25 TAG Oil 70% East West 30% PEP 54879 11-12-12 Exploration Taranaki Onshore 5 5 TAG Oil 50% East West 50%
PIT PEP 52717 11-10-12 Exploration Canterbury Offshore 5 3,246 Beach Energy 100% - PEP 53806 1-11-12 Exploration East Coast Onshore 5 965 Marauder Res 50% COPL NZ 50% PPP 54827 20-12-12 Prospecting Taranaki Offshore 1.5 9,377 Schlumberger 100% -
Source: NZP&M, Edison Investment Research
Permit surrenders Since H212 a total of eight permits were relinquished by operators (Exhibit 7). Of these, all except two surrenders related to acreage held in the South Island. Surrenders to note: Petrobras relinquished its very large Raukumara Basin permit, PEP 52707. The permit was
Petrobras’s only New Zealand acreage holding. The surrender was followed by much speculation over the reasons for Petrobras’s withdrawal. A Petrobras statement at the time indicated that internal analysis had concluded insufficient materiality to proceed. Corporate consolidation back in favour of core activities is also likely to have been a factor given Petrobras’s poor share price performance since embarking on a US$225bn capital development programme in late 2010 centred on its Santos and Campos Basin discoveries in the south Atlantic Ocean. Protest action against a 2D seismic survey over the Raukumara permit during Q111 is not thought to have been a major factor in the decision.
Anadarko and Origin Energy restructured their jointly held Canterbury Basin acreage by extending their outer permit PEP 38264, which includes the Carrack and Caravel prospects, and surrendering the inner licence PEP 38262.
L&M Energy relinquished three permits as part of a rationalisation programme responding to funding and balance sheet pressures. The surrenders coincided with a successful full takeover bid by L&M Energy Chairman Geoff Loudon in late 2012.
NZOG, AWE and Beach Energy, which together made up the JV holding PEP 38259 (Barque), surrendered the offshore Canterbury Basin permit following an extensive but ultimately unsuccessful marketing campaign to attract further investors to the acreage. Previously, in November 2011, ROC Oil withdrew from the JV, passing its 15% stake to Beach.
Comet Ridge surrendered its sole North Island permit, PEP 50280, in advance of a drill commitment otherwise required to have been completed by April.

2012-13 New Zealand Petroleum Sector Yearbook | April 2013 Update 16
Exhibit 7: Permit surrenders, H212-Q113 Permit Surrender date Basin Onshore/
offshore Operator Other JV parties
PEP 50280 7-3-13 Waikato Onshore Comet Ridge 100% - PEP 52819 22-2-13 Western Southland Onshore L&M Energy 100% - PEP 53669 8-2-13 Southland Onshore GE-CO Drilling 100% - PEP 52707 4-12-12 Raukumara Offshore Petrobras 100% - PEP 38262 15-10-12 Canterbury Offshore Anadarko 50% Origin Energy 50% PEP 52605 10-9-12 Canterbury Onshore L&M Energy 100% - PEP 38219 16-8-12 Otago Onshore L&M Energy 100% - PEP 38259 16-8-12 Canterbury Offshore NZOG 40% AWE 25%
Beach Energy 35% Source: NZP&M, Edison Investment Research
Permit extensions Since H212 seven extension applications were granted. All except the application made by Greymouth to extend the land acreage of its Onaero permit related to acreage outside the Taranaki Basin.
Exhibit 8: Permit extensions, H212-Q113 Permit Operation
name Granted Extension
type Extension years
Area adjustment
km2
Basin Onshore/ offshore
Operator Other JV parties
PEP 38264 Carrack-Caravel
15-10-12 Land N/A +5,597.9 Canterbury Offshore Anadarko 50% Origin 50%
PEP 38526 Kotuku 21-12-12 Duration 5 years -144.2 West Coast Onshore Widespread Portfolios 100%
-
PEP 38746 Onaero 2-8-12 Land N/A +5.4 Taranaki Onshore Greymouth 100% - PEP 38748 Sidewinder 7-8-12 Duration 4 years -11.8 Taranaki Onshore TAG Oil 100%
-
PEP 50119 GSB 4-9-12 Duration 5 years -16,811.0 GSB Offshore Shell 50% OMV 18% PTTEP 18% Mitsui 14%
PEP 50122 GSB 5-7-12 Land N/A +20.1 GSB Onshore/ offshore
Greymouth 100% -
PEP 50279 N/A 4-4-13 Duration 3 years -3,660.0 West Coast Onshore Comet Ridge 100%
-
PEP 51155 Beluga, Hickman
11-12-13 Land N/A +23.4 Taranaki Onshore Kea 100% -
Source: NZP&M, Edison Investment Research
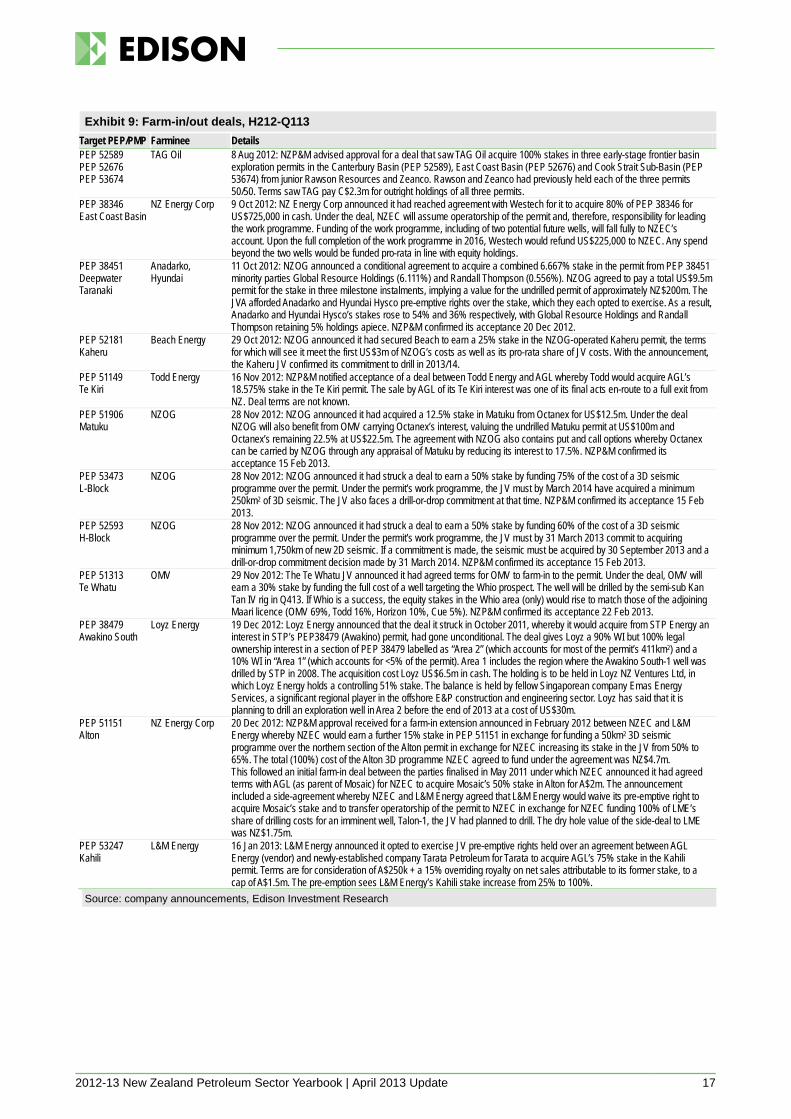
Farm-ins During H212 there was a flurry of farm-in deals announced as players looked to extend their portfolios. While frontier basins attracted higher than usual activity, most centred on the Taranaki Basin where players looked to gain or extend footholds in drill-ready prospects. Players that were particularly assertive in this space were NZOG, NZ Energy Corp, TAG Oil and OMV.
A number of players are known to be actively marketing permit positions (Exhibit 10).
2012-13 New Zealand Petroleum Sector Yearbook | April 2013 Update 17
Exhibit 9: Farm-in/out deals, H212-Q113 Target PEP/PMP Farminee Details PEP 52589 PEP 52676 PEP 53674
TAG Oil 8 Aug 2012: NZP&M advised approval for a deal that saw TAG Oil acquire 100% stakes in three early-stage frontier basin exploration permits in the Canterbury Basin (PEP 52589), East Coast Basin (PEP 52676) and Cook Strait Sub-Basin (PEP 53674) from junior Rawson Resources and Zeanco. Rawson and Zeanco had previously held each of the three permits 50/50. Terms saw TAG pay C$2.3m for outright holdings of all three permits.
PEP 38346 East Coast Basin
NZ Energy Corp 9 Oct 2012: NZ Energy Corp announced it had reached agreement with Westech for it to acquire 80% of PEP 38346 for US$725,000 in cash. Under the deal, NZEC will assume operatorship of the permit and, therefore, responsibility for leading the work programme. Funding of the work programme, including of two potential future wells, will fall fully to NZEC’s account. Upon the full completion of the work programme in 2016, Westech would refund US$225,000 to NZEC. Any spend beyond the two wells would be funded pro-rata in line with equity holdings.
PEP 38451 Deepwater Taranaki
Anadarko, Hyundai
11 Oct 2012: NZOG announced a conditional agreement to acquire a combined 6.667% stake in the permit from PEP 38451 minority parties Global Resource Holdings (6.111%) and Randall Thompson (0.556%). NZOG agreed to pay a total US$9.5m permit for the stake in three milestone instalments, implying a value for the undrilled permit of approximately NZ$200m. The JVA afforded Anadarko and Hyundai Hysco pre-emptive rights over the stake, which they each opted to exercise. As a result, Anadarko and Hyundai Hysco’s stakes rose to 54% and 36% respectively, with Global Resource Holdings and Randall Thompson retaining 5% holdings apiece. NZP&M confirmed its acceptance 20 Dec 2012.
PEP 52181 Kaheru
Beach Energy 29 Oct 2012: NZOG announced it had secured Beach to earn a 25% stake in the NZOG-operated Kaheru permit, the terms for which will see it meet the first US$3m of NZOG’s costs as well as its pro-rata share of JV costs. With the announcement, the Kaheru JV confirmed its commitment to drill in 2013/14.
PEP 51149 Te Kiri
Todd Energy 16 Nov 2012: NZP&M notified acceptance of a deal between Todd Energy and AGL whereby Todd would acquire AGL’s 18.575% stake in the Te Kiri permit. The sale by AGL of its Te Kiri interest was one of its final acts en-route to a full exit from NZ. Deal terms are not known.
PEP 51906 Matuku
NZOG 28 Nov 2012: NZOG announced it had acquired a 12.5% stake in Matuku from Octanex for US$12.5m. Under the deal NZOG will also benefit from OMV carrying Octanex’s interest, valuing the undrilled Matuku permit at US$100m and Octanex’s remaining 22.5% at US$22.5m. The agreement with NZOG also contains put and call options whereby Octanex can be carried by NZOG through any appraisal of Matuku by reducing its interest to 17.5%. NZP&M confirmed its acceptance 15 Feb 2013.
PEP 53473 L-Block
NZOG 28 Nov 2012: NZOG announced it had struck a deal to earn a 50% stake by funding 75% of the cost of a 3D seismic programme over the permit. Under the permit’s work programme, the JV must by March 2014 have acquired a minimum 250km2 of 3D seismic. The JV also faces a drill-or-drop commitment at that time. NZP&M confirmed its acceptance 15 Feb 2013.
PEP 52593 H-Block
NZOG 28 Nov 2012: NZOG announced it had struck a deal to earn a 50% stake by funding 60% of the cost of a 3D seismic programme over the permit. Under the permit’s work programme, the JV must by 31 March 2013 commit to acquiring minimum 1,750km of new 2D seismic. If a commitment is made, the seismic must be acquired by 30 September 2013 and a drill-or-drop commitment decision made by 31 March 2014. NZP&M confirmed its acceptance 15 Feb 2013.
PEP 51313 Te Whatu
OMV 29 Nov 2012: The Te Whatu JV announced it had agreed terms for OMV to farm-in to the permit. Under the deal, OMV will earn a 30% stake by funding the full cost of a well targeting the Whio prospect. The well will be drilled by the semi-sub Kan Tan IV rig in Q413. If Whio is a success, the equity stakes in the Whio area (only) would rise to match those of the adjoining Maari licence (OMV 69%, Todd 16%, Horizon 10%, Cue 5%). NZP&M confirmed its acceptance 22 Feb 2013.
PEP 38479 Awakino South
Loyz Energy 19 Dec 2012: Loyz Energy announced that the deal it struck in October 2011, whereby it would acquire from STP Energy an interest in STP’s PEP38479 (Awakino) permit, had gone unconditional. The deal gives Loyz a 90% WI but 100% legal ownership interest in a section of PEP 38479 labelled as “Area 2” (which accounts for most of the permit’s 411km2) and a 10% WI in “Area 1” (which accounts for <5% of the permit). Area 1 includes the region where the Awakino South-1 well was drilled by STP in 2008. The acquisition cost Loyz US$6.5m in cash. The holding is to be held in Loyz NZ Ventures Ltd, in which Loyz Energy holds a controlling 51% stake. The balance is held by fellow Singaporean company Emas Energy Services, a significant regional player in the offshore E&P construction and engineering sector. Loyz has said that it is planning to drill an exploration well in Area 2 before the end of 2013 at a cost of US$30m.
PEP 51151 Alton
NZ Energy Corp 20 Dec 2012: NZP&M approval received for a farm-in extension announced in February 2012 between NZEC and L&M Energy whereby NZEC would earn a further 15% stake in PEP 51151 in exchange for funding a 50km2 3D seismic programme over the northern section of the Alton permit in exchange for NZEC increasing its stake in the JV from 50% to 65%. The total (100%) cost of the Alton 3D programme NZEC agreed to fund under the agreement was NZ$4.7m. This followed an initial farm-in deal between the parties finalised in May 2011 under which NZEC announced it had agreed terms with AGL (as parent of Mosaic) for NZEC to acquire Mosaic’s 50% stake in Alton for A$2m. The announcement included a side-agreement whereby NZEC and L&M Energy agreed that L&M Energy would waive its pre-emptive right to acquire Mosaic’s stake and to transfer operatorship of the permit to NZEC in exchange for NZEC funding 100% of LME’s share of drilling costs for an imminent well, Talon-1, the JV had planned to drill. The dry hole value of the side-deal to LME was NZ$1.75m.
PEP 53247 Kahili
L&M Energy 16 Jan 2013: L&M Energy announced it opted to exercise JV pre-emptive rights held over an agreement between AGL Energy (vendor) and newly-established company Tarata Petroleum for Tarata to acquire AGL’s 75% stake in the Kahili permit. Terms are for consideration of A$250k + a 15% overriding royalty on net sales attributable to its former stake, to a cap of A$1.5m. The pre-emption sees L&M Energy’s Kahili stake increase from 25% to 100%.
Source: company announcements, Edison Investment Research

2012-13 New Zealand Petroleum Sector Yearbook | April 2013 Update 18
Exhibit 10: Known acreage marketing campaigns Target PEP/PMP Basin Onshore/
offshore Vendor Current
Holding Details
PEP 38264 Carrack-Caravel
Canterbury Offshore Anadarko & Origin 50% Each of Anadarko and Origin have declared their preference to reduce their current 50% interests.
PEP 38342 Ranui, PEP 38346 Wairoa, PEP 52694 Castlepoint, PEP 52976 East Cape
East Coast Onshore NZ Energy Corp 80% - 100% NZ Energy Corp has indicated a preference to recruit a partner for its East Coast Basin interests. It holds outright stakes in three of its four permits, with the exception being the Wairoa permit PEP 38346 where it holds 80%.
PEP 38451 Deepwater Taranaki
Taranaki Offshore Anadarko 54% Anadarko has expressed a preference to farm-down its PEP 38451 interest from its current 54% and is known to be marketing the opportunity.
PEP 38526 Kotuku
West Coast Onshore Widespread Portfolios 100% In December 2012, NZP&M confirmed a further five-year term. Widespread is known to be seeking partners.
PEP 38605 Waikato
Taranaki Onshore Solid Energy 100% Thought likely to be offered to market as part of a restructuring/rescue plan to return Solid Energy to financial viability. Surface CSG and UCG pilot plants also likely to feature in sales process.
PEP 38614 Taranaki
Taranaki Onshore Solid Energy 100% Thought likely to be offered to market as part of a restructuring/rescue plan to return Solid Energy to financial viability.
PEP 51149 Te Kiri
Taranaki Onshore Todd Energy 80% Todd holds 80% of Te Kiri, which lies onshore to the west of Mt Taranaki, with related company Cue Energy, which holds the 20% balance. Todd is thought to likely to seek to farm-down its interest during 2013.
PEP 51311 Kakapo
Taranaki Offshore NZOG 100% Following the withdrawal of previous 10% investor Raisama in February, NZOG now holds outright title of Kakapo. NZOG has previously committed to drilling Kakapo in line with work programme commitments, requiring a well to be drilled by July 2013. With a rig not secured, this will not happen, however NZOG remains actively seeking partners. NZOG has declared a prospect in 98m of water at TD >2,780m.
PEP 51558 Waitoriki
Taranaki Onshore Todd Energy 100% Todd Energy owns outright title to onshore Taranaki PEP 51156, which lies to the south-west of its Mangahewa permit. Todd is thought likely to seek to farm-down its interest during 2013 and look to drill a well during 2014.
PEP 52181 Kaheru
Taranaki Offshore NZOG 35% Although NZOG succeeded in attracting Beach Energy to Kaheru, NZOG continues to market Kaheru with the intent of further reducing its stake. A well must be drilled by May 2014.
PEP 52333 Mercury
Taranaki Offshore Kea Petroleum 100% Kea has also indicated that farm-in discussions are progressing around a 3D marine seismic survey planned for Q113 and expected to cost US$2.5m.
PEP 381204 Mauku
Taranaki Onshore Kea Petroleum 100% During H212 Kea stated it was in discussions with potential farm-out partners in advance of its drilling of Mauku-1. With drilling now well advanced, it appears highly unlikely that a new partner will be introduced before initial results become known.
Source: NZP&M, company announcements, Edison Investment Research
2012-13 New Zealand Petroleum Sector Yearbook | April 2013 Update 19
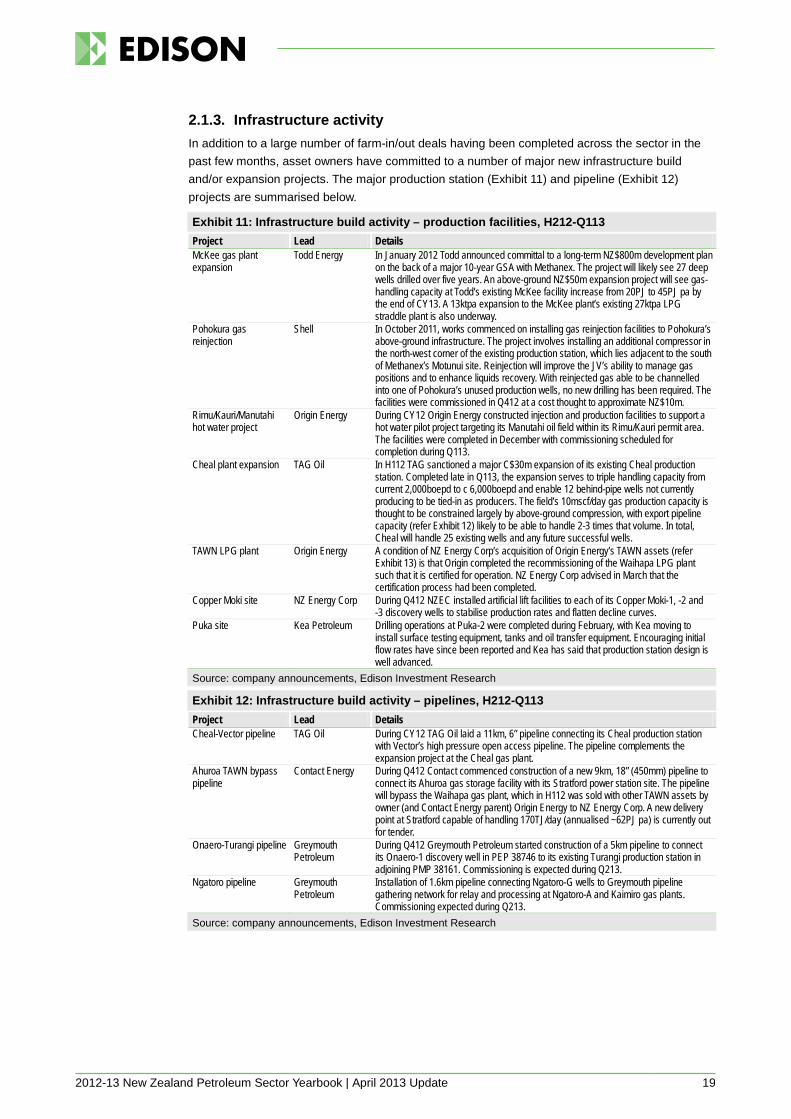
2.1.3. Infrastructure activity In addition to a large number of farm-in/out deals having been completed across the sector in the past few months, asset owners have committed to a number of major new infrastructure build and/or expansion projects. The major production station (Exhibit 11) and pipeline (Exhibit 12) projects are summarised below.
Exhibit 11: Infrastructure build activity – production facilities, H212-Q113 Project Lead Details McKee gas plant expansion
Todd Energy In January 2012 Todd announced committal to a long-term NZ$800m development plan on the back of a major 10-year GSA with Methanex. The project will likely see 27 deep wells drilled over five years. An above-ground NZ$50m expansion project will see gas-handling capacity at Todd’s existing McKee facility increase from 20PJ to 45PJ pa by the end of CY13. A 13ktpa expansion to the McKee plant’s existing 27ktpa LPG straddle plant is also underway.
Pohokura gas reinjection
Shell In October 2011, works commenced on installing gas reinjection facilities to Pohokura’s above-ground infrastructure. The project involves installing an additional compressor in the north-west corner of the existing production station, which lies adjacent to the south of Methanex’s Motunui site. Reinjection will improve the JV’s ability to manage gas positions and to enhance liquids recovery. With reinjected gas able to be channelled into one of Pohokura’s unused production wells, no new drilling has been required. The facilities were commissioned in Q412 at a cost thought to approximate NZ$10m.
Rimu/Kauri/Manutahi hot water project
Origin Energy During CY12 Origin Energy constructed injection and production facilities to support a hot water pilot project targeting its Manutahi oil field within its Rimu/Kauri permit area. The facilities were completed in December with commissioning scheduled for completion during Q113.
Cheal plant expansion TAG Oil In H112 TAG sanctioned a major C$30m expansion of its existing Cheal production station. Completed late in Q113, the expansion serves to triple handling capacity from current 2,000boepd to c 6,000boepd and enable 12 behind-pipe wells not currently producing to be tied-in as producers. The field’s 10mscf/day gas production capacity is thought to be constrained largely by above-ground compression, with export pipeline capacity (refer Exhibit 12) likely to be able to handle 2-3 times that volume. In total, Cheal will handle 25 existing wells and any future successful wells.
TAWN LPG plant Origin Energy A condition of NZ Energy Corp’s acquisition of Origin Energy’s TAWN assets (refer Exhibit 13) is that Origin completed the recommissioning of the Waihapa LPG plant such that it is certified for operation. NZ Energy Corp advised in March that the certification process had been completed.
Copper Moki site NZ Energy Corp During Q412 NZEC installed artificial lift facilities to each of its Copper Moki-1, -2 and -3 discovery wells to stabilise production rates and flatten decline curves.
Puka site Kea Petroleum Drilling operations at Puka-2 were completed during February, with Kea moving to install surface testing equipment, tanks and oil transfer equipment. Encouraging initial flow rates have since been reported and Kea has said that production station design is well advanced.
Source: company announcements, Edison Investment Research
Exhibit 12: Infrastructure build activity – pipelines, H212-Q113 Project Lead Details Cheal-Vector pipeline TAG Oil During CY12 TAG Oil laid a 11km, 6” pipeline connecting its Cheal production station
with Vector’s high pressure open access pipeline. The pipeline complements the expansion project at the Cheal gas plant.
Ahuroa TAWN bypass pipeline
Contact Energy During Q412 Contact commenced construction of a new 9km, 18” (450mm) pipeline to connect its Ahuroa gas storage facility with its Stratford power station site. The pipeline will bypass the Waihapa gas plant, which in H112 was sold with other TAWN assets by owner (and Contact Energy parent) Origin Energy to NZ Energy Corp. A new delivery point at Stratford capable of handling 170TJ/day (annualised ~62PJ pa) is currently out for tender.
Onaero-Turangi pipeline Greymouth Petroleum
During Q412 Greymouth Petroleum started construction of a 5km pipeline to connect its Onaero-1 discovery well in PEP 38746 to its existing Turangi production station in adjoining PMP 38161. Commissioning is expected during Q213.
Ngatoro pipeline Greymouth Petroleum
Installation of 1.6km pipeline connecting Ngatoro-G wells to Greymouth pipeline gathering network for relay and processing at Ngatoro-A and Kaimiro gas plants. Commissioning expected during Q213.
Source: company announcements, Edison Investment Research

2012-13 New Zealand Petroleum Sector Yearbook | April 2013 Update 20
2.1.4. Corporate activity Executed corporate and asset (Exhibit 14) deals completed since H212 are summarised in Exhibits 13 and 14.
In addition, significant corporate-related news flow since H212 has included: Greymouth Petroleum: on 31 October 2012, the Wall Street Journal reported that TAG Oil had
submitted a NZ$650m “bid” to acquire 100% of Greymouth Petroleum. Following the report TAG moved to play-down speculation, stating that it had only submitted a “non-binding indicative expression of interest (EOI) to potentially acquire the assets of Greymouth or all of, or a majority of, Greymouth shares.” It is unclear whether the EOI was part of a bilateral discussion or was part of a broader process.
Solid Energy: on 21 February 2013, SOE Solid Energy announced that it had entered discussions with its bankers and Treasury (representing its shareholder, the Crown) “on the debt and equity support required for future operations of the business”. Solid Energy is known to have invested substantially in a number of early-stage, high-risk energy start-up businesses, many of which have since been demonstrated as not viable. Projects included separate CSG and UCG projects in the Waikato and Taranaki regions, each supported by major drilling programmes. Pilot projects costing NZ$22m apiece were commissioned during 2012, but have since been prematurely shut as the company has moved to rein-in non-core spending. Both plants are thought likely to be put up for sale as part of an asset divestment and restructuring programme.
Todd Energy: on 28 February, newly incorporated limited partnership South Louisiana Methanol LP (SLM) announced it would build a greenfield 1.8mtpa methanol plant at a site near the Mississippi River in the vicinity of New Orleans. The plant, which is reported to have a capital budget of US$1.3bn, is scheduled to begin construction in Q413 for commissioning in mid-2016. When complete, the plant will be the largest methanol facility in the US. SLM is reported to be a SPV held jointly by Todd and Zero Emission Energy Plant Ltd (ZEEP). ZEEP is a privately-held company based in Austin, Texas, “engaged in the development of world scale projects that upgrade low-value feedstocks into premium fuels and chemicals”. According to ZEEP, “Todd will provide major investment backing for the SLM plant, with the intention of building multiple gas-to-liquids plants in the Gulf Coast Region.” Todd also affirmed its commitment to the region, saying it is interested in funding three further plants in Louisiana over the next 10-15 years.
Exhibit 13: Recent/current E&P corporate M&A activity Target Acquiror Details L&M Energy New Dawn
Energy 23 Oct 2012: then-NZX-listed company L&M Energy (LME) received a A$0.06 per share full takeover offer from New Dawn Energy Ltd, a company owned by LME Chair Geoff Loudon. The offer price was pitched at a 45% premium to its pre-offer trading price. Following receipt of an independent adviser report, LME’s independent directors recommended that shareholders accept the offer. A 90% threshold was reached and in January New Dawn moved to compulsorily acquire the remaining shares. LME was delisted from the NZX on 5 February 2013.
Opunake Hydro TAG Oil 19 Feb 2013: TAG Oil announced it had acquired a 90% stake in independent electricity generator and retailer Opunake Hydro Ltd (OHL). OHL owns a 90-year old 400kW hydro scheme on the Taranaki coast and services a small retail base. TAG is expected to use its OHL investment to support the construction of new gas-fired generating capacity to monetise gas production from its expanded Cheal assets, and to supply electricity to the Cheal production station. With its Cheal expansion project TAG will commission a further 2MW of gas-fired capacity to raise power for onsite use and for export. Depending on existing GSA arrangements and intended utilisation, a gas production base of 10mscf/day could support a significantly higher rate of new generation build, perhaps as much as 100MW. In its application for approval from the Overseas Investment Office, TAG stated its intention to “acquire and install several gas fired generators” to “provide TAG with an additional market for its gas supply”. Purchase price is confidential.
Source: company announcements, Edison Investment Research

2012-13 New Zealand Petroleum Sector Yearbook | April 2013 Update 21
Exhibit 14: Recent/current E&P asset M&A activity Asset Acquiror Details Maari FPSO MV Raroa
Maari JV 14 Nov 2012: the OMV-led Maari JV confirmed its decision to exercise a contractual option to acquire the FPSO Raroa from current owner Tanker Pacific for (according to Maari JV partner Horizon Oil) US$33m. The transfer of ownership is effective from 8 March 2013. The JV has awarded an operations and maintenance contract to specialist oil and gas maritime operator MODEC, on an initial term out to the end of CY17 with options beyond that to extend in two-year increments.
TAWN permit area NZ Energy Corp 26 Mar 2013: NZ Energy Corp provided an update on its proposed acquisition of Origin Energy’s TAWN acreage and the Waihapa production station, which was originally announced in May 2012. After having initially indicated its expectation of completing the acquisition in October, deal and funding complexities have seen NZEC recast to indicate Q213 completion. Of the agreed acquisition price of C$42m, C$5m has been paid as an initial instalment, leaving a balance of C$37m to pay on settlement. With working capital on hand of less than C$17m, there is a current funding gap of at least C$20m. An ongoing 5% overriding royalty is also payable to Origin. NZEC has already completed a 2.5km tie-in pipeline connecting its Copper Moki field to the Waihapa plant.
Source: company announcements, Edison Investment Research
2.2. Below-ground
2.2.1. Recent drilling activity
Exhibit 15: Oil & gas wells drilled, H212 Basin On/offshore Well name Operator Permit Spud date Type Rig Comment Taranaki Offshore MB-04B Shell PML 381012 4/09/12 Production Cudd HW140 From Maui-B
MB-08A Shell PML 381012 11/07/12 Production Cudd HW140 From Maui-B Onshore Cheal A-11 TAG Oil PMP 38156 12/07/12 Exploration Nova-1
Cheal A-12 TAG Oil PMP 38156 3/08/12 Exploration Nova-1 Cheal C-4 TAG Oil PMP 38156 14/06/12 Exploration Nova-1 Mangahewa-07 Todd Energy PMP 38150 30/05/12 Production Ensign Rig 931 Mangahewa-08 Todd Energy PMP 38150 11/08/12 Production Ensign Rig 931 Ngatoro-16 Greymouth Petroleum PMP 38148 6/07/12 Exploration Tiger Drilling #1 Waitapu-1 NZ Energy Corp PEP 51150 18/08/12 Exploration Ensign Rig 919 Waitapu-2 NZ Energy Corp PEP 51150 29/08/12 Exploration Ensign Rig 919 Arakamu-1A NZ Energy Corp PEP 51150 21/12/12 Exploration Ensign Rig 919 Arakamu-2 NZ Energy Corp PEP 51150 27/10/12 Exploration Ensign Rig 919 Cheal B-8 TAG Oil PMP 38156 18/10/12 Exploration Nova-1 Kaimiro-11 ST1 Greymouth Petroleum PMP 38148 26/11/12 Production Tiger Drilling #1 Mangahewa-09 Todd Energy PMP 38150 29/10/12 Production Ensign Rig 931
Great South Onshore Horseshoe-1 Greymouth Petroleum PEP 50122 16/07/12 Exploration Orange Toughy On-to-offshore Source: NZP&M, Edison Investment Research
Offshore With no MODUs having been in NZ waters during 2012, offshore drilling has been confined to that conducted from permanent platforms that service the established Maui (which comprises separate Maui-A and Maui-B platforms) and Maari fields. Despite the absence of MODUs, drilling activity has nonetheless been significant, with major programmes conducted from each of the three platforms.
Exhibit 16: Offshore Taranaki drilling programmes, H212-Q113 Operator Permit Details STOS PML 38012
Maui Maui-A: During Q412 the Archer Emerald super single modular rig was erected on the Maui-A platform to commence a multi-well programme reported by Archer to cost US$45m. The programme, which is targeting bypassed gas within the Maui reservoir system, commenced in January with a shakedown well, following which seven sidetracks are planned. Included is a 6km extended reach well targeting the AD Ihi prospect to the north-west of the platform. Maui-B: During H212 STOS completed a separate NZ$125m programme using a Cudd hydraulic workover unit. The programme saw seven sidetrack wells completed targeting by-passed gas within the Maui-B reservoir. The programme followed a successful >NZ$50m pilot completed during 2010, following which the same Cudd unit was moved to Maui-A to undertake an analogous bypass gas pilot programme.
OMV PMP 38160 Maari
During 2011-12 Maari operator OMV carried out a series of well workovers and interventions, largely in an attempt to remedy ongoing performance issues with downhole electrical pumps. During 2011-12 a total of five well workovers were completed.
Source: Edison Investment Research
2012-13 New Zealand Petroleum Sector Yearbook | April 2013 Update 22
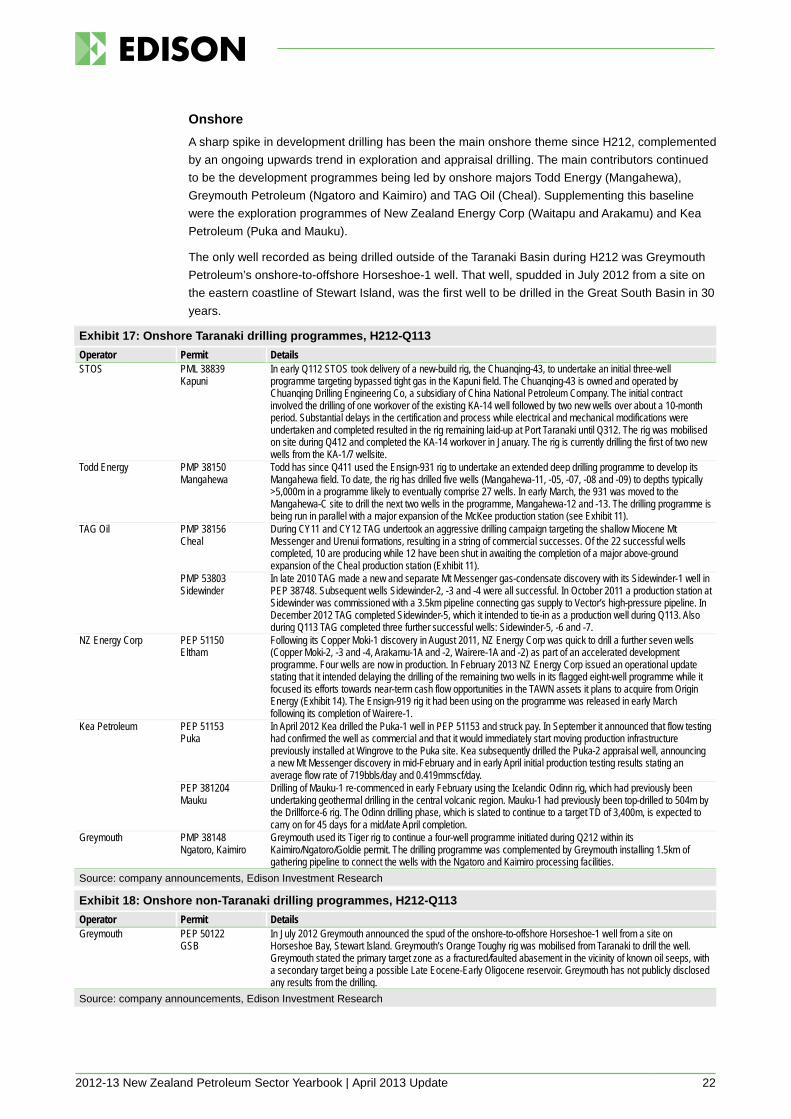
Onshore A sharp spike in development drilling has been the main onshore theme since H212, complemented by an ongoing upwards trend in exploration and appraisal drilling. The main contributors continued to be the development programmes being led by onshore majors Todd Energy (Mangahewa), Greymouth Petroleum (Ngatoro and Kaimiro) and TAG Oil (Cheal). Supplementing this baseline were the exploration programmes of New Zealand Energy Corp (Waitapu and Arakamu) and Kea Petroleum (Puka and Mauku).
The only well recorded as being drilled outside of the Taranaki Basin during H212 was Greymouth Petroleum’s onshore-to-offshore Horseshoe-1 well. That well, spudded in July 2012 from a site on the eastern coastline of Stewart Island, was the first well to be drilled in the Great South Basin in 30 years.
Exhibit 17: Onshore Taranaki drilling programmes, H212-Q113 Operator Permit Details STOS PML 38839
Kapuni In early Q112 STOS took delivery of a new-build rig, the Chuanqing-43, to undertake an initial three-well programme targeting bypassed tight gas in the Kapuni field. The Chuanqing-43 is owned and operated by Chuanqing Drilling Engineering Co, a subsidiary of China National Petroleum Company. The initial contract involved the drilling of one workover of the existing KA-14 well followed by two new wells over about a 10-month period. Substantial delays in the certification and process while electrical and mechanical modifications were undertaken and completed resulted in the rig remaining laid-up at Port Taranaki until Q312. The rig was mobilised on site during Q412 and completed the KA-14 workover in January. The rig is currently drilling the first of two new wells from the KA-1/7 wellsite.
Todd Energy PMP 38150 Mangahewa
Todd has since Q411 used the Ensign-931 rig to undertake an extended deep drilling programme to develop its Mangahewa field. To date, the rig has drilled five wells (Mangahewa-11, -05, -07, -08 and -09) to depths typically >5,000m in a programme likely to eventually comprise 27 wells. In early March, the 931 was moved to the Mangahewa-C site to drill the next two wells in the programme, Mangahewa-12 and -13. The drilling programme is being run in parallel with a major expansion of the McKee production station (see Exhibit 11).
TAG Oil PMP 38156 Cheal
During CY11 and CY12 TAG undertook an aggressive drilling campaign targeting the shallow Miocene Mt Messenger and Urenui formations, resulting in a string of commercial successes. Of the 22 successful wells completed, 10 are producing while 12 have been shut in awaiting the completion of a major above-ground expansion of the Cheal production station (Exhibit 11).
PMP 53803 Sidewinder
In late 2010 TAG made a new and separate Mt Messenger gas-condensate discovery with its Sidewinder-1 well in PEP 38748. Subsequent wells Sidewinder-2, -3 and -4 were all successful. In October 2011 a production station at Sidewinder was commissioned with a 3.5km pipeline connecting gas supply to Vector’s high-pressure pipeline. In December 2012 TAG completed Sidewinder-5, which it intended to tie-in as a production well during Q113. Also during Q113 TAG completed three further successful wells: Sidewinder-5, -6 and -7.
NZ Energy Corp PEP 51150 Eltham
Following its Copper Moki-1 discovery in August 2011, NZ Energy Corp was quick to drill a further seven wells (Copper Moki-2, -3 and -4, Arakamu-1A and -2, Wairere-1A and -2) as part of an accelerated development programme. Four wells are now in production. In February 2013 NZ Energy Corp issued an operational update stating that it intended delaying the drilling of the remaining two wells in its flagged eight-well programme while it focused its efforts towards near-term cash flow opportunities in the TAWN assets it plans to acquire from Origin Energy (Exhibit 14). The Ensign-919 rig it had been using on the programme was released in early March following its completion of Wairere-1.
Kea Petroleum PEP 51153 Puka
In April 2012 Kea drilled the Puka-1 well in PEP 51153 and struck pay. In September it announced that flow testing had confirmed the well as commercial and that it would immediately start moving production infrastructure previously installed at Wingrove to the Puka site. Kea subsequently drilled the Puka-2 appraisal well, announcing a new Mt Messenger discovery in mid-February and in early April initial production testing results stating an average flow rate of 719bbls/day and 0.419mmscf/day.
PEP 381204 Mauku
Drilling of Mauku-1 re-commenced in early February using the Icelandic Odinn rig, which had previously been undertaking geothermal drilling in the central volcanic region. Mauku-1 had previously been top-drilled to 504m by the Drillforce-6 rig. The Odinn drilling phase, which is slated to continue to a target TD of 3,400m, is expected to carry on for 45 days for a mid/late April completion.
Greymouth PMP 38148 Ngatoro, Kaimiro
Greymouth used its Tiger rig to continue a four-well programme initiated during Q212 within its Kaimiro/Ngatoro/Goldie permit. The drilling programme was complemented by Greymouth installing 1.5km of gathering pipeline to connect the wells with the Ngatoro and Kaimiro processing facilities.
Source: company announcements, Edison Investment Research
Exhibit 18: Onshore non-Taranaki drilling programmes, H212-Q113 Operator Permit Details Greymouth PEP 50122
GSB In July 2012 Greymouth announced the spud of the onshore-to-offshore Horseshoe-1 well from a site on Horseshoe Bay, Stewart Island. Greymouth’s Orange Toughy rig was mobilised from Taranaki to drill the well. Greymouth stated the primary target zone as a fractured/faulted abasement in the vicinity of known oil seeps, with a secondary target being a possible Late Eocene-Early Oligocene reservoir. Greymouth has not publicly disclosed any results from the drilling.
Source: company announcements, Edison Investment Research

2012-13 New Zealand Petroleum Sector Yearbook | April 2013 Update 23
2.2.2. Drilling outlook Our drilling outlook analysis integrates work programmes that have either been publicly declared by listed players (typically via stock exchange announcements) or in the case of players that are not listed and tend not to disclose work programmes, our read of signalled drilling intentions. In our analysis we also take into account drilling obligations specified in permit work programmes agreed with NZP&M.
In terms of commitment levels, we distinguish between: 1. Firm wells: committed drilling for which a rig has been confirmed/allocated/contracted; and 2. Contingent wells: near-term drilling that has been indicated but for which a rig has yet to be
confirmed/allocated/contracted.
Exhibit 19: Pending drill-or-drop obligations under NZP&M permit work programmes, CY13 Basin Permit # Permit name Operator Other / JV parties Deadline Wells Type Taranaki Offshore PEP 381203 Ruru STOS OMV, Todd Energy 09-Aug-2013 1 Sidetrack/Deepening
PEP 38479 Awakino South Loyz Energy - 23-Dec-2013 1 Appraisal PEP 51558 Kanuka Todd Energy NZOG 2-Dec-2013 1 Exploration PEP 51906 Matuku OMV Octanex, NZOG 18-Nov-2013 1 Exploration PEP 51311 Kakapo NZOG - 26-Jul-2013 1 Exploration PEP 51313 Te Whatu OMV Todd Energy, Cue, Horizon 29-Jul-2013 1 Exploration
Onshore PMP 38156 Cheal/Cardiff TAG Oil - 25-Dec-2013 1 Appraisal PEP 38614 Solid Energy - 17-Aug-2013 4 Exploration PMP 50509 Moturoa Greymouth Ngati Te Whiti Hapu Society Inc 24-Nov-2013 1 Exploration PEP 51149 Te Kiri Todd Energy Cue 22-Sep-2013 1 Exploration PEP 51150 Eltham NZ Energy Corp - 22-Sep-2013 1 Exploration PEP 51151 Alton NZ Energy Corp L&M Energy 22-Sep-2013 1 Exploration PEP 51152 Midhurst Greymouth - 22-Aug-2013 1 Exploration PEP 51153 Puka Kea - 22-Sep-2013 1 Exploration PEP 51154 Greymouth - 22-Aug-2013 2 Exploration PEP 51155 Beluga, Hickman Kea - 22-Sep-2013 1 Exploration PEP 51156 Waitoriki Todd Energy - 22-May-2013 1 Exploration PEP 53247 Kahili L&M Energy - 14-Jun-2013 1 Appraisal PEP 54873 Heatseeker TAG Oil - 10-Dec-2013 1 Exploration PEP 54876 North Cheal TAG Oil East West 10-Dec-2013 1 Exploration PEP 54877 East Cheal TAG Oil East West 10-Dec-2013 5 Exploration PEP 54879 South Cheal TAG Oil East West 10-Dec-2013 3 Exploration
East Coast Onshore PEP 50940 Nicks Head TAG Oil 02-Dec-2013 1 Exploration PEP 52694 Castlepoint NZ Energy Corp - 23-Nov-2013 1 Exploration
Canterbury Onshore PEP 52589 Canterbury TAG Oil - 09-Nov-2013 1 Exploration Southland Onshore PEP 38226 Waiau L&M Energy - 18-Nov-2013 1 Exploration West Coast Onshore PEP 38512 Ocean Harvest - 25-Sep-2013 1 Exploration
PEP 38517 Solid Energy - 12-Aug-2013 2 Appraisal PEP 50279 Comet Ridge - 6-Apr-2013 1 Appraisal
40 Source: NZP&M, Edison Investment Research
Offshore Our analysis of forward offshore drilling activity suggests a total of 20 firm wells and nine further contingent/probably/possible wells. In the near term, activity is dominated by the Maui life extension programme already underway from the Maui-A platform. Further out into Q313, the Maari drilling programme is expected to commence from the Kan Tan IV semisub and Ensco-107 jackup MODUs, each of which will also undertake additional shorter-term drilling assignments for other JVs targeting nearby shallow- to mid-water prospects. Q413 is expected to see the arrival of the Noble Bob Douglas drillship to undertake a two- to three-well Anadarko-led deepwater campaign.
Exhibit 20 provides a well-by-well analysis summarising our read of forward offshore drilling intentions. A graphical presentation can be found in our Map room.

2012-13 New Zealand Petroleum Sector Yearbook | April 2013 Update 24
Exhibit 20: Forward firm offshore well slate Rig Basin Permit # Permit Name Operator Prospect Reservoir/target
formation(s) Timing Count Type
Archer Emerald modular
Taranaki PML 381012 Maui STOS Multiple Eocene, Kapuni C, D, F Sands
2013- 7 N/A
Kan Tan IV semisub
Taranaki PEP 51906 Matuku OMV Matuku Miocene, M2A/Moki/Mangahewa/ F-Sands
Q313 1 Exploration
Taranaki PEP 51313 Te Whatu OMV Whio Miocene, M2A/Moki/Mangahewa
Q313-Q413
1 Exploration
Taranaki PMP 38160 Maari/Manaia OMV Manaia-2 Miocene, Moki/Mangahewa/F-Sands
Q413 1 Appraisal
Taranaki PMP 38158 Tui AWE Pateke-4H Paleocene, Farewell 2014 1 Appraisal Taranaki PMP 38158 Tui AWE Oi Paleocene, Farewell 2014 1 Exploration
Ensco-107 jackup
Taranaki PMP 38160 Maari/Manaia OMV Maari Eocene, Mangahewa Q413 1 Production Taranaki PMP 38160 Maari/Manaia OMV Manaia Eocene, Mangahewa 2014 1 Production Taranaki PMP 38160 Maari/Manaia OMV Maari Miocene, Moki 2014 1 Production Taranaki PMP 38160 Maari/Manaia OMV Maari Miocene, Moki 2014 1 Production WI Taranaki PMP 38160 Maari/Manaia OMV Maari South Miocene,
M2A/Moki/Mangahewa/ F-Sands
2014 1 Appraisal
Taranaki PMP 38160 Maari/Manaia OMV Maari F-sands Paleocene, Farewell 2014 1 Exploration Noble Bob Douglas drillship
Taranaki PEP 38451 Deepwater Taranaki
Anadarko Deepwater Taranaki
Q413 - Q114
1 Exploration
Canterbury PEP 38264 Carack-Caravel
Anadarko Caravel Q413 - Q114
1 Exploration
20 Source: company announcements, Edison Investment Research
Exhibit 21: Forward contingent/probable/possible offshore well slate Rig Basin Permit # Permit Name Operator Prospect Timing Count Type Noble Bob Douglas Taranaki PEP 38451 Deepwater Taranaki Anadarko Deepwater Taranaki Q412 - Q113 1 Exploration TBD Taranaki PEP 38479 Awakino South Loyz Awakino South Q413 2 Exploration/Appraisal
GSB PEP 50119 Great South Basin Shell GSB 2014-15 1 Exploration Taranaki PEP 51311 Kakapo NZOG Kakapo 2014 1 Exploration Taranaki PEP 51313 Te Whatu OMV Pukeko 2014 1 Exploration Taranaki PEP 51558 Kanuka Todd Kanuka 2014 1 Exploration Taranaki PEP 51906 Matuku OMV Matuku-2 Q313 1 Exploration Taranaki PEP 52181 Kaheru NZOG Kaheru 2014 1 Exploration Taranaki PEP 381203 Ruru STOS Ruru 2013-14 1 Exploration
10 Source: company announcements, Edison Investment Research
Onshore As with offshore, our analysis of signalled onshore drilling intentions points to a period of sustained upswing in drilling activity. Known activity slates are dominated by Todd Energy’s Mangahewa development programme and STOS’s Kapuni life extension programme, each of which are likely to last well into 2014 and probably beyond. Supplementing this are the shallow-oil plays of smaller players TAG Oil, New Zealand Energy Corp, Greymouth Petroleum and Kea Petroleum. Of these, TAG’s programme is by some distance the most ambitious with more than 20 wells planned for CY13. Additional to this are TAG’s deeper Kapuni formation plays, which adds a further three wells to its programme. Although not known, Greymouth Petroleum is also likely to have firm wells committed, however this is not provided for in our summary.
Exhibit 22: Forward firm onshore well slate Rig Basin Permit # Permit Name Operator Prospect Reservoir/target
formation(s) Timing Count Type
Ensign-931 Taranaki PMP 38150 Mangahewa Todd Energy Multiple Eocene, Kapuni Ongoing 5 Appraisal/ Development
Chaunqing-43 Taranaki PML 38839 Kapuni STOS Multiple N/A Ongoing 2 Exploration Icelandic Odinn Taranaki PEP 381204 Mauku Kea Petroleum Mauku-1 Eocene, Mangahewa H113 1 Exploration Webster Nova-1 East Coast PEP 38349 Boar Hill TAG Oil Multiple Multiple H113 2 Exploration Ensign-919 Taranaki PEP 53247 Kahili L&M Energy Kahili Miocene, Tariki Sst H113 1 Exploration 11 Source: company announcements, Edison Investment Research

2012-13 New Zealand Petroleum Sector Yearbook | April 2013 Update 25
Exhibit 23: Forward contingent/probable/possible onshore well slate Basin Permit # Permit name Project Operator Other / JV
parties Timing Count Type
Taranaki PML 38138-41 TAWN TAWN "high priority" programme NZ Energy Corp - H213 5 Exploration PMP 38150 Mangahewa Mangahewa development Todd Energy - Ongoing 18 Development PMP 38151 Rimu Manutahi appraisal/development Origin - 2013-14 5 Appraisal/
Development PMP 38156 Cheal Cardiff deep gas, Kapuni Fm TAG Oil - H213 1 Exploration PML 38839 Kapuni Kapuni development STOS Shell, Todd Ongoing 5 Exploration/
Appraisal PEP 50509 Moturoa Greymouth - H213 1 Exploration PEP 51149 Te Kiri Todd Energy Cue Energy H213 1 Exploration PEP 51151 Alton NZ Energy Corp L&M Energy H213 1 Exploration PEP 51152 Midhurst Greymouth - H213 2 Exploration PEP 51153 Puka Puka-3 Kea Petroleum - H113 1 Appraisal PEP 51154 Greymouth - H213 2 Exploration PEP 51155 Beluga,
Hickman Angus Kea Petroleum H213 1 Exploration
PEP 51156 Waitoriki Todd Energy - H113 1 Exploration PMP 53803 Sidewinder Sidewinder dvpmt programme +
Hellfire deep gas, Kapuni Fm TAG Oil - H213 3 Appraisal/
Development PEP 54873 Heatseeker Deep gas, Kapuni Fm TAG Oil - H213 1 Exploration PEP 54876 North Cheal North Cheal (12TAR3) TAG Oil East West 2013 2 Exploration PEP 54877 East Cheal East Cheal (12TAR4) TAG Oil East West 2013 8 Exploration PEP 54879 South Cheal South Cheal (12TAR5) TAG Oil East West 2013 5 Exploration
East Coast PEP 38342 Ranui East Coast Basin programme NZ Energy Corp - H213 1 Exploration PEP 38348, PEP 38349, PEP 50940
Waitangi Hill Boar Hill Nick’s Head
East Coast Basin programme TAG Oil - H213 2 Exploration
PEP 52694 Castlepoint East Coast Basin programme NZ Energy Corp - H213 1 Exploration Canterbury PEP 52589 TAG Oil - H213 1 Exploration Southland PEP 38226 Waiau Ohai CSG programme L&M Energy - H213 1 Exploration West Coast PEP 38512 West Coast CSG Ocean Harvest - H213 1 Exploration 70 Source: company announcements, Edison Investment Research
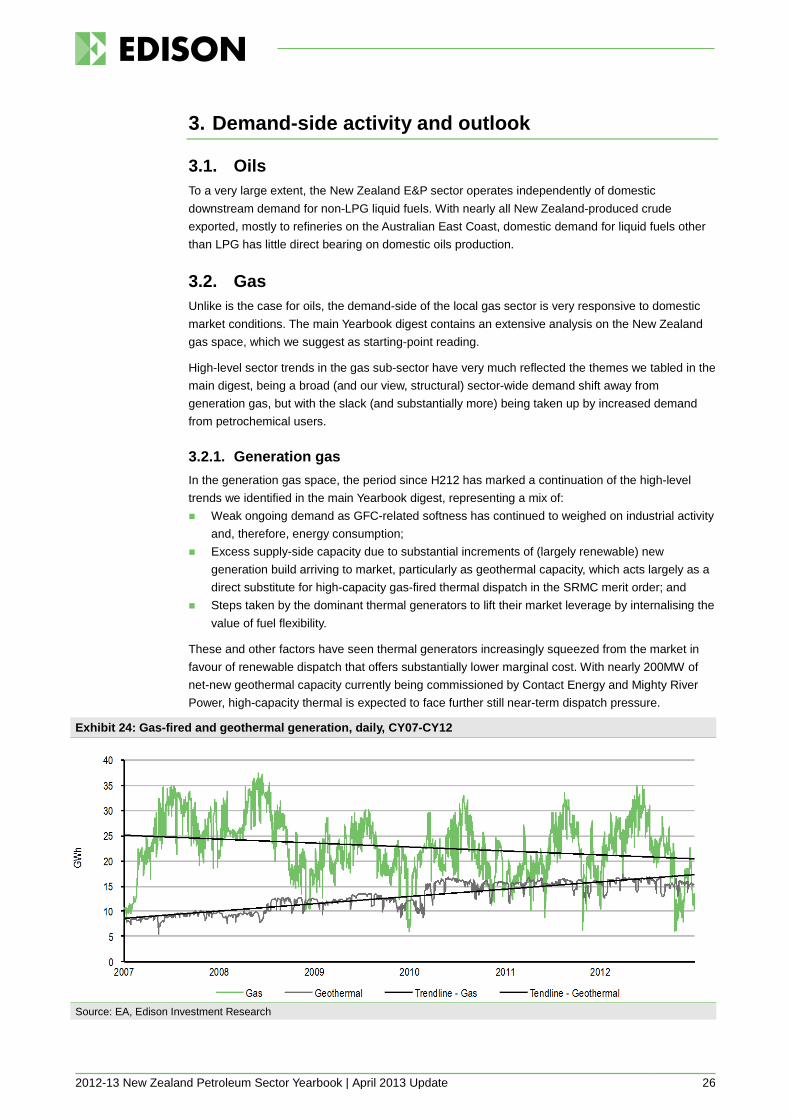
2012-13 New Zealand Petroleum Sector Yearbook | April 2013 Update 26
3. Demand-side activity and outlook
3.1. Oils To a very large extent, the New Zealand E&P sector operates independently of domestic downstream demand for non-LPG liquid fuels. With nearly all New Zealand-produced crude exported, mostly to refineries on the Australian East Coast, domestic demand for liquid fuels other than LPG has little direct bearing on domestic oils production.
3.2. Gas Unlike is the case for oils, the demand-side of the local gas sector is very responsive to domestic market conditions. The main Yearbook digest contains an extensive analysis on the New Zealand gas space, which we suggest as starting-point reading.
High-level sector trends in the gas sub-sector have very much reflected the themes we tabled in the main digest, being a broad (and our view, structural) sector-wide demand shift away from generation gas, but with the slack (and substantially more) being taken up by increased demand from petrochemical users.
3.2.1. Generation gas In the generation gas space, the period since H212 has marked a continuation of the high-level trends we identified in the main Yearbook digest, representing a mix of: Weak ongoing demand as GFC-related softness has continued to weighed on industrial activity
and, therefore, energy consumption; Excess supply-side capacity due to substantial increments of (largely renewable) new
generation build arriving to market, particularly as geothermal capacity, which acts largely as a direct substitute for high-capacity gas-fired thermal dispatch in the SRMC merit order; and
Steps taken by the dominant thermal generators to lift their market leverage by internalising the value of fuel flexibility.
These and other factors have seen thermal generators increasingly squeezed from the market in favour of renewable dispatch that offers substantially lower marginal cost. With nearly 200MW of net-new geothermal capacity currently being commissioned by Contact Energy and Mighty River Power, high-capacity thermal is expected to face further still near-term dispatch pressure.
Exhibit 24: Gas-fired and geothermal generation, daily, CY07-CY12
Source: EA, Edison Investment Research

2012-13 New Zealand Petroleum Sector Yearbook | April 2013 Update 27
Exhibit 25: Gas-fired thermal station annualised daily capacity factors, CY08-CY12 Capacity Average annualised daily capacity factor Unit(s) MW 2007 2008 2009 2010 2011 2012 Comment Huntly 1-4 STs 750 49.0% 49.8% 34.9% 29.7% 21.1% 33.0% 250MW into storage Dec-12 Huntly 5 CCGT 385 57.0% 89.3% 85.0% 83.2% 79.5% 74.7% Huntly 6 OCGT 48 30.7% 32.9% 6.7% 3.8% 5.4% 10.0% Otahuhu-B CCGT 400 77.6% 65.3% 51.7% 51.5% 54.8% 47.7% TCC CCGT 377 67.4% 57.3% 52.0% 54.6% 37.9% 59.9% Stratford OCGTs 200 - - - 1.0% 11.6% 22.1% Commissioned Nov-2010 Te Rapa cogen 44 56.1% 70.8% 54.2% 50.9% 60.2% 56.9% Southdown cogen+OCGT
175 52.9% 60.9% 28.4% 31.7% 25.0% 29.8%
Whareoa cogen 70 25.3% 28.7% 15.7% 15.3% 20.5% 26.8% McKee OCGTs 100 - - - - - 5.9% Commissioned Sept-2012 Glenbrook cogen 112 58.1% 56.3% 53.4% 61.3% 53.2% 58.3% Kapuni cogen 25 65.2% 58.3% 55.2% 52.9% 62.0% 65.1% Kinleith cogen 40 0.0% 75.8% 73.4% 71.3% 67.3% 76.3% Source: EA, company disclosures, Edison Investment Research
Two other factors have served to otherwise offset the broad trend of decline: 1. Fast-start gas-fired peaking capacity: Operators including Todd Energy and Contact Energy
have over the past two to three years each installed significant increments of thermal peaking capacity. This capacity, totaling 300MW, is pitched squarely to run as low- to mid-merit to exploit periods of cyclical wholesale price upswing. Further such capacity has been flagged by operators, with the most significant being a further 100MW Todd Energy installation on a site 7km south of New Plymouth.
2. Hydrology: An alarming fall to hydro inflows in both the North and South Island catchment areas since the start of CY13 saw a sharp drop in hydro system utilisation during Q113. The unavailability of Contact Energy’s TCC CCGT while on scheduled maintenance exacerbated the impact, with the wholesale market responding in delivering with tariffs often above $200/MWh during February and March, compared to the $30-40/MWh at the start of the year. At this level, materially all available generation is in the money, with thermal generators making strong use of peaking capacity over this time. Significantly, utilisation of the 30-year old coal fired Huntly power station increased sharply since the start of March, trending upwards towards 500MW. With stronger gas peaking fuel use but also higher utilisation of Huntly 1-4 to fill what would otherwise be CCGT dispatch, in the current year case the effect of a low hydrology year on aggregate generation gas demand is likely to be relatively modest.
3.2.2. Petrochemical gas By a substantial distance the dominant market player in the petrochemical sector (and, in fact, the entire buy-side of the gas sector) is Methanex. The re-starting of idle capacity by Methanex has been the dominant gas market theme of the past 12-18 months. Significant analysis of Methanex’s New Zealand business is made in Section 4 of the main digest, including in the dedicated Case Analysis “Methanex New Zealand”.
With Methanex having made a string of positive announcements regarding its New Zealand business since mid-CY12, this trend has only accelerated since H212. Major announcements and news flow has included: 17 January 2012: Announced FID on plans to restart the Meth-1 plant, which had been idle
since 2004. Decision was supported by a 10-year GSA with Todd Energy for the supply of gas principally from Todd’s Mangahewa field. Methanex stated that the quantity of gas covered by the GSA to cover “up to half of the 1.5 million tonnes of annual capacity at the Motunui site.”
5 July 2012: Announced the on-time, successful restart of the Meth-1 plant following completion of the EPC stage, at a reported cost of NZ$100m. It is also thought the GSA with Todd Energy commenced from 1 July 2012.

2012-13 New Zealand Petroleum Sector Yearbook | April 2013 Update 28
14 November 2012: Announced it had secured further gas supplies in New Zealand equivalent to “about 2.5 million tonnes of methanol production over the next five years”.
January 2013: Reported Methanex had passed FID on a decision to undertake a five-yearly turnaround project on its existing Meth-2 Motunui plant, at a reported cost of US$60m.
5 March 2013: Announced another GSA and its decision to restart the standalone Waitara Valley plant (~530ktpa) and to undertake a debottlenecking project of its Motunui distillation capacity with the effect of adding a further 200ktpa of capacity at the Motunui site. Both projects are slated for completion late in Q313 at a total capital cost of US$65m. A notable aspect of Methanex’s most recent announcement was the relative bullishness of the language towards gas supply picture: “With the new natural gas supply agreement, combined with the other secured natural gas supply agreements, we now have arrangements in place to underpin production at our three-plant operation in New Zealand for years to come.”
Capacity In restarting all idled capacity and completing distillation debottlenecking at Motunui, Methanex’s New Zealand capacity will rise back to its maximum rated potential of 2.2mtpa. Should planned operating efficiencies be realised from the restart and debottlenecking projects, we consider the potential for theoretical capacity could rise to as much as 2.3-2.4mtpa.
In gas-in equivalent terms, while fuel requirements will ultimately rely on a great many operational variables, we calculate Methanex’s maximum potential gas demand to be as much as 85-90PJ pa, which approximates Methanex’s gas lift when it was last near maximum production in the year 2000.
Fuel position Since the restart of Meth-1 and the commencement of the GSA with Todd Energy, gas deliveries from Mangahewa have been running at ~55TJ/day. At an annualised rate of 20PJ pa, this infers Mangahewa’s above-ground gas plant is running at >95% capacity. An expansion of the Mangahewa production station sanctioned by Todd in mid-2012 (see Exhibit 11) will enable behind-pipe deliverability to be received above-ground and see capacity rise to 45PJ pa (~125TJ/day) by the end of CY13. While Methanex will not receive all of the expected deliverability increment (we estimate Methanex holds entitlement to the first 75-80TJ/day of Mangahewa gas, an annualised equivalent to 27-30PJ pa, with the balance intended to be sold into the wholesale market, principally to related Todd company Nova Energy), what it will likely receive should be sufficient to fuel the equivalent of the Meth-1 plant at high capacity, of 700-800ktpa.
The November announcement did not identify the supplier. We would conclude however that the gas parcel likely involves Shell equity Pohokura gas, covering a supply tranche in the order of 18-20PJ pa.
Methanex’s most recent January announcement again did not disclose the supplier, and was also silent on GSA volumes. We would not be surprised however if the gas involved is Maui ROFR gas offered to but declined by Contact Energy and Vector. If so, the formalisation of supply of further Maui gas beyond 2014 (when ROFR gas previously stretched to) is further positive news for the sector’s supply base. Although no details have been offered on the GSA’s size or term, we consider it likely that this latest tranche would also have involved a parcel in the vicinity of 20PJ pa.
We therefore conclude that by around the time it brings both the Meth-2 plant and the Waitara Valley site back into service during Q412 that Methanex could have more than 70PJ pa (the annualised equivalent of 190TJ/day) already under firm contract. To what extent Methanex may be happy to rest at this level isn’t known (Methanex is likely to want to retain at least some exposure to the shorter market) however what does appear to be the case is that Methanex already has more than three-quarters of its forward maximum fuel needs secured as firm gas.
2012-13 New Zealand Petroleum Sector Yearbook | April 2013 Update 29
Fuel outlook Beyond that gas it has already contracted, Methanex has a number of potential near-term opportunities to procure further gas to enable it to achieve a higher portfolio capacity factor across its three plants. The most tangible and/or advanced of these include: further tranches of Maui ROFR gas declined or onsold by Contact Energy and Vector; further tranches of equity Pohokura gas beyond that already contracted; gas that may become available from other producers (eg Greymouth Turangi and Onaero gas,
NZ Energy Corp Copper Moki gas, KMC Kapuni gas); gas from new exploration plays such as TAG Oil’s deep gas (Cardiff, Hellfire, Heatseeker)
Kapuni formation prospects; and parcels of gas available in the secondary reseller market from net-long primary gas buyers.
In addition, Methanex is participating in the Mauku-1 well, which is currently being drilled by operator Kea Petroleum in PEP381204. If Mauku-1 is a commercial success, Methanex holds rights to acquire all gas under a pre-determined, discounted price structure. An analysis of possible indicative pricing scenarios as they may relate to Mauku-1 gas is undertaken in the main Yearbook digest. Initial results from Mauku-1 should become known during April 2013. Kea has previously stated a P10 resource estimate of 1,031bcf gas and 61mmbbl oil.
3.3. LPG The LPG sector has endured an extended period of decline as price internationalisation in the local market has served to undermine competitiveness during a period of soft local demand for fuel. Complicating this mix was a heady period of price-based competition as new, vertically integrated players (particularly Genesis Energy and Nova Energy) sought to build market share to help manage net-long upstream LPG positions.
The net result was a period of intense competition that served to further erode already low standalone downstream margins. This added significant further pressure to a market that presented as being in long-term structural decline.
More recently, signs have been more positive. LPGA data for CY12 indicated a strong 10.8% recovery in pan-sector sales volumes, lifting the domestic market from 137kt to 152kt. This served to halt five successive years of market decline, during which gross tonnage fell by almost a quarter from 179kt in 2006. Leading the upswing was the bulk LPG market, which grew 7.9kt (20.0%), from 39.5kt to 47.4kt. Also returning strong growth was the 45kg cylinder sector, which rose 5.3kt (9.5%) from 55.8kt to 61.1kt. The 9kg cylinder market also showed good growth, rising 3.1kt (15.5%) from 20.2kt to 23.4kt. The automotive market was the only segment to register a fall in volumes, dropping a further 13.0% to reach 8.1kt.
The up-tick in sector metrics is also reflected in those of market leader Rockgas. In the main digest we undertook a detailed analysis of Contact Energy LPG subsidiary Rockgas. Although we drew into heavy question the valuation of the business compared to its carrying value, we noted early signs of KPI stabilisation. Contact Energy’s H113 result confirmed this, showing 5.1% and 4.6% increases to LPG sales volumes and customer numbers respectively over H112. Despite this, margins continue to remain under pressure as higher purchase costs were not able to be passed fully through.
Comments from Contact Energy reinforce those seen from other LPG players, being that most growth is coming from the bulk supply and 45kg segments, included in which are significant demand upticks from the Christchurch area as reticulated networks are restored and I&C contracts secured.

2012-13 New Zealand Petroleum Sector Yearbook | April 2013 Update 30
Exhibit 26: NZ LPG market, CY00-CY12 Exhibit 27: NZ LPG market mix CY12
Source: LPGA, Edison Investment Research Source: LPGA, Edison Investment Research

2012-13 New Zealand Petroleum Sector Yearbook | April 2013 Update 31
4. NZ data room
Our NZ data room contains summary graphics that serve to plot trends from a broad spectrum of NZ-relevant, macro and micro oil and gas information. Data presented is originated from a mix of official sources, company disclosures and Edison analysis.
Our NZ data room is divided into three sections: 1. Upstream: relating to below- and above-ground assets up to the point that petroleum in its
various sales forms is exported, either in the micro sense (from the production facility) or in the macro sense (out of NZ).
2. Midstream: relating to below- and above-ground assets that serve largely logistical and balancing roles by connecting the upstream (production) sector with the downstream (consumption) sector.
3. Downstream: relating to end-point consumption of oil and gas by customers and users.
4.1. Upstream
4.1.1. Exploration and production
Exhibit 28: NZ oil production, quarterly Exhibit 29: NZ oil production, CY
Source: MBIE, Edison Investment Research Source: MBIE, Edison Investment Research
Exhibit 30: NZ gas production, quarterly Exhibit 31: NZ gas production, CY
Source: MBIE, Edison Investment Research Source: MBIE, Edison Investment Research
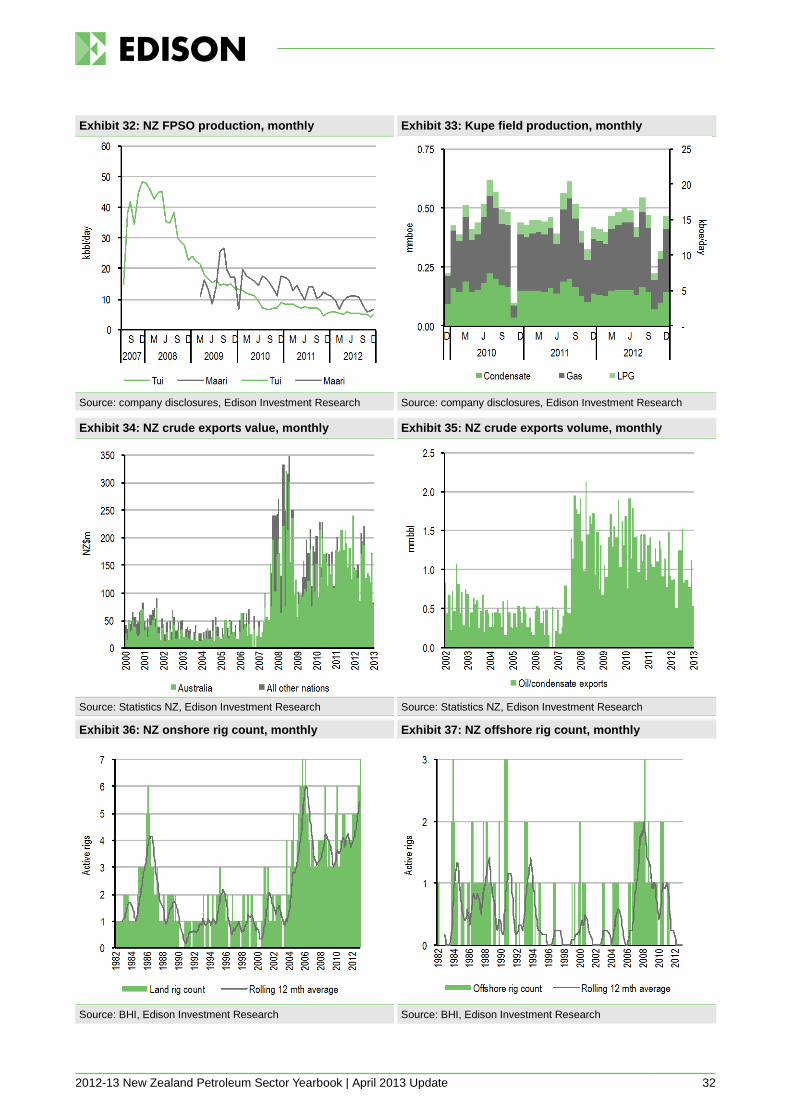
2012-13 New Zealand Petroleum Sector Yearbook | April 2013 Update 32
Exhibit 32: NZ FPSO production, monthly Exhibit 33: Kupe field production, monthly
Source: company disclosures, Edison Investment Research Source: company disclosures, Edison Investment Research
Exhibit 34: NZ crude exports value, monthly Exhibit 35: NZ crude exports volume, monthly
Source: Statistics NZ, Edison Investment Research Source: Statistics NZ, Edison Investment Research
Exhibit 36: NZ onshore rig count, monthly
Exhibit 37: NZ offshore rig count, monthly
Source: BHI, Edison Investment Research Source: BHI, Edison Investment Research
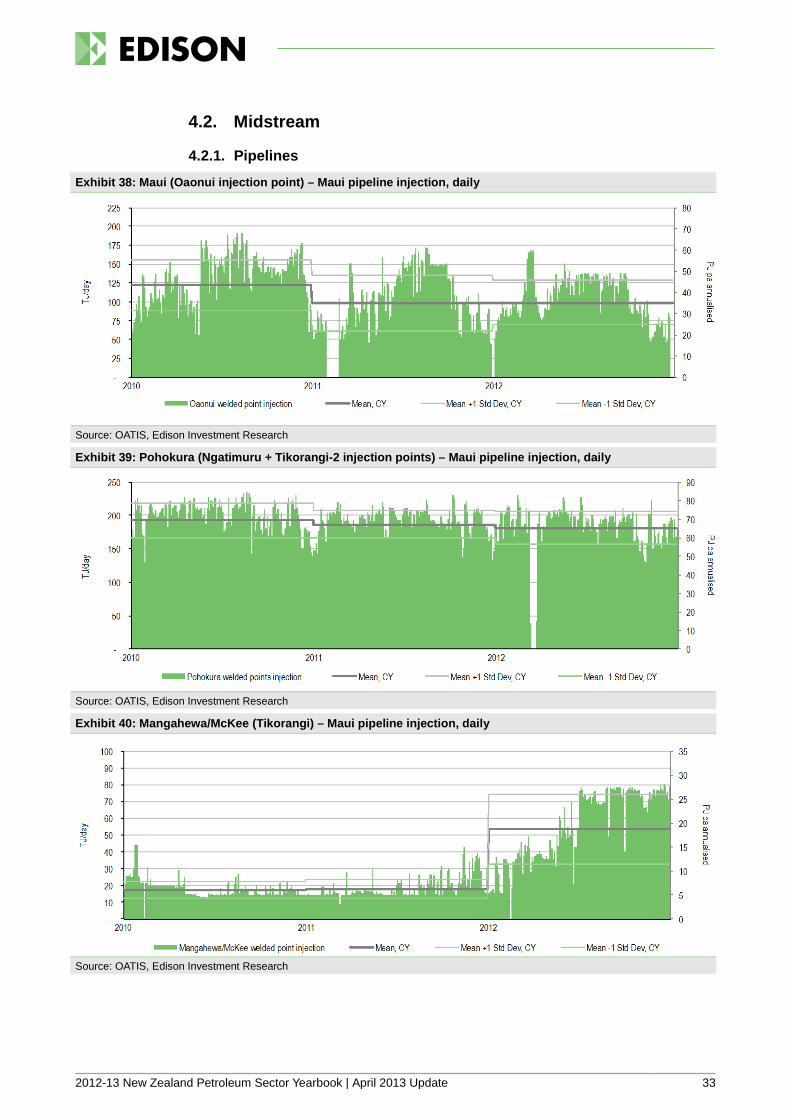
2012-13 New Zealand Petroleum Sector Yearbook | April 2013 Update 33
4.2. Midstream
4.2.1. Pipelines
Exhibit 38: Maui (Oaonui injection point) – Maui pipeline injection, daily
Source: OATIS, Edison Investment Research
Exhibit 39: Pohokura (Ngatimuru + Tikorangi-2 injection points) – Maui pipeline injection, daily
Source: OATIS, Edison Investment Research
Exhibit 40: Mangahewa/McKee (Tikorangi) – Maui pipeline injection, daily
Source: OATIS, Edison Investment Research
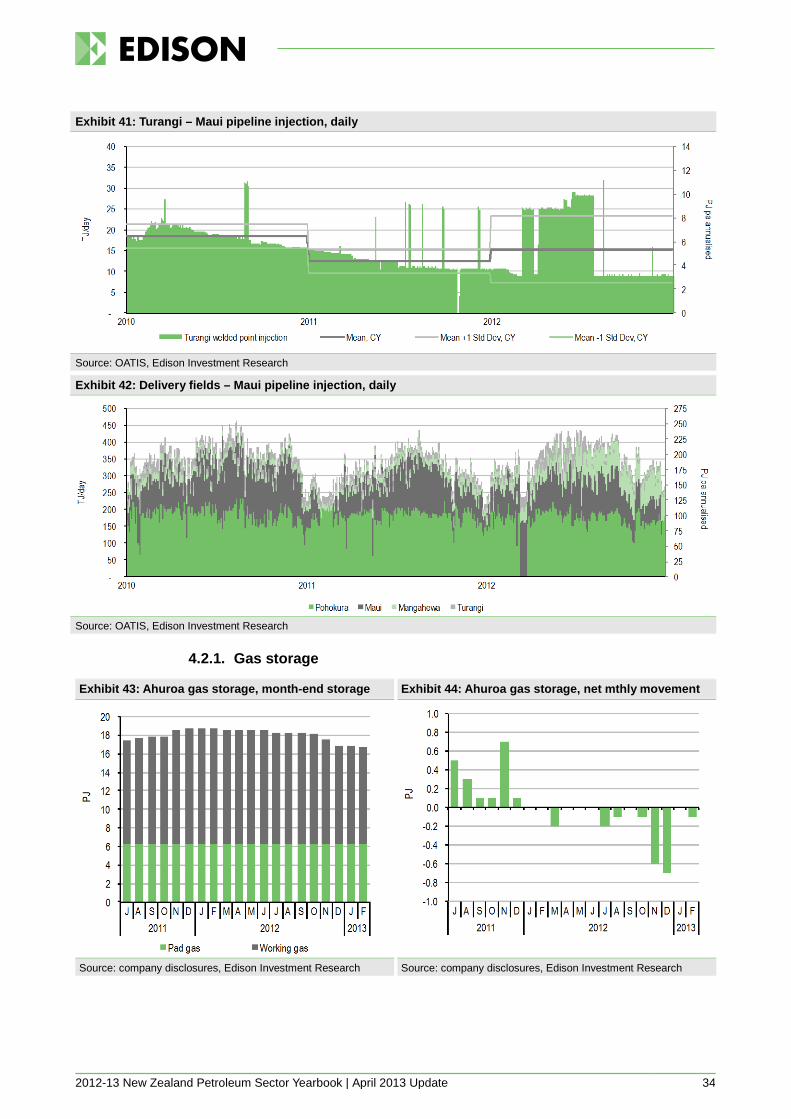
2012-13 New Zealand Petroleum Sector Yearbook | April 2013 Update 34
Exhibit 41: Turangi – Maui pipeline injection, daily
Source: OATIS, Edison Investment Research
Exhibit 42: Delivery fields – Maui pipeline injection, daily
Source: OATIS, Edison Investment Research
4.2.1. Gas storage
Exhibit 43: Ahuroa gas storage, month-end storage Exhibit 44: Ahuroa gas storage, net mthly movement
Source: company disclosures, Edison Investment Research Source: company disclosures, Edison Investment Research

2012-13 New Zealand Petroleum Sector Yearbook | April 2013 Update 35
4.2.2. Generator-retailers
Contact Energy
Exhibit 45: Contact gas deployment, monthly Exhibit 46: Contact gas deployment, FY
Source: company disclosures, Edison Investment Research Source: company disclosures, Edison Investment Research
Exhibit 47: Contact generation mix, monthly Exhibit 48: Contact generation mix, FY
Source: company disclosures, Edison Investment Research Source: company disclosures, Edison Investment Research
Exhibit 49: Contact gas & LPG customers Exhibit 50: Contact average cost of gas
Source: company disclosures, Edison Investment Research Source: company disclosures, Edison Investment Research

2012-13 New Zealand Petroleum Sector Yearbook | April 2013 Update 36
Exhibit 51: Contact retail gas sales, monthly Exhibit 52: Contact retail gas sales, FY
Source: company disclosures, Edison Investment Research Source: company disclosures, Edison Investment Research
Exhibit 53: Contact LPG sales, monthly Exhibit 54: Contact LPG sales, FY
Source: company disclosures, Edison Investment Research Source: company disclosures, Edison Investment Research
Exhibit 55: TCC capacity factor, daily
Source: EA, Edison Investment Research

2012-13 New Zealand Petroleum Sector Yearbook | April 2013 Update 37
Exhibit 56: Otahuhu-B CCGT capacity factor, daily
Source: EA, Edison Investment Research
Exhibit 57: Te Rapa cogen capacity factor, daily
Source: EA, Edison Investment Research
Exhibit 58: Taranaki peakers capacity factor, daily
Source: EA, Edison Investment Research

2012-13 New Zealand Petroleum Sector Yearbook | April 2013 Update 38
Genesis Energy
Exhibit 59: Genesis gas deployment, quarterly Exhibit 60: Genesis gas deployment, FY
Source: company disclosures, Edison Investment Research Source: company disclosures, Edison Investment Research
Exhibit 61: Genesis generation mix, quarterly Exhibit 62: Genesis generation mix, FY
Source: company disclosures, Edison Investment Research Source: company disclosures, Edison Investment Research
Exhibit 63: Genesis Huntly 1-4 fuel burn, qtrly Exhibit 64: Genesis Huntly 1-4 fuel burn, FY
Source: company disclosures, Edison Investment Research Source: company disclosures, Edison Investment Research
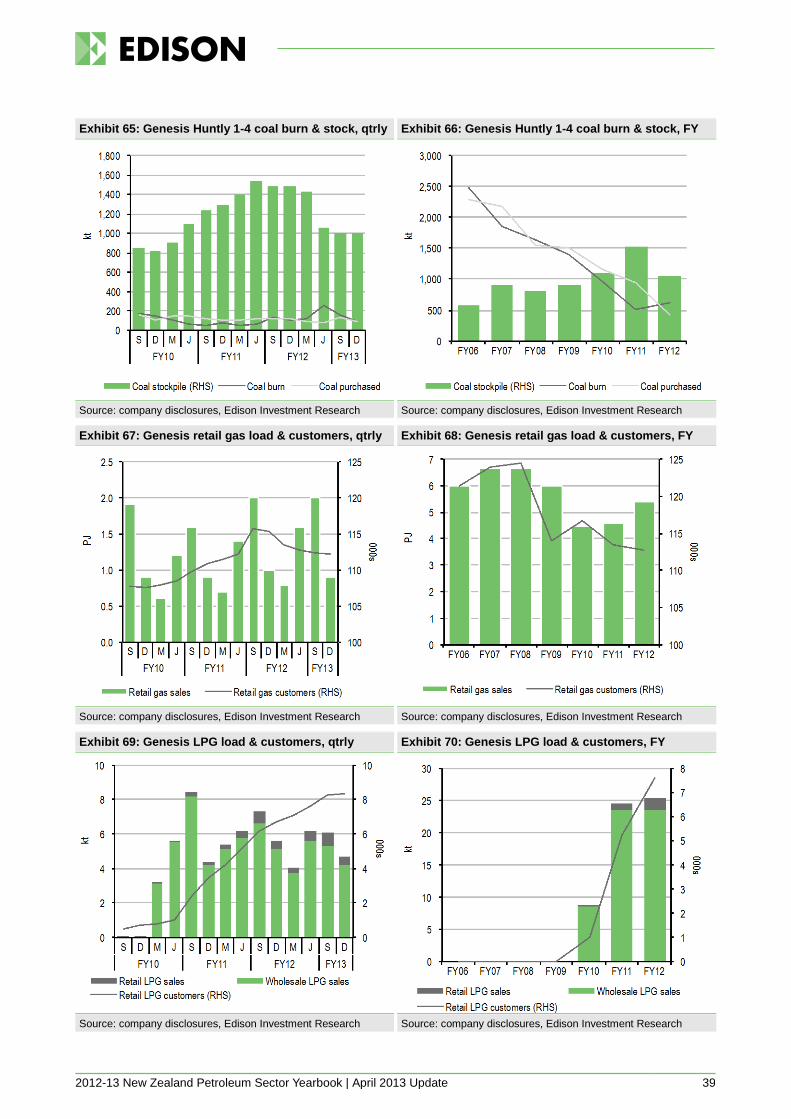
2012-13 New Zealand Petroleum Sector Yearbook | April 2013 Update 39
Exhibit 65: Genesis Huntly 1-4 coal burn & stock, qtrly Exhibit 66: Genesis Huntly 1-4 coal burn & stock, FY
Source: company disclosures, Edison Investment Research Source: company disclosures, Edison Investment Research
Exhibit 67: Genesis retail gas load & customers, qtrly
Exhibit 68: Genesis retail gas load & customers, FY
Source: company disclosures, Edison Investment Research Source: company disclosures, Edison Investment Research
Exhibit 69: Genesis LPG load & customers, qtrly Exhibit 70: Genesis LPG load & customers, FY
Source: company disclosures, Edison Investment Research Source: company disclosures, Edison Investment Research
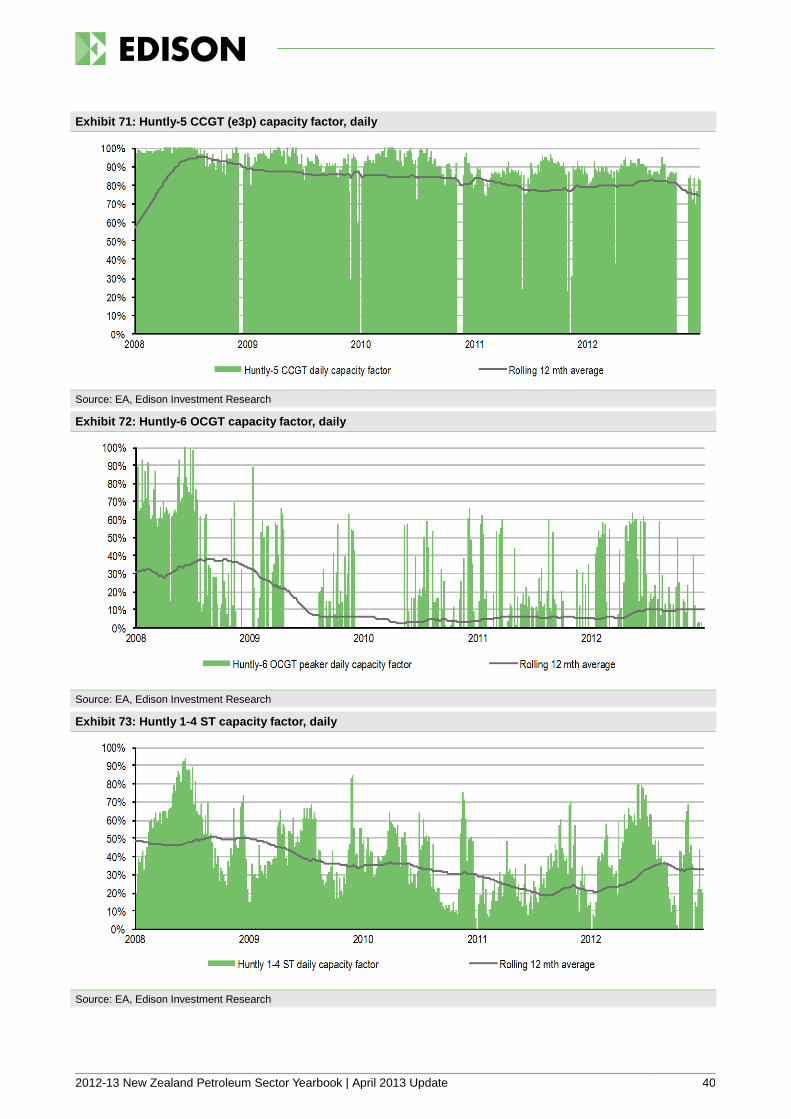
2012-13 New Zealand Petroleum Sector Yearbook | April 2013 Update 40
Exhibit 71: Huntly-5 CCGT (e3p) capacity factor, daily
Source: EA, Edison Investment Research
Exhibit 72: Huntly-6 OCGT capacity factor, daily
Source: EA, Edison Investment Research
Exhibit 73: Huntly 1-4 ST capacity factor, daily
Source: EA, Edison Investment Research
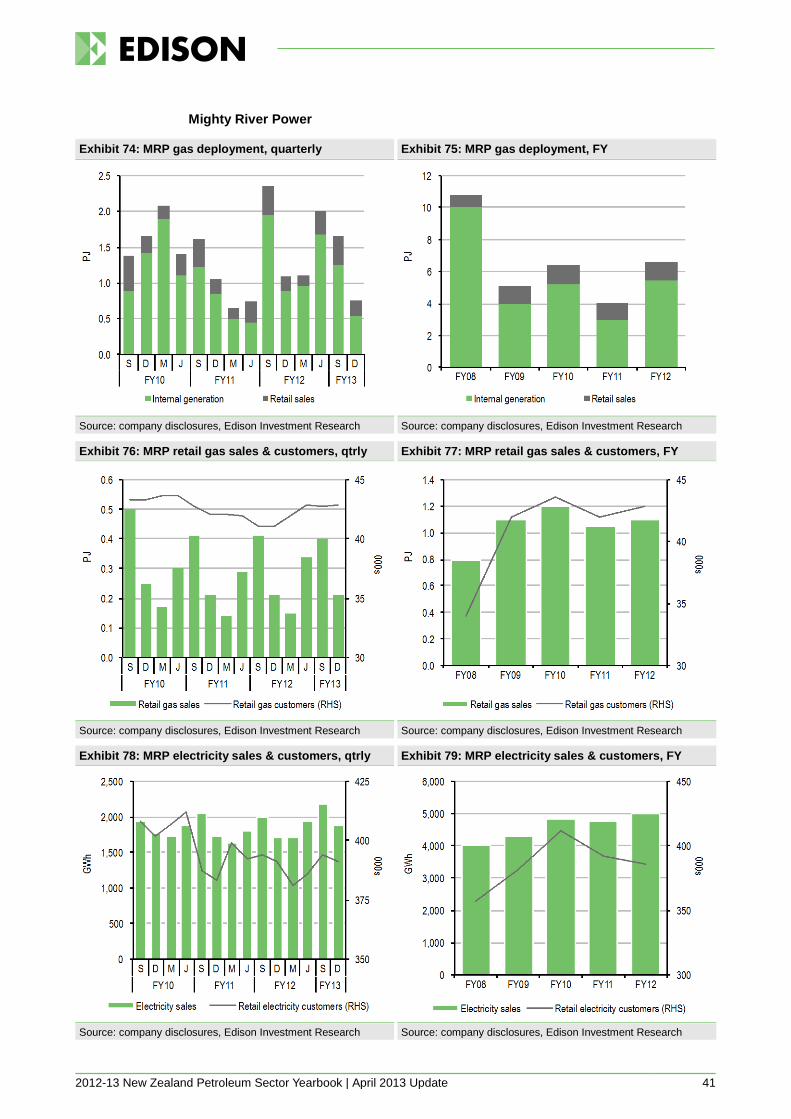
2012-13 New Zealand Petroleum Sector Yearbook | April 2013 Update 41
Mighty River Power
Exhibit 74: MRP gas deployment, quarterly Exhibit 75: MRP gas deployment, FY
Source: company disclosures, Edison Investment Research Source: company disclosures, Edison Investment Research
Exhibit 76: MRP retail gas sales & customers, qtrly Exhibit 77: MRP retail gas sales & customers, FY
Source: company disclosures, Edison Investment Research Source: company disclosures, Edison Investment Research
Exhibit 78: MRP electricity sales & customers, qtrly
Exhibit 79: MRP electricity sales & customers, FY
Source: company disclosures, Edison Investment Research Source: company disclosures, Edison Investment Research
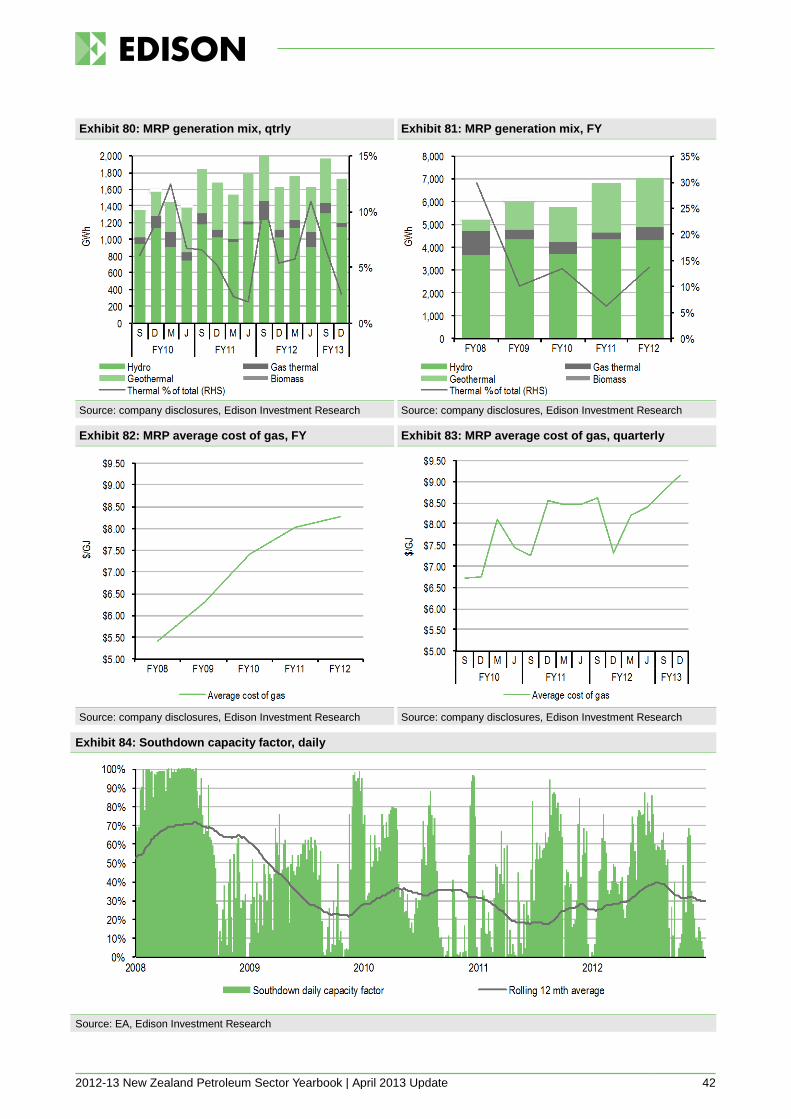
2012-13 New Zealand Petroleum Sector Yearbook | April 2013 Update 42
Exhibit 80: MRP generation mix, qtrly Exhibit 81: MRP generation mix, FY
Source: company disclosures, Edison Investment Research Source: company disclosures, Edison Investment Research
Exhibit 82: MRP average cost of gas, FY Exhibit 83: MRP average cost of gas, quarterly
Source: company disclosures, Edison Investment Research Source: company disclosures, Edison Investment Research
Exhibit 84: Southdown capacity factor, daily
Source: EA, Edison Investment Research

2012-13 New Zealand Petroleum Sector Yearbook | April 2013 Update 43
Nova Energy
Exhibit 85: Nova retail gas customers, quarterly Exhibit 86: Nova retail gas customers, CY
Source: GIC, Edison Investment Research Source: GIC, Edison Investment Research
Exhibit 87: Nova electricity customers, quarterly Exhibit 88: Nova electricity customers, CY
Source: EA, Edison Investment Research Source: EA, Edison Investment Research
Exhibit 89: Nova installed generation
Source: company disclosures, Edison Investment Research
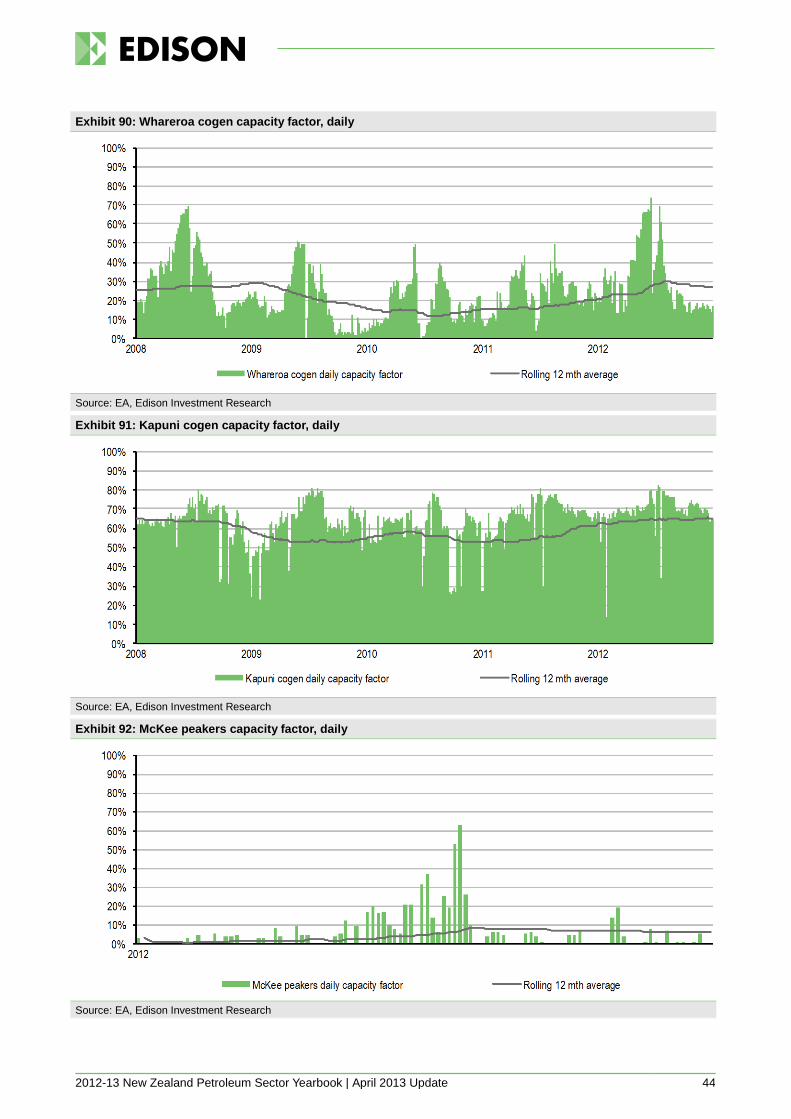
2012-13 New Zealand Petroleum Sector Yearbook | April 2013 Update 44
Exhibit 90: Whareroa cogen capacity factor, daily
Source: EA, Edison Investment Research
Exhibit 91: Kapuni cogen capacity factor, daily
Source: EA, Edison Investment Research
Exhibit 92: McKee peakers capacity factor, daily
Source: EA, Edison Investment Research

2012-13 New Zealand Petroleum Sector Yearbook | April 2013 Update 45
Meridian Energy
Exhibit 93: Meridian retail electricity customers, qtrly Exhibit 94: Meridian retail electricity customers, FY
Source: company disclosures, Edison Investment Research Source: company disclosures, Edison Investment Research
Exhibit 95: Meridian generation mix, qtrly Exhibit 96: Meridian generation mix, FY
Source: company disclosures, Edison Investment Research Source: company disclosures, Edison Investment Research
Exhibit 97: Meridian installed generation
Source: company disclosures, Edison Investment Research

2012-13 New Zealand Petroleum Sector Yearbook | April 2013 Update 46
Trustpower
Exhibit 98: Trustpower electricity customers, quarterly Exhibit 99: Trustpower electricity customers, FY
Source: company disclosures, Edison Investment Research Source: company disclosures, Edison Investment Research
Exhibit 100: Trustpower generation mix, quarterly
Exhibit 101: Trustpower generation mix, FY
Source: company disclosures, Edison Investment Research Source: company disclosures, Edison Investment Research
Exhibit 102: Trustpower installed generation
Source: company disclosures, Edison Investment Research
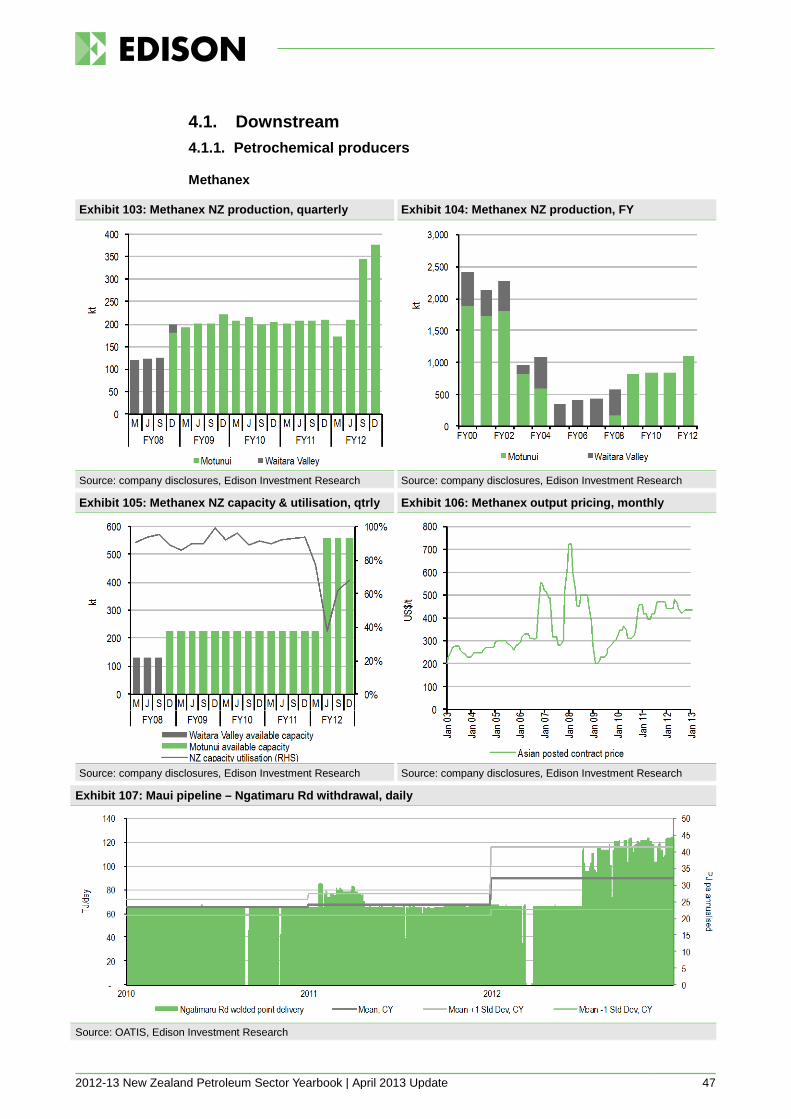
2012-13 New Zealand Petroleum Sector Yearbook | April 2013 Update 47
4.1. Downstream 4.1.1. Petrochemical producers
Methanex
Exhibit 103: Methanex NZ production, quarterly Exhibit 104: Methanex NZ production, FY
Source: company disclosures, Edison Investment Research Source: company disclosures, Edison Investment Research
Exhibit 105: Methanex NZ capacity & utilisation, qtrly
Exhibit 106: Methanex output pricing, monthly
Source: company disclosures, Edison Investment Research Source: company disclosures, Edison Investment Research
Exhibit 107: Maui pipeline – Ngatimaru Rd withdrawal, daily
Source: OATIS, Edison Investment Research
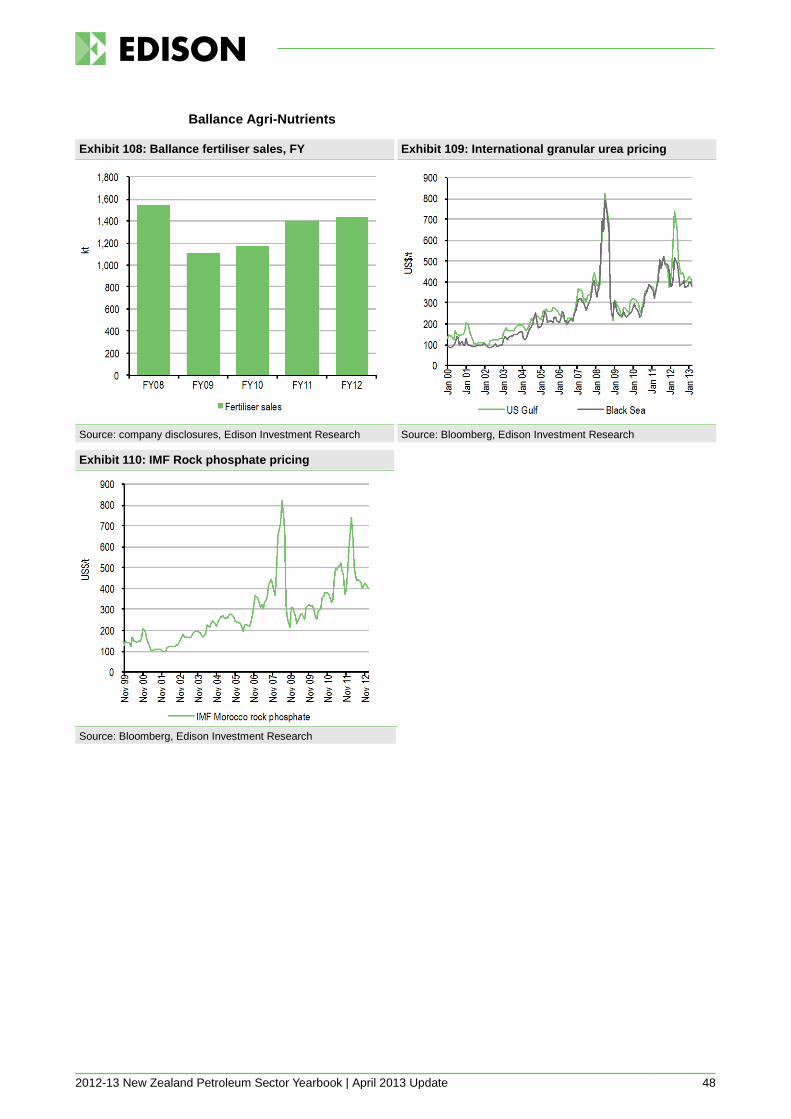
2012-13 New Zealand Petroleum Sector Yearbook | April 2013 Update 48
Ballance Agri-Nutrients
Exhibit 108: Ballance fertiliser sales, FY Exhibit 109: International granular urea pricing
Source: company disclosures, Edison Investment Research Source: Bloomberg, Edison Investment Research
Exhibit 110: IMF Rock phosphate pricing
Source: Bloomberg, Edison Investment Research

2012-13 New Zealand Petroleum Sector Yearbook | April 2013 Update 49
5. Global data room
Our Global data room contains a range of summary graphics plotting trends in data from a broad spectrum of NZ-relevant value drivers. Data is sourced from a mix of official sources, company disclosures and Edison analysis.
5.1. Oils
Exhibit 111: Regional light-sweet crude prices Exhibit 112: Regional light-sweet crude forward curves
Source: Bloomberg, Edison Investment Research Source: Bloomberg, Edison Investment Research
Exhibit 113: BHI global oil/gas rig count, mthly Exhibit 114: BHI global land/offshore rig count, mthly
Source: Baker Hughes, Edison Investment Research Source: Baker Hughes, Edison Investment Research
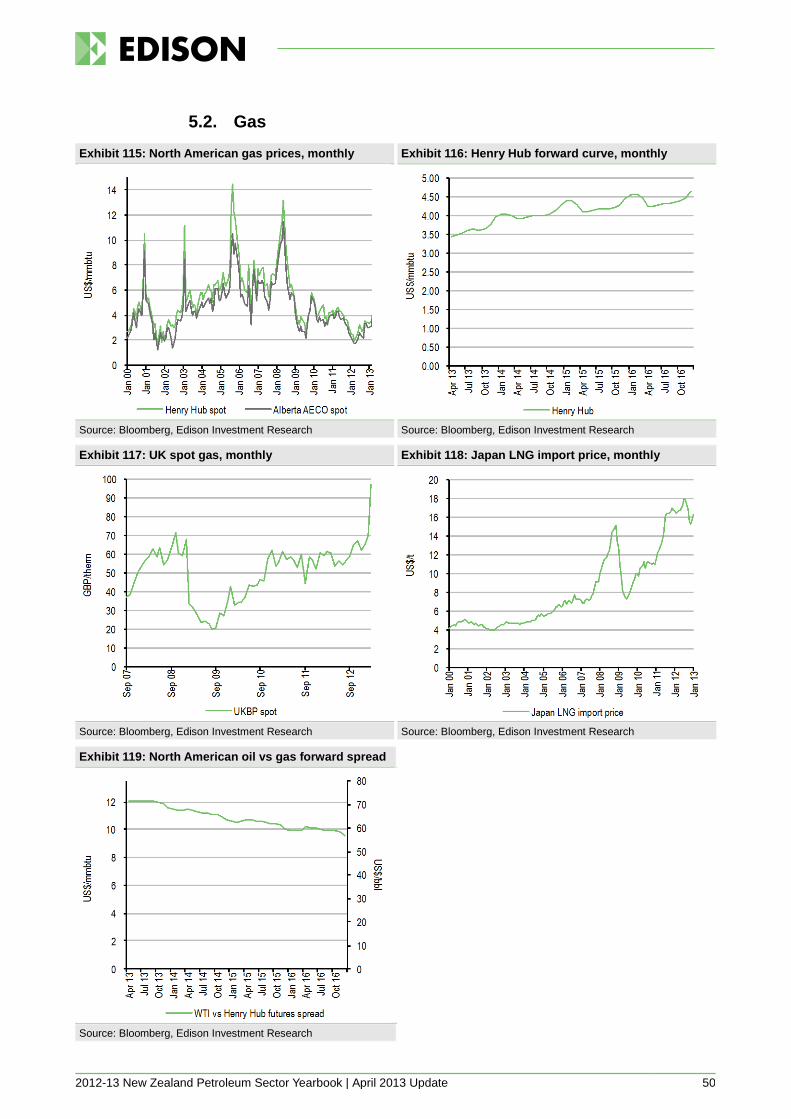
2012-13 New Zealand Petroleum Sector Yearbook | April 2013 Update 50
5.2. Gas
Exhibit 115: North American gas prices, monthly Exhibit 116: Henry Hub forward curve, monthly
Source: Bloomberg, Edison Investment Research Source: Bloomberg, Edison Investment Research
Exhibit 117: UK spot gas, monthly Exhibit 118: Japan LNG import price, monthly
Source: Bloomberg, Edison Investment Research Source: Bloomberg, Edison Investment Research
Exhibit 119: North American oil vs gas forward spread
Source: Bloomberg, Edison Investment Research
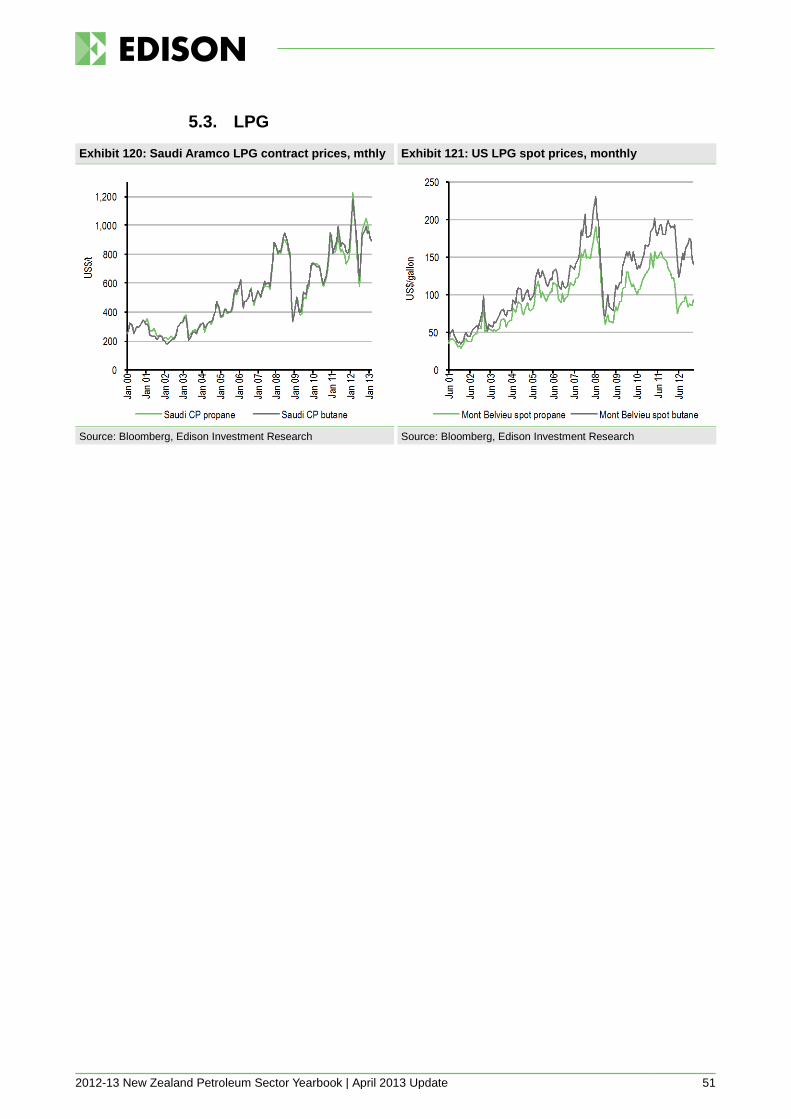
2012-13 New Zealand Petroleum Sector Yearbook | April 2013 Update 51
5.3. LPG
Exhibit 120: Saudi Aramco LPG contract prices, mthly Exhibit 121: US LPG spot prices, monthly
Source: Bloomberg, Edison Investment Research Source: Bloomberg, Edison Investment Research
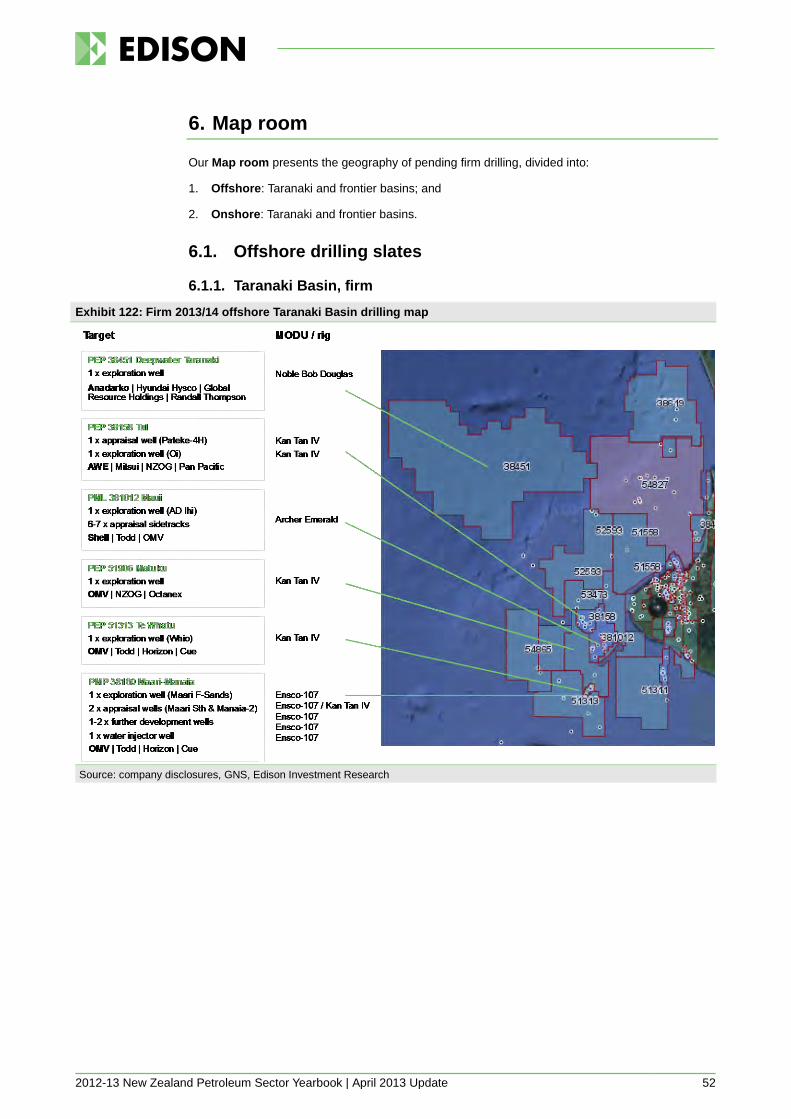
2012-13 New Zealand Petroleum Sector Yearbook | April 2013 Update 52
6. Map room
Our Map room presents the geography of pending firm drilling, divided into:
1. Offshore: Taranaki and frontier basins; and
2. Onshore: Taranaki and frontier basins.
6.1. Offshore drilling slates
6.1.1. Taranaki Basin, firm
Exhibit 122: Firm 2013/14 offshore Taranaki Basin drilling map
Source: company disclosures, GNS, Edison Investment Research

2012-13 New Zealand Petroleum Sector Yearbook | April 2013 Update 53
6.1.2. Frontier basins, firm
Exhibit 123: Firm 2013/14 offshore frontier basin drilling map
Source: company disclosures, GNS, Edison Investment Research
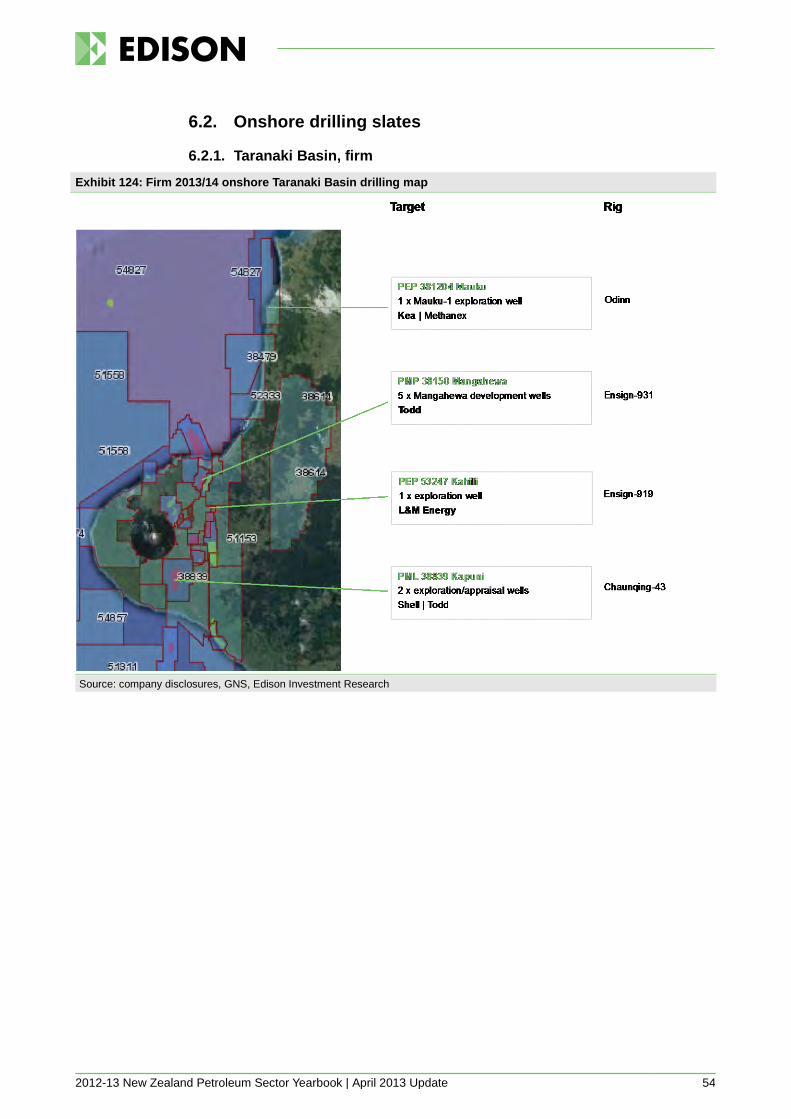
2012-13 New Zealand Petroleum Sector Yearbook | April 2013 Update 54
6.2. Onshore drilling slates
6.2.1. Taranaki Basin, firm
Exhibit 124: Firm 2013/14 onshore Taranaki Basin drilling map
Source: company disclosures, GNS, Edison Investment Research

2012-13 New Zealand Petroleum Sector Yearbook | April 2013 Update 55
6.2.2. Frontier basins, firm
Exhibit 125: Firm 2013/14 onshore frontier basin drilling map
Source: company disclosures, GNS, Edison Investment Research
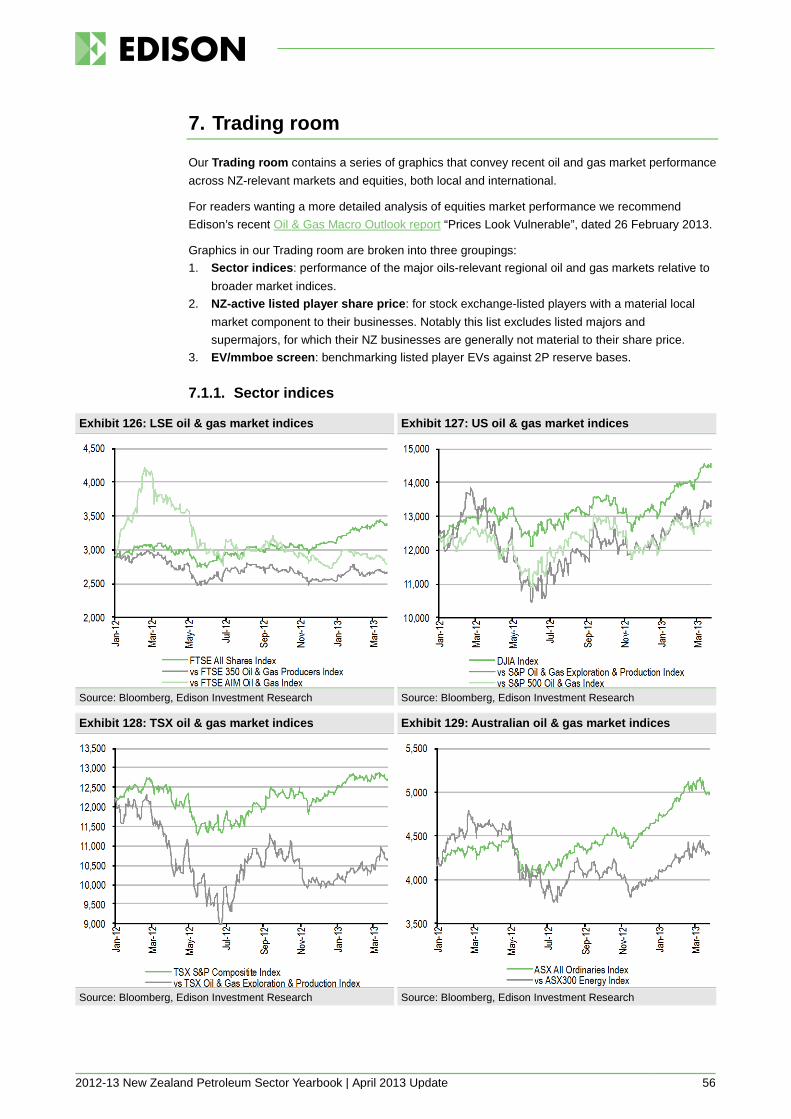
2012-13 New Zealand Petroleum Sector Yearbook | April 2013 Update 56
7. Trading room
Our Trading room contains a series of graphics that convey recent oil and gas market performance across NZ-relevant markets and equities, both local and international.
For readers wanting a more detailed analysis of equities market performance we recommend Edison’s recent Oil & Gas Macro Outlook report “Prices Look Vulnerable”, dated 26 February 2013.
Graphics in our Trading room are broken into three groupings: 1. Sector indices: performance of the major oils-relevant regional oil and gas markets relative to
broader market indices. 2. NZ-active listed player share price: for stock exchange-listed players with a material local
market component to their businesses. Notably this list excludes listed majors and supermajors, for which their NZ businesses are generally not material to their share price.
3. EV/mmboe screen: benchmarking listed player EVs against 2P reserve bases.
7.1.1. Sector indices
Exhibit 126: LSE oil & gas market indices Exhibit 127: US oil & gas market indices
Source: Bloomberg, Edison Investment Research Source: Bloomberg, Edison Investment Research
Exhibit 128: TSX oil & gas market indices Exhibit 129: Australian oil & gas market indices
Source: Bloomberg, Edison Investment Research Source: Bloomberg, Edison Investment Research

2012-13 New Zealand Petroleum Sector Yearbook | April 2013 Update 57
7.1.2. NZ-active listed player share price performance Exhibit 130: AWE Exhibit 131: Beach Petroleum
Source: Bloomberg, Edison Investment Research Source: Bloomberg, Edison Investment Research
Exhibit 132: Comet Ridge Exhibit 133: Cue Energy
Source: Bloomberg, Edison Investment Research Source: Bloomberg, Edison Investment Research
Exhibit 134: East West Petroleum Exhibit 135: Horizon Oil
Source: Bloomberg, Edison Investment Research Source: Bloomberg, Edison Investment Research
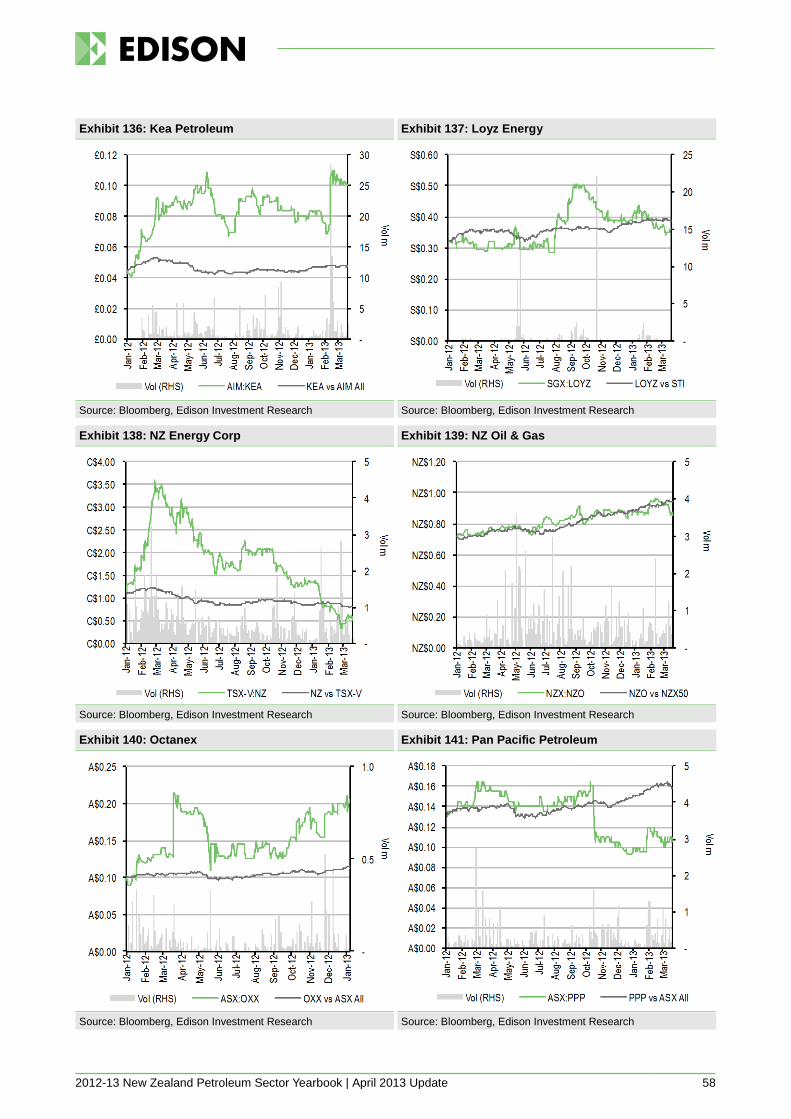
2012-13 New Zealand Petroleum Sector Yearbook | April 2013 Update 58
Exhibit 136: Kea Petroleum Exhibit 137: Loyz Energy
Source: Bloomberg, Edison Investment Research Source: Bloomberg, Edison Investment Research
Exhibit 138: NZ Energy Corp Exhibit 139: NZ Oil & Gas
Source: Bloomberg, Edison Investment Research Source: Bloomberg, Edison Investment Research
Exhibit 140: Octanex Exhibit 141: Pan Pacific Petroleum
Source: Bloomberg, Edison Investment Research Source: Bloomberg, Edison Investment Research
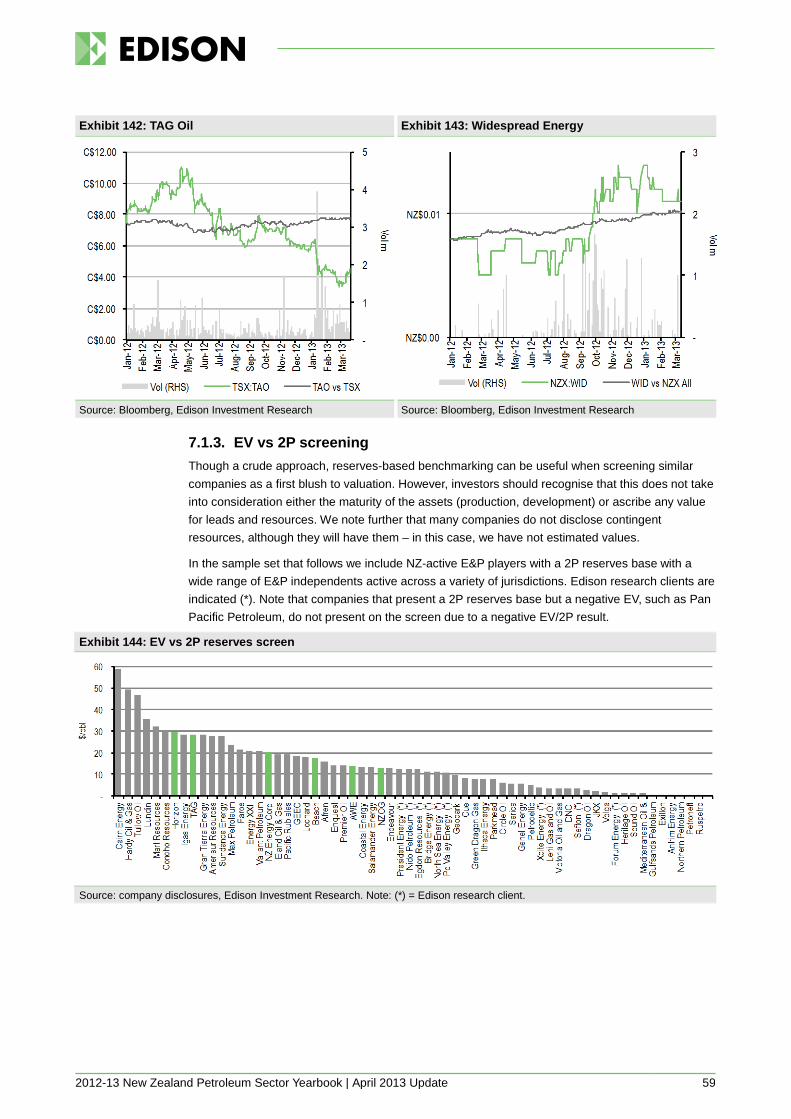
2012-13 New Zealand Petroleum Sector Yearbook | April 2013 Update 59
Exhibit 142: TAG Oil Exhibit 143: Widespread Energy
Source: Bloomberg, Edison Investment Research Source: Bloomberg, Edison Investment Research
7.1.3. EV vs 2P screening Though a crude approach, reserves-based benchmarking can be useful when screening similar companies as a first blush to valuation. However, investors should recognise that this does not take into consideration either the maturity of the assets (production, development) or ascribe any value for leads and resources. We note further that many companies do not disclose contingent resources, although they will have them – in this case, we have not estimated values.
In the sample set that follows we include NZ-active E&P players with a 2P reserves base with a wide range of E&P independents active across a variety of jurisdictions. Edison research clients are indicated (*). Note that companies that present a 2P reserves base but a negative EV, such as Pan Pacific Petroleum, do not present on the screen due to a negative EV/2P result.
Exhibit 144: EV vs 2P reserves screen
Source: company disclosures, Edison Investment Research. Note: (*) = Edison research client.
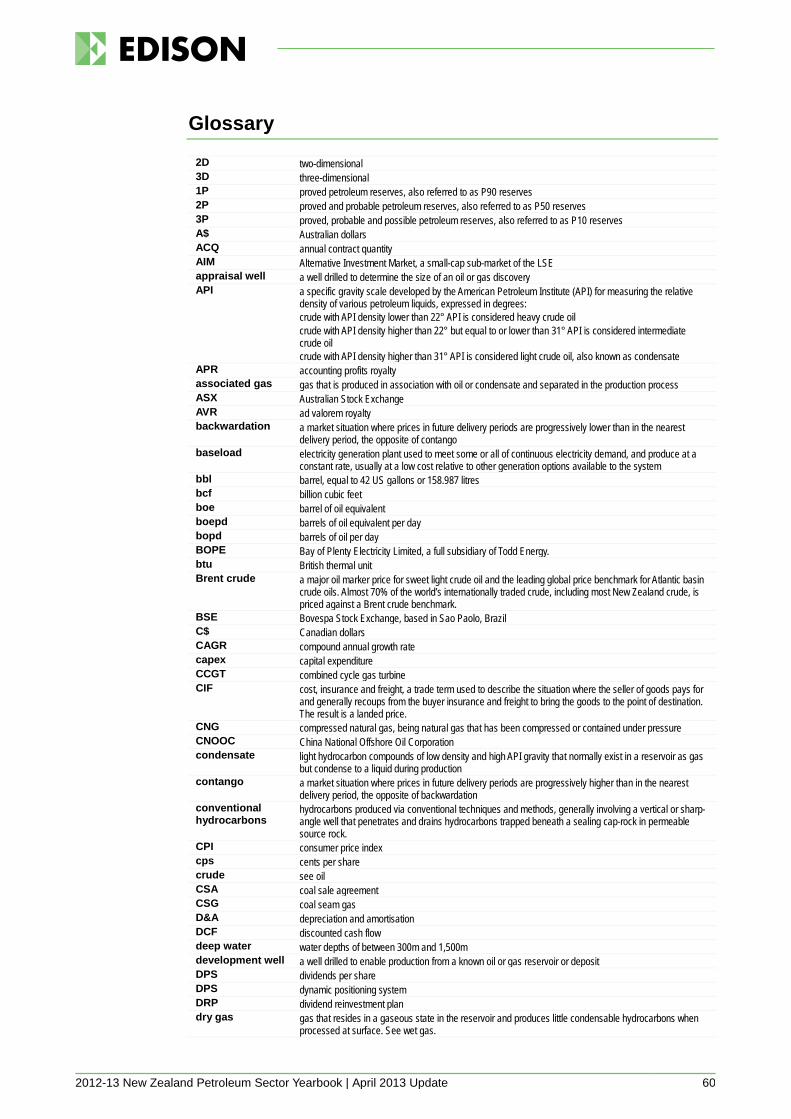
2012-13 New Zealand Petroleum Sector Yearbook | April 2013 Update 60
Glossary
2D two-dimensional 3D three-dimensional 1P proved petroleum reserves, also referred to as P90 reserves 2P proved and probable petroleum reserves, also referred to as P50 reserves 3P proved, probable and possible petroleum reserves, also referred to as P10 reserves A$ Australian dollars ACQ annual contract quantity AIM Alternative Investment Market, a small-cap sub-market of the LSE appraisal well a well drilled to determine the size of an oil or gas discovery API a specific gravity scale developed by the American Petroleum Institute (API) for measuring the relative
density of various petroleum liquids, expressed in degrees: crude with API density lower than 22° API is considered heavy crude oil crude with API density higher than 22° but equal to or lower than 31° API is considered intermediate crude oil crude with API density higher than 31° API is considered light crude oil, also known as condensate
APR accounting profits royalty associated gas gas that is produced in association with oil or condensate and separated in the production process ASX Australian Stock Exchange AVR ad valorem royalty backwardation a market situation where prices in future delivery periods are progressively lower than in the nearest
delivery period, the opposite of contango baseload electricity generation plant used to meet some or all of continuous electricity demand, and produce at a
constant rate, usually at a low cost relative to other generation options available to the system bbl barrel, equal to 42 US gallons or 158.987 litres bcf billion cubic feet boe barrel of oil equivalent boepd barrels of oil equivalent per day bopd barrels of oil per day BOPE Bay of Plenty Electricity Limited, a full subsidiary of Todd Energy. btu British thermal unit Brent crude a major oil marker price for sweet light crude oil and the leading global price benchmark for Atlantic basin
crude oils. Almost 70% of the world’s internationally traded crude, including most New Zealand crude, is priced against a Brent crude benchmark.
BSE Bovespa Stock Exchange, based in Sao Paolo, Brazil C$ Canadian dollars CAGR compound annual growth rate capex capital expenditure CCGT combined cycle gas turbine CIF cost, insurance and freight, a trade term used to describe the situation where the seller of goods pays for
and generally recoups from the buyer insurance and freight to bring the goods to the point of destination. The result is a landed price.
CNG compressed natural gas, being natural gas that has been compressed or contained under pressure CNOOC China National Offshore Oil Corporation condensate light hydrocarbon compounds of low density and high API gravity that normally exist in a reservoir as gas
but condense to a liquid during production contango a market situation where prices in future delivery periods are progressively higher than in the nearest
delivery period, the opposite of backwardation conventional hydrocarbons
hydrocarbons produced via conventional techniques and methods, generally involving a vertical or sharp-angle well that penetrates and drains hydrocarbons trapped beneath a sealing cap-rock in permeable source rock.
CPI consumer price index cps cents per share crude see oil CSA coal sale agreement CSG coal seam gas D&A depreciation and amortisation DCF discounted cash flow deep water water depths of between 300m and 1,500m development well a well drilled to enable production from a known oil or gas reservoir or deposit DPS dividends per share DPS dynamic positioning system DRP dividend reinvestment plan dry gas gas that resides in a gaseous state in the reservoir and produces little condensable hydrocarbons when
processed at surface. See wet gas.

2012-13 New Zealand Petroleum Sector Yearbook | April 2013 Update 61
€ euro EBITDA earnings before interest, tax, depreciation and amortisation EBITDAX earnings before interest, tax, depreciation, amortisation and exploration writeoff ECS Extended Continental Shelf EECA Energy Efficiency and Conservation Authority EEZ Exclusive Economic Zone EIA United States Energy Information Administration EIL Energy Infrastructure Ltd, owner/operator of the Omata tank farm and a full subsidiary of Shell New
Zealand EOR enhanced oil recovery E&P exploration and production EPA Environmental Protection Agency EPC engineer, procure, construct EPJV an incorporated joint venture comprising a 64.86% interest held by Energy Infrastructure Ltd (a 100%
subsidiary of Shell) and 35.14% interest by Petroleum Infrastructure Ltd (a 100% subsidiary of OMV NZ), the primary purpose of which is to own and operate assets related to Shell and OMV’s interests in the Pohokura gas-condensate field
ERL Energy Resources Levy ETS emissions trading scheme EV enterprise value of a listed company, being equal to market capitalisation plus net debt plus preferred
stock exploration well a well drilled seeking new, undiscovered petroleum deposits FCF free cash flows FEED study front end engineering design study, the objective of which is to detail final development design and refine
project costings to facilitate the consideration of a FID FID final investment decision, being the decision point at which a venture’s sponsors give their commitment to
sanction and develop the venture FLNG floating LNG FOB free on board FPSO floating production, storage and offloading vessel fracking fracturing, a reservoir stimulation technique where source rock is artificially fractured by pumping at high
pressure a slurry consisting of >98% water and sand with the intention of increasing permeability of the source rock around the wellbore to support greater well productivity
FSU Former Soviet Union FY financial year gas a naturally occurring hydrocarbon consisting primarily of methane GDP gross domestic product geothermal energy created by converting hot water or steam from beneath the earth GFC Global Financial Crisis GFCF gross fixed capital formation, a macroeconomic measure valuing acquisitions of new or existing fixed
assets by the business sector, governments and households (excluding their unincorporated enterprises) less disposals of fixed assets
GIC Gas Industry Company Ltd, gas industry co-regulatory body responsible for developing industry arrangements to ensure gas is delivered safely, efficiently and reliably
GIP gas in place GJ gigajoule (109 joules) GOM Gulf of Mexico GSA gas sale agreement GST goods and services tax GTL gas-to-liquids GWh gigawatt hour HFO heavy fuel oil ha hectare heat rate a measure of the efficiency of the fuel-to-electricity conversion process expressed in terms of fuel energy
terms required to generate each unit of electrical energy produced, usually measured in GJ per GWh hp horse power HRSG heat recovery steam generator HSE health, safety and environment hydrocarbons an organic compound consisting entirely of hydrogen and carbon, the majority of natural variations of
which occur in crude oil IEA International Energy Agency inshore close to the shoreline. The context in the report refers to depth rating of MODUs; inshore drilling sites do
not require a deepwater capable MODU. IOCs international oil companies IPO initial public offering JORC Australasian Joint Ore Reserves Committee, the JORC Code for Reporting of Mineral Resources and Ore
Reserves is widely accepted as a standard for reporting mineral resources in Australasia

2012-13 New Zealand Petroleum Sector Yearbook | April 2013 Update 62
joule A unit of energy, equal to 1/3600 of a kWh JV joint venture JVA joint venture agreement JVOA joint venture operating agreement KMCs Kapuni mining companies, being Shell and Todd under the 50/50 Kapuni JV km kilometre, equal to 0.621 miles km2 square kilometres KNOC Korea National Oil Company KPI key performance indicator kt thousand tonnes ktpa thousand tonnes per annum kWh kilowatt hour lbs pounds line pack the amount of gas stored in a pipeline between a processing injection point and a sales offtake point, the
level of which can be managed by varying the operating pressure of the pipeline to help manage load fluctuations and anticipated supply constraints
LNG liquefied natural gas LPG liquefied petroleum gas, being mainly propane (C3) or butane (C4) or a mixture of both LRMC long run marginal cost LSE London Stock Exchange m million mmbod million barrels of oil per day mcf million cubic feet MDQ maximum daily quantity MED Ministry of Economic Development MENA Middle East and North Africa methanol methyl alcohol (CH3OH), a colourless liquid produced from natural gas and is the raw material for many
chemicals, formaldehyde, dimethyl terephphalate mmboe million barrels of oil equivalent mmscf million standard cubic feet MMCs Maui mining companies, being Shell, Todd and OMV under the Maui JV MODU mobile offshore drilling unit, more generically known as an offshore oil rig MRP Mighty River Power Limited mt million tonnes mtoe million tonnes of oil equivalent mtpa million tonnes per annum MV maritime vessel MW megawatt (106 watts) market cap market capitalisation, being the market value of a company’s outstanding shares, calculated by multiplying
the number of shares a company has on issue by the current market price of one share mD millidarcys, a measure of the ability of fluids to flow through porous rock. One darcy is equal to the
passage of 1 cubic cm of fluid having a viscosity of 1 centipoise for 1 second under the pressure of 1 atmosphere through a medium having a volume of 1 cubic centimetre. Typical values of permeability range as high as 100,000 darcys for gravel, to less than 0.01 microdarcy for granite. Sand has a permeability of approximately 1 darcy.
MENA Middle East and North Africa natural gas a term most commonly used to describe gas that meets specification standards to be injected into a
pipeline for reticulation to end users. In New Zealand, the specification for reticulated natural gas is set out in national standard NZS 5442.
NGLs natural gas liquids NI 51-101 Canadian National Instrument NI 51-101 which sets out standards for disclosure by listed companies
engaged in oil and gas activities including mandating the disclosure of 2P reserves and allowing the disclosure of other categories of resources by reporting issuers.
NOC national oil company NPAT net profit after tax NPV net present value NTA net tangible assets NYMEX New York Mercantile Exchange, a major trading exchange for commodities futures and options and the
world’s largest commodity exchange NYSE New York Stock Exchange NZAX New Zealand Alternative Exchange, an equity market exchange for smaller companies operated by NZX NZES New Zealand Energy Strategy NZEECS New Zealand Energy Efficiency and Conservation Strategy NZOG New Zealand Oil and Gas Limited

2012-13 New Zealand Petroleum Sector Yearbook | April 2013 Update 63
NZPAM New Zealand Petroleum and Minerals, a division of MED responsible for administering the Crown’s oil, gas, minerals and coal resources
NZSX the main board equity exchange operated by NZX NZX New Zealand Exchange Limited NZX15 index comprising the 15 largest and most liquid securities listed on the NZX NZX50 index comprising the top 50 companies listed on the NZX by free float market cap OATIS Open Access Transmission Information System, the pipeline operation system that facilitates third-party
access to the Maui Pipeline OCGT open cycle gas turbine ODRC optimised depreciated replacement cost ODV optimal deprival value oils a generic term to describe oil products in various forms including crude oil, condensate and naphtha. In
this report the term oil is used interchangeably with condensate and crude. OIP oil in place OPEC Organization of Petroleum Exporting Countries, comprising members Iran, Iraq, Kuwait, Saudi Arabia,
Venezuela, Qatar, Indonesia, Libya, United Arab Emirates, Algeria, Nigeria, Ecuador, Gabon and Angola opex operating expenditure pa per annum payback the length of time required for an investment to ‘repay’ the cost of the original investment out of future
nominal post-tax cash flows PCE Parliamentary Commissioner for the Environment pcp previous corresponding period PEP Petroleum Exploration Permit peaking plant electricity generation plant operated expressly for the purpose of providing electricity into the market
during periods of peak demand, usually at a higher cost relative to other generation options available to the system
Petrobras Petróleo Brasileiro, a Brazilian NOC PIIP petroleum initially in place PIT Priority in Time, a form of exploration licence issued by Crown Minerals PJ petajoule (1015 joules) PMP Petroleum Mining Permit PPI Producers Price Index POS probability of success PS production station PSC production sharing contract PSV project screening value PV present value raw gas gaseous hydrocarbons present in the well stream, before any surface processing or separation takes
place RERR remaining economically recoverable reserves reserves the portion of PIIP that is at a specified date economic to develop and extract under a given set of
technical, commercial and economic assumptions resource the portion of PIIP that is not economic to develop and extract under the same assumption set reservoir rock that is charged with hydrocarbons and both porous and permeable ROACE return on average capital employed ROFR right of first refusal RRR reserve replacement ratio, calculated as the annual change in reserves before deducting production
divided by production in that year scf standard cubic feet SCI Statement of Corporate Intent SOE state-owned enterprise SPE Society of Petroleum Engineers SPP share purchase plan SRMC short run marginal cost STOS Shell Todd Oil Services Ltd supermajors a term commonly used to describe the five largest publicly-owned global E&P companies: BP, Chevron,
ExxonMobil, Royal Dutch Shell and Total SA swing seasonal variability in physical demand from gas purchasers for commercial entitlement from a gas field syngas synthetic gas t tonnes Tapis a Malaysian oil field commonly referenced as a pricing benchmark for light (high API rating) sweet (low
sulphur) crudes and condensates produced in the Asia Pacific region TAWN Tariki, Ahuroa, Waihapa, Ngaere TCC Taranaki Combined Cycle power station owned and operated by Contact Energy
2012-13 New Zealand Petroleum Sector Yearbook | April 2013 Update 64
tcf trillion cubic feet tcfe trillion cubic feet equivalent TD target depth TJ terajoule (1012 joules) toc total organic carbon ToP take or pay tpa tonnes per annum TSE Thailand Stock Exchange, based in Bangkok TSX Toronto Stock Exchange TSX-V Toronto Stock Exchange Venture Exchange, a separate TSX exchange for companies generally
considered of insufficient scale and/or share liquidity for a full TSX listing UCG underground coal gasification UFG unaccounted for gas ultra-deepwater water depths of greater than 1,500m unconventional hydrocarbons
production of in-situ hydrocarbons residing in low permeability source rock that cannot normally be produced from at commercial rates without specialist drilling and/or extraction treatments. Varieties of unconventional hydrocarbon include CSG, UCG, tight gas, shale gas, oil sands and methane hydrates.
URR ultimate recoverable reserves US$ United States dollars VIR value investment ratio VWAP volume weighted average share price WACC weighted average cost of capital wet gas natural gas with a significant NGL component WPI Wholesale Price Index, an official index of wholesale price inflation during the 1970s, renamed in 1978 to
the General Price Index then in 1981 to the PPI. WTI West Texas Intermediate y-o-y year-on-year YTD year-to-date

2012-13 New Zealand Petroleum Sector Yearbook | April 2013 Update 65
Conversions
Oil
Gas
LPG
Volume
1mmbbl of crude equals 6.29 million m3 178.08 bcf 1.00 mmboe 0.15 mtoe 1PJ of crude equals 21.27 kt 1tonne of crude equals 6.85 bbl
1 PJ of gas equals 0.16 mmboe 38.81 million m3 0.91 bcf 947.82 billion btu 1 btu of gas equals 1.055 KJ
1 tonne of LPG equals 11.78 bbl 1.87 m3 49.7 GJ 8.15 boe
1 cubic metre equals 35.31 ft3 1 barrel of oil equals 0.16 m3 5.61 ft3 159 litres

2012-13 New Zealand Petroleum Sector Yearbook | April 2013 Update 66
Edison, the investment intelligence firm, is the future of investor interaction with corporates. Our team of over 100 analysts and investment professionals work with leading companies, fund managers and investment banks worldwide to support their capital markets activity. We provide services to more than 400 retained corporate and investor clients from our offices in London, New York, Berlin, Sydney and Wellington. Edison is authorised and regulated by the Financial Services Authority (www.fsa.gov.uk/register/firmBasicDetails.do?sid=181584). Edison Investment Research (NZ) Limited (Edison NZ) is the New Zealand subsidiary of Edison. Edison NZ is registered on the New Zealand Financial Service Providers Register (FSP number 247505) and is registered to provide wholesale and/or generic financial adviser services only. Edison Investment Research Inc (Edison US) is the US subsidiary of Edison and is not regulated by the Securities and Exchange Commission. Edison Investment Research Limited (Edison Aus) [46085869] is the Australian subsidiary of Edison and is not regulated by the Australian Securities and Investment Commission. Edison Germany is a branch entity of Edison Investment Research Limited [4794244]. www.edisongroup.com DISCLAIMER Copyright 2013 Edison Investment Research Limited. All rights reserved. This report has been prepared and issued by Edison for publication globally. All information used in the publication of this report has been compiled from publicly available sources that are believed to be reliable, however we do not guarantee the accuracy or completeness of this report. Opinions contained in this report represent those of the research department of Edison at the time of publication. The securities described in the Investment Research may not be eligible for sale in all jurisdictions or to certain categories of investors. This research is issued in Australia by Edison Aus and any access to it, is intended only for "wholesale clients" within the meaning of the Australian Corporations Act. The Investment Research is distributed in the United States by Edison US to major US institutional investors only. Edison US is not registered as an investment adviser with the Securities and Exchange Commission. Edison US relies upon the "publishers' exclusion" from the definition of investment adviser under Section 202(a)(11) of the Investment Advisers Act of 1940 and corresponding state securities laws. As such, Edison does not offer or provide personalised advice. We publish information about companies in which we believe our readers may be interested and this information reflects our sincere opinions. The information that we provide or that is derived from our website is not intended to be, and should not be construed in any manner whatsoever as, personalised advice. Also, our website and the information provided by us should not be construed by any subscriber or prospective subscriber as Edison’s solicitation to effect, or attempt to effect, any transaction in a security. The research in this document is intended for New Zealand resident professional financial advisers or brokers (for use in their roles as financial advisers or brokers) and habitual investors who are “wholesale clients” for the purpose of the Financial Advisers Act 2008 (FAA) (as described in sections 5(c) (1)(a), (b) and (c) of the FAA). It is not intended for retail clients. This is not a solicitation or inducement to buy, sell, subscribe, or underwrite any securities mentioned or in the topic of this document. This document is provided for information purposes only and should not be construed as an offer or solicitation for investment in any securities mentioned or in the topic of this document. Edison has a restrictive policy relating to personal dealing. Edison Group does not conduct any investment business and, accordingly, does not itself hold any positions in the securities mentioned in this report. However, the respective directors, officers, employees and contractors of Edison may have a position in any or related securities mentioned in this report. Edison or its affiliates may perform services or solicit business from any of the companies mentioned in this report. The value of securities mentioned in this report can fall as well as rise and are subject to large and sudden swings. In addition it may be difficult or not possible to buy, sell or obtain accurate information about the value of securities mentioned in this report. Past performance is not necessarily a guide to future performance. Forward-looking information or statements in this report contain information that is based on assumptions, forecasts of future results, estimates of amounts not yet determinable, and therefore involve known and unknown risks, uncertainties and other factors which may cause the actual results, performance or achievements of their subject matter to be materially different from current expectations. For the purpose of the FAA, the content of this report is of a general nature, is intended as a source of general information only and is not intended to constitute a recommendation or opinion in relation to acquiring or disposing (including refraining from acquiring or disposing) of securities. The distribution of this document is not a “personalised service” and, to the extent that it contains any financial advice, is intended only as a “class service” provided by Edison within the meaning of the FAA (ie without taking into account the particular financial situation or goals of any person). As such, it should not be relied upon in making an investment decision. To the maximum extent permitted by law, Edison, its affiliates and contractors, and their respective directors, officers and employees will not be liable for any loss or damage arising as a result of reliance being placed on any of the information contained in this report and do not guarantee the returns on investments in the products discussed in this publication. FTSE International Limited (“FTSE”) © FTSE [2013]. “FTSE®” is a trade mark of the London Stock Exchange Group companies and is used by FTSE International Limited under license. All rights in the FTSE indices and/or FTSE ratings vest in FTSE and/or its licensors. Neither FTSE nor its licensors accept any liability for any errors or omissions in the FTSE indices and/or FTSE ratings or underlying data. No further distribution of FTSE Data is permitted without FTSE’s express written consent.

Berlin +49 (0)30 2088 9525 Friedrichstrasse 95 10117 Berlin Germany
London +44 (0)20 3077 5700 280 High Holborn London, WC1V 7EE United Kingdom
New York +1 (0)646 653 7026 245 Park Avenue, 39th Floor 10167, New York United States
Sydney +61 (0)2 9258 1162 Level 33, Australia Square 264 George St, Sydney NSW 2000, Australia
Wellington +64 (0)48 948 555 Level 15, 171 Featherston St Wellington 6011 New Zealand
Edison Investment Research Limited is registered in England. Registered office: 208 High Holborn, London, WC1V 7EE. Company number 4794244. www.edisongroup.com