o n t he e ffect of a n egative r esistence c ircuit bulletin of magnetic resonance o n t he e ffect...
TRANSCRIPT

72 Bulletin of Magnetic Resonance
On The Effect of a Negative Resistence CircuitOn a Nuclear Magnetic Resonance Sample
Valdemar J. Kowalewski
Departamento de FisicaFacultad de Ciencias Exactas
y Naturales, (1428) Buenos Aires, Argentina
Contents
I. Abstract
II. Introduction
III. Experimental
IV. Theoretical
V. Results and Discussion
VI. References
72
72
73
74
78
81
I. Abstract
It was found that a rather simple transistor cir-cuit, in a way similar to a crystal controlled oscilla-tor, can be made to oscillate using a liquid sample ofhydrogeneous material inmersed in a homogeneousmagnetic field as the frequency determining device.The oscillations are intermittent, with a period oftens of seconds, the duration depending on the sam-ple used (tetramethylsilane, benzene, water). It canbe made continuous using a simple AGC (automaticgain control) circuit. Once a certain mechanism ofthe oscillations was assumed Bloch's equations weremodified by the addition of feed-back and pumpingterms. Numerical integration showed that the equa-tions can reproduce well the behavior of the mag-netization vector under the influence of the circuit;its path in space and time; the reason of the inter-mittency; the amount of maser effect amplificationachieved and also, after a further modification, theeffect of the AGC circuit.
II. Introduction
Since the advent of nuclear magnetic resonance(NMR) the technique has been successfully applied,and is currently used for, the measurement and con-trol of magnetic fields (1), taking advantage of thesimple relation between field and frequency:
w = 7 • Bo
For field measurements the resonance, usuallyof a water sample, is detected using a simple auto-dyn detector (2,3) and, having found the resonance,the frequency at which the detector is oscillating ismeasured by some means.
Regenerative detectors of nuclear resonance canoperate by oscillating, either with very low amountof positive feedback or with a very strong feedback.In the first case we deal with a marginal oscillator(2,3) while in the second with a super-regenerativedetector (4), with either self or external quenching

Vol. 13, No. 3/4 73
(1,3,4).Regenerative detectors, adjusted below oscilla-
tion, have been used for some time, in the twen-ties, as radio receivers and later as Q-multipliers,profitting from the negative resistence effect of suchcircuits.
Some attempts were made to build oscillatorsbased on magnetic resonance, where the Larmor fre-quency would give the field directly with a precisionnot reached before. Perhaps the first one was thatof Schmeltzer (3). His device consisted of a crossedcoil probe and a high gain, wide band amplifier, itsinput connected to the Y axis or receiving coil andits output to the X axis or exciting coils of the probe.The system is reported to oscillate, the oscillationbeing started by the Larmor frequency componentof the amplifier noise. Some problems seem to arisedue to phase shifts in the amplifier.
Another attempt of the sort is perhaps the "nu-clear sideband oscillator" (5) used by Varian Asso-ciates in their old series of A-60 spectrometers.
In these devices it is not the resonance itself thatis detected but a sideband of it, produced by themodulation of the static field Bo(6) with an au-diofrequency obtained from the beat between thedetected signal and the transmitter frequency. TheNMR signal is just part of the feedback loop, the nu-clear precesion frequency being given by the sum ordifference of the transmitter and the audiofrequency,depending on which sideband is detected.
We wish to report here a simple circuit which,using a modern low noise transistor, oscillates di-rectly at the Larmor frequency. In principle it of-fers the possibility of measuring magnetic fields witha very high precision but, unfortunately, it has itsdrawbacks. The first one is the need of an intenseand highly homogeneous field. The second is thatthe system is intrinsically unstable. The amplitudeof the oscillations fluctuates or rather pulsates witha period which, according to the sample used, variesbetween 10 and 50 seconds approximately.
At interpretation of the phenomenon was madeassuming, basically, a maser effect (7) and following,at least initially, a path of thought quite similar tothat of Bloembergen and Pound in their work whichwas entitled [improperly according to Abragam (8)]"radiation damping in magnetic resonance experi-ments" (9).
A certain mechanism was assumed, in particu-
lar of the pulsation which was labelled "lighthouseeffect," which led to phenomenological equationswhich, when integrated, showed a very good agree-ment with the experiment. This agreement is themain justification of the proposed equations and ofthe proposed mechanism.
If the relative populations of a pair of atomiclevels can be separated, by any means, from theirequilibrium values then, in principle, a maser effectis possible (7). This separation can be made, basi-cally, by three processes, to wit:
(1) Spatial separation, e.g. ammonia maser, atypical two level maser.
(2) Frequency separation, e.g. lasers, usually ofthree levels.
(3) Time separation, e.g. the free induction de-cay (or FID) of NMR, also a two level system.
Since the mechanism of the devise here reportedimplies changes in the populations of the energy lev-els the device is considered to be a two level maser.
III. Experimental
The circuit used, shown in Figure 1, is quitesimilar to that of a crystal controlled oscillator, thedifference being in the fact that, while in the formerthe circuit is capacitively coupled to the resonat-ing device, in the latter it is inductively couple toa sample of preceding spins. Otherwise the circuitsare similar in the sense that both behave like a neg-ative resistence. While in a three level maser, withexternal pumping, it is explicitely assumed that thecircuit is passive and that the sample provides theenergy necessary to sustain the oscillations (8), inthis circuit it is the sample that is passive with thecircuit being the active element, due to its negativeresistence. Therefore the spins, instead of undergo-ing an induced absorption make an induced emis-sion of energy. The negative resistence circuit effec-tively "sucks" energy from the spins. The systemis "cooled" down (10) and the difference in popula-tions increases.
In the present circuit, like in that of Schmelzer,noise or rather its Larmor frequency component isthe factor initiating the oscillation (11,12) and inthis context spin noise cannot be neglected (13).
In fact the observed phenomenon was not theresult of a purposeful research but a chance dis-covery. The circuit was the preamplifier of a CW
74 Bulletin of Magnetic Resonance
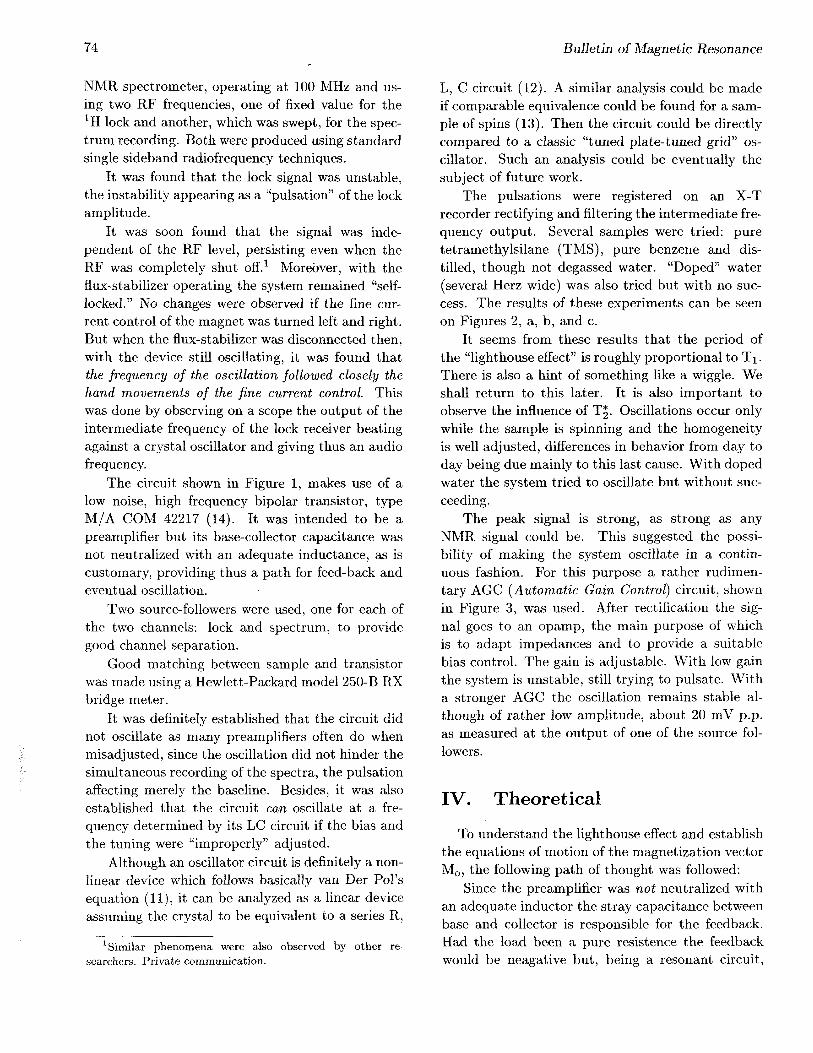
NMR spectrometer, operating at 100 MHz and us-ing two RF frequencies, one of fixed value for theXH lock and another, which was swept, for the spec-trum recording. Both were produced using standardsingle sideband radiofrequency techniques.
It was found that the lock signal was unstable,the instability appearing as a "pulsation" of the lockamplitude.
It was soon found that the signal was inde-pendent of the RF level, persisting even when theRF was completely shut off.1 Moreover, with theflux-stabilizer operating the system remained "self-locked." No changes were observed if the fine cur-rent control of the magnet was turned left and right.But when the flux-stabilizer was disconnected then,with the device still oscillating, it was found thatthe frequency of the oscillation followed closely thehand movements of the fine current control. Thiswas done by observing on a scope the output of theintermediate frequency of the lock receiver beatingagainst a crystal oscillator and giving thus an audiofrequency.
The circuit shown in Figure 1, makes use of alow noise, high frequency bipolar transistor, typeM/A COM 42217 (14), It was intended to be apreamplifier but its base-collector capacitance wasnot neutralized with an adequate inductance, as iscustomary, providing thus a path for feed-back andeventual oscillation.
Two source-followers were used, one for each ofthe two channels: lock and spectrum, to providegood channel separation.
Good matching between sample and transistorwas made using a Hewlett-Packard model 250-B RXbridge meter.
It was definitely established that the circuit didnot oscillate as many preamplifiers often do whenmisadjusted, since the oscillation did not hinder thesimultaneous recording of the spectra, the pulsationaffecting merely the baseline. Besides, it was alsoestablished that the circuit can oscillate at a fre-quency determined by its LC circuit if the bias andthe tuning were "improperly" adjusted.
Although an oscillator circuit is definitely a non-linear device which follows basically van Der Pol'sequation (11), it can be analyzed as a linear deviceassuming the crystal to be equivalent to a series R,
1 Similar phenomena were also observed by other re-searchers. Private communication.
L, C circuit (12). A similar analysis could be madeif comparable equivalence could be found for a sam-ple of spins (13). Then the circuit could be directlycompared to a classic "tuned plate-tuned grid" os-cillator. Such an analysis could be eventually thesubject of future work.
The pulsations were registered on an X-Trecorder rectifying and filtering the intermediate fre-quency output. Several samples were tried: puretetramethylsilane (TMS), pure benzene and dis-tilled, though not degassed water. "Doped" water(several Herz wide) was also tried but with no suc-cess. The results of these experiments can be seenon Figures 2, a, b, and c.
It seems from these results that the period ofthe "lighthouse effect" is roughly proportional to Ti.There is also a hint of something like a wiggle. Weshall return to this later. It is also important toobserve the influence of T^. Oscillations occur onlywhile the sample is spinning and the homogeneityis well adjusted, differences in behavior from day today being due mainly to this last cause. With dopedwater the system tried to oscillate but without suc-ceeding.
The peak signal is strong, as strong as anyNMR signal could be. This suggested the possi-bility of making the system oscillate in a contin-uous fashion. For this purpose a rather rudimen-tary AGC (Automatic Gain Control) circuit, shownin Figure 3, was used. After rectification the sig-nal goes to an opamp, the main purpose of whichis to adapt impedances and to provide a suitablebias control. The gain is adjustable. With low gainthe system is unstable, still trying to pulsate. Witha stronger AGC the oscillation remains stable al-though of rather low amplitude, about 20 mV p.p.as measured at the output of one of the source fol-lowers.
IV. TheoreticalTo understand the lighthouse effect and establish
the equations of motion of the magnetization vectorMo, the following path of thought was followed:
Since the preamplifier was not neutralized withan adequate inductor the stray capacitance betweenbase and collector is responsible for the feedback.Had the load been a pure resistence the feedbackwould be neagative but, being a resonant circuit,
Vol. 13, No. 3/4 75
OR A/2525 V 2 25
a)
b)
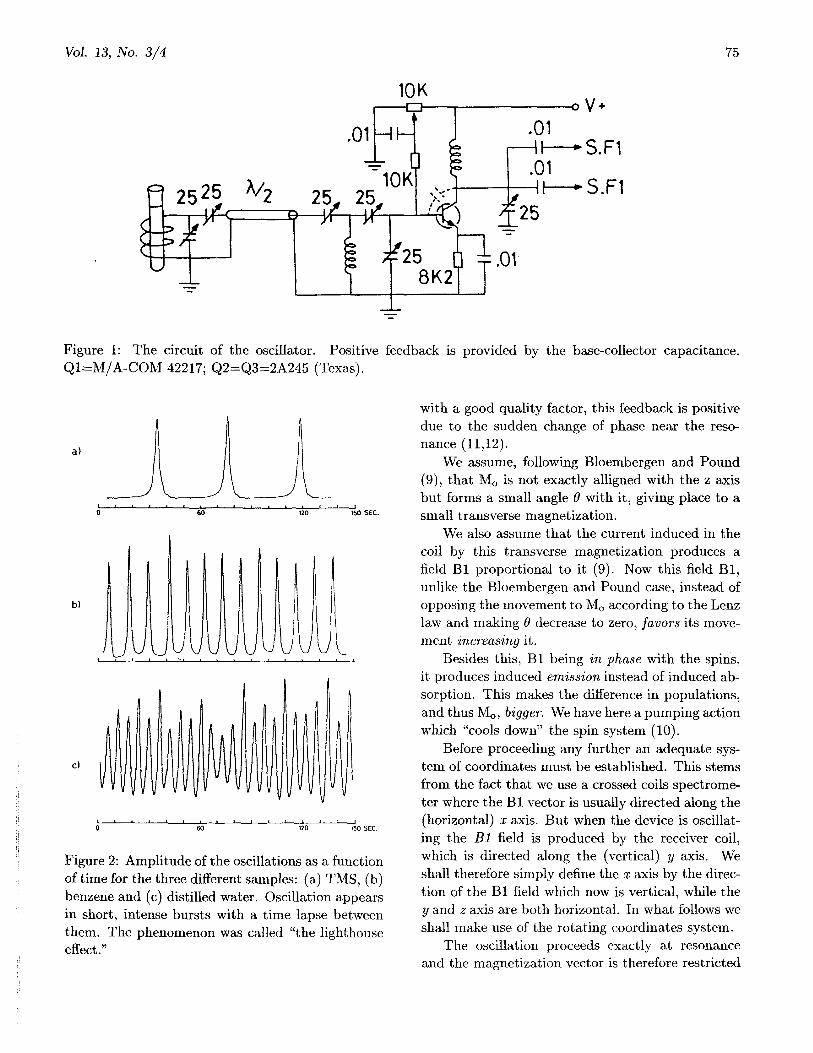
Figure 1: The circuit of the oscillator. Positive feedback is provided by the base-collector capacitance.Q1=M/A-COM 42217; Q2=Q3=2A245 (Texas).
with a good quality factor, this feedback is positivedue to the sudden change of phase near the reso-nance (11,12).
We assume, following Bloembergen and Pound(9), that Mo is not exactly alligned with the z axisbut forms a small angle 9 with it, giving place to asmall transverse magnetization.
We also assume that the current induced in thecoil by this transverse magnetization produces afield Bl proportional to it (9). Now this field Bl,unlike the Bloembergen and Pound case, instead ofopposing the movement to Mo according to the Lenzlaw and making 6 decrease to zero, favors its move-ment increasing it.
Besides this, Bl being in phase with the spins,it produces induced emission instead of induced ab-sorption. This makes the difference in populations,and thus Mo, bigger. We have here a pumping actionwhich "cools down" the spin system (10).
Before proceeding any further an adequate sys-tem of coordinates must be established. This stemsfrom the fact that we use a crossed coils spectrome-ter where the Bl vector is usually directed along the(horizontal) x axis. But when the device is oscillat-ing the Bl field is produced by the receiver coil,which is directed along the (vertical) y axis. Weshall therefore simply define the x axis by the direc-tion of the Bl field which now is vertical, while they and z axis are both horizontal. In what follows weshall make use of the rotating coordinates system.
The oscillation proceeds exactly at resonanceand the magnetization vector is therefore restricted
c)
Figure 2: Amplitude of the oscillations as a functionof time for the three different samples: (a) TMS, (b)benzene and (c) distilled water. Oscillation appearsin short, intense bursts with a time lapse betweenthem. The phenomenon was called "the lighthouseeffect."
76 Bulletin of Magnetic Resonance
0 — i r*13!-IOKCH he6K8
JL ±24KQ ,,
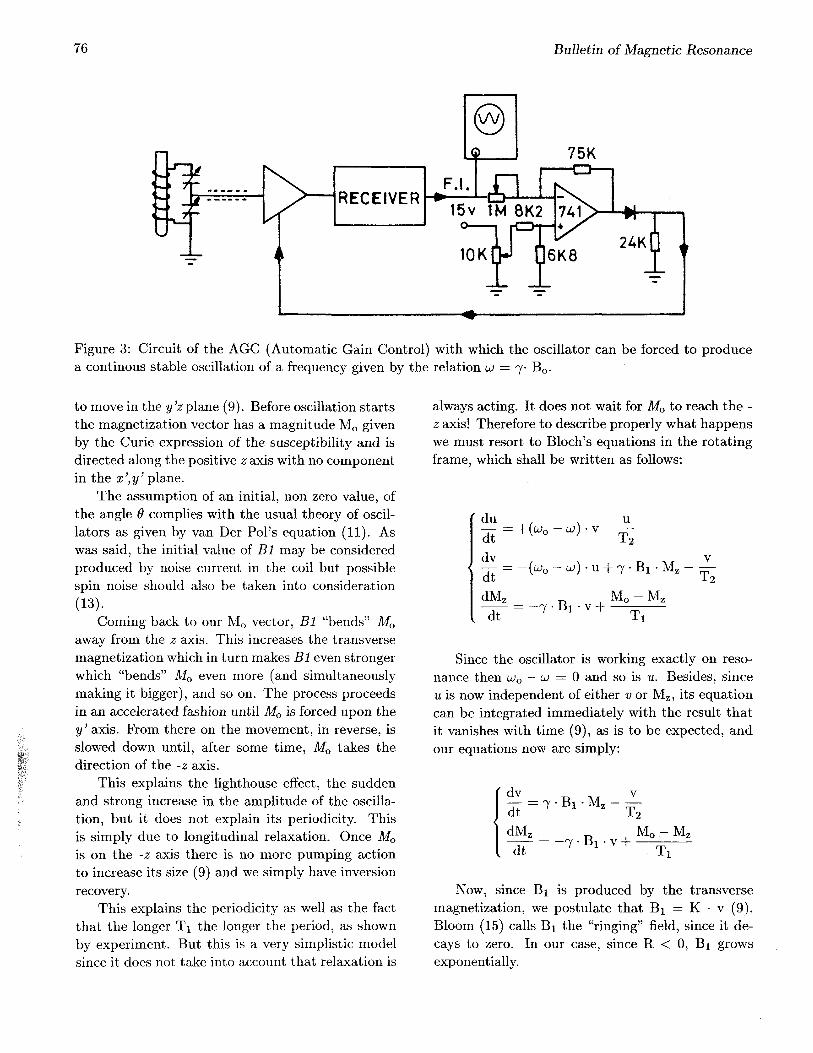
Figure 3: Circuit of the AGC (Automatic Gain Control) with which the oscillator can be forced to producea continous stable oscillation of a frequency given by the relation UJ = j - Bo.
to move in the y'z plane (9). Before oscillation startsthe magnetization vector has a magnitude Mo givenby the Curie expression of the susceptibility and isdirected along the positive z axis with no componentin the x',y' plane.
The assumption of an initial, non zero value, ofthe angle 9 complies with the usual theory of oscil-lators as given by van Der Pol's equation (11). Aswas said, the initial value of Bl may be consideredproduced by noise current in the coil but possiblespin noise should also be taken into consideration(13).
Coming back to our Mo vector, Bl "bends" Mo
away from the z axis. This increases the transversemagnetization which in turn makes Bl even strongerwhich "bends" Mo even more (and simultaneouslymaking it bigger), and so on. The process proceedsin an accelerated fashion until Mo is forced upon they' axis. From there on the movement, in reverse, isslowed down until, after some time, Mo takes thedirection of the -z axis.
This explains the lighthouse effect, the suddenand strong increase in the amplitude of the oscilla-tion, but it does not explain its periodicity. Thisis simply due to longitudinal relaxation. Once Mo
is on the -z axis there is no more pumping actionto increase its size (9) and we simply have inversionrecovery.
This explains the periodicity as well as the factthat the longer Ti the longer the period, as shownby experiment. But this is a very simplistic modelsince it does not take into account that relaxation is
always acting. It does not wait for Mo to reach the -z axis! Therefore to describe properly what happenswe must resort to Bloch's equations in the rotatingframe, which shall be written as follows:
' du
—atdM
u-
= - (u o - u) • u + 7 •
M o - M z
• Mz - —J-2
dt = - 7 - • v T i
Since the oscillator is working exactly on reso-nance then u>o - LU = 0 and so is u. Besides, sinceu is now independent of either v or Mz, its equationcan be integrated immediately with the result thatit vanishes with time (9), as is to be expected, andour equations now are simply:
dv _dt ~dMz
dt
v-
= -7 v + Mo-MzTi
Now, since Bi is produced by the transversemagnetization, we postulate that Bi = K • v (9).Bloom (15) calls Bi the "ringing" field, since it de-cays to zero. In our case, since R < 0, Bi growsexponentially.
Vol. 13, No. 3/4 77
Putting now in our equations Bl = K-v we have:
dv v
dt ' Ti
This is a set of so called "autonomous" equationswhich, except in particular cases, have no analyticalsolution but which can be easily integrated numeri-cally by e.g. Runge-Kutta method. This done, thesolutions show that v, the signal, is a periodic pul-sating function of time which steadily decays to zero.It is evident that a "pumping term" producing thegrowth of Mz, is missing here.
Following a practice common in maser theory aterm like:
Mp-Mz
could be introducted (7). In this expression Mp isthe maximum equilibrium value of Mz and Tp isthe "pumping time constant", the inverse of whichbeing the pumping rate.
But this expression is applicable only to a threelevels maser (or to a laser) where the pumping actionis constant and a "pumping rate" and a "pumpinglimit" make sense. Therefore a different approachwas needed.
The populations Na and N^ of a two levels sys-tem suffer changes during irradiation at a rate givenby
^ = 2 n . Wdt
where n = Na - N^ and W is, in the case of absorp-tion, the "induced absorption probability".
Now, since Mz ~ n, then it holds that (8, 16):dMz
dt = - 2 • W • M*
A similar expression can be used in our problemif W is understood as the induced emission proba-bility and the sign of this term is changed.
Next we assume that this probability is simplyproportional to Bl and we make:
and
2W = P - Bl = P • K • v
dMz
where P will be referred to as "the probability fac-tor."
Some doubts should naturally arise about thevalidity of this assumption since the emission andabsorption probabilities are usually considered to beproportional to the square of the acting field. Butthis is true for a single, isolated atomic system actedupon by a wave in free space. This problem was dis-cussed by Bloembergen and Pound (9) and studiedin detail by R. H. Dicke (17). They show that thisis not applicable in our case because we are dealingwith a coherent ensamble of spins. Besides we arenot in a free space but inside a coil where the den-sity of the radiation field is much greater than infree space (18). (This is also the reason why in thesolution of Bloch's equation v is proportional to Bland not to its square).
The pumping term shall thus be written as:
+P • K v Mz
Now for simplicity we make 7 = 1 and Mo = 1 andso our equations take the form:
dMz
dt= - K • v2 +
1 - M Z
T,
(1)+ P • k • v • M z
dt = +P • K - v • Mz
Integration of these equations shows immedi-ately some properties of the oscillator. To beginwith, no integration is possible with v=0. Thisstems from the fact that the point (v — O; Mz =1) is a critical or stationary point of the equations.v must be given some value, as small as wished, butdifferent from zero. This is a characteristic typicalof all oscillators (11,12).
It is also necessary, for the equations to have asolution, that the product K • T2 > 1. Physicallythis is related to the minimum gain necessary tosustain oscillations, since K measures the amountof regeneration of the circuit while T2 measures thequality of our resonator. This was already observedexperimentally.
A similarity relation was found which is particu-larly useful for the adjustment of scales and integra-tion increments while plotting. If h is the incrementof the independent variable t then, given two sets ofparameters: h, Ti, TI and iiTand U, Tx, T2 and K,the integration of equations (1) will give exactly thesame solution if we have:
78 Bulletin of Magnetic Resonance
(h'/h) = (Tl = (K/K') = cte (2)
For instance: A Hewlett-Packard model HP-22258 (Thinkjet) printer was used. In the rastermode it makes 96 steps per inch then, if a calibratedtime scale is wanted, e.g. 1 cm = 1 sec (as wasused in the X-T plotter) then each step is equal to0.02458 seconds. This was the value used for the in-tegration step h when plotting, though not always.For a different time scale it can be changed usingthe similarity relation (Eq. 2).
It was already mentioned that it was possible toforce the oscillator to produce a constant amplitudeoscillation using an AGC circuit. This can be simu-lated with the above system of equations if, insteadof the simple factor K we use: K • (1-A • v) where Ais a kind of "damping factor". Our equations takenow the form:
(3)
60 80 120 S»c.
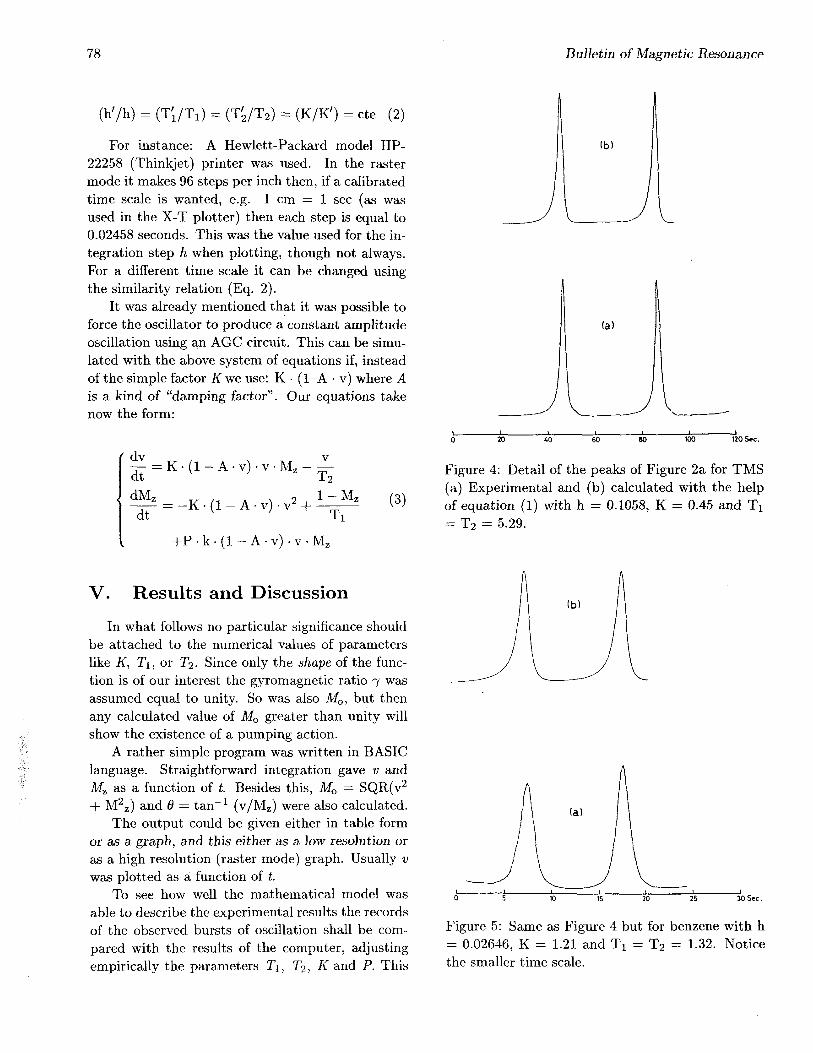
Figure 4: Detail of the peaks of Figure 2a for TMS(a) Experimental and (b) calculated with the helpof equation (1) with h = 0.1058, K = 0.45 and Tx= T2 = 5.29.
+ P - k - ( l - A - v ) - v M z
V. Results and DiscussionIn what follows no particular significance should
be attached to the numerical values of parameterslike K, Ti, or T2. Since only the shape of the func-tion is of our interest the gyromagnetic ratio 7 wasassumed equal to unity. So was also Mo, but thenany calculated value of Mo greater than unity willshow the existence of a pumping action.
A rather simple program was written in BASIClanguage. Straightforward integration gave v andMz as a function of t. Besides this, Mo = SQR(v2
+ M2Z) and 8 = tan"1 (v/Mz) were also calculated.
The output could be given either in table formor as a graph, and this either as a low resolution oras a high resolution (raster mode) graph. Usually vwas plotted as a function of t.
To see how well the mathematical model wasable to describe the experimental results the recordsof the observed bursts of oscillation shall be com-pared with the results of the computer, adjustingempirically the parameters T\, T2, K and P. This
30 Sec.
Figure 5: Same as Figure 4 but for benzene with h= 0.02646, K = 1.21 and Ti = T2 = 1.32. Noticethe smaller time scale.
Vol. 13, No. 3/4 79
(b)
(a)
30 Se
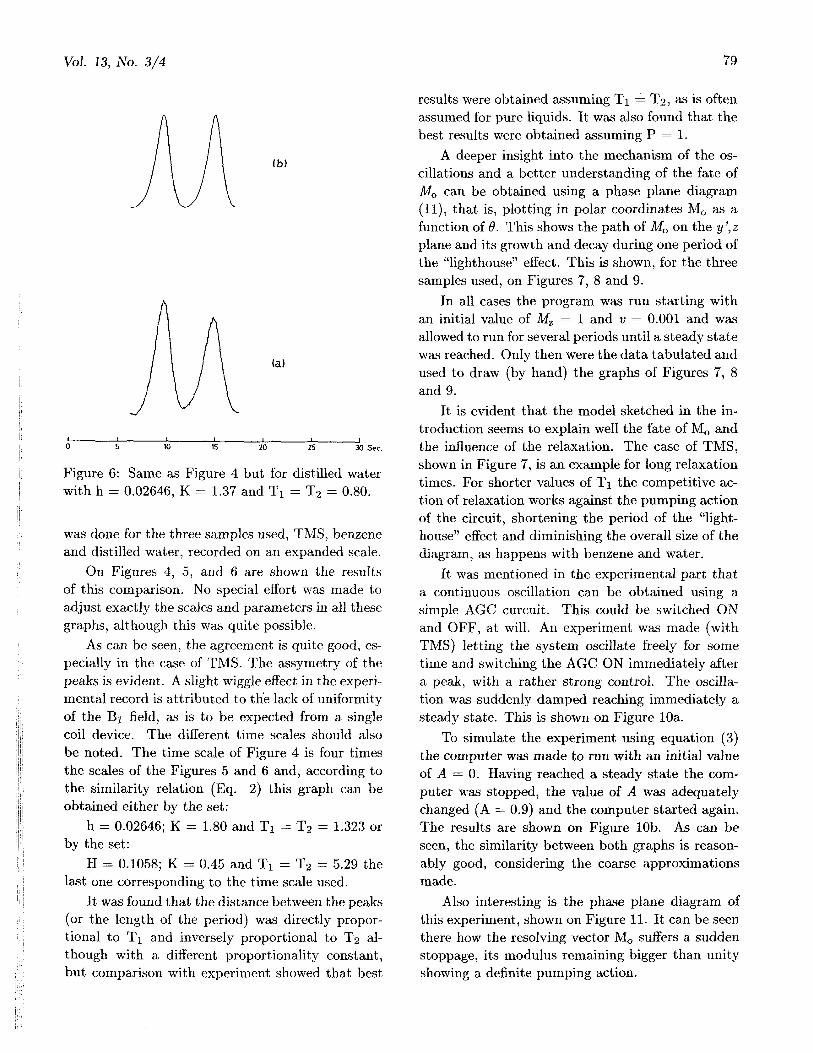
Figure 6: Same as Figure 4 but for distilled waterwith h = 0.02646, K = 1.37 and Tx = T2 = 0.80.
was done for the three samples used, TMS, benzeneand distilled water, recorded on an expanded scale.
On Figures 4, 5, and 6 are shown the resultsof this comparison. No special effort was made toadjust exactly the scales and parameters in all thesegraphs, although this was quite possible.
As can be seen, the agreement is quite good, es-pecially in the case of TMS. The assymetry of thepeaks is evident. A slight wiggle effect in the experi-mental record is attributed to the lack of uniformityof the Bi field, as is to be expected from a singlecoil device. The different time scales should alsobe noted. The time scale of Figure 4 is four timesthe scales of the Figures 5 and 6 and, according tothe similarity relation (Eq. 2) this graph can beobtained either by the set:
h = 0.02646; K = 1.80 and Ti = T2 = 1.323 orby the set:
H = 0.1058; K = 0.45 and Ti = T2 = 5.29 thelast one corresponding to the time scale used.
It was found that the distance between the peaks(or the length of the period) was directly propor-tional to Ti and inversely proportional to T2 al-though with a different proportionality constant,but comparison with experiment showed that best
results were obtained assuming Ti = T2, as is oftenassumed for pure liquids. It was also found that thebest results were obtained assuming P = 1.
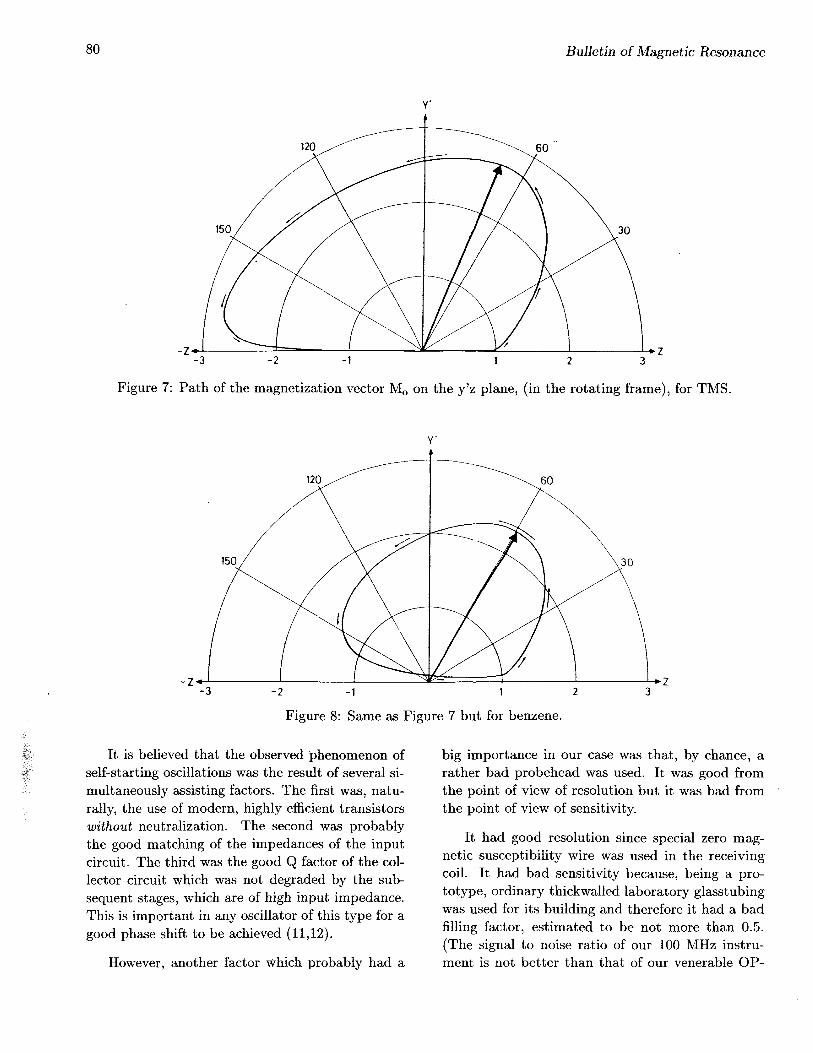
A deeper insight into the mechanism of the os-cillations and a better understanding of the fate ofMo can be obtained using a phase plane diagram(11), that is, plotting in polar coordinates Mo as afunction of 6. This shows the path of Mo on the y',zplane and its growth and decay during one period ofthe "lighthouse" effect. This is shown, for the threesamples used, on Figures 7, 8 and 9.
In all cases the program was run starting withan initial value of Mz = 1 and v = 0.001 and wasallowed to run for several periods until a steady statewas reached. Only then were the data tabulated andused to draw (by hand) the graphs of Figures 7, 8and 9.
It is evident that the model sketched in the in-troduction seems to explain well the fate of Mo andthe influence of the relaxation. The case of TMS,shown in Figure 7, is an example for long relaxationtimes. For shorter values of Ti the competitive ac-tion of relaxation works against the pumping actionof the circuit, shortening the period of the "light-house" effect and diminishing the overall size of thediagram, as happens with benzene and water.
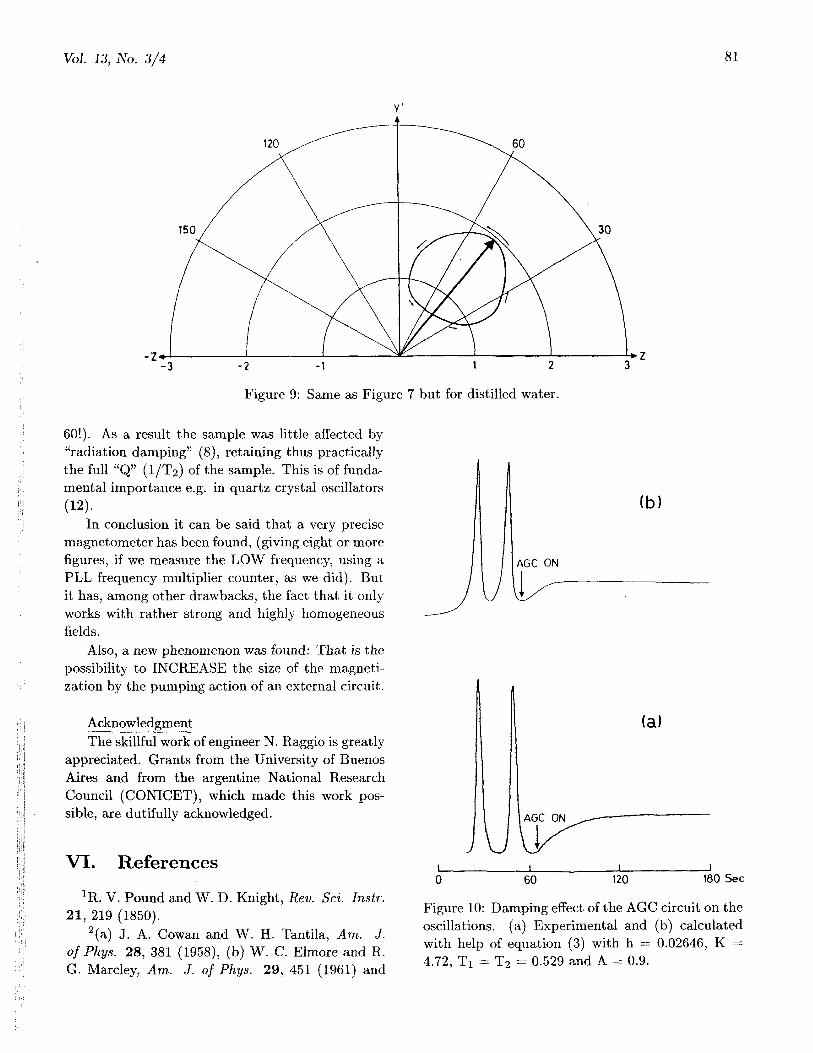
It was mentioned in the experimental part thata continuous oscillation can be obtained using asimple AGC curcuit. This could be switched ONand OFF, at will. An experiment was made (withTMS) letting the system oscillate freely for sometime and switching the AGC ON immediately aftera peak, with a rather strong control. The oscilla-tion was suddenly damped reaching immediately asteady state. This is shown on Figure 10a.
To simulate the experiment using equation (3)the computer was made to run with an initial valueof A = 0. Having reached a steady state the com-puter was stopped, the value of A was adequatelychanged (A = 0.9) and the computer started again.The results are shown on Figure 10b. As can beseen, the similarity between both graphs is reason-ably good, considering the coarse approximationsmade.
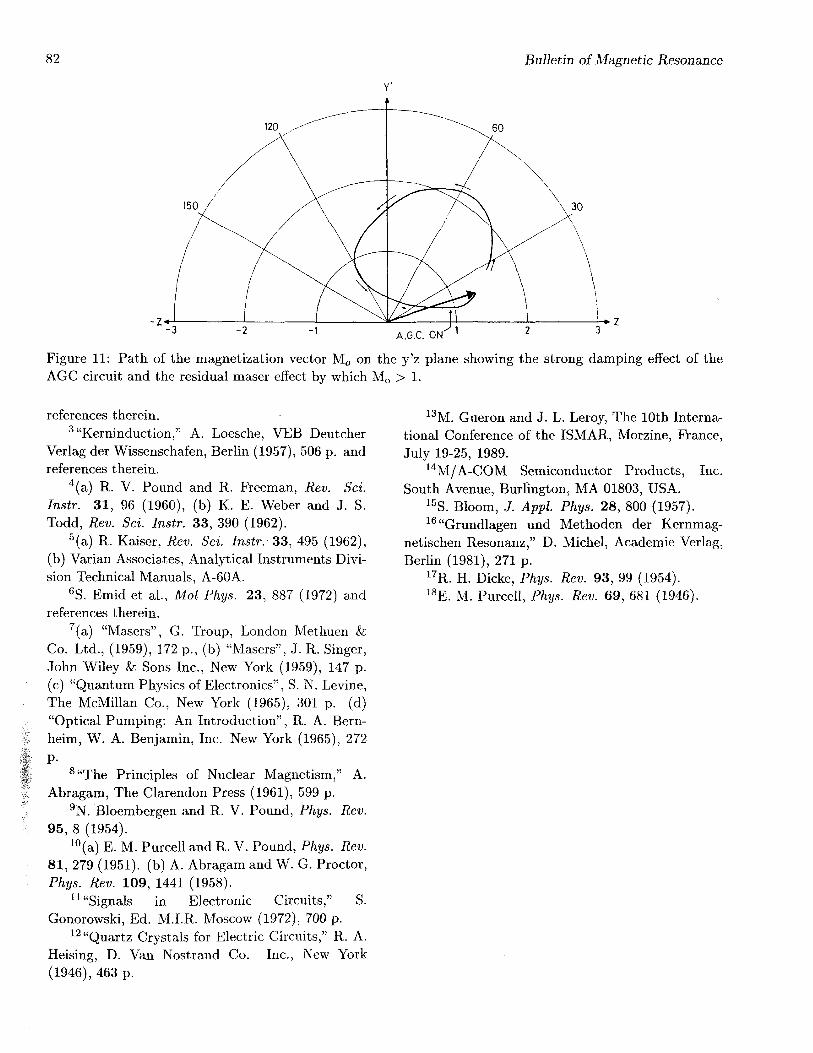
Also interesting is the phase plane diagram ofthis experiment, shown on Figure 11. It can be seenthere how the resolving vector Mo suffers a suddenstoppage, its modulus remaining bigger than unityshowing a definite pumping action.
80 Bulletin of Magnetic Resonance
120 60
150 30
- Z *- 3 - 2 - 1 1 2 3
Figure 7: Path of the magnetization vector Mo on the y'z plane, (in the rotating frame), for TMS.
120 60
150 30
- 2 - 1 1 2
Figure 8: Same as Figure 7 but for benzene.
It is believed that the observed phenomenon ofself-starting oscillations was the result of several si-multaneously assisting factors. The first was, natu-rally, the use of modern, highly efficient transistorswithout neutralization. The second was probablythe good matching of the impedances of the inputcircuit. The third was the good Q factor of the col-lector circuit which was not degraded by the sub-sequent stages, which are of high input impedance.This is important in any oscillator of this type for agood phase shift to be achieved (11,12).
However, another factor which probably had a
big importance in our case was that, by chance, arather bad probehead was used. It was good fromthe point of view of resolution but it was bad fromthe point of view of sensitivity.
It had good resolution since special zero mag-netic susceptibility wire was used in the receivingcoil. It had bad sensitivity because, being a pro-totype, ordinary thickwalled laboratory glasstubingwas used for its building and therefore it had a badfilling factor, estimated to be not more than 0.5.(The signal to noise ratio of our 100 MHz instru-ment is not better than that of our venerable OP-
Vol. 13, No. 3/4 81
120 60
150 30
- 2 - 1 1 2
Figure 9: Same as Figure 7 but for distilled water.
60!). As a result the sample was little affected by"radiation damping" (8), retaining thus practicallythe full "Q" (1/T2) of the sample. This is of funda-mental importance e.g. in quartz crystal oscillators(12).
In conclusion it can be said that a very precisemagnetometer has been found, (giving eight or morefigures, if we measure the LOW frequency, using aPLL frequency multiplier counter, as we did). Butit has, among other drawbacks, the fact that it onlyworks with rather strong and highly homogeneousfields.
Also, a new phenomenon was found: That is thepossibility to INCREASE the size of the magneti-zation by the pumping action of an external circuit.
AcknowledgmentThe skillful work of engineer N. Raggio is greatly
appreciated. Grants from the University of BuenosAires and from the argentine National ResearchCouncil (CONICET), which made this work pos-sible, are dutifully acknowledged.
VI. ReferenceslR. V. Pound and W. D. Knight, Rev. Sci. Instr.
21, 219 (1850).2(a) J. A. Cowan and W. H. Tantila, Am. J.
of Phys. 28, 381 (1958), (b) W. C. Elmore and R.G. Marcley, Am. J. of Phys. 29, 451 (1961) and
(b)
(a)
60 120 180 Sec
Figure 10: Damping effect of the AGC circuit on theoscillations, (a) Experimental and (b) calculatedwith help of equation (3) with h = 0.02646, K =4.72, Ti = T2 = 0.529 and A = 0.9.
82 Bulletin of Magnetic Resonance
60
30
~ 3 -2 A.G.C. ON
Figure 11: Path of the magnetization vector Mo on the y'z plane showing the strong damping effect of theAGC circuit and the residual maser effect by which Mo > 1.
references therein.3 "Kerninduction," A. Loesche, VEB Deutcher
Verlag der Wissenschafen, Berlin (1957), 506 p. andreferences therein.
4(a) R. V. Pound and R. Freeman, Rev. Sci.Instr. 31 , 96 (1960), (b) K. E. Weber and J. S.Todd, Rev. Sci. Instr. 33, 390 (1962).
5(a) R. Kaiser, Rev. Sci. Instr. 33, 495 (1962),(b) Varian Associates, Analytical Instruments Divi-sion Technical Manuals, A-60A.
6S. Emid et a l , Mol Phys. 23, 887 (1972) andreferences therein.
7(a) "Masers", G. Troup, London Methuen &Co. Ltd., (1959), 172 p., (b) "Masers", J. R. Singer,John Wiley & Sons Inc., New York (1959), 147 p.(c) "Quantum Physics of Electronics", S. N. Levine,The McMillan Co., New York (1965), 301 p. (d)"Optical Pumping: An Introduction", R. A. Bern-heim, W. A. Benjamin, Inc. New York (1965), 272P-
8 "The Principles of Nuclear Magnetism," A.Abragam, The Clarendon Press (1961), 599 p.
9N. Bloembergen and R. V. Pound, Phys. Rev.95, 8 (1954).
10(a) E. M. Purcell and R. V. Pound, Phys. Rev.81, 279 (1951). (b) A. Abragam and W. G. Proctor,Phys. Rev. 109, 1441 (1958).
11 "Signals in Electronic Circuits," S.Gonorowski, Ed. M.I.R. Moscow (1972), 700 p.
12 "Quartz Crystals for Electric Circuits," R. A.Heising, D. Van Nostrand Co. Inc., New York(1946), 463 p.
13M. Gueron and J. L. Leroy, The 10th Interna-tional Conference of the ISMAR, Morzine, France,July 19-25, 1989.
14M/A-C0M Semiconductor Products, Inc.South Avenue, Burlington, MA 01803, USA.
15S. Bloom, J. Appl. Phys. 28, 800 (1957).16 "Grundlagen und Methoden der Kernmag-
netischen Resonanz," D. Michel, Academie Verlag,Berlin (1981), 271 p.
17R. H. Dicke, Phys. Rev. 93, 99 (1954).18E. M. Purcell, Phys. Rev. 69, 681 (1946).