oact hr2 04-09-2015
DESCRIPTION
OACT HR2 04-09-2015TRANSCRIPT

— 1 —
DEPARTMENT OF HEALTH AND HUMAN SERVICES
Centers for Medicare & Medicaid Services
7500 Security Boulevard, Mail Stop N3-01-21
Baltimore, MD 21244
OFFICE OF THE ACTUARY
DATE: April 9, 2015
FROM: Paul Spitalnic
Chief Actuary
SUBJECT: Estimated Financial Effects of the Medicare Access and CHIP Reauthorization Act
of 2015 (H.R. 2)
On March 26, 2015, the House passed the Medicare Access and CHIP Reauthorization Act of
2015 (H.R. 2). This bill includes a provision to replace the Sustainable Growth Rate (SGR)
formula used by Medicare to pay physicians with new systems for establishing annual payment
rate updates for physicians’ services. In addition, it would temporarily extend the Children’s
Health Insurance Program (CHIP) and increase premiums for Part B and Part D of Medicare for
beneficiaries with income above certain levels. H.R. 2 would also make numerous other changes
to Medicare and Medicaid.
This memorandum summarizes the Office of the Actuary’s estimates of the short-range and
long-range financial effects of H.R.2, describes the bill’s major provisions, and discusses the
implications and limitations of the estimates.
Projections of health care spending are necessarily uncertain. Reasonable estimates can vary
significantly from each other, particularly when applied over many years. While the estimates
included in this memorandum are based on reasonable actuarial assumptions and methods, actual
experience will likely be different than expected.
Summary
From fiscal year 2015 through 2025, we estimate that H.R. 2 would increase combined Federal
spending for Medicare, Medicaid, and the health insurance marketplace by $102.8 billion. The
year-by-year summary of the impact is shown in the table below.
Estimated Federal Fiscal Year Costs (+) or Savings (–) under H.R. 2 (in billions)
Provisions 2015 2016 2017 2018 2019 2020 2021 2022 2023 2024 2025 2015-25
Total 6.9 13.1 15.7 9.9 6.1 8.4 8.8 10.0 10.1 8.2 5.5 102.8
Physician payment update 5.4 9.1 6.1 8.2 10.9 15.7 17.2 18.7 19.2 19.3 20.7 150.5
Other Medicare 0.9 2.7 3.4 −5.2 −7.4 −9.2 −9.5 −9.2 −8.8 −9.4 −10.5 −62.2
Medicaid/CHIP 0.5 1.4 10.1 10.3 2.9 2.2 1.5 1.0 0.2 −1.1 −4.1 25.0
Marketplace 0.0 −0.1 −3.8 −3.4 −0.2 −0.4 −0.5 −0.5 −0.5 −0.6 −0.6 −10.5
The physician payment updates included in H.R.2 would eliminate the significant and immediate
problems with the current SGR formula approach. Avoiding these implausible payment
reductions (including the 21.2-percent decrease that was scheduled for April 1, 2015) results in a

— 2 —
budget cost of $150.5 billion for fiscal years 2015 through 2025 compared to the current-law
baseline. This cost is partially offset by other provisions in H.R. 2 that are estimated to have a net
reduction in Federal expenditures of $47.7 billion. Accordingly, the net cost of the legislation is
$102.8 billion.
While H.R.2 avoids the significant short-range physician payment issues resulting from the
current SGR system approach, it nevertheless raises important long-range concerns that would
almost certainly need to be addressed by future legislation. In particular, additional updates
totaling $500 million per year and a 5 percent annual bonus are scheduled to expire in 2025,
resulting in a payment reduction for most physicians. In addition, this bill specifies the physician
payment update amounts for all years in the future, and these amounts do not vary based on
underlying economic conditions, nor are they expected to keep pace with the average rate of
physician cost increases. The specified rate updates would be inadequate in years when levels of
inflation are higher or when the cumulative effect of price updates not keeping up with physician
costs becomes too large. We anticipate that physician payment rates under H.R.2 would be lower
than scheduled under the current SGR formula by 2048 and would continue to worsen thereafter.
Absent a change in the method or level of update by subsequent legislation, we expect access to
Medicare-participating physicians to become a significant issue in the long term under H.R. 2.
Major Provisions of H.R. 2
This section describes the provisions that would have a measurable impact on Medicare,
Medicaid, and health insurance marketplace spending and are important from a policy
perspective.
Title I—SGR Repeal and Medicare Provider Payment Modernization. Under current law,
Medicare’s payment rates for services furnished by physicians were to be reduced by
21.2 percent on April 1, 2015. H.R. 2 would freeze those payment rates at current levels for
3 months and then increase them by 0.5 percent for services furnished during the last 6 months of
calendar year 2015. Over the next several years, the bill would replace the SGR formula with
new payment systems.
The major specifications of the new payment systems described in H.R. 2 are as follows:
For services paid under the physician fee schedule and furnished during calendar years
2016 through 2019, Medicare’s payment rates would increase by 0.5 percent a year.
Payment rates for services on the physician fee schedule would remain at the 2019 level
through 2025, but, starting in 2019, the amounts paid to individual providers would be
subject to adjustment through one of two mechanisms, depending on whether the
physician chose to participate in an Alternative Payment Model (APM) program or the
Merit-Based Incentive Payment System (MIPS).
For 2026 and subsequent years, there would be two payment rates for services on the
physician fee schedule. For providers paid through an APM program, payment rates
would be increased each year by 0.75 percent. Payment rates for other providers would
be increased each year by 0.25 percent.
Providers who opted to participate in MIPS would receive payments that would be
subject to positive or negative performance adjustments. The basic adjustments would be

— 3 —
designed to be offsetting in aggregate, so that they would have no net effect on overall
payments. The performance adjustment for an individual provider would depend on that
provider’s performance compared to a threshold. In addition, H.R. 2 would provide
$500 million each year from 2019 to 2024 as an additional performance adjustment for
providers in this program who achieved exceptional performance.
From 2019 through 2024, providers receiving a substantial portion of their revenue from
alternative payment models would receive a lump-sum payment after each year equal to
5 percent of their Medicare payments for services reimbursed according to the physician
fee schedule in that year. Providers with smaller amounts of revenue from APMs would
receive either no adjustment to their payments or the MIPS performance adjustment if
they reported measures and activities under that program.
Title II—Medicare and Other Health Extenders. Several Medicare provisions, including some
that increase payments for certain low-volume and small rural hospitals, physicians, therapy
services, and ambulance providers, were to expire on April 1, 2015. H.R. 2 would extend those
increased payment amounts through the end of either fiscal year 2017 or calendar year 2017,
depending on whether Medicare’s payment system for that type of provider operates on a fiscal-
year or calendar-year basis. The bill would also extend for 2 years the eligibility of Medicare
Advantage plans for special needs individuals to participate in the Medicare program.
The bill would permanently extend two programs: (i) the Qualifying Individuals Program, which
subsidizes Medicare Part B premiums for certain low-income Medicare beneficiaries, and
(ii) Transitional Medical Assistance (TMA) under Medicaid, which requires states to provide
continued medical coverage for certain families who become ineligible for medical assistance
because of increased earnings.
Title III—CHIP. The Children’s Health Insurance Program is currently funded only through
2015, although there are sufficient funds to cover most projected expenditures in 2016 as well.
H.R. 2 would extend the funding through 2017 but would likely provide enough funds to cover
some amount of projected expenditures in 2018. These additional CHIP costs would be offset
somewhat by reductions in Medicaid costs and by premium tax credits and cost-sharing
subsidies, as many CHIP enrollees would be expected to receive coverage in Medicaid or
subsidized coverage in the health insurance marketplace if CHIP funding were to expire.
Title IV—Offsets. H.R. 2 includes a number of provisions that would result in savings to the
Medicare and Medicaid programs. The more significant provisions are listed below.
Beginning in 2018, the income thresholds for determining the premium subsidy for the
Medicare Part B and Part D premiums paid by the beneficiary would be changed,
resulting in more beneficiaries paying the higher premium amounts. In addition,
beginning in 2020, more beneficiaries would be subject to the income-related premiums
due to a change in the indexing of the income thresholds.
Payment rate updates in 2018 for skilled nursing facilities, inpatient rehabilitation
facilities, home health agencies, hospices, and long-term care hospitals would be limited
to 1 percent.
Under current law, state allotments for Medicaid disproportionate share hospital (DSH)
payments are increased each year by the percent change in the consumer price index and

— 4 —
then adjusted by scheduled reductions. H.R. 2 would increase net allotments in 2017
through 2020 and decrease net allotments in 2021 through 2025.
Currently, a 3.2-percent increase in payment rates for inpatient hospital services is
scheduled for 2018. H.R. 2 would replace this single-year update with an increase of
0.5 percent each year from 2018 through 2023.
Short-Range Impacts
The short-range estimates are based on the President’s Fiscal Year 2016 Budget baseline. These
estimates include Medicare projections under current law and under an adjusted baseline that
assumes that the reduction in physician payments scheduled under the SGR formula is replaced
with 0-percent updates in all years. The provisions of H.R.2 were estimated relative to the
current-law baseline.
The bill would replace the SGR formula with a new method for updating physician payment
rates. For purposes of modeling the short-range impacts of this new method, a key assumption is
the percentage of physician payments in the APM and MIPS programs. These estimates reflect
that APMs are defined to include Accountable Care Organizations (ACOs) and demonstrations,
including payment models being tested by the Center for Medicare and Medicaid Innovation.
Of the total physician spending in fee-for-service Medicare in 2015, roughly 25 percent is
attributable to beneficiaries assigned to an ACO. For 2019 through 2025, APM physicians would
receive a 5-percent bonus each year. Given the favorable financial incentives for APMs, we
assume that the share of Medicare physician spending in ACOs or other qualifying payment
models would grow. As a result, payments to physicians in APMs are assumed to constitute
60 percent of Medicare physician spending in 2019 and to continue to increase thereafter. The
new physician system specified in H.R 2 is estimated to increase physician spending by
$150.5 billion over fiscal years 2015 through 2025 compared to current law.
H.R. 2 would also provide allotments for CHIP for 2016 and 2017. Under current law, Federal
CHIP allotments are provided only through 2015; however, as some amount of unspent CHIP
funding is available to be disbursed in subsequent years, our current-law projection is that there
would be enough CHIP funds to cover most of the 2016 costs. Similarly, the CHIP allotments
provided under this bill are expected to furnish enough funding to cover all of the expected costs
in 2017 and some portion of the costs in 2018. Although the funding is scheduled to expire in
2015, our estimate for this provision reflects the President’s 2016 Budget baseline assumption of
an annual $5.7-billion allotment beginning in 2016, as well as the statutory increase in the
Federal matching rate for CHIP from 70 percent in 2015 to 93 percent in 2016. In addition, the
estimate reflects that, in the absence of additional CHIP allotments, many children would likely
have enrolled in Medicaid or in the health insurance marketplace to receive subsidized coverage;
as a result, the increased CHIP costs are offset by reductions in Medicaid and marketplace
expenditures. These changes result in additional Medicaid/CHIP spending of $25.0 billion for
fiscal years 2015 through 2025, partially offset by health insurance marketplace savings of
$10.5 billion compared to current law.
Moreover, H.R. 2 would change the income-related premium provision that requires more
beneficiaries to pay a higher premium under both Part B and Part D of Medicare. The additional
premium income reduces the Federal transfers required from the general fund of the Treasury.
We estimate that approximately 6.7 million Part B and 4.7 million Part D beneficiaries would be

— 5 —
affected by this provision in 2025. For fiscal years 2015 through 2025, the impact of this
provision is a savings of roughly $35.8 billion.
The other major changes required by H.R. 2 are revisions to the payment updates for several
Medicare providers, including inpatient hospitals, skilled nursing facilities, and home health
agencies. The impact of these payment update changes is to reduce spending by an estimated
$35.4 billion. The remaining provisions would increase spending by about $9.0 billion. Detailed
estimates for all of the provisions of H.R.2 are shown in Attachment 1.
Long-Range Impacts
The long-range estimates are based on the 2014 Annual Report of the Boards of Trustees of the
Federal Hospital Insurance and Federal Supplementary Medical Insurance Trust Funds
(Medicare Trustees Report). 1
This section of the memorandum examines the impacts of H.R.2 in
the long term separately for Part A and Part B of Medicare.
The provisions of the bill that would have the largest impact on the Part A projections are those
that would reduce payment updates to most Part A providers in 2018 and one that would adjust
inpatient hospital updates in 2018 through 2023. These smaller provider updates would have the
cumulative effect of lowering the long-range projections slightly. Based on the assumptions of
the 2014 Medicare Trustees Report, the Hospital Insurance (HI) trust fund would be depleted in
2030. Under the provisions of H.R. 2, the fund would be depleted one year later, in 2031. Over
the 75-year period, the actuarial deficit would be reduced from the current-law estimate of
0.87 percent of taxable payroll to 0.78 percent under H.R. 2. Similarly, the present value of
future Part A benefits would decrease by $387 billion—from $20.365 trillion to $19.978 trillion.
For Part B, the Medicare Trustees Report presents costs under both current law and a projected
baseline approach. In the short-range period, the projected baseline assumes that the SGR system
used to update physician payments would be overridden and replaced with an annual increase
equal to the average update over the past 10 years. For the long-range projections, per capita
physician payments would ultimately increase at the rate of per capita national health
expenditures. The Trustees chose to emphasize the projected baseline throughout the report to
reflect a more useful projection of physician spending than would have been attainable under the
current-law baseline, which included the unreasonable physician payment reduction that was
expected to be overridden by lawmakers.
Under current law, Medicare payments to physicians are increased each year by the growth in the
Medicare Economic Index (MEI) adjusted for performance under the SGR system, which intends
to limit growth in physician spending to the rate of overall economic growth as measured by
GDP. Because Medicare physician expenditures are projected to grow 1 percentage point faster
than GDP, on average, in the long run, the current-law baseline assumes that the performance
adjustment will be –1 percent over this period. As a result, physician payments are assumed to
increase by an average of MEI less 1 percent under current law, or 1.3 percent (2.3 percent less
1 percent). In contrast, the average physician payment update is estimated to equal the MEI
growth rate of roughly 2.3 percent under the projected baseline scenario.
1 http://www.cms.gov/Research-Statistics-Data-and-Systems/Statistics-Trends-and-
Reports/ReportsTrustFunds/Downloads/TR2014.pdf
— 6 —
The long-range modeling of H.R. 2 reflects the physician update amounts specified in the bill of
0.75 percent for physicians participating in an APM program and 0.25 percent for physicians
participating in MIPS. For 2026 and later, APMs would be paid increasingly more each year
relative to non-APMs. Because of these growing financial incentives, we assume that the share
of Medicare physician dollars in APMs would increase from 60 percent in 2019 to 100 percent
by 2038. For purposes of these estimates, potential secondary effects, such as the possible
significant reduction in beneficiary access to physicians that is described in the next section of
this memorandum, are not included.
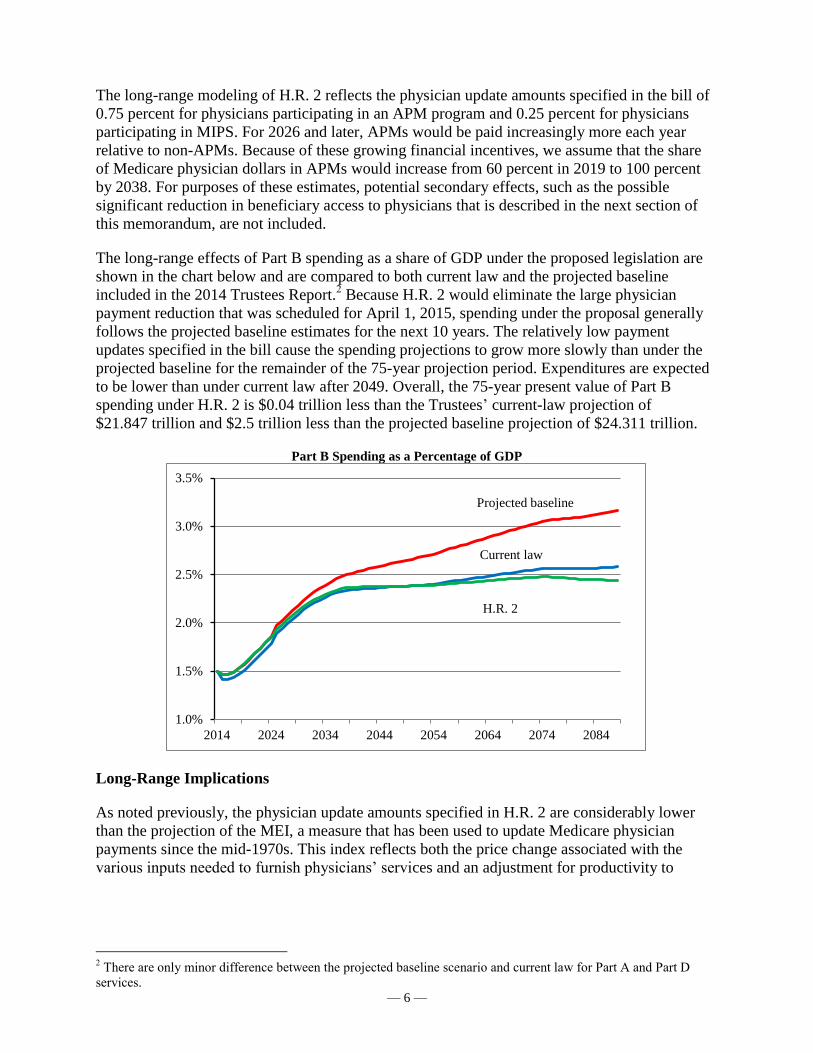
The long-range effects of Part B spending as a share of GDP under the proposed legislation are
shown in the chart below and are compared to both current law and the projected baseline
included in the 2014 Trustees Report.2 Because H.R. 2 would eliminate the large physician
payment reduction that was scheduled for April 1, 2015, spending under the proposal generally
follows the projected baseline estimates for the next 10 years. The relatively low payment
updates specified in the bill cause the spending projections to grow more slowly than under the
projected baseline for the remainder of the 75-year projection period. Expenditures are expected
to be lower than under current law after 2049. Overall, the 75-year present value of Part B
spending under H.R. 2 is $0.04 trillion less than the Trustees’ current-law projection of
$21.847 trillion and $2.5 trillion less than the projected baseline projection of $24.311 trillion.
Part B Spending as a Percentage of GDP
Long-Range Implications
As noted previously, the physician update amounts specified in H.R. 2 are considerably lower
than the projection of the MEI, a measure that has been used to update Medicare physician
payments since the mid-1970s. This index reflects both the price change associated with the
various inputs needed to furnish physicians’ services and an adjustment for productivity to
2 There are only minor difference between the projected baseline scenario and current law for Part A and Part D
services.
1.0%
1.5%
2.0%
2.5%
3.0%
3.5%
2014 2024 2034 2044 2054 2064 2074 2084
Projected baseline
Current law
H.R. 2

— 7 —
capture efficiencies in the provision of these services.3 Economy-wide prices and productivity
measures are used in the MEI in order to meet the original legislative intent that it approximate a
broad price index. The MEI is considered an appropriate measure to use as the basis for
physician price increases under competitive, market-based conditions over the long-range
projection period because it reflects underlying price pressures associated with physician care,
both for labor and non-labor inputs.
Over the past 25 years, as shown in the table below, the published MEI update has increased at a
rate similar to that for the GDP deflator, slightly less than the Consumer Price Index (CPI), and
significantly less than the hospital market basket.4 The historical relationship between the MEI
and the GDP deflator is assumed to continue throughout the projection period; accordingly, the
long-range MEI is assumed to increase 2.3 percent per year—the same long-range increase as
exhibited by the GDP deflator in the 2014 Medicare Trustees Report.5 Based on this assumption,
physician prices would increase similarly to price increases for other services and goods in the
economy, and, all else being equal, physician compensation in real terms would increase at rates
similar to real compensation increases for the average worker in the economy.
Percent Change in Physician, Hospital, and Economy-wide Price Measures
Period MEI update GDP deflator CPI
Hospital market
basket
1990-2014 2.1% 2.1% 2.6% 3.3%
2005-2014 1.5% 2.0% 2.3% 2.8%
The Medicare physician updates would be 0.75 percent per year for those participating in an
APM or 0.25 percent per year for those participating in MIPS, each amount less than the
2.3-percent increase assumed for the MEI. This difference raises significant long-range
implications for physician payment rates under Medicare. While such implications currently
exist with regard to the SGR system, under H.R. 2 these concerns are ultimately greater in the
long range, as shown in the illustration below.
3 The structure, price proxies, and data sources used in the MEI have evolved over time (currently this measure
reflects a 2006 base year). The MEI has been evaluated and validated by several technical panels, the most recent of
which convened in 2012 (http://www.cms.gov/Regulations-and-Guidance/Guidance/FACA/Downloads/MEI-
Review-Report-to-HHS.pdf). 4 Over the past decade, the MEI update has increased slightly less than the GDP deflator. This result is due in large
part to low economy-wide wage growth (particularly apparent in the past 5 years because of the Great Recession)
and the use of a 10-year moving average of economy-wide productivity in the MEI. 5 An alternative method can be used to derive the MEI based on assumptions from the 2014 Medicare Trustees
Report regarding the two major components of the index: input price changes and economy-wide productivity. The
input price change is assumed to increase 3.4 percent per year based on a weighted-average of compensation price
growth and non-compensation price growth. (Compensation price growth accounts for roughly 67 percent of the
MEI and includes both physician and non-physician compensation; non-compensation price growth accounts for the
remaining 33 percent of the MEI.) Compensation prices are assumed to increase at 4.0 percent per year, and non-
compensation prices are assumed to increase at economy-wide rates, or 2.3 percent per year. Economy-wide
productivity is assumed to grow at 1.1 percent per year. The resulting long-range MEI increase using this approach
is 2.3 percent, derived by subtracting the 1.1-percent growth in productivity from the 3.4-percent growth in the input
price index.
— 8 —
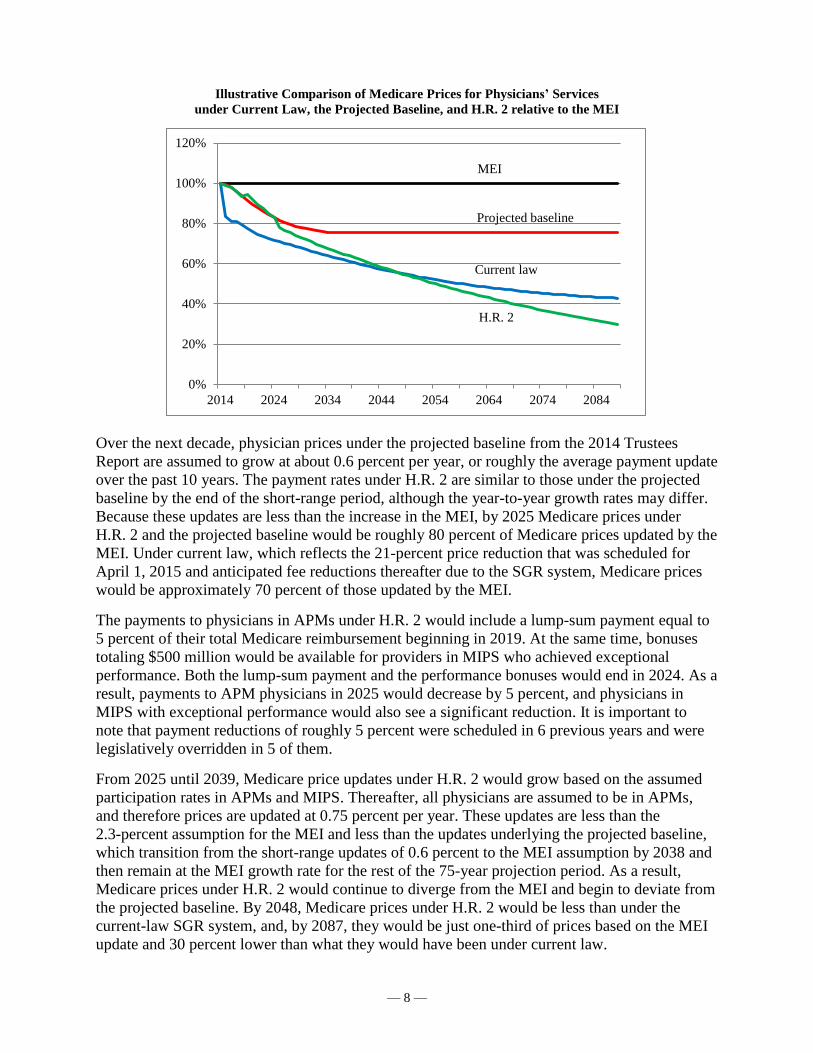
Illustrative Comparison of Medicare Prices for Physicians’ Services
under Current Law, the Projected Baseline, and H.R. 2 relative to the MEI
Over the next decade, physician prices under the projected baseline from the 2014 Trustees
Report are assumed to grow at about 0.6 percent per year, or roughly the average payment update
over the past 10 years. The payment rates under H.R. 2 are similar to those under the projected
baseline by the end of the short-range period, although the year-to-year growth rates may differ.
Because these updates are less than the increase in the MEI, by 2025 Medicare prices under
H.R. 2 and the projected baseline would be roughly 80 percent of Medicare prices updated by the
MEI. Under current law, which reflects the 21-percent price reduction that was scheduled for
April 1, 2015 and anticipated fee reductions thereafter due to the SGR system, Medicare prices
would be approximately 70 percent of those updated by the MEI.
The payments to physicians in APMs under H.R. 2 would include a lump-sum payment equal to
5 percent of their total Medicare reimbursement beginning in 2019. At the same time, bonuses
totaling $500 million would be available for providers in MIPS who achieved exceptional
performance. Both the lump-sum payment and the performance bonuses would end in 2024. As a
result, payments to APM physicians in 2025 would decrease by 5 percent, and physicians in
MIPS with exceptional performance would also see a significant reduction. It is important to
note that payment reductions of roughly 5 percent were scheduled in 6 previous years and were
legislatively overridden in 5 of them.
From 2025 until 2039, Medicare price updates under H.R. 2 would grow based on the assumed
participation rates in APMs and MIPS. Thereafter, all physicians are assumed to be in APMs,
and therefore prices are updated at 0.75 percent per year. These updates are less than the
2.3-percent assumption for the MEI and less than the updates underlying the projected baseline,
which transition from the short-range updates of 0.6 percent to the MEI assumption by 2038 and
then remain at the MEI growth rate for the rest of the 75-year projection period. As a result,
Medicare prices under H.R. 2 would continue to diverge from the MEI and begin to deviate from
the projected baseline. By 2048, Medicare prices under H.R. 2 would be less than under the
current-law SGR system, and, by 2087, they would be just one-third of prices based on the MEI
update and 30 percent lower than what they would have been under current law.
0%
20%
40%
60%
80%
100%
120%
2014 2024 2034 2044 2054 2064 2074 2084
MEI
Projected baseline
Current law
H.R. 2

— 9 —
The implications of the long-range divergence of Medicare physician payment rates from the
MEI are significant. While H.R. 2 addresses the near-term concerns of the SGR system, the
issues of inadequate physician payment rates are ultimately greater. If Medicare payments were
to fall to a fraction of payments based on cost drivers, there would be reason to expect that
access to physicians’ services for Medicare beneficiaries would be severely compromised,
particularly considering that physicians are less dependent on Medicare revenue than are other
providers, such as hospitals and skilled nursing facilities. Similarly, the quality of care provided
to Medicare beneficiaries would likely not keep pace with the care furnished to other types of
patients.
Conclusion
The new systems for calculating physician rates under H.R. 2 would effectively avoid the need
for annual (or more frequent) legislative overrides to the SGR formula under current law. These
new physician payments would result in additional Federal Medicare spending of $150.5 billion
for fiscal years 2015 through 2025. Other provisions included in H.R. 2 would partially offset
these impacts, resulting in a net cost of $102.8 billion for the legislation. The long-range
estimates in this memorandum include the following effects that would occur under H.R. 2:
(i) the depletion date of the HI trust fund would be slightly delayed; (ii) the HI actuarial deficit
would be slightly improved; and (iii) the present value of Part B spending would be slightly less
than under current law and somewhat lower than under the projected baseline shown in the 2014
Medicare Trustees Report.
While physician payment updates would be adequate for many years, there are a number of
concerns about the specified updates in the long range. In particular, the physician payment rates
would be problematic under H.R. 2 in years with high inflation, in 2025 when the 5-percent
APM bonus and the $500 million additional pool for MIPS are scheduled to expire, or at the
point when the cumulative effects of payment updates not keeping up with physician costs
become too large. If not addressed by subsequent legislation, we expect that access to, and
quality of, physicians’ services would deteriorate over time for beneficiaries.
Paul Spitalnic, ASA, MAAA
Chief Actuary

Attachment 1
MEDICARE ACCESS AND CHIP REAUTHORIZATION ACT OF 2015 (H.R. 2)(In millions)
Fiscal Year Total,
Section Provision 2015 2016 2017 2018 2019 2020 2021 2022 2023 2024 2025 2015-19 2015-25
Title I—SGR Repeal and Medicare Provider Payment Modernization
101-106 Physician payment update
Part B 5,430 11,730 11,220 12,370 15,550 21,170 23,210 25,210 25,880 25,980 26,860 56,300 204,610
Part B, net of premium offset 5,430 9,130 6,060 8,230 10,850 15,680 17,170 18,730 19,200 19,300 20,680 39,700 150,460
Title II—Medicare and Other Health Extenders
Subtitle A—Medicare Extenders
201 Extension of work GPCI floor
Part B 210 610 810 350 0 0 0 0 0 0 0 1,980 1,980
Part B, net of premium offset 160 460 610 260 0 0 0 0 0 0 0 1,490 1,490
202 Extension of therapy cap exceptions process
Part B 590 1,690 2,250 960 0 0 0 0 0 0 0 5,490 5,490
Part B, net of premium offset 440 1,270 1,690 720 0 0 0 0 0 0 0 4,120 4,120
203 Extension of ambulance add-ons
Part B 60 170 110 30 0 0 0 0 0 0 0 370 370
Part B, net of premium offset 50 130 80 20 0 0 0 0 0 0 0 280 280
204 Extension of increased inpatient hospital payment adjustment for certain low-volume hospitals
Part A 140 390 460 50 0 0 0 0 0 0 0 1,040 1,040
205 Extension of the Medicare-dependent hospital (MDH) program
Part A 60 180 220 20 0 0 0 0 0 0 0 480 480
206 Extension of specialized Medicare Advantage plans for special needs individuals
Part A 0 0 0 0 0 0 0 0 0 0 0 0 0
Part B 0 0 0 0 0 0 0 0 0 0 0 0 0
Part B, net of premium offset 0 0 0 0 0 0 0 0 0 0 0 0 0
207 Extension of funding for quality measure endorsement, input, and selection
Part A 15 15 15 0 0 0 0 0 0 0 0 45 45
Part B 15 15 15 0 0 0 0 0 0 0 0 45 45
Part B, net of premium offset 10 10 10 0 0 0 0 0 0 0 0 30 30
208 Extension of funding outreach and assistance for low-income programs
Part A 13 19 19 0 0 0 0 0 0 0 0 50 50
Part B 13 19 19 0 0 0 0 0 0 0 0 50 50
Part B, net of premium offset 10 10 10 0 0 0 0 0 0 0 0 30 30
209 Extension and transition of Medicare reasonable cost contracts
Part A 0 0 0 -10 0 0 0 0 0 0 0 -10 -10
Part B 0 0 0 -10 0 0 0 0 0 0 0 -10 -10
Part B, net of premium offset 0 0 0 0 0 0 0 0 0 0 0 0 0
210 Extension of home health rural add-on
Part A 0 50 70 30 0 0 0 0 0 0 0 150 150
Part B 0 80 120 40 0 0 0 0 0 0 0 240 240
Part B, net of premium offset 0 60 90 30 0 0 0 0 0 0 0 180 180
04/09/2015
Office of the Actuary
Centers for Medicare & Medicaid Services

Attachment 1
MEDICARE ACCESS AND CHIP REAUTHORIZATION ACT OF 2015 (H.R. 2)(In millions)
Fiscal Year Total,
Section Provision 2015 2016 2017 2018 2019 2020 2021 2022 2023 2024 2025 2015-19 2015-25
Subtitle B—Other Health Extenders
211 Permanent extension of the qualified individual (QI) program 370 840 920 1,005 1,125 1,255 1,390 1,535 1,690 1,860 2,045 4,260 14,035
212 Permanent extension of the transitional medical assistance (TMA)
Medicaid -10 -40 45 100 135 220 260 280 300 320 340 230 1,950
Health insurance marketplaces - premium tax credits and cost-sharing
reduction subsidies 20 70 -80 -170 -235 -380 -450 -485 -520 -555 -590 -395 -3,375
213 Extension of special diabetes program for type I diabetes and for Indians No Medicare/Medicaid impact
214 Extension of abstinence education No Medicare/Medicaid impact
215 Extension of personal responsibility education program (PREP) No Medicare/Medicaid impact
216 Extension of funding for family-to-family health information centers No Medicare/Medicaid impact
217 Extension of health workforce demonstration project for low-income
individualsNo Medicare/Medicaid impact
218 Extension of maternal, infant, and early childhood home visiting programs No Medicare/Medicaid impact
219 Tennessee DSH allotment for fiscal years 2015 through 2025 53 53 53 53 53 53 53 53 53 53 53 266 584
220 Delay in effective date for Medicaid amendments relating to beneficiary
liability settlements 115 150 165 45 20 15 10 5 5 5 5 495 540
221 Extension of funding for community health centers, the National Health
Service Corps, and teaching health centersNo Medicare/Medicaid impact
Title III—CHIP
301 2-year extension of the Children's Health Insurance Program
CHIP 0 500 9,900 8,600 0 0 0 0 0 0 0 19,000 19,000
Medicaid 0 -100 -2,200 -1,900 0 0 0 0 0 0 0 -4,200 -4,200
Health insurance marketplaces - premium tax credits and cost-sharing
reduction subsidies 0 -200 -3,700 -3,200 0 0 0 0 0 0 0 -7,100 -7,100
302 Extension of express lane eligibility
Medicaid 0 20 35 25 25 20 15 15 10 10 5 105 180
CHIP 0 15 25 20 0 0 0 0 0 0 0 60 60
303 Extension of outreach and enrollment program No Medicare/Medicaid impact
304 Extension of certain programs and demonstration projects No Medicare/Medicaid impact
305 Report of the Inspector General of HHS on use of express lange option under
Medicaid and CHIP 0 0 0 0 0 0 0 0 0 0 0 0 0
Title IV—Offsets
Subtitle A—Medicare Beneficiary Reforms
401 Limitation on certain Medigap policies for newly eligible Medicare beneficiaries
Part B 0 0 0 0 0 -10 -40 -70 -110 -160 -210 0 -600
Part B, net of premium offset 0 0 0 0 0 -10 -30 -50 -80 -120 -160 0 -450
402 Income-related premium adjustment for Parts B and D
Part B, premium income 0 0 0 -610 -920 -2,890 -3,810 -4,250 -4,750 -5,320 -5,920 -1,530 -28,470
Part B 0 0 0 -40 -80 -130 -160 -180 -210 -230 -260 -120 -1,290
Part B, net of premium offset 0 0 0 -30 -60 -100 -120 -140 -160 -170 -200 -90 -980
Part D, premium income 0 0 0 -120 -190 -650 -860 -970 -1,070 -1,180 -1,300 -310 -6,340
Part D 0 0 0 -40 -40 -140 -190 -210 -250 -270 -270 -80 -1,410
Part D, net of premium offset 0 0 0 0 0 0 0 0 0 0 0 0 0
Part D, net of premium offset and clawback 0 0 0 0 0 0 0 0 0 0 0 0 0
04/09/2015
Office of the Actuary
Centers for Medicare & Medicaid Services

Attachment 1
MEDICARE ACCESS AND CHIP REAUTHORIZATION ACT OF 2015 (H.R. 2)(In millions)
Fiscal Year Total,
Section Provision 2015 2016 2017 2018 2019 2020 2021 2022 2023 2024 2025 2015-19 2015-25
Subtitle B—Other Offsets
411 Medicare payment updates for post-acute providers
Part A 0 0 0 -1,150 -1,380 -1,480 -1,610 -1,800 -1,910 -2,020 -2,240 -2,530 -13,590
Part B 0 0 0 -160 -270 -290 -320 -360 -380 -400 -440 -430 -2,620
Part B, net of premium offset 0 0 0 -120 -200 -220 -240 -270 -290 -300 -330 -320 -1,970
412 Delay in reduction to Medicaid DSH allotments 0 0 1,120 2,330 1,510 640 -180 -930 -1,840 -3,320 -6,520 4,960 -7,190
413 Levy on delinquent providers 0 0 0 0 0 0 0 0 0 0 0 0 0
414 Adjustments to inpatient hospital payment rates
Part A 0 0 0 -4,540 -4,750 -3,960 -2,990 -1,930 -670 -500 -530 -9,290 -19,870
Title V—Miscellaneous
Subtitle A—Protecting the Integrity of Medicare
501 Prohibition of inclusion of Social Security account numbers on Medicare cards
Part A 13 49 49 49 0 0 0 0 0 0 0 160 160
Part B 13 49 49 49 0 0 0 0 0 0 0 160 160
Part B, net of premium offset 10 40 40 40 0 0 0 0 0 0 0 130 130
502 Prevent wrongful Medicare payments for items and services furnished to
incarcerated individuals, individuals not lawfully present, and deceased
individuals 0 0 0 0 0 0 0 0 0 0 0 0 0
503 Consideration of measures regarding Medicare beneficiary smart cards 0 0 0 0 0 0 0 0 0 0 0 0 0
504 Modifying Medicare durable medical equipment face-to-face-encounter
documentation requirement 0 0 0 0 0 0 0 0 0 0 0 0 0
505 Reducing improper Medicare payments 0 0 0 0 0 0 0 0 0 0 0 0 0
506 Improving senior Medicare patrol and fraud reporting rewards 0 0 0 0 0 0 0 0 0 0 0 0 0
507
Requiring valid prescriber National Provider Identifiers on pharmacy claims 0 0 0 0 0 0 0 0 0 0 0 0 0
508 Options to receive Medicare Summary Notice electronically 0 0 0 0 0 0 0 0 0 0 0 0 0
509 Renewal of MAC contracts 0 0 0 0 0 0 0 0 0 0 0 0 0
510 Study on pathway for incentives to States for State participation in Medicaid
data match program 0 0 0 0 0 0 0 0 0 0 0 0 0
511 Guidance on application of Common Rule to clinical data registries 0 0 0 0 0 0 0 0 0 0 0 0 0
512 Eliminating certain civil monetary penalties; gainsharing study and report 0 0 0 0 0 0 0 0 0 0 0 0 0
513 Modification of Medicare home health surety bond condition of participation
requirement 0 0 0 0 0 0 0 0 0 0 0 0 0
514 Oversight of Medicare coverage of manual manipulation of the spine to
correct subluxation 0 0 0 0 0 0 0 0 0 0 0 0 0
515 National expansion of prior authorization model for repetitive scheduled non-
emergent ambulance transport 0 0 0 0 0 0 0 0 0 0 0 0 0
516 Repealing duplicative Medicare secondary payor provision 0 0 0 0 0 0 0 0 0 0 0 0 0
517 Plan for expanding data in annual CERT report 0 0 0 0 0 0 0 0 0 0 0 0 0
518 Removing funds for Medicare Improvement Fund added by IMPACT Act of
2014 0 0 0 0 0 0 0 0 0 0 0 0 0
519 Rule of consideration 0 0 0 0 0 0 0 0 0 0 0 0 0
04/09/2015
Office of the Actuary
Centers for Medicare & Medicaid Services

Attachment 1
MEDICARE ACCESS AND CHIP REAUTHORIZATION ACT OF 2015 (H.R. 2)(In millions)
Fiscal Year Total,
Section Provision 2015 2016 2017 2018 2019 2020 2021 2022 2023 2024 2025 2015-19 2015-25
Subtitle B—Other Provisions
521 Extension of two-midnight PAMA rules on certain medical review activities 0 0 0 0 0 0 0 0 0 0 0 0 0
522 Requiring bid surety bonds and State licensure for entities submitting bids
under the Medicare DMEPOS competitive acquisition program 0 0
523 Payment for global surgical packages
Part B 0 0 20 160 190 210 220 230 230 240 250 370 1,750
Part B, net of premium offset 0 0 20 120 150 160 160 170 180 180 190 290 1,330
524 Extension of Secure Rural Schools and Community Self-Determination Act of
2000 0 0 0 0 0 0 0 0 0 0 0 0 0
525 Exclusion from PAYGO scorecards 0 0 0 0 0 0 0 0 0 0 0 0 0
A 0 in any line above means either no impact or negligible impact (< $5 million)
The Medicare provisions that affect fee-for-service benefits also reflect the resulting impact on payments to private health plans.
Interaction between the proposals is not fully reflected.
SUMMARY OF IMPACTS OF H.R. 2
Part A 241 703 833 -5,551 -6,130 -5,440 -4,600 -3,730 -2,580 -2,520 -2,770 -9,905 -31,545
Part B 6,331 14,363 14,613 13,749 15,390 20,950 22,910 24,830 25,410 25,430 26,200 64,445 210,175
Part B net of premium 6,110 11,110 8,610 9,270 10,740 15,510 16,940 18,440 18,850 18,890 20,180 45,840 154,650
Part D 0 0 0 -40 -40 -140 -190 -210 -250 -270 -270 -80 -1,410
Part D net of premium 0 0 0 0 0 0 0 0 0 0 0 0 0
Part D net of premium and clawback 0 0 0 0 0 0 0 0 0 0 0 0 0
Part B income1
0 0 0 -610 -920 -2,890 -3,810 -4,250 -4,750 -5,320 -5,920 -1,530 -28,470
Part D income1
0 0 0 -120 -190 -650 -860 -970 -1,070 -1,180 -1,300 -310 -6,340
Medicaid/CHIP 528 1,438 10,063 10,278 2,868 2,203 1,548 958 218 -1,072 -4,072 25,176 24,959
Health insurance marketplaces 20 -130 -3,780 -3,370 -235 -380 -450 -485 -520 -555 -590 -7,495 -10,475
TOTAL IMPACT OF H.R. 2
Net Medicare benefits 6,351 11,813 9,443 3,719 4,610 10,070 12,340 14,710 16,270 16,370 17,410 35,935 123,105
Total income 0 0 0 -730 -1,110 -3,540 -4,670 -5,220 -5,820 -6,500 -7,220 -1,840 -34,810
Net Medicare impact 6,351 11,813 9,443 2,989 3,500 6,530 7,670 9,490 10,450 9,870 10,190 34,095 88,295
Medicaid/CHIP 528 1,438 10,063 10,278 2,868 2,203 1,548 958 218 -1,072 -4,072 25,176 24,959
Health insurance marketplaces 20 -130 -3,780 -3,370 -235 -380 -450 -485 -520 -555 -590 -7,495 -10,475
1The income-related premium provision results in higher premium income for Part B and Part D, which is used to reduce transfers from the general fund of the Treasury.
04/09/2015
Office of the Actuary
Centers for Medicare & Medicaid Services