oasis™ dcie – indirect evaporative cooler · evaporative cooler in comparison to other suitable...
TRANSCRIPT

Cundall Singapore Pte Ltd 1 Grange Road Orchard Building #06-02 Singapore 239693 www.cundall.com
Oasis™ DCiE – Indirect Evaporative Cooler
Product Engineering Review – Desktop Energy and Water Study
Job No: 1012111
Latest Revision: C
Date: 11/11/2015

Munters Oasis™ – Indirect Evaporative Cooler – Desktop Energy and Water Study i
Rev: C
Document Revision History
Revision Ref Issue Date Purpose of issue / description of revision
- 23/10/2015 First issue
A 27/10/2015 Updated following peer review from Munters
B 28/10/2015 Updated to include Kuala Lumpur, Malaysia
Document Validation (latest issue)
Project Name: Oasis™ – Indirect Evaporative Cooler
Client: Munters
Report Title: Product Engineering Review – Energy and Water Desktop Study
Job Number: 1012111
Revision
C
Issue Date
11/11/2015
Purpose of issue / description of revision / version
Revised layout and minor edits.
Prepared by Checked by Verified by
Initials DC AB ME
Signature
© This report is the copyright of Cundall Johnston & Partners LLP. It has been prepared for the sole and confidential use of Munters and cannot be reproduced in whole or in part or relied upon or used by any third party without the express written authorisation of Cundall Johnston & Partners LLP. If any third party whatsoever comes into possession of this report, they rely on it at their own risk and Cundall accepts no duty or responsibility (including in negligence) to any such third party.

Munters Oasis™ – Indirect Evaporative Cooler – Desktop Energy and Water Study ii
Rev: C
Executive Summary
Cundall has been engaged by Munters to provide a Product Engineering Review of the Oasis™ Indirect Evaporative Cooler in comparison to other suitable technologies in East Asia, South East Asia and Australia. This report will focus on the operational energy and water cost impacts of the systems whilst also discussing the products operation, capital cost requirements and design considerations. The Munters Oasis™ Indirect Evaporative Cooler has been assessed against a standard chiller with CRAHs, free cooling air cooled chiller, water cooled chiller and Direct Air Optimisation.
The Oasis™ Indirect Evaporative Cooler system has been designed specifically for data centres with energy efficiency as the central driver. The unit takes advantage of the cooling effect created by evaporation of water (liquid) to vapour, and the updated permissible supply air conditions published by ASHRAE. The system uses an air to air heat exchanger that is combined with the following functions, with the set points based on the rooms supply and return air conditions:
Low ambient (Dry) - Air to air heat exchange Low ambient (Wet) - Air to air heat exchange with evaporative cooling Medium ambient - Air to air heat exchange with evaporative and mechanical cooling High ambient – Recirculation mode with mechanical cooling
The Oasis™ Indirect Evaporative Cooler has been developed following the principles of Indirect Air Optimisation (IAO) cooling. It incorporates a patented evaporative polymer heat exchanger system that uses evaporative cooling and keeps data hall and outside air separated.
The Oasis™ Indirect Evaporative Cooler overcomes the inherent inefficiencies of a chilled water system that arise from the gas to liquid to gas heat exchanges and the necessity to circulate an intermediate cooling medium. The unit has also been designed to deliver air at increased supply temperatures to maximise ambient cooling.
The system can incorporate a back-up mechanical cooling system to be used when external ambient conditions rise above the temperature at which air can be delivered to the servers within permissible levels. DAO has been the first derivative of this technology to gain market acceptance. The primary reasons why attention has shifted to IAO are humidity control and the risk of external contaminants.

Munters Oasis™ – Indirect Evaporative Cooler – Desktop Energy and Water Study iii
Rev: C
The key benefits of the Munters Oasis™ Indirect Evaporative Cooler are as follows:
Operational energy savings, leading to annual operational cost savings.
Peak electrical demand savings, leading to annual operational cost savings and capital cost savingsin electrical support systems.
Operational water savings when compared to water cooled chillers, leading to annual operationalcost savings.
Low PUE allowing effective marketing to energy conscious clients
Reduced contamination potential when compared to a Direct Air Optimisation system.
Effective in the implementation of a modular stage by stage design allowing deferred commitment ofcapital costs.
Low maintenance requirements as compared to Direct Air Optimisation.
A summary of the locations assessed and the operational costs savings compared is shown below. This analysis is based on a nominal data hall with 720kW capacity with the savings showing the utility, electricity and water, cost reductions compared to water cooled chillers with CHARs.

Munters Oasis™ – Indirect Evaporative Cooler – Desktop Energy and Water Study iv
Rev: C
Contents
Introduction ......................................................................................................................................... 1
1.1 Background .............................................................................................................................................................................. 1
1.2 Product Overview ..................................................................................................................................................................... 1
1.3 Site Considerations .................................................................................................................................................................. 4
Data Centre Cooling Strategies ......................................................................................................... 7
2.1 ASHRAE Compliance ............................................................................................................................................................... 7
2.2 Efficiency Demands .................................................................................................................................................................. 8
2.3 Data Hall Contamination ........................................................................................................................................................... 9
2.4 Data Centre Cooling Methods ................................................................................................................................................. 10
2.5 Indirect Air Optimisation.......................................................................................................................................................... 11
2.6 IAO Using Munters Oasis ....................................................................................................................................................... 12
Capital Costing .................................................................................................................................. 14
Operational Costs ............................................................................................................................. 15
4.1 Harbin (HeiLongJiang), China ................................................................................................................................................. 16
4.2 Urumqi (Xinjiang), China ......................................................................................................................................................... 18
4.3 Hohhot, Inner Mongolia .......................................................................................................................................................... 20
4.4 Beijing, China ......................................................................................................................................................................... 22
4.5 Shijiazhuang (HeBei), China ................................................................................................................................................... 24
4.6 Tokyo, Japan .......................................................................................................................................................................... 26
4.7 Zhengzhou (Henan), China .................................................................................................................................................... 28
4.8 Nanjing (Jiangsu), China ........................................................................................................................................................ 30
4.9 Chongqing, China ................................................................................................................................................................... 32
4.10 Shanghai, China ..................................................................................................................................................................... 34
4.11 Wuhan (Hubei), China ............................................................................................................................................................ 36
4.12 Hangzhou (ZheJiang), China .................................................................................................................................................. 38
4.13 Guangzhou (Guangdong), China ............................................................................................................................................ 40
4.14 Hong Kong, SAR, PRC ........................................................................................................................................................... 42
4.15 Manila, Philippines.................................................................................................................................................................. 44
4.16 Kuala Lumpur, Malaysia ......................................................................................................................................................... 46
4.17 Singapore, Singapore ............................................................................................................................................................. 48
4.18 Perth, Australia ....................................................................................................................................................................... 50
4.19 Sydney, Australia ................................................................................................................................................................... 52
4.20 Melbourne, Australia ............................................................................................................................................................... 54
Conclusions ....................................................................................................................................... 56
Appendix A: - Basis of Calculations .......................................................................................................... 59
Appendix B: - Unit Selection and Application........................................................................................... 66
Appendix C: - Weather Profiles .................................................................................................................. 73
Appendix D: - References ........................................................................................................................... 93

Munters Oasis™ – Indirect Evaporative Cooler – Desktop Energy and Water Study 1
Rev: C
Introduction
1.1 Background
This document describes the technical theory behind Indirect Air Optimisation (IAO), with specific reference to the Munters Oasis™ Indirect Evaporative Cooler (IEC). This is an alternative to the traditional data centre cooling arrangement that consists of a chilled water system utilising chillers and CRAC units.
The primary function of this document is to provide a comparative engineering review of the Oasis product and its modes of operation, with reference to operating energy and water consumption.
This report will cover the following items:
1. Introduction to the Munters Oasis™ unit.
2. Discussion on data centre cooling options and the background information to it effectiveness.
3. Capital Cost analysis for Singapore.
4. Operational energy and cost analysis for 20 locations.
The report then summarises the conclusions and provides supporting information in the appendices.
1.2 Product Overview
Indirect Air Optimisation, IAO (equally known as air-side economisation) is a strategy that utilises the cooling effect of air that is saturated to various levels. “Economisers are cooling technologies that take advantage of favourable outdoor conditions to provide partial or full cooling without using the energy of a refrigeration cycle”i
The Oasis™ Indirect Evaporative Cooler has been designed in response to the demand from data centre owners and operators for a highly efficient cooling strategy. A number of factors including energy costs, environmental policy and increasing IT densities has triggered a shift from traditional chilled water systems.
The Oasis™ Indirect Evaporative Cooler system has been designed specifically for data centres with energy efficiency as the central driver. The unit takes advantage of the cooling effect created by evaporation of water (liquid) to vapour, and the updated permissible supply air conditions published by ASHRAE in TC9.9. The system uses an air to air heat exchanger that is combined with the following functions, with the set points based on the rooms supply and return air conditions:
Low ambient (Dry) - Air to air heat exchange Low ambient (Wet) - Air to air heat exchange with evaporative cooling Medium ambient - Air to air heat exchange with evaporative and mechanical cooling High ambient – Recirculation mode with mechanical cooling

Munters Oasis™ – Indirect Evaporative Cooler – Desktop Energy and Water Study 2
Rev: C
Figure 1: Psychometric weather data for Shanghai, China, showing the different cooling methods.
In recent years a number of IAO cooling units have come to market promising reduced Power Usage Effectiveness (PUE) figures by reducing the energy losses consumed by mechanical plant. PUE is a metric used to determine the energy efficiency of a data centre. PUE is determined by dividing the amount of power entering a data centre by the power used to run the computer infrastructure within it.
This method of cooling has emerged as a development from direct air optimised (DAO) cooling. In many locations with favourable climate DAO remains a credible method of cooling, however, IAO has the added advantage of circulating the data hall process air in a sealed environment, therefore reducing the risk of external contamination and humidity control issues. IAO systems also have less stringent filtration requirements that reduces both the static pressure loss of fans and maintenance requirements.
The Oasis™ Indirect Evaporative Cooler has been developed following the principles of IAO cooling. It incorporates a patented evaporative polymer heat exchanger system that uses evaporative cooling and keeps data hall and outside air separated.
Where ambient conditions dictate a need for supplementary cooling, the Oasis™ Indirect Evaporative Cooler will be fitted with inbound cooling coils from either centralised chilled water or unitised direct expansion. The coil could be sized to meet the ASHRAE extreme peak conditions for ambient wet and dry bulb temperatures as opposed to the peak conditions for added resiliency.
0.0
10.0
20.0
30.0
40.0
50.0
-10.0 0.0 10.0 20.0 30.0 40.0 50.0
MO
ISTU
RE
CO
NTE
NT
(G W
ATE
R/K
G D
RY
AIR
)
DRY BULB TEMPERATURE (DEG C)
Medium ambient -Partial Free Cooling
Low ambient (wet) -100% Free Cooling
High ambient -No Free Cooling
Low ambient (dry) -100% Free Cooling

Munters Oasis™ – Indirect Evaporative Cooler – Desktop Energy and Water Study 3
Rev: C
Figure 2: Schematic of the key IAC components.
Figure 3: 3D representation of an Oasis™ unit, with key features labelled.
The Oasis™ Indirect Evaporative Cooler overcomes the inherent inefficiencies of a chilled water system that arise from the gas to liquid to gas heat exchanges and the necessity to circulate an intermediate chilled water cooling medium. The unit has also been designed to deliver air at increased supply temperatures to maximise ambient cooling, particularly where elevated data hall temperatures can be achieved.
Both DAO and IAO systems can incorporate a back-up mechanical cooling system to be used when external ambient conditions rise above the temperature at which air can be delivered to the servers within permissible tolerances. DAO has been the first derivative of this technology to gain market acceptance. The primary reasons why attention has shifted to IAO are humidity control and the risk of external contaminants.

Munters Oasis™ – Indirect Evaporative Cooler – Desktop Energy and Water Study 4
Rev: C
1.3 Site Considerations
This report will consider the operating characteristics of the Oasis™ Indirect Evaporative Cooler in a typical data centre application. This report covers the following major cities throughout East Asia, South East Asia and Australia:
1. Harbin (HeiLongJiang), China2. Urumqi (Xinjiang), China3. Hohhot, Inner Mongolia4. Beijing, China5. Shijiazhuang (HeBei), China6. Tokyo, Japan7. Zhengzhou (Henan), China8. Nanjing (Jiangsu), China9. Chongqing, China10. Shanghai, China
11. Wuhan (Hubei), China12. Hangzhou (ZheJiang), China13. Guangzhou (Guangdong), China14. Hong Kong, Hong Kong15. Manila, Philippines16. Kuala Lumpur, Malaysia17. Singapore, Singapore18. Perth, Australia19. Sydney, Australia20. Melbourne, Australia
The Oasis™ Indirect Evaporative Cooler system is designed to be applied throughout the world. The operational efficiency will be dependent on local ambient conditions. The governing factor that determines the units mode of operation is the ambient wet bulb (WB) temperature. The wet bulb temperature is the lowest temperature that can be reached by the evaporation of water, most commonly encountered on wet skin when you sweat.
When water evaporates, or changes state from a liquid to a gas, the discharge of the gas also takes an amount of heat with it. The result is a decreased amount of heat and thus decreased temperature in the surface. In dry air there is a lower moisture content and therefore greater potential for evaporative cooling, a process that adds moisture to the air to increase its relative humidity and decreases the corresponding achievable dry bulb temperature.
In hot humid climates with a high relative humidity, the air becomes fully saturated reducing the effect of evaporative cooling. At this point mechanical cooling is activated to supplement the required cooling.
Weather data used for analysis has been taken from hourly records downloaded from the US Department of Energy in EnergyPlus weather format. This weather data utilises 10 years of actual weather data to provide average conditions which also represents minimum and maximum conditions accurately.
Location Typical Temperature Profile 1. Harbin
(HeiLongJiang),China
Temperature Conditions: Ambient dry bulb temperatures are commonly between -28°C and 30°C, with maximum dry bulb temperatures of 35°C. The wet bulbtemperature follows a similar temperature profile with maximum of 27°C WB.Free Cooling Potential: 95%Partial Free Cooling Potential: 5%
2. Urumqi(Xinjiang), China
Temperature Conditions: Ambient dry bulb temperatures are commonly between -20°C and 31°C, with maximum dry bulb temperatures of 35°C. The wet bulbtemperature remains much lower with dry air coinciding with high temperatures,the maximum wet bulb temperature is 20°C.Free Cooling Potential: 100% Partial Free Cooling Potential: 0%
3. Hohhot, InnerMongolia
Temperature Conditions: Ambient dry bulb temperatures are commonly between -18°C and 31°C, with maximum dry bulb temperatures of 35°C. The wet bulbtemperature follows a similar temperature profile with maximum of 25°C WB.Free Cooling Potential: 99%Partial Free Cooling Potential: 1%

Munters Oasis™ – Indirect Evaporative Cooler – Desktop Energy and Water Study 5
Rev: C
Location Typical Temperature Profile 4. Beijing, China Temperature Conditions: Ambient dry bulb temperatures are commonly between
-10°C and 35°C, with maximum dry bulb temperatures of 37°C. The wet bulbtemperature follows a similar temperature profile shifted by 5°C with maximum of31°C WB.Free Cooling Potential: 85% Partial Free Cooling Potential: 15%
5. Shijiazhuang(HeBei), China
Temperature Conditions: Ambient dry bulb temperatures are commonly between -7°C and 34°C, with maximum dry bulb temperatures of 38°C. The wet bulbtemperature follows a similar temperature profile with maximum of 29°C WB.Free Cooling Potential: 85%Partial Free Cooling Potential: 15%
6. Tokyo, Japan Temperature Conditions: Ambient dry bulb temperatures are commonly between -5°C and 25°C, with maximum dry bulb temperatures of 35°C. The wet bulbtemperature follows a similar temperature profile with maximum of 30°C WB.Free Cooling Potential: 86%Partial Free Cooling Potential: 14%
7. Zhengzhou(Henan), China
Temperature Conditions: Ambient dry bulb temperatures are commonly between -5°C and 34°C, with maximum dry bulb temperatures of 37°C. The wet bulbtemperature follows a similar temperature profile with maximum of 30°C WB.Free Cooling Potential: 81%Partial Free Cooling Potential: 19%
8. Nanjing(Jiangsu), China
Temperature Conditions: Ambient dry bulb temperatures are commonly between -2°C and 34°C, with maximum dry bulb temperatures of 37°C. The wet bulbtemperature follows a similar temperature profile with maximum of 27°C WB.Free Cooling Potential: 76%Partial Free Cooling Potential: 24%
9. Chongqing,China
Temperature Conditions: Ambient dry bulb temperatures are commonly between 5°C and 35°C, with maximum dry bulb temperatures of 37°C. The wet bulb temperature follows a similar temperature profile with maximum of 27°C WB. Free Cooling Potential: 70% Partial Free Cooling Potential: 30%
10. Shanghai, China Temperature Conditions: Ambient dry bulb temperatures are commonly between 1°C and 33°C, with maximum dry bulb temperatures of 36°C. The wet bulb temperature follows a similar temperature profile with maximum of 30°C WB. Free Cooling Potential: 73% Partial Free Cooling Potential: 27%
11. Wuhan (Hubei),China
Temperature Conditions: Ambient dry bulb temperatures are commonly between -1°C and 35°C, with maximum dry bulb temperatures of 38°C. The wet bulbtemperature follows a similar temperature profile with maximum of 31°C WB.Free Cooling Potential: 70%Partial Free Cooling Potential: 30%
12. Hangzhou(ZheJiang),China
Temperature Conditions: Ambient dry bulb temperatures are commonly between 0°C and 35°C, with maximum dry bulb temperatures of 39°C. The wet bulb temperature follows a similar temperature profile with maximum of 30°C WB. Free Cooling Potential: 70% Partial Free Cooling Potential: 30%
13. Guangzhou(Guangdong),China
Temperature Conditions: Ambient dry bulb temperatures are commonly between 8°C and 25°C, with maximum dry bulb temperatures of 34°C. The wet bulb temperature follows a similar temperature profile with maximum of 31°C WB. Free Cooling Potential: 50% Partial Free Cooling Potential: 50%

Munters Oasis™ – Indirect Evaporative Cooler – Desktop Energy and Water Study 6
Rev: C
Location Typical Temperature Profile 14. Hong Kong,
Hong KongTemperature Conditions: Ambient dry bulb temperatures are commonly between 11°C and 34°C, with maximum dry bulb temperatures of 35°C. The wet bulb temperature follows a similar temperature profile shifted lower by 2-3°C, with maximum of 28°C WB. Free Cooling Potential: 47% Partial Free Cooling Potential: 53%
15. Manila,Philippines
Temperature Conditions: Ambient dry bulb temperatures are commonly between 23°C and 34°C, with maximum dry bulb temperatures of 36°C. The wet bulb temperature is typically between 21°C and 29°C. Free Cooling Potential: 3% Partial Free Cooling Potential: 97%
16. Kuala Lumpur,Malaysia
Temperature Conditions: Ambient dry bulb temperatures are commonly between 23°C and 33°C, with maximum dry bulb temperatures of 35°C. The wet bulb temperature is typically between 23°C and 28°C. Free Cooling Potential: 0% Partial Free Cooling Potential: 100%
17. Singapore,Singapore
Temperature Conditions: Ambient dry bulb temperatures are commonly between 23°C and 33°C, with maximum dry bulb temperatures of 35°C. The wet bulb temperature is typically between 23°C and 28°C. Free Cooling Potential: 0% Partial Free Cooling Potential: 100%
18. Perth, Australia Temperature Conditions: Ambient dry bulb temperatures are commonly between 6°C and 31°C, with maximum dry bulb temperatures of 39°C. The wet bulb temperature follows a similar temperature profile shifter lower by 5°C, a maximum wet bulb temperature is much lower than the dry bulb at 25°C. Free Cooling Potential: 99% Partial Free Cooling Potential: 1%
19. Sydney,Australia
Temperature Conditions: Ambient dry bulb temperatures are commonly between 8°C and 28°C, with maximum dry bulb temperatures of 35°C. The wet bulb temperature follows a similar temperature profile shifter lower by 2-3°C, a maximum wet bulb temperature of 25°C is recorded. Free Cooling Potential: 96% Partial Free Cooling Potential: 4%
20. Melbourne,Australia
Temperature Conditions: Ambient dry bulb temperatures are commonly between 6°C and 30°C, with maximum dry bulb temperatures of 39°C. The wet bulb temperature follows a similar temperature profile shifted lower by 2-3°C, a maximum wet bulb temperature is much lower than the dry bulb at 24°C. Free Cooling Potential: 100% Partial Free Cooling Potential: 0%
A complete set of weather data is shown in Appendix C: - Weather Profiles.

Munters Oasis™ – Indirect Evaporative Cooler – Desktop Energy and Water Study 7
Rev: C
Data Centre Cooling Strategies
This section starts by outlining the background which makes IAO achievable before discussing the traditional ideas of data centre cooling, followed by the concept of IAO. As part of this review the operation of the Oasis product and its efficiency is assessed in accordance with Test Reference Year (TRY) weather data.
2.1 ASHRAE Compliance
Before discussing the different cooling options and in particular the Munters Oasis™ unit and its application to data centres in more detail, this section sheds more light on the ASHRAE recommended thermal conditions in Data Processing Environments.
Mission critical data centres necessitate stringent environmental control to meet the ‘Class A1’ ASHRAE guidelines. It is therefore widely accepted that the equipment air intake temperatures be maintained within the Class A1 ASHRAE bands defined in Figure 4.
Figure 4: ASHRAE 2011 Environmental Classes for Data Centres
Taking a closer look at the guidelines for data processing environments, one can extract the ‘Reliability’ range of server air intake temperatures that is 18-27°C DB at 5.5°C dew point to 60% RH as shown in the ‘Recommended Envelope’ region in Figure 4. In the event of a cooling failure within the facility, ASHRAE defined the ‘allowable’ range of server air intake temperatures, 15-32°C, that may be encountered by the IT equipment for short periods in the event of system failure. It is required that the design satisfies the former band of temperatures during normal operation of the data centre, and maintains compliance with the maximum rate of change of 5°C and 5% RH per hour. These guidelines apply to IT equipment installed in all sizes of data centres, regardless of the cooling strategies adopted.
The TRY weather profile for Beijing, China is displayed on the Psychometric chart in Figure 5. Also plotted on the figure are the regions that define the operation of a typical DAO system. As can be seen, the Beijing weather profile indicates a wide ranging climate with temperatures peaking above 35°C for a few hours of the year. Note the figure indicates that the number of hours whereby the external ambient conditions satisfy ‘Class

Munters Oasis™ – Indirect Evaporative Cooler – Desktop Energy and Water Study 8
Rev: C
1’ are limited, and that if DAO was to be implemented here, for a large number of hours during the year the ambient air would need to be put through a humidifier and subsequently mixed with data hall return air to achieve the ‘Class 1’ operating conditions. The data also indicates that for a number of hours during the year, a supplementary mechanical cooling and dehumidification system is required.
The data in Figure 5, may however favour the implementation of IAO. This is explored in more detail in Section 2.6, where the same psychometric analysis is illustrated for the application of the Munters product in this region.
Figure 5: TRY Weather Data for Beijing, China and the implications of applying DAO in this region. The data is plotted on a Psychometric chart that is overlaid with the ASHRAE ‘Class 1’ Zone.
2.2 Efficiency Demands
It has been recognised that the power consumption of data centres is climbing steadily to meet the growing demands data storage and processing.
Figure 6: Data Centre growth worldwide, focusing on Australasiaii
2012 2013 Increase36,245 38,840 7%
9,750 10,375 6%2,380 2,740 15%
10,810 11,550 7%12,705 13,470 6%
600 705 18%
220 255 16%100 110 10%930 1,020 10%
1,560 1,700 9%3,950 4,300 9%1,250 1,300 4%
Australasia 1,420 1,380 -3%Hong Kong 320 310 -3%
IndonesiaSingaporeChina (PRC)Other MarketsIndia
LocationGlobal
Asia PacificLatin America
EuropeMEA
Malaysia
North America

Munters Oasis™ – Indirect Evaporative Cooler – Desktop Energy and Water Study 9
Rev: C
The cost of power is rising and is set to climb further as fossil fuels become depleted and carbon taxation climbs. Both of these factors are contributing to a drive to lower data centre power consumption and eliminate mechanical and electrical losses.
A range of technologies are now available to lower the losses associated with electrical distribution, UPS’s, data hall configuration and heat dissipation systems. Economisers have been recognised as a key technology in this drive to lower PUE by eliminating the refrigeration cycle (for all but extreme design conditions). It is possible to build a data centre that can operate within ASHRAE ‘Class 1’ set points using IAO that does not require mechanical cooling in many regions of the worldiii.
A number of major air handling equipment and refrigeration manufacturers such as Munters have product offerings to meet this growing demand. The majority of these designs are based around the same principle of air to air heat exchange with evaporative cooling and mechanical cooling backup.
Considering the benefits of IAO, take-up has been relatively limited due to misunderstandings of how to correctly apply the technology, unfamiliarity and high initial costs. IAO does offer a more scalable source of cooling that is better suited to modern demands for modular ‘just in time’ data centres whilst providing minimal maintenance requirements.
As existing wholesale data centre stock becomes occupied, and developers look to expand their portfolio, it is the scalability of IAO, amongst many other reasons, that is making the technology more attractive than traditional chilled water. Once the building shell and basic infrastructure has been installed, cooling units can be procured and installed as the IT load increases. This is also true for chilled water but the initial investment can be higher due to increased peak capacities.
2.3 Data Hall Contamination
Contamination of the data hall environment is a constant threat to data centre operations. The impacts of the contamination can range from a decrease in energy efficiency to a catastrophic failure. Contamination comes in two forms; particulate matter and gaseous.
External sources of contamination include vehicle exhausts, by-products from electricity generation, sea salt, natural and artificial fibres, plant pollens and wind-blown dust. Contaminating gases occur naturally or result from industrial processes. They can either act alone or together with other gases or particulate matter, forming compounds that oxidise metallic materials.
These contaminates can enter through the data hall though air conditioning, open doors, on clothing and any other items brought into the room.
Some cities and countries in Asia contain the highest air pollution levels in the world, with China of particular note. It is therefore critically important to consider methods of reducing the ingress of contamination in association with constant cleaning and operational practices.
The fact that the IAO does not utilise the outside air directly in the process maintains the same level of contaminate exposure as a tradition chiller and CRAH arrangement. Conversely a DAO system would utilise fresh air directly where ambient conditions arise, adding potential contamination to the data hall.
In 2011 ASHRAE released a whitepaper on Gaseous and Particulate Contamination Guidelines For Data Centers. It describes the risk to IT Equipment in data centres facilities that may have harmful environments resulting from the ingress of outdoor particulate and/or gaseous contamination. The document stated that for a small number of data centers, located mostly in the emerging markets, contamination can be a serious risk, and it provided insight into how to manage the contamination risk.

Munters Oasis™ – Indirect Evaporative Cooler – Desktop Energy and Water Study 10
Rev: C
Figure 7: Global air pollution (PM2.5 levels)iv
2.4 Data Centre Cooling Methods
The increasing power consumption of data centres in today’s market is well documented. In all cases the majority of data centre power is used to power the IT cabinets and data centre cooling plant. With high density blade servers being commonly implemented inside racks, it is not uncommon to find that the temperature rise across the inlet-outlet faces of a particular server approaches 12-14°C (i.e. 26°C IN, 38°C OUT), although some manufacturers are quoting much higher allowable ∆T’s. In more traditional data centres operating in full recirculation mode with CRAC/CRAHs, a considerable amount of energy is required to cool this hot exhaust air by 12-14°C. This traditional concept with CRAC/CRAHs, chillers and pumps is demonstrated in Figure 8. The inherent inefficiencies of a chilled water system come from the movement of three bodies of heat transfer medium (air, water and air), and the efficiency losses when transferring from one to the other. The introduction of a chiller refrigeration circuit exaggerates this effect further.
Figure 8: Traditional cooling utilising chillers and CRAHs
Fresh air cooling (i.e. no mechanical cooling) presents a viable option in favourable climates, to reduce data centre power consumption, that moves on from the concept of closed circuit cooling (mechanical cooling), to utilising fresh air directly or indirectly to cool the space. DAO requires one medium of heat transfer and no heat exchanges (other than the heat exchange within the server). This type of system has been a precursor to IAO which requires two air mediums and one heat exchange.

Munters Oasis™ – Indirect Evaporative Cooler – Desktop Energy and Water Study 11
Rev: C
Figure 9: Direct fresh air optimised cooling, DAO
Following the ASHRAE (American Society of Heating, Refrigerating and Air-Conditioning Engineers) 2008 Technical Committee (TC 9.9) meeting, the extent of operating conditions for servers has been extended to allow for 18-27°C (DB), 5.5°C dew point to 60% Relative Humidity (RH), at the server intake. It should be noted at this point that ASHRAE has issued an update to this standard [2011] whereby the window for allowable operating conditions has been extended to allow higher temperatures for limited periods of time. The move to widen the envelope from the 2008 standard has increased the interest in air-side economisation schemes, as the method can drastically reduce power consumption of cooling systems, and so the also reduce the Power Usage Effectiveness (PUE) of data centres.
The concept behind an outside air cooling strategy has been feasible but not widely accepted, due to the uneconomical number of hours temperatures would be above set points and possible variations in humidity, until ASHRAE extended the environmental window as noted above. Some of the early adaptors of this strategy deployed DAO approaches whereby the air was directly supplied to the data hall once it has been filtered and treated. This fresh air cooling strategy has been employed by some leading industry figures such as Microsoft (Dublin facility)v, Googlevi and Yahoo (Lockport)vii, thus demonstrating that this type of strategy is viable. The uptake of this concept has been suppressed due to concern over reliability due to the number moving components, risk of an external contamination impacts, and an unwillingness to move away from proven methods. This has led to IAO being explored as a preferred cooling alternative.
A number of different solutions have been explored with DAO which are largely dependent of spatial availability and the form of the building; these are; 1) the top entry solution whereby all AHU/cooling plant are housed on the roof of the facility and air delivered into a room that employs a sealed hot aisle containment strategy, and 2) the side entry solution whereby air is delivered into the space from a wall zone (Figure 9). A third less frequent solution has also been implemented whereby air is delivered via a large floor void or plenum which is then used to pressurise a system of enclosed cold aisles.
2.5 Indirect Air Optimisation
In the present case with IAO, a modular solution with the Munters patented Oasis™ Evaporative Polymer Exchanger (EPX), as shown in Figure 10, is explored where the data hall remains a sealed entity. In essence the heat from the data hall return air is rejected through to the external ambient via an evaporative polymer tube air to air heat exchanger, and cooled down to a suitable temperature for re-delivery into the data hall.

Munters Oasis™ – Indirect Evaporative Cooler – Desktop Energy and Water Study 12
Rev: C
Figure 10: The application of Indirect Air Optimisation with Hot Aisle Containment (IAO).
2.6 IAO Using Munters Oasis
Based on information supplied by the manufacturer, it can be seen in Figure 11 that the majority of operating hours of the Oasis™ Indirect Evaporative Cooler will require evaporative cooling or a combination of evaporative and mechanical cooling. Below approximately 22°C WB, the air is cold enough to cool the data centre through the polymer heat exchanger without supplementary mechanical cooling. The 22°C WB temperature at which mechanical cooling has to be engaged will depend on the local climate, however the ‘top-up’ cooling is used to supplement the evaporative system.
It is important to note that the mechanical cooling top-up is different from the DAO system whereby the mechanical cooling needs to be sized to accommodate the full cooling load whilst operating in the recirculation mode.
Figure 11:TRY Weather Data for Beijing and the Implications of Applying Evaporative Cooling with Oasis in this Region.
0.0
10.0
20.0
30.0
40.0
50.0
-10.0 0.0 10.0 20.0 30.0 40.0 50.0
MO
ISTU
RE
CO
NTE
NT
(G W
ATE
R/K
G D
RY
AIR
)
DRY BULB TEMPERATURE (DEG C)
Medium ambient -Partial Free Cooling
Low ambient (wet) -100% Free Cooling
High ambient -No Free Cooling
Low ambient (dry) -100% Free Cooling

Munters Oasis™ – Indirect Evaporative Cooler – Desktop Energy and Water Study 13
Rev: C
IAO using the Oasis™ Indirect Evaporative Cooler will eliminate the problems associated with external humidity entering the system. By segregating the air path into two separate circuits through a polymer tube heat exchanger, internal conditions can be closely controlled and external air humidity can be utilised in the cooling process. Typically, a large percentage of the power used by DAO and IAO systems is attributed to fan power. DAO fans are used to draw external air through extensive filter banks, coils and dampers into the data hall with an additional fan used for extract. IAO fans are employed to move air through the heat exchanger, into the data hall and back to the IAO unit. External air is forced through the other side of the polymer tube heat exchanger and exhausted without treatment. An energy balance between the two air movement systems (DAO forcing air through extensive filters, IAO forcing air through both sides of a heat exchanger) can be a point of debate, with IAO having the additional benefits of humidity and pollutant segregation.
Any energy calculation comparing DAO and IAO also needs to take into account the excess energy consumed by either humidifying or dehumidifying the air. Subsequently, any cost analysis needs to consider the evaporated water costs and associated storage infrastructure.

Munters Oasis™ – Indirect Evaporative Cooler – Desktop Energy and Water Study 14
Rev: C
Capital Costing
These costs are for guidance only and relate to the hypothetical 720kW test case, with prices provided for Singapore.
For Indirect Air Optimisation using Oasis™ Indirect Evaporative Coolers, the costs relate to 5no. units for data hall cooling, 2 no. smaller Oasis™ Indirect Evaporative Coolers for UPS room cooling, and 4 water storage tanks in a 2N arrangement. The Chilled Water option refers to a system with 3no. free cooling air cooled chillers, 14 CRAC units for data hall and UPS room cooling and a packaged pump room with secondary pumps, primary pumps, buffer vessels, and water treatment plant. The table below details the capital cost of the key cooling plant for each of the options considered.
System Description Main Cooling Plant
Unit Cost (SGD $)
Total Cost (SGD $)
Oasis™ Indirect Evaporative Cooler
DCIE Oasis unit (×6) DCIE Oasis units for support spaces (×2) MUA/pressurisation AHU (x1) Ductwork Water storage for 2no. tanks Total
$250,000 $250,000
$45,000 $80,000 $45,000
$1,500,000 $500,000
$45,000 $80,000 $90,000
$2,215,000
Water Cooled Chilled Water with CRAH
Chillers (×3) Heat Rejection (x3) CRAC units (×14) Pumps, Pipework & Ancillaries Fresh Air AHU (x1) Total
$120,000 $35,000
$880,000 $45,000
$360,000 $105,000 $560,000 $880,000
$45,000 $1,950,000
Although the cost figures for the mechanical elements of the different options are similar, the increased power requirements for chilled water will result in the requirement of a larger electrical support infrastructure (larger Generators and UPS plant), including greater spatial take and increased capital costs for these options. Within the location by location results the peak electrical capacity is also shown, this reduction in electrical capacity will inform the support infrastructure savings, refer to Section 4.14 for further details of the potential savings. The cost savings from the reduced infrastructure can be considerable but depend highly on location and data hall redundancy levels. On a recent data centre project in US, the client was able to reduce incoming copper and size of generators by 20%.
The distribution system used for a chilled water system is inherently more intensive than an air optimised solution. Installing pipework, pumps, pressurisation equipment, valves, connecting and commissioning equipment is more costly in terms of programme, labour and materials.
IAO systems require ducted air distribution from the external cooling unit to the floor void or room, and a return from the hot aisles back to the cooling unit but this type of infrastructure is less extensive. This system is quicker, cheaper and simpler to install and requires minimal commissioning. With fewer constituent parts, single points of failure are reduced and on-going maintenance is simplified to a few moving parts. Commissioning of an IAO system, like a chilled water system, requires flushing and pressure testing. With fewer interfaces between heat transfer mediums, fewer systems need to be verified and the ASHRAE sequence of commissioning levels is reduced.
The Munters Oasis™ unit is delivered pre-commissioned and tested. Final connection of the electrical power distribution system completes cooling system install, ready for calibration.

Munters Oasis™ – Indirect Evaporative Cooler – Desktop Energy and Water Study 15
Rev: C
Operational Costs
The results below have been made for a number of locations including :
1. Harbin (HeiLongJiang), China2. Urumqi (Xinjiang), China3. Hohhot, Inner Mongolia4. Beijing, China5. Shijiazhuang (HeBei), China6. Tokyo, Japan7. Zhengzhou (Henan), China8. Nanjing (Jiangsu), China9. Chongqing, China10. Shanghai, China
11. Wuhan (Hubei), China12. Hangzhou (ZheJiang), China13. Guangzhou (Guangdong), China14. Hong Kong, Hong Kong15. Manila, Philippines16. Kuala Lumpur, Malaysia17. Singapore, Singapore18. Perth, Australia19. Sydney, Australia20. Melbourne, Australia
The calculation is based on the 720kW data hall (1000W/m²). The supply/return temperature is assumed to be 26/38°C for Munters Oasis™ option and for chilled water options (CHW temperature delta is 7°C). The Munters Oasis™ is cooled by in-built mechanical cooling whilst all other options are cooled by a centralised chillers of various configurations.
It is assumed for the purposes of this calculation that the data halls are fully loaded with the IT equipment and represents a static constant condition. It is assumed that load is uniformly distributed throughout the data hall.
The energy and water data given in the following sections are based on a theoretical model produced by Cundall to independently review energy consumption. The data can be seen as conservative when compared to Munters selection tool, see Appendix A: - Basis of Calculations. Cundall have been involved in operational performance testing of the Munters Oasis™ units under different ambient conditions to verify the accuracy of these calculations.
The flat characteristic of the standard air cooled chillers is a result of the relatively constant chiller efficiency regardless of the ambient conditions, whilst the major benefit from free-cooling chillers is expected during the cooler months. At the same time, free-cooling chiller efficiency is slightly lower than for standard air cooled chillers during design summer conditions and therefore their peak power consumption is higher. The DAO option provides a benefit over the standard air cooled chiller arrangement where ambient conditions allow.
The results indicate that the application of the Oasis™ Indirect Evaporative Cooler can bring significant energy savings over chillers thanks to reduced mechanical operating hours. On the other hand, the pressure drop on the process air fans is significant which results in relatively high specific fan power (SFP) energy consumption figures for the recirculation fans. The results show savings of between 37% in Singapore and 72% in Melbourne are achievable when compared to a water cooled chiller system.
All costs in the following sections are shown in the local currency.

Munters Oasis™ – Indirect Evaporative Cooler – Desktop Energy and Water Study 16
Rev: C
4.1 Harbin (HeiLongJiang), China
The annual energy consumption associated with the different cooling options is presented in the break down format in the table below, and is based on the key operational assumptions presented in Appendix A: - Basis of Calculations. The data has been gathered using TRY weather data for Harbin.
A graphical representation of the common data centre cooling systems electricity consumption is shown below, with a breakdown of energy consumption between cooling source, pumps and fans (CRAHs or IAO).
Standard Chillers
Free Cooling Chillers
Water Cooled Chillers
Direct Air Optimisation
Indirect Evaporative
Cooler1.39 1.25 1.23 1.10 1.070.00 0.00 1.92 0.93 0.68
Cooling Source(E) 1,646,921 746,318 435,567 136,133 9,257Fans 365,390 365,390 365,390 421,604 443,421CHW & CW Pumps 476,940 476,940 678,106 96,309 0Total 2,489,251 1,588,648 1,479,063 654,047 452,678HVAC Peak Power 306 337 293 306 82Savings(A) -4% -15% 0% -4% 72%Total(F) 0 0 12,130 5,874 4,297Savings(A) 100% 100% 0% 52% 65%Total 2,426,024 1,548,297 1,441,495 637,434 441,180Savings(A) -68% -7% 0% 56% 69%Energy (Cooling) 1,438,787 918,239 854,899 378,039 261,648Water (Cooling) 0 0 37,604 18,208 13,322Total Costs (Cooling) 1,438,787 918,239 892,502 396,247 274,970Cost Savings [%](A) -61% -3% 0% 56% 69%
Energy Consumption[kWh]
Carbon Emissions[kg CO2]
Water Consumption[kL]
Peak Capacity(kW)
Annual Costs(D)
Cooling Only
D - The cost of electricity and water is given in Appendix A: - Basis of Calculations, and is shown in the local currency in these results.E - The cooling source for indicates with a chilled water system for the chiller options and DAO, or unitary DX for IAO.F - The DAO system is connects to a water cooled chiller, hence the water consumption.
A - All savings figures shown are compared to the "Water Cooled Chillers".B - Total Cooling COP figure includes energy spent on chillers, evaporative cooling and fans (CRAC units or IAO units)C - PUE (partial) includes cooling system of the data hall only, thus excludes UPS cooling system, electrical losses, fresh air ventilation, etc
PUE (partial)(C)
WUE (l/kWh)

Munters Oasis™ – Indirect Evaporative Cooler – Desktop Energy and Water Study 17
Rev: C
A graphical representation of the common data centre cooling systems electricity and water costs is shown below, all costs are shown in the local currency.
A graphical representation of the common data centre cooling systems electricity consumption of a month by month basis is shown below.

Munters Oasis™ – Indirect Evaporative Cooler – Desktop Energy and Water Study 18
Rev: C
4.2 Urumqi (Xinjiang), China
The annual energy consumption associated with the different cooling options is presented in the break down format in the table below, and is based on the key operational assumptions presented in Appendix A: - Basis of Calculations. The data has been gathered using TRY weather data for Urumqi.
A graphical representation of the common data centre cooling systems electricity consumption is shown below, with a breakdown of energy consumption between cooling source, pumps and fans (CRAHs or IAO).
Standard Chillers
Free Cooling Chillers
Water Cooled Chillers
Direct Air Optimisation
Indirect Evaporative
Cooler1.40 1.26 1.23 1.07 1.070.00 0.00 1.92 1.33 0.95
Cooling Source(E) 1,649,885 818,555 413,077 2,375 81Fans 365,390 365,390 365,390 421,604 425,000CHW & CW Pumps 477,848 477,848 686,874 1,526 0Total 2,493,123 1,661,793 1,465,341 425,505 425,081HVAC Peak Power 310 344 267 303 22Savings(A) -16% -29% 0% -14% 92%Total(F) 0 0 12,121 8,387 5,979Savings(A) 100% 100% 0% 31% 51%Total 2,429,798 1,619,583 1,428,122 414,698 414,284Savings(A) -70% -13% 0% 71% 71%Energy (Cooling) 937,414 624,834 550,968 159,990 159,830Water (Cooling) 0 0 53,819 37,240 26,549Total Costs (Cooling) 937,414 624,834 604,788 197,230 186,379Cost Savings [%](A) -55% -3% 0% 67% 69%
Energy Consumption[kWh]
Carbon Emissions[kg CO2]
Water Consumption[kL]
Peak Capacity(kW)
Annual Costs(D)
Cooling Only
D - The cost of electricity and water is given in Appendix A: - Basis of Calculations, and is shown in the local currency in these results.E - The cooling source for indicates with a chilled water system for the chiller options and DAO, or unitary DX for IAO.F - The DAO system is connects to a water cooled chiller, hence the water consumption.
A - All savings figures shown are compared to the "Water Cooled Chillers".B - Total Cooling COP figure includes energy spent on chillers, evaporative cooling and fans (CRAC units or IAO units)C - PUE (partial) includes cooling system of the data hall only, thus excludes UPS cooling system, electrical losses, fresh air ventilation, etc
PUE (partial)(C)
WUE (l/kWh)

Munters Oasis™ – Indirect Evaporative Cooler – Desktop Energy and Water Study 19
Rev: C
A graphical representation of the common data centre cooling systems electricity and water costs is shown below, all costs are shown in the local currency.
A graphical representation of the common data centre cooling systems electricity consumption of a month by month basis is shown below.

Munters Oasis™ – Indirect Evaporative Cooler – Desktop Energy and Water Study 20
Rev: C
4.3 Hohhot, Inner Mongolia
The annual energy consumption associated with the different cooling options is presented in the break down format in the table below, and is based on the key operational assumptions presented in Appendix A: - Basis of Calculations. The data has been gathered using TRY weather data for Hohhot.
A graphical representation of the common data centre cooling systems electricity consumption is shown below, with a breakdown of energy consumption between cooling source, pumps and fans (CRAHs or IAO).
Standard Chillers
Free Cooling Chillers
Water Cooled Chillers
Direct Air Optimisation
Indirect Evaporative
Cooler1.40 1.26 1.23 1.09 1.070.00 0.00 1.93 1.28 0.80
Cooling Source(E) 1,652,442 775,069 407,418 71,252 722Fans 365,390 365,390 365,390 421,604 433,233CHW & CW Pumps 478,631 478,631 680,237 52,165 0Total 2,496,463 1,619,090 1,453,045 545,021 433,954HVAC Peak Power 312 339 275 300 26Savings(A) -13% -23% 0% -9% 91%Total(F) 0 0 12,143 8,076 5,050Savings(A) 100% 100% 0% 33% 58%Total 2,433,052 1,577,965 1,416,138 531,177 422,932Savings(A) -72% -11% 0% 62% 70%Energy (Cooling) 1,148,373 744,781 668,401 250,710 199,619Water (Cooling) 0 0 36,429 24,227 15,149Total Costs (Cooling) 1,148,373 744,781 704,830 274,936 214,768Cost Savings [%](A) -63% -6% 0% 61% 70%
Energy Consumption[kWh]
Carbon Emissions[kg CO2]
Water Consumption[kL]
Peak Capacity(kW)
Annual Costs(D)
Cooling Only
D - The cost of electricity and water is given in Appendix A: - Basis of Calculations, and is shown in the local currency in these results.E - The cooling source for indicates with a chilled water system for the chiller options and DAO, or unitary DX for IAO.F - The DAO system is connects to a water cooled chiller, hence the water consumption.
A - All savings figures shown are compared to the "Water Cooled Chillers".B - Total Cooling COP figure includes energy spent on chillers, evaporative cooling and fans (CRAC units or IAO units)C - PUE (partial) includes cooling system of the data hall only, thus excludes UPS cooling system, electrical losses, fresh air ventilation, etc
PUE (partial)(C)
WUE (l/kWh)

Munters Oasis™ – Indirect Evaporative Cooler – Desktop Energy and Water Study 21
Rev: C
A graphical representation of the common data centre cooling systems electricity and water costs is shown below, all costs are shown in the local currency.
A graphical representation of the common data centre cooling systems electricity consumption of a month by month basis is shown below.
Munters Oasis™ – Indirect Evaporative Cooler – Desktop Energy and Water Study 22
Rev: C
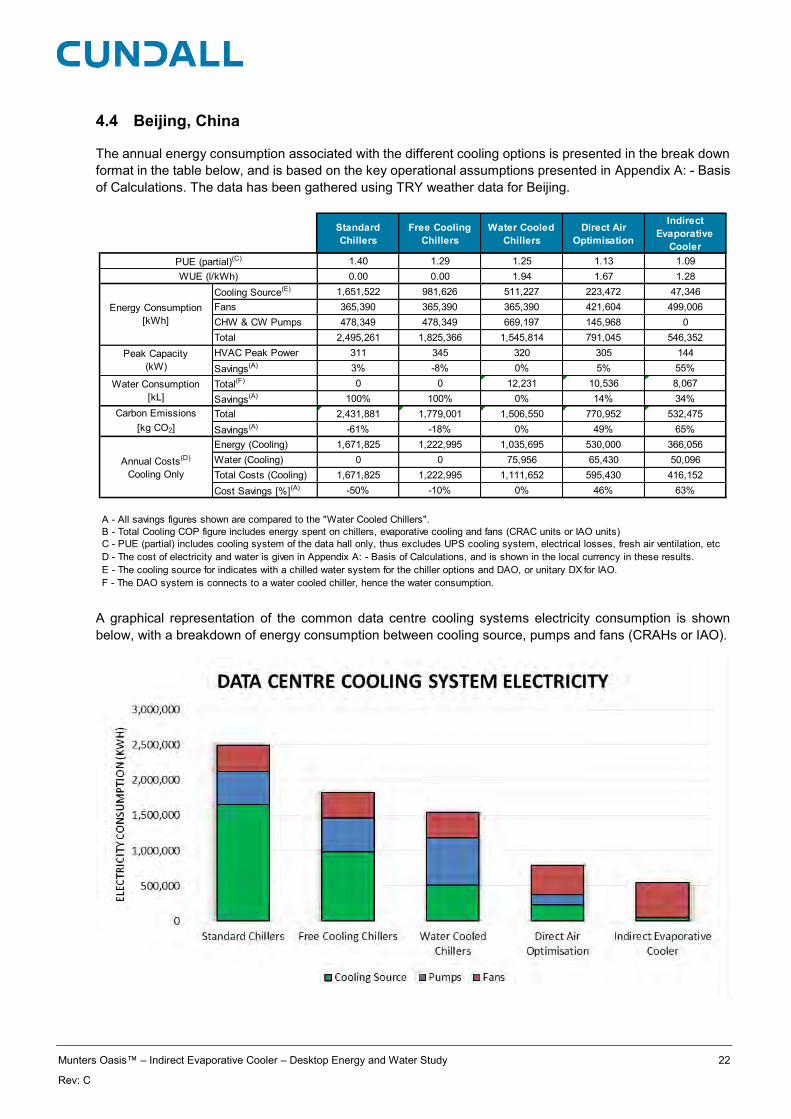
4.4 Beijing, China
The annual energy consumption associated with the different cooling options is presented in the break down format in the table below, and is based on the key operational assumptions presented in Appendix A: - Basis of Calculations. The data has been gathered using TRY weather data for Beijing.
A graphical representation of the common data centre cooling systems electricity consumption is shown below, with a breakdown of energy consumption between cooling source, pumps and fans (CRAHs or IAO).
Standard Chillers
Free Cooling Chillers
Water Cooled Chillers
Direct Air Optimisation
Indirect Evaporative
Cooler1.40 1.29 1.25 1.13 1.090.00 0.00 1.94 1.67 1.28
Cooling Source(E) 1,651,522 981,626 511,227 223,472 47,346Fans 365,390 365,390 365,390 421,604 499,006CHW & CW Pumps 478,349 478,349 669,197 145,968 0Total 2,495,261 1,825,366 1,545,814 791,045 546,352HVAC Peak Power 311 345 320 305 144Savings(A) 3% -8% 0% 5% 55%Total(F) 0 0 12,231 10,536 8,067Savings(A) 100% 100% 0% 14% 34%Total 2,431,881 1,779,001 1,506,550 770,952 532,475Savings(A) -61% -18% 0% 49% 65%Energy (Cooling) 1,671,825 1,222,995 1,035,695 530,000 366,056Water (Cooling) 0 0 75,956 65,430 50,096Total Costs (Cooling) 1,671,825 1,222,995 1,111,652 595,430 416,152Cost Savings [%](A) -50% -10% 0% 46% 63%
Energy Consumption[kWh]
Carbon Emissions[kg CO2]
Water Consumption[kL]
Peak Capacity(kW)
Annual Costs(D)
Cooling Only
D - The cost of electricity and water is given in Appendix A: - Basis of Calculations, and is shown in the local currency in these results.E - The cooling source for indicates with a chilled water system for the chiller options and DAO, or unitary DX for IAO.F - The DAO system is connects to a water cooled chiller, hence the water consumption.
A - All savings figures shown are compared to the "Water Cooled Chillers".B - Total Cooling COP figure includes energy spent on chillers, evaporative cooling and fans (CRAC units or IAO units)C - PUE (partial) includes cooling system of the data hall only, thus excludes UPS cooling system, electrical losses, fresh air ventilation, etc
PUE (partial)(C)
WUE (l/kWh)

Munters Oasis™ – Indirect Evaporative Cooler – Desktop Energy and Water Study 23
Rev: C
A graphical representation of the common data centre cooling systems electricity and water costs is shown below, all costs are shown in the local currency.
A graphical representation of the common data centre cooling systems electricity consumption of a month by month basis is shown below.

Munters Oasis™ – Indirect Evaporative Cooler – Desktop Energy and Water Study 24
Rev: C
4.5 Shijiazhuang (HeBei), China
The annual energy consumption associated with the different cooling options is presented in the break down format in the table below, and is based on the key operational assumptions presented in Appendix A: - Basis of Calculations. The data has been gathered using TRY weather data for Shijiazhuang.
A graphical representation of the common data centre cooling systems electricity consumption is shown below, with a breakdown of energy consumption between cooling source, pumps and fans (CRAHs or IAO).
Standard Chillers
Free Cooling Chillers
Water Cooled Chillers
Direct Air Optimisation
Indirect Evaporative
Cooler1.40 1.30 1.25 1.13 1.090.00 0.00 1.94 1.71 1.37
Cooling Source(E) 1,649,590 1,021,022 536,232 254,143 42,569Fans 365,390 365,390 365,390 421,604 504,174CHW & CW Pumps 477,757 477,757 671,926 169,307 0Total 2,492,738 1,864,170 1,573,549 845,054 546,743HVAC Peak Power 313 367 301 307 122Savings(A) -4% -22% 0% -2% 60%Total(F) 0 0 12,225 10,783 8,619Savings(A) 100% 100% 0% 12% 29%Total 2,429,422 1,816,820 1,533,581 823,590 532,856Savings(A) -58% -18% 0% 46% 65%Energy (Cooling) 1,420,861 1,062,577 896,923 481,681 311,644Water (Cooling) 0 0 52,933 46,692 37,320Total Costs (Cooling) 1,420,861 1,062,577 949,856 528,373 348,963Cost Savings [%](A) -50% -12% 0% 44% 63%
Energy Consumption[kWh]
Carbon Emissions[kg CO2]
Water Consumption[kL]
Peak Capacity(kW)
Annual Costs(D)
Cooling Only
D - The cost of electricity and water is given in Appendix A: - Basis of Calculations, and is shown in the local currency in these results.E - The cooling source for indicates with a chilled water system for the chiller options and DAO, or unitary DX for IAO.F - The DAO system is connects to a water cooled chiller, hence the water consumption.
A - All savings figures shown are compared to the "Water Cooled Chillers".B - Total Cooling COP figure includes energy spent on chillers, evaporative cooling and fans (CRAC units or IAO units)C - PUE (partial) includes cooling system of the data hall only, thus excludes UPS cooling system, electrical losses, fresh air ventilation, etc
PUE (partial)(C)
WUE (l/kWh)

Munters Oasis™ – Indirect Evaporative Cooler – Desktop Energy and Water Study 25
Rev: C
A graphical representation of the common data centre cooling systems electricity and water costs is shown below, all costs are shown in the local currency.
A graphical representation of the common data centre cooling systems electricity consumption of a month by month basis is shown below.

Munters Oasis™ – Indirect Evaporative Cooler – Desktop Energy and Water Study 26
Rev: C
4.6 Tokyo, Japan
The annual energy consumption associated with the different cooling options is presented in the break down format in the table below, and is based on the key operational assumptions presented in Appendix A: - Basis of Calculations. The data has been gathered using TRY weather data for Tokyo.
A graphical representation of the common data centre cooling systems electricity consumption is shown below, with a breakdown of energy consumption between cooling source, pumps and fans (CRAHs or IAO).
Standard Chillers
Free Cooling Chillers
Water Cooled Chillers
Direct Air Optimisation
Indirect Evaporative
Cooler1.40 1.29 1.26 1.15 1.080.00 0.00 1.95 1.11 0.58
Cooling Source(E) 1,649,643 988,386 570,528 321,407 39,576Fans 365,390 365,390 365,390 421,604 496,394CHW & CW Pumps 477,774 477,774 673,949 223,321 0Total 2,492,807 1,831,550 1,609,867 966,332 535,969HVAC Peak Power 307 342 318 307 109Savings(A) 4% -7% 0% 3% 66%Total(F) 0 0 12,268 6,990 3,644Savings(A) 100% 100% 0% 43% 70%Total 1,105,062 811,926 713,654 428,375 237,595Savings(A) -55% -14% 0% 40% 67%Energy (Cooling) 44,870,533 32,967,900 28,977,609 17,393,983 9,647,448Water (Cooling) 0 0 2,453,649 1,398,064 728,745Total Costs (Cooling) 44,870,533 32,967,900 31,431,258 18,792,047 10,376,193Cost Savings [%](A) -43% -5% 0% 40% 67%
Energy Consumption[kWh]
Carbon Emissions[kg CO2]
Water Consumption[kL]
Peak Capacity(kW)
Annual Costs(D)
Cooling Only
D - The cost of electricity and water is given in Appendix A: - Basis of Calculations, and is shown in the local currency in these results.E - The cooling source for indicates with a chilled water system for the chiller options and DAO, or unitary DX for IAO.F - The DAO system is connects to a water cooled chiller, hence the water consumption.
A - All savings figures shown are compared to the "Water Cooled Chillers".B - Total Cooling COP figure includes energy spent on chillers, evaporative cooling and fans (CRAC units or IAO units)C - PUE (partial) includes cooling system of the data hall only, thus excludes UPS cooling system, electrical losses, fresh air ventilation, etc
PUE (partial)(C)
WUE (l/kWh)

Munters Oasis™ – Indirect Evaporative Cooler – Desktop Energy and Water Study 27
Rev: C
A graphical representation of the common data centre cooling systems electricity and water costs is shown below, all costs are shown in the local currency.
A graphical representation of the common data centre cooling systems electricity consumption of a month by month basis is shown below.

Munters Oasis™ – Indirect Evaporative Cooler – Desktop Energy and Water Study 28
Rev: C
4.7 Zhengzhou (Henan), China
The annual energy consumption associated with the different cooling options is presented in the break down format in the table below, and is based on the key operational assumptions presented in Appendix A: - Basis of Calculations. The data has been gathered using TRY weather data for Zhengzhou.
A graphical representation of the common data centre cooling systems electricity consumption is shown below, with a breakdown of energy consumption between cooling source, pumps and fans (CRAHs or IAO).
Standard Chillers
Free Cooling Chillers
Water Cooled Chillers
Direct Air Optimisation
Indirect Evaporative
Cooler1.40 1.30 1.26 1.14 1.090.00 0.00 1.95 1.57 1.28
Cooling Source(E) 1,650,615 1,058,371 578,902 293,408 62,294Fans 365,390 365,390 365,390 421,604 516,856CHW & CW Pumps 478,071 478,071 676,089 193,791 0Total 2,494,076 1,901,833 1,620,381 908,803 579,150HVAC Peak Power 307 342 317 306 104Savings(A) 3% -8% 0% 3% 67%Total(F) 0 0 12,268 9,873 8,056Savings(A) 100% 100% 0% 20% 34%Total 2,430,727 1,853,526 1,579,224 885,720 564,439Savings(A) -54% -17% 0% 44% 64%Energy (Cooling) 1,493,952 1,139,198 970,608 544,373 346,911Water (Cooling) 0 0 39,870 32,088 26,180Total Costs (Cooling) 1,493,952 1,139,198 1,010,478 576,461 373,091Cost Savings [%](A) -48% -13% 0% 43% 63%
Energy Consumption[kWh]
Carbon Emissions[kg CO2]
Water Consumption[kL]
Peak Capacity(kW)
Annual Costs(D)
Cooling Only
D - The cost of electricity and water is given in Appendix A: - Basis of Calculations, and is shown in the local currency in these results.E - The cooling source for indicates with a chilled water system for the chiller options and DAO, or unitary DX for IAO.F - The DAO system is connects to a water cooled chiller, hence the water consumption.
A - All savings figures shown are compared to the "Water Cooled Chillers".B - Total Cooling COP figure includes energy spent on chillers, evaporative cooling and fans (CRAC units or IAO units)C - PUE (partial) includes cooling system of the data hall only, thus excludes UPS cooling system, electrical losses, fresh air ventilation, etc
PUE (partial)(C)
WUE (l/kWh)

Munters Oasis™ – Indirect Evaporative Cooler – Desktop Energy and Water Study 29
Rev: C
A graphical representation of the common data centre cooling systems electricity and water costs is shown below, all costs are shown in the local currency.
A graphical representation of the common data centre cooling systems electricity consumption of a month by month basis is shown below.

Munters Oasis™ – Indirect Evaporative Cooler – Desktop Energy and Water Study 30
Rev: C
4.8 Nanjing (Jiangsu), China
The annual energy consumption associated with the different cooling options is presented in the break down format in the table below, and is based on the key operational assumptions presented in Appendix A: - Basis of Calculations. The data has been gathered using TRY weather data for Nanjing.
A graphical representation of the common data centre cooling systems electricity consumption is shown below, with a breakdown of energy consumption between cooling source, pumps and fans (CRAHs or IAO).
Standard Chillers
Free Cooling Chillers
Water Cooled Chillers
Direct Air Optimisation
Indirect Evaporative
Cooler1.40 1.31 1.26 1.16 1.100.00 0.00 1.95 1.29 1.12
Cooling Source(E) 1,648,834 1,106,344 625,956 372,150 106,065Fans 365,390 365,390 365,390 421,604 538,215CHW & CW Pumps 477,526 477,526 674,477 239,120 0Total 2,491,750 1,949,260 1,665,824 1,032,875 644,279HVAC Peak Power 306 341 322 307 108Savings(A) 5% -6% 0% 4% 66%Total(F) 0 0 12,323 8,136 7,073Savings(A) 100% 100% 0% 34% 43%Total 2,428,460 1,899,749 1,623,512 1,006,640 627,915Savings(A) -50% -17% 0% 38% 61%Energy (Cooling) 1,607,179 1,257,273 1,074,456 666,204 415,560Water (Cooling) 0 0 24,029 15,866 13,792Total Costs (Cooling) 1,607,179 1,257,273 1,098,486 682,070 429,353Cost Savings [%](A) -46% -14% 0% 38% 61%
Energy Consumption[kWh]
Carbon Emissions[kg CO2]
Water Consumption[kL]
Peak Capacity(kW)
Annual Costs(D)
Cooling Only
D - The cost of electricity and water is given in Appendix A: - Basis of Calculations, and is shown in the local currency in these results.E - The cooling source for indicates with a chilled water system for the chiller options and DAO, or unitary DX for IAO.F - The DAO system is connects to a water cooled chiller, hence the water consumption.
A - All savings figures shown are compared to the "Water Cooled Chillers".B - Total Cooling COP figure includes energy spent on chillers, evaporative cooling and fans (CRAC units or IAO units)C - PUE (partial) includes cooling system of the data hall only, thus excludes UPS cooling system, electrical losses, fresh air ventilation, etc
PUE (partial)(C)
WUE (l/kWh)

Munters Oasis™ – Indirect Evaporative Cooler – Desktop Energy and Water Study 31
Rev: C
A graphical representation of the common data centre cooling systems electricity and water costs is shown below, all costs are shown in the local currency.
A graphical representation of the common data centre cooling systems electricity consumption of a month by month basis is shown below.

Munters Oasis™ – Indirect Evaporative Cooler – Desktop Energy and Water Study 32
Rev: C
4.9 Chongqing, China
The annual energy consumption associated with the different cooling options is presented in the break down format in the table below, and is based on the key operational assumptions presented in Appendix A: - Basis of Calculations. The data has been gathered using TRY weather data for Chongqing.
A graphical representation of the common data centre cooling systems electricity consumption is shown below, with a breakdown of energy consumption between cooling source, pumps and fans (CRAHs or IAO).
Standard Chillers
Free Cooling Chillers
Water Cooled Chillers
Direct Air Optimisation
Indirect Evaporative
Cooler1.39 1.33 1.27 1.19 1.110.00 0.00 1.95 1.16 1.20
Cooling Source(E) 1,642,552 1,248,611 677,743 468,477 104,817Fans 365,390 365,390 365,390 421,604 559,230CHW & CW Pumps 475,603 475,603 656,232 310,583 0Total 2,483,545 2,089,604 1,699,365 1,200,664 664,047HVAC Peak Power 314 351 328 307 126Savings(A) 4% -7% 0% 6% 62%Total(F) 0 0 12,282 7,313 7,538Savings(A) 100% 100% 0% 40% 39%Total 2,420,462 2,036,528 1,656,201 1,170,167 647,180Savings(A) -46% -23% 0% 29% 61%Energy (Cooling) 1,601,886 1,347,794 1,096,090 774,428 428,310Water (Cooling) 0 0 39,917 23,768 24,500Total Costs (Cooling) 1,601,886 1,347,794 1,136,007 798,196 452,810Cost Savings [%](A) -41% -19% 0% 30% 60%
Energy Consumption[kWh]
Carbon Emissions[kg CO2]
Water Consumption[kL]
Peak Capacity(kW)
Annual Costs(D)
Cooling Only
D - The cost of electricity and water is given in Appendix A: - Basis of Calculations, and is shown in the local currency in these results.E - The cooling source for indicates with a chilled water system for the chiller options and DAO, or unitary DX for IAO.F - The DAO system is connects to a water cooled chiller, hence the water consumption.
A - All savings figures shown are compared to the "Water Cooled Chillers".B - Total Cooling COP figure includes energy spent on chillers, evaporative cooling and fans (CRAC units or IAO units)C - PUE (partial) includes cooling system of the data hall only, thus excludes UPS cooling system, electrical losses, fresh air ventilation, etc
PUE (partial)(C)
WUE (l/kWh)

Munters Oasis™ – Indirect Evaporative Cooler – Desktop Energy and Water Study 33
Rev: C
A graphical representation of the common data centre cooling systems electricity and water costs is shown below, all costs are shown in the local currency.
A graphical representation of the common data centre cooling systems electricity consumption of a month by month basis is shown below.

Munters Oasis™ – Indirect Evaporative Cooler – Desktop Energy and Water Study 34
Rev: C
4.10 Shanghai, China
The annual energy consumption associated with the different cooling options is presented in the break down format in the table below, and is based on the key operational assumptions presented in Appendix A: - Basis of Calculations. The data has been gathered using TRY weather data for Shanghai.
A graphical representation of the common data centre cooling systems electricity consumption is shown below, with a breakdown of energy consumption between cooling source, pumps and fans (CRAHs or IAO).
Standard Chillers
Free Cooling Chillers
Water Cooled Chillers
Direct Air Optimisation
Indirect Evaporative
Cooler1.40 1.32 1.26 1.18 1.100.00 0.00 1.95 1.23 0.99
Cooling Source(E) 1,649,902 1,160,275 631,078 414,080 102,589Fans 365,390 365,390 365,390 421,604 544,335CHW & CW Pumps 477,853 477,853 667,206 271,683 0Total 2,493,145 2,003,519 1,663,675 1,107,367 646,924HVAC Peak Power 312 341 324 307 127Savings(A) 4% -5% 0% 5% 61%Total(F) 0 0 12,315 7,732 6,252Savings(A) 100% 100% 0% 37% 49%Total 2,429,819 1,952,629 1,621,417 1,079,240 630,492Savings(A) -50% -20% 0% 33% 61%Energy (Cooling) 1,869,859 1,502,639 1,247,756 830,525 485,193Water (Cooling) 0 0 61,573 38,659 31,260Total Costs (Cooling) 1,869,859 1,502,639 1,309,329 869,185 516,453Cost Savings [%](A) -43% -15% 0% 34% 61%
Energy Consumption[kWh]
Carbon Emissions[kg CO2]
Water Consumption[kL]
Peak Capacity(kW)
Annual Costs(D)
Cooling Only
D - The cost of electricity and water is given in Appendix A: - Basis of Calculations, and is shown in the local currency in these results.E - The cooling source for indicates with a chilled water system for the chiller options and DAO, or unitary DX for IAO.F - The DAO system is connects to a water cooled chiller, hence the water consumption.
A - All savings figures shown are compared to the "Water Cooled Chillers".B - Total Cooling COP figure includes energy spent on chillers, evaporative cooling and fans (CRAC units or IAO units)C - PUE (partial) includes cooling system of the data hall only, thus excludes UPS cooling system, electrical losses, fresh air ventilation, etc
PUE (partial)(C)
WUE (l/kWh)

Munters Oasis™ – Indirect Evaporative Cooler – Desktop Energy and Water Study 35
Rev: C
A graphical representation of the common data centre cooling systems electricity and water costs is shown below, all costs are shown in the local currency.
A graphical representation of the common data centre cooling systems electricity consumption of a month by month basis is shown below.

Munters Oasis™ – Indirect Evaporative Cooler – Desktop Energy and Water Study 36
Rev: C
4.11 Wuhan (Hubei), China
The annual energy consumption associated with the different cooling options is presented in the break down format in the table below, and is based on the key operational assumptions presented in Appendix A: - Basis of Calculations. The data has been gathered using TRY weather data for Wuhan.
A graphical representation of the common data centre cooling systems electricity consumption is shown below, with a breakdown of energy consumption between cooling source, pumps and fans (CRAHs or IAO).
Standard Chillers
Free Cooling Chillers
Water Cooled Chillers
Direct Air Optimisation
Indirect Evaporative
Cooler1.40 1.32 1.27 1.18 1.110.00 0.00 1.96 1.33 1.37
Cooling Source(E) 1,648,551 1,176,510 656,968 453,982 132,705Fans 365,390 365,390 365,390 421,604 558,939CHW & CW Pumps 477,439 477,439 662,016 288,352 0Total 2,491,380 2,019,339 1,684,374 1,163,939 691,643HVAC Peak Power 314 350 327 306 150Savings(A) 4% -7% 0% 6% 54%Total(F) 0 0 12,331 8,413 8,650Savings(A) 100% 100% 0% 32% 30%Total 2,428,099 1,968,048 1,641,591 1,134,375 674,076Savings(A) -48% -20% 0% 31% 59%Energy (Cooling) 1,557,113 1,262,087 1,052,734 727,462 432,277Water (Cooling) 0 0 28,979 19,772 20,327Total Costs (Cooling) 1,557,113 1,262,087 1,081,713 747,233 452,604Cost Savings [%](A) -44% -17% 0% 31% 58%
Energy Consumption[kWh]
Carbon Emissions[kg CO2]
Water Consumption[kL]
Peak Capacity(kW)
Annual Costs(D)
Cooling Only
D - The cost of electricity and water is given in Appendix A: - Basis of Calculations, and is shown in the local currency in these results.E - The cooling source for indicates with a chilled water system for the chiller options and DAO, or unitary DX for IAO.F - The DAO system is connects to a water cooled chiller, hence the water consumption.
A - All savings figures shown are compared to the "Water Cooled Chillers".B - Total Cooling COP figure includes energy spent on chillers, evaporative cooling and fans (CRAC units or IAO units)C - PUE (partial) includes cooling system of the data hall only, thus excludes UPS cooling system, electrical losses, fresh air ventilation, etc
PUE (partial)(C)
WUE (l/kWh)

Munters Oasis™ – Indirect Evaporative Cooler – Desktop Energy and Water Study 37
Rev: C
A graphical representation of the common data centre cooling systems electricity and water costs is shown below, all costs are shown in the local currency.
A graphical representation of the common data centre cooling systems electricity consumption of a month by month basis is shown below.

Munters Oasis™ – Indirect Evaporative Cooler – Desktop Energy and Water Study 38
Rev: C
4.12 Hangzhou (ZheJiang), China
The annual energy consumption associated with the different cooling options is presented in the break down format in the table below, and is based on the key operational assumptions presented in Appendix A: - Basis of Calculations. The data has been gathered using TRY weather data for Hangzhou.
A graphical representation of the common data centre cooling systems electricity consumption is shown below, with a breakdown of energy consumption between cooling source, pumps and fans (CRAHs or IAO).
Standard Chillers
Free Cooling Chillers
Water Cooled Chillers
Direct Air Optimisation
Indirect Evaporative
Cooler1.40 1.32 1.27 1.18 1.100.00 0.00 1.95 1.38 1.15
Cooling Source(E) 1,649,107 1,169,432 653,238 432,583 101,811Fans 365,390 365,390 365,390 421,604 546,979CHW & CW Pumps 477,609 477,609 670,684 286,096 0Total 2,492,107 2,012,432 1,689,312 1,140,283 648,790HVAC Peak Power 308 343 324 307 103Savings(A) 5% -6% 0% 5% 68%Total(F) 0 0 12,315 8,693 7,280Savings(A) 100% 100% 0% 29% 41%Total 2,428,807 1,961,316 1,646,403 1,111,320 632,310Savings(A) -48% -19% 0% 33% 62%Energy (Cooling) 1,993,685 1,609,945 1,351,450 912,226 519,032Water (Cooling) 0 0 32,635 23,037 19,292Total Costs (Cooling) 1,993,685 1,609,945 1,384,084 935,263 538,324Cost Savings [%](A) -44% -16% 0% 32% 61%
Energy Consumption[kWh]
Carbon Emissions[kg CO2]
Water Consumption[kL]
Peak Capacity(kW)
Annual Costs(D)
Cooling Only
D - The cost of electricity and water is given in Appendix A: - Basis of Calculations, and is shown in the local currency in these results.E - The cooling source for indicates with a chilled water system for the chiller options and DAO, or unitary DX for IAO.F - The DAO system is connects to a water cooled chiller, hence the water consumption.
A - All savings figures shown are compared to the "Water Cooled Chillers".B - Total Cooling COP figure includes energy spent on chillers, evaporative cooling and fans (CRAC units or IAO units)C - PUE (partial) includes cooling system of the data hall only, thus excludes UPS cooling system, electrical losses, fresh air ventilation, etc
PUE (partial)(C)
WUE (l/kWh)

Munters Oasis™ – Indirect Evaporative Cooler – Desktop Energy and Water Study 39
Rev: C
A graphical representation of the common data centre cooling systems electricity and water costs is shown below, all costs are shown in the local currency.
A graphical representation of the common data centre cooling systems electricity consumption of a month by month basis is shown below.

Munters Oasis™ – Indirect Evaporative Cooler – Desktop Energy and Water Study 40
Rev: C
4.13 Guangzhou (Guangdong), China
The annual energy consumption associated with the different cooling options is presented in the break down format in the table below, and is based on the key operational assumptions presented in Appendix A: - Basis of Calculations. The data has been gathered using TRY weather data for Guangzhou
A graphical representation of the common data centre cooling systems electricity consumption is shown below, with a breakdown of energy consumption between cooling source, pumps and fans (CRAHs or IAO).
Standard Chillers
Free Cooling Chillers
Water Cooled Chillers
Direct Air Optimisation
Indirect Evaporative
Cooler1.40 1.37 1.30 1.24 1.140.00 0.00 1.97 1.59 1.54
Cooling Source(E) 1,649,026 1,493,337 836,981 652,666 212,367Fans 365,390 365,390 365,390 421,604 644,727CHW & CW Pumps 477,585 477,585 670,409 410,812 0Total 2,492,002 2,336,313 1,872,780 1,485,082 857,094HVAC Peak Power 314 350 326 307 133Savings(A) 4% -7% 0% 6% 59%Total(F) 0 0 12,446 10,008 9,735Savings(A) 100% 100% 0% 20% 22%Total 2,428,705 2,276,970 1,825,212 1,447,361 835,324Savings(A) -33% -25% 0% 21% 54%Energy (Cooling) 1,729,449 1,621,401 1,299,709 1,030,647 594,823Water (Cooling) 0 0 27,381 22,017 21,417Total Costs (Cooling) 1,729,449 1,621,401 1,327,090 1,052,664 616,240Cost Savings [%](A) -30% -22% 0% 21% 54%
Energy Consumption[kWh]
Carbon Emissions[kg CO2]
Water Consumption[kL]
Peak Capacity(kW)
Annual Costs(D)
Cooling Only
D - The cost of electricity and water is given in Appendix A: - Basis of Calculations, and is shown in the local currency in these results.E - The cooling source for indicates with a chilled water system for the chiller options and DAO, or unitary DX for IAO.F - The DAO system is connects to a water cooled chiller, hence the water consumption.
A - All savings figures shown are compared to the "Water Cooled Chillers".B - Total Cooling COP figure includes energy spent on chillers, evaporative cooling and fans (CRAC units or IAO units)C - PUE (partial) includes cooling system of the data hall only, thus excludes UPS cooling system, electrical losses, fresh air ventilation, etc
PUE (partial)(C)
WUE (l/kWh)

Munters Oasis™ – Indirect Evaporative Cooler – Desktop Energy and Water Study 41
Rev: C
A graphical representation of the common data centre cooling systems electricity and water costs is shown below, all costs are shown in the local currency.
A graphical representation of the common data centre cooling systems electricity consumption of a month by month basis is shown below.

Munters Oasis™ – Indirect Evaporative Cooler – Desktop Energy and Water Study 42
Rev: C
4.14 Hong Kong, SAR, PRC
The annual energy consumption associated with the different cooling options is presented in the break down format in the table below, and is based on the key operational assumptions presented in Appendix A: - Basis of Calculations. The data has been gathered using TRY weather data for Hong Kong SAR, PRC.
A graphical representation of the common data centre cooling systems electricity consumption is shown below, with a breakdown of energy consumption between cooling source, pumps and fans (CRAHs or IAO).
Standard Chillers
Free Cooling Chillers
Water Cooled Chillers
Direct Air Optimisation
Indirect Evaporative
Cooler1.40 1.38 1.32 1.25 1.140.00 0.00 1.98 1.56 1.50
Cooling Source(E) 1,652,312 1,557,980 935,324 699,475 228,128Fans 365,390 365,390 365,390 421,604 667,152CHW & CW Pumps 478,591 478,591 688,428 450,590 0Total 2,496,293 2,401,961 1,989,143 1,571,669 895,280HVAC Peak Power 306 342 318 305 97Savings(A) 4% -7% 0% 4% 70%Total(F) 0 0 12,513 9,833 9,483Savings(A) 100% 100% 0% 21% 24%Total 1,963,584 1,889,382 1,564,660 1,236,275 704,227Savings(A) -25% -21% 0% 21% 55%Energy (Cooling) 2,765,893 2,661,373 2,203,970 1,741,409 991,970Water (Cooling) 0 0 88,968 69,916 67,423Total Costs (Cooling) 2,765,893 2,661,373 2,292,938 1,811,324 1,059,393Cost Savings [%](A) -21% -16% 0% 21% 54%
Energy Consumption[kWh]
Carbon Emissions[kg CO2]
Water Consumption[kL]
Peak Capacity(kW)
Annual Costs(D)
Cooling Only
D - The cost of electricity and water is given in Appendix A: - Basis of Calculations, and is shown in the local currency in these results.E - The cooling source for indicates with a chilled water system for the chiller options and DAO, or unitary DX for IAO.F - The DAO system is connects to a water cooled chiller, hence the water consumption.
A - All savings figures shown are compared to the "Water Cooled Chillers".B - Total Cooling COP figure includes energy spent on chillers, evaporative cooling and fans (CRAC units or IAO units)C - PUE (partial) includes cooling system of the data hall only, thus excludes UPS cooling system, electrical losses, fresh air ventilation, etc
PUE (partial)(C)
WUE (l/kWh)

Munters Oasis™ – Indirect Evaporative Cooler – Desktop Energy and Water Study 43
Rev: C
A graphical representation of the common data centre cooling systems electricity and water costs is shown below, all costs are shown in the local currency.
A graphical representation of the common data centre cooling systems electricity consumption of a month by month basis is shown below.

Munters Oasis™ – Indirect Evaporative Cooler – Desktop Energy and Water Study 44
Rev: C
4.15 Manila, Philippines
The annual energy consumption associated with the different cooling options is presented in the break down format in the table below, and is based on the key operational assumptions presented in Appendix A: - Basis of Calculations. The data has been gathered using TRY weather data for Manila.
A graphical representation of the common data centre cooling systems electricity consumption is shown below, with a breakdown of energy consumption between cooling source, pumps and fans (CRAHs or IAO).
Standard Chillers
Free Cooling Chillers
Water Cooled Chillers
Direct Air Optimisation
Indirect Evaporative
Cooler1.40 1.42 1.34 1.33 1.190.00 0.00 2.02 2.06 2.66
Cooling Source(E) 1,659,179 1,803,755 1,098,870 1,025,315 373,033Fans 365,390 365,390 365,390 421,604 820,242CHW & CW Pumps 480,693 480,693 702,494 628,118 0Total 2,505,262 2,649,839 2,166,755 2,075,038 1,193,276HVAC Peak Power 307 342 319 307 118Savings(A) 4% -7% 0% 4% 63%Total(F) 0 0 12,741 12,979 16,802Savings(A) 100% 100% 0% -2% -32%Total 1,319,522 1,395,670 1,141,230 1,092,922 628,498Savings(A) -16% -22% 0% 4% 45%Energy (Cooling) 11,163,449 11,807,683 9,655,059 9,246,367 5,317,237Water (Cooling) 0 0 319,407 325,387 421,225Total Costs (Cooling) 11,163,449 11,807,683 9,974,466 9,571,754 5,738,462Cost Savings [%](A) -12% -18% 0% 4% 42%
Energy Consumption[kWh]
Carbon Emissions[kg CO2]
Water Consumption[kL]
Peak Capacity(kW)
Annual Costs(D)
Cooling Only
D - The cost of electricity and water is given in Appendix A: - Basis of Calculations, and is shown in the local currency in these results.E - The cooling source for indicates with a chilled water system for the chiller options and DAO, or unitary DX for IAO.F - The DAO system is connects to a water cooled chiller, hence the water consumption.
A - All savings figures shown are compared to the "Water Cooled Chillers".B - Total Cooling COP figure includes energy spent on chillers, evaporative cooling and fans (CRAC units or IAO units)C - PUE (partial) includes cooling system of the data hall only, thus excludes UPS cooling system, electrical losses, fresh air ventilation, etc
PUE (partial)(C)
WUE (l/kWh)

Munters Oasis™ – Indirect Evaporative Cooler – Desktop Energy and Water Study 45
Rev: C
A graphical representation of the common data centre cooling systems electricity and water costs is shown below, all costs are shown in the local currency.
A graphical representation of the common data centre cooling systems electricity consumption of a month by month basis is shown below.

Munters Oasis™ – Indirect Evaporative Cooler – Desktop Energy and Water Study 46
Rev: C
4.16 Kuala Lumpur, Malaysia
The annual energy consumption associated with the different cooling options is presented in the break down format in the table below, and is based on the key operational assumptions presented in Appendix A: - Basis of Calculations. The data has been gathered using TRY weather data for Kuala Lumpur.
A graphical representation of the common data centre cooling systems electricity consumption is shown below, with a breakdown of energy consumption between cooling source, pumps and fans (CRAHs or IAO).
Standard Chillers
Free Cooling Chillers
Water Cooled Chillers
Direct Air Optimisation
Indirect Evaporative
Cooler1.40 1.42 1.35 1.34 1.200.00 0.00 2.02 2.02 2.23
Cooling Source(E) 1,658,888 1,780,036 1,118,897 1,086,896 407,258Fans 365,390 365,390 365,390 421,604 844,817CHW & CW Pumps 480,604 480,604 717,649 666,712 0Total 2,504,883 2,626,030 2,201,936 2,175,212 1,252,075HVAC Peak Power 307 342 312 261 123Savings(A) 2% -10% 0% 16% 61%Total(F) 0 0 12,743 12,731 14,084Savings(A) 100% 100% 0% 0% -11%Total 1,878,662 1,969,523 1,651,452 1,631,409 939,056Savings(A) -14% -19% 0% 1% 43%Energy (Cooling) 1,252,441 1,313,015 1,100,968 1,087,606 626,038Water (Cooling) 0 0 16,820 16,805 18,591Total Costs (Cooling) 1,252,441 1,313,015 1,117,789 1,104,411 644,629Cost Savings [%](A) -12% -17% 0% 1% 42%
Energy Consumption[kWh]
Carbon Emissions[kg CO2]
Water Consumption[kL]
Peak Capacity(kW)
Annual Costs(D)
Cooling Only
D - The cost of electricity and water is given in Appendix A: - Basis of Calculations, and is shown in the local currency in these results.E - The cooling source for indicates with a chilled water system for the chiller options and DAO, or unitary DX for IAO.F - The DAO system is connects to a water cooled chiller, hence the water consumption.
A - All savings figures shown are compared to the "Water Cooled Chillers".B - Total Cooling COP figure includes energy spent on chillers, evaporative cooling and fans (CRAC units or IAO units)C - PUE (partial) includes cooling system of the data hall only, thus excludes UPS cooling system, electrical losses, fresh air ventilation, etc
PUE (partial)(C)
WUE (l/kWh)

Munters Oasis™ – Indirect Evaporative Cooler – Desktop Energy and Water Study 47
Rev: C
A graphical representation of the common data centre cooling systems electricity and water costs is shown below, all costs are shown in the local currency.
A graphical representation of the common data centre cooling systems electricity consumption of a month by month basis is shown below.

Munters Oasis™ – Indirect Evaporative Cooler – Desktop Energy and Water Study 48
Rev: C
4.17 Singapore, Singapore
The annual energy consumption associated with the different cooling options is presented in the break down format in the table below, and is based on the key operational assumptions presented in Appendix A: - Basis of Calculations. The data has been gathered using TRY weather data for Singapore.
A graphical representation of the common data centre cooling systems electricity consumption is shown below, with a breakdown of energy consumption between cooling source, pumps and fans (CRAHs or IAO).
Standard Chillers
Free Cooling Chillers
Water Cooled Chillers
Direct Air Optimisation
Indirect Evaporative
Cooler1.40 1.42 1.34 1.36 1.210.00 0.00 2.02 2.02 1.96
Cooling Source(E) 1,661,037 1,805,360 1,088,223 1,142,805 479,473Fans 365,390 365,390 365,390 421,604 855,737CHW & CW Pumps 481,262 481,262 700,601 700,577 0Total 2,507,689 2,652,012 2,154,214 2,264,986 1,335,210HVAC Peak Power 308 344 321 287 96Savings(A) 4% -7% 0% 10% 70%Total(F) 0 0 12,740 12,746 12,335Savings(A) 100% 100% 0% 0% 3%Total 1,429,383 1,511,647 1,227,902 1,291,042 761,070Savings(A) -16% -23% 0% -5% 38%Energy (Cooling) 501,538 530,402 430,843 452,997 267,042Water (Cooling) 0 0 15,288 15,295 14,802Total Costs (Cooling) 501,538 530,402 446,131 468,293 281,844Cost Savings [%](A) -12% -19% 0% -5% 37%
Energy Consumption[kWh]
Carbon Emissions[kg CO2]
Water Consumption[kL]
Peak Capacity(kW)
Annual Costs(D)
Cooling Only
D - The cost of electricity and water is given in Appendix A: - Basis of Calculations, and is shown in the local currency in these results.E - The cooling source for indicates with a chilled water system for the chiller options and DAO, or unitary DX for IAO.F - The DAO system is connects to a water cooled chiller, hence the water consumption.
A - All savings figures shown are compared to the "Water Cooled Chillers".B - Total Cooling COP figure includes energy spent on chillers, evaporative cooling and fans (CRAC units or IAO units)C - PUE (partial) includes cooling system of the data hall only, thus excludes UPS cooling system, electrical losses, fresh air ventilation, etc
PUE (partial)(C)
WUE (l/kWh)

Munters Oasis™ – Indirect Evaporative Cooler – Desktop Energy and Water Study 49
Rev: C
A graphical representation of the common data centre cooling systems electricity and water costs is shown below, all costs are shown in the local currency.
A graphical representation of the common data centre cooling systems electricity consumption of a month by month basis is shown below.

Munters Oasis™ – Indirect Evaporative Cooler – Desktop Energy and Water Study 50
Rev: C
4.18 Perth, Australia
The annual energy consumption associated with the different cooling options is presented in the break down format in the table below, and is based on the key operational assumptions presented in Appendix A: - Basis of Calculations. The data has been gathered using TRY weather data for Perth.
A graphical representation of the common data centre cooling systems electricity consumption is shown below, with a breakdown of energy consumption between cooling source, pumps and fans (CRAHs or IAO).
Standard Chillers
Free Cooling Chillers
Water Cooled Chillers
Direct Air Optimisation
Indirect Evaporative
Cooler1.40 1.33 1.27 1.09 1.070.00 0.00 1.96 1.44 1.36
Cooling Source(E) 1,662,788 1,257,482 642,711 82,987 915Fans 365,390 365,390 365,390 421,604 452,495CHW & CW Pumps 481,798 481,798 690,278 60,291 0Total 2,509,976 2,104,671 1,698,379 564,882 453,410HVAC Peak Power 312 388 289 290 25Savings(A) -8% -34% 0% 0% 91%Total(F) 0 0 12,343 9,099 8,592Savings(A) 100% 100% 0% 26% 30%Total 2,488,641 2,086,781 1,683,942 560,080 449,556Savings(A) -48% -24% 0% 67% 73%Energy (Cooling) 451,796 378,841 305,708 101,679 81,614Water (Cooling) 0 0 34,561 25,477 24,059Total Costs (Cooling) 451,796 378,841 340,269 127,156 105,672Cost Savings [%](A) -33% -11% 0% 63% 69%
Energy Consumption[kWh]
Carbon Emissions[kg CO2]
Water Consumption[kL]
Peak Capacity(kW)
Annual Costs(D)
Cooling Only
D - The cost of electricity and water is given in Appendix A: - Basis of Calculations, and is shown in the local currency in these results.E - The cooling source for indicates with a chilled water system for the chiller options and DAO, or unitary DX for IAO.F - The DAO system is connects to a water cooled chiller, hence the water consumption.
A - All savings figures shown are compared to the "Water Cooled Chillers".B - Total Cooling COP figure includes energy spent on chillers, evaporative cooling and fans (CRAC units or IAO units)C - PUE (partial) includes cooling system of the data hall only, thus excludes UPS cooling system, electrical losses, fresh air ventilation, etc
PUE (partial)(C)
WUE (l/kWh)

Munters Oasis™ – Indirect Evaporative Cooler – Desktop Energy and Water Study 51
Rev: C
A graphical representation of the common data centre cooling systems electricity and water costs is shown below, all costs are shown in the local currency.
A graphical representation of the common data centre cooling systems electricity consumption of a month by month basis is shown below.

Munters Oasis™ – Indirect Evaporative Cooler – Desktop Energy and Water Study 52
Rev: C
4.19 Sydney, Australia
The annual energy consumption associated with the different cooling options is presented in the break down format in the table below, and is based on the key operational assumptions presented in Appendix A: - Basis of Calculations. The data has been gathered using TRY weather data for Sydney.
A graphical representation of the common data centre cooling systems electricity consumption is shown below, with a breakdown of energy consumption between cooling source, pumps and fans (CRAHs or IAO).
Standard Chillers
Free Cooling Chillers
Water Cooled Chillers
Direct Air Optimisation
Indirect Evaporative
Cooler1.40 1.33 1.27 1.14 1.070.00 0.00 1.95 1.05 0.99
Cooling Source(E) 1,656,882 1,247,584 678,056 257,161 2,757Fans 365,390 365,390 365,390 421,604 468,293CHW & CW Pumps 479,990 479,990 690,739 188,719 0Total 2,502,262 2,092,964 1,734,186 867,484 471,050HVAC Peak Power 310 385 287 306 38Savings(A) -8% -34% 0% -6% 87%Total(F) 0 0 12,316 6,621 6,255Savings(A) 100% 100% 0% 46% 49%Total 2,480,993 2,075,174 1,719,445 860,111 467,046Savings(A) -44% -21% 0% 50% 73%Energy (Cooling) 450,407 376,734 312,153 156,147 84,789Water (Cooling) 0 0 27,094 14,566 13,762Total Costs (Cooling) 450,407 376,734 339,248 170,713 98,551Cost Savings [%](A) -33% -11% 0% 50% 71%
Energy Consumption[kWh]
Carbon Emissions[kg CO2]
Water Consumption[kL]
Peak Capacity(kW)
Annual Costs(D)
Cooling Only
D - The cost of electricity and water is given in Appendix A: - Basis of Calculations, and is shown in the local currency in these results.E - The cooling source for indicates with a chilled water system for the chiller options and DAO, or unitary DX for IAO.F - The DAO system is connects to a water cooled chiller, hence the water consumption.
A - All savings figures shown are compared to the "Water Cooled Chillers".B - Total Cooling COP figure includes energy spent on chillers, evaporative cooling and fans (CRAC units or IAO units)C - PUE (partial) includes cooling system of the data hall only, thus excludes UPS cooling system, electrical losses, fresh air ventilation, etc
PUE (partial)(C)
WUE (l/kWh)

Munters Oasis™ – Indirect Evaporative Cooler – Desktop Energy and Water Study 53
Rev: C
A graphical representation of the common data centre cooling systems electricity and water costs is shown below, all costs are shown in the local currency.
A graphical representation of the common data centre cooling systems electricity consumption of a month by month basis is shown below.

Munters Oasis™ – Indirect Evaporative Cooler – Desktop Energy and Water Study 54
Rev: C
4.20 Melbourne, Australia
The annual energy consumption associated with the different cooling options is presented in the break down format in the table below, and is based on the key operational assumptions presented in Appendix A: - Basis of Calculations. The data has been gathered using TRY weather data for Melbourne.
A graphical representation of the common data centre cooling systems electricity consumption is shown below, with a breakdown of energy consumption between cooling source, pumps and fans (CRAHs or IAO).
Standard Chillers
Free Cooling Chillers
Water Cooled Chillers
Direct Air Optimisation
Indirect Evaporative
Cooler1.40 1.30 1.25 1.08 1.070.00 0.00 1.94 0.86 0.67
Cooling Source(E) 1,652,960 1,050,046 498,737 49,119 7Fans 365,390 365,390 365,390 421,604 430,591CHW & CW Pumps 478,789 478,789 693,958 35,671 0Total 2,497,140 1,894,225 1,558,086 506,394 430,598HVAC Peak Power 309 345 267 274 4Savings(A) -16% -29% 0% -3% 99%Total(F) 0 0 12,232 5,444 4,255Savings(A) 100% 100% 0% 55% 65%Total 2,475,914 1,878,125 1,544,842 502,089 426,938Savings(A) -60% -22% 0% 67% 72%Energy (Cooling) 449,485 340,961 280,455 91,151 77,508Water (Cooling) 0 0 35,474 15,786 12,340Total Costs (Cooling) 449,485 340,961 315,930 106,937 89,847Cost Savings [%](A) -42% -8% 0% 66% 72%
Energy Consumption[kWh]
Carbon Emissions[kg CO2]
Water Consumption[kL]
Peak Capacity(kW)
Annual Costs(D)
Cooling Only
D - The cost of electricity and water is given in Appendix A: - Basis of Calculations, and is shown in the local currency in these results.E - The cooling source for indicates with a chilled water system for the chiller options and DAO, or unitary DX for IAO.F - The DAO system is connects to a water cooled chiller, hence the water consumption.
A - All savings figures shown are compared to the "Water Cooled Chillers".B - Total Cooling COP figure includes energy spent on chillers, evaporative cooling and fans (CRAC units or IAO units)C - PUE (partial) includes cooling system of the data hall only, thus excludes UPS cooling system, electrical losses, fresh air ventilation, etc
PUE (partial)(C)
WUE (l/kWh)

Munters Oasis™ – Indirect Evaporative Cooler – Desktop Energy and Water Study 55
Rev: C
A graphical representation of the common data centre cooling systems electricity and water costs is shown below, all costs are shown in the local currency.
A graphical representation of the common data centre cooling systems electricity consumption of a month by month basis is shown below.

Munters Oasis™ – Indirect Evaporative Cooler – Desktop Energy and Water Study 56
Rev: C
Conclusions
This report has compared the operational efficiency of the Oasis™ Indirect Evaporative Cooler compared to a range of chiller water options and Direct Air Optimisation. The report has aimed to be a subjective analysis of the product itself and its suitability as a credible data centre cooling strategy. The report has also evaluated the various attributes of the technology, the overall attributes of an IAO system compared to chilled water, and the energy / water costs of each system.
The key benefits of the Munters Oasis™ Indirect Evaporative Cooler are as follows:
Operational energy savings, leading to operational cost savings.
Peak electrical demand savings, leading to operational cost savings and capital cost savings in electrical support systems.
Operational water savings when compared to water cooled chillers, leading to operational cost savings.
Low PUE allowing effective marketing to energy conscious clients
Reduced contamination potential when compared to a Direct Air Optimisation system.
Effective in the implementation of a modular stage by stage design allowing deferred commitment of capital costs.
Low maintenance requirements.
The main benefit of focus that has been examined and demonstrated in this report is the annual energy consumption reductions as a result of using the Oasis™ Indirect Evaporative Cooler . A number of reasons can be cited to explain why this finding has come to be the case:
To remove energy from a data hall, heat goes through a number of exchanges from air to water to air (not including server to air heat exchanges and internal chiller exchanges). Each exchange has a temperature approach and an efficiency loss associated with it. These combined losses reduce overall system efficiency.
Chilled water systems involve the movement of three mediums of heat transfer (air, water, air). Each medium requires fans or pumps for circulation, the latter being a major energy loss.
IAO systems can maximise the potential cooling contained in ambient air due to reduced approach temperature losses allowing supply air temperature to closely match the highest ambient temperature.
Evaporative cooling can be used on a free cooling chiller to increase its efficiency, but the advantage gained in comparison to evaporative cooled IAO is reduced due to lower chilled water temperature set points at the chiller.
IAO will only require mechanical cooling when ambient wet bulb temperature exceeds the required internal supply set point (with losses). This set point for a chilled water free cooling chiller will be far lower.
DAO can only utilise free cooling when conditions do not exceed the maximum moisture content recommended by ASHRAE TC 9.9. These conditions seldom occur particularly in the tropical climates included in the study. IAO can utilise the free cooling provided by the evaporative process at any moisture content level as the outside air does not enter the data hall.

Munters Oasis™ – Indirect Evaporative Cooler – Desktop Energy and Water Study 57
Rev: C
The summary of electricity savings for each location, as compared to water cooled chillers with CRAH is shown below. Where the figures show a negative sign it indicates an increase in consumption. The table has been sorted based on the electrical savings compared to water cooled chillers, largest to smallest savings.
Location Standard Chillers
Free Cooling Chillers
Water Cooled Chillers
Direct Air Optimisation
Indirect Evaporative
Cooler
19. Sydney, Australia -44% -21% 0% 50% 73%
18. Perth, Australia -48% -24% 0% 67% 73%
20. Melbourne, Australia -60% -22% 0% 67% 72%
02. Urumqi, China -70% -13% 0% 71% 71%
03. Hohhot, Inner Mongolia
-72% -11% 0% 62% 70%
01. Harbin, China -68% -7% 0% 56% 69%
06. Tokyo, Japan -55% -14% 0% 40% 67%
04. Beijing, China -61% -18% 0% 49% 65%
05. Shijiazhuang, China -58% -18% 0% 46% 65%
07. Zhengzhou, China -54% -17% 0% 44% 64%
12. Hangzhou, China -48% -19% 0% 33% 62%
10. Shanghai, China -50% -20% 0% 33% 61%
09. Chongqing, China -46% -23% 0% 29% 61%
08. Nanjing, China -50% -17% 0% 38% 61%
11. Wuhan, China -48% -20% 0% 31% 59%
14. Hong Kong, Hong Kong
-25% -21% 0% 21% 55%
13. Guangzhou, China -33% -25% 0% 21% 54%
15. Manila, Philippines -16% -22% 0% 4% 45%
16. Kuala Lumpur, Malaysia
-14% -19% 0% 1% 43%
17. Singapore, Singapore
-16% -23% 0% -5% 38%
The results show that in all locations an IAC solution provides significant energy savings over all options, including DAO. The results show that Singapore achieves significant savings at 38% compared to the water cooled chiller. The lower than average savings are associated with consistently high wet bulb temperatures, decreasing the impact of the evaporative cooling.

Munters Oasis™ – Indirect Evaporative Cooler – Desktop Energy and Water Study 58
Rev: C
Air cooled chilled water systems have minimal water needs, however water cooled systems have significant water consumption. In comparison Indirect Evaporative Cooler utilises water in the evaporative cooling process. Typically a IAO unit will utilise DX cooling with no water requirements. The summary of relative water consumption for each location, as compared to water cooled chillers with CRAH is shown below. Where the figures show a negative sign it indicates an increase in consumption. The table has been sorted based on the water savings compared to water cooled chillers, largest to smallest savings.
Location Standard Chillers
Free Cooling Chillers
Water Cooled Chillers
Direct Air Optimisation
Indirect Evaporative
Cooler
06. Tokyo, Japan 100% 100% 0% 43% 70%
20. Melbourne, Australia 100% 100% 0% 55% 65%
01. Harbin, China 100% 100% 0% 52% 65%
03. Hohhot, Inner Mongolia
100% 100% 0% 33% 58%
02. Urumqi, China 100% 100% 0% 31% 51%
19. Sydney, Australia 100% 100% 0% 46% 49%
10. Shanghai, China 100% 100% 0% 37% 49%
08. Nanjing, China 100% 100% 0% 34% 43%
12. Hangzhou, China 100% 100% 0% 29% 41%
09. Chongqing, China 100% 100% 0% 40% 39%
04. Beijing, China 100% 100% 0% 14% 34%
07. Zhengzhou, China 100% 100% 0% 20% 34%
18. Perth, Australia 100% 100% 0% 26% 30%
11. Wuhan, China 100% 100% 0% 32% 30%
05. Shijiazhuang, China 100% 100% 0% 12% 29%
14. Hong Kong, Hong Kong
100% 100% 0% 21% 24%
13. Guangzhou, China 100% 100% 0% 20% 22%
17. Singapore, Singapore
100% 100% 0% 0% 3%
16. Kuala Lumpur, Malaysia
100% 100% 0% 0% -11%
15. Manila, Philippines 100% 100% 0% -2% -32%

Munters Oasis™ – Indirect Evaporative Cooler – Desktop Energy and Water Study 59
Rev: C
Appendix A: - Basis of Calculations
Technical Schedules
The following table details the typical design criteria which may be considered when selecting a unit. Typical selection figures have been given for the design case data hall and ambient conditions at Singapore provided by Munters.
Design Parameter Design Criteria Comments
Design Cooling Load
144 kW per unit (720kW total)
The unit uses an evaporative polymer tube heat exchanger system with a scavenger fan that can be sized to suit the required cooling duty. N+1 units are supplied for resilience.
Data Hall Supply 26oC db Air needs to be supplied to the servers within the boundaries of the ASHRAE ‘Class 1’ conditions.
Data Hall Return 38oC db A typical target ∆T for this type of application would be 12oC. Increasing the ∆T across the servers reduces supply fan duty but increases the heat dissipation duty of the heat exchanger per unit of air.
Typical Internal Air Flow
12.6 m³/s per unit Airflow is based on a typical 200kW unit but will vary according to unit duty.
Typical External Air Flow
0 – 12.5 m²/s Dependent on unit configuration and duty.
Supply Fan Pressure
200 Pa Pressure is dependent on unit duty and filtration requirements (external)
Extract Fan Pressure
210 Pa Pressure will increase and decrease with evaporative cooling demand (external)
Design Fan Power Variable
Unit Water Usage Evaporated
5440.2 m3 per annum
(manufacturer data)
This figure does not include water that will be drained from the sump.
Maximum Pump Power
6.3 kW per unit (x5) During normal operation this figure will be reduced, conservative estimates utilised.
Unit Size (WxLxH) mm
3940 x 6895 x 4149 The design of the unit is adaptable to specific requirements and dimensions will vary accordingly
Unit Weight 6600kgs The design of the unit is adaptable to specific requirements and unit weight will vary accordingly

Munters Oasis™ – Indirect Evaporative Cooler – Desktop Energy and Water Study 60
Rev: C
Basis of Calculations – Munters Oasis™
It is assumed for the purposes of this report that the data halls are fully loaded with the IT equipment and represents a static constant condition. It is assumed that load is uniformly distributed throughout the data hall.
The design IT load will be 1000 W/m² for 720m² data hall, therefore the total IT load for the data hall will be 720kW. The total annual IT electrical energy consumption will be 6,307,200 kWh.
A calculator has been set up, specific to IAO and chilled water systems, for the purpose of calculating the energy consumption of the cooling system given the external ambient conditions as recorded in the TRY weather data.
The first input to the calculator are the ambient conditions for the region considered, i.e. External Dry Bulb Temperature, External Wet Bulb Temperature, Moisture Content, Dew Point, Enthalpy and Density. These parameters are entered for every hour of the year. In addition to this, the maximum supply air temperature to the facility as well as the ΔT across the cooling system is also defined.
The calculation process is split into a number of different control modes for the cooling units such as the use of dry or wet heat exchanger, modulating scavenger fan power and use of DX cooling. Each of the control modes has been assessed in terms of associated efficiencies for the heat exchanger, power consumption for fans and pumps and required energy input from DX cooling.
Energy associated with the supply fans has been taken as a constant figure based on the data provided by Munters. Energy associated with the scavenger fans has been taken as a variable figure based on the data provided by Munters which has been developed based on the scavenger volume required to achieve the heat exchanger efficiency in order to maintain a the supply air temperature.
The DX Condensers Energy Efficiency Ratio (EER), as defined in the following table, which was based on typical DX operation, was used to convert the required total mechanical cooling energy into an electrical input power for the refrigeration system.
𝐸𝑛𝑒𝑟𝑔𝑦 𝐸𝑓𝑓𝑖𝑐𝑖𝑒𝑛𝑐𝑦 𝑅𝑎𝑡𝑖𝑜 =𝑁𝑒𝑡 𝐶𝑜𝑜𝑙𝑖𝑛𝑔 𝐷𝑒𝑙𝑖𝑣𝑒𝑟𝑒𝑑
𝐸𝑙𝑒𝑐𝑡𝑟𝑖𝑐𝑎𝑙 𝑃𝑜𝑤𝑒𝑟 𝐼𝑛𝑝𝑢𝑡
Only the above elements directly involved in cooling are considered in the calculation, the fresh air ventilation system and lighting of the data hall is neglected.
In addition, the water consumption in the process of evaporative cooling has been calculated based on achieving the saturation point by the outside air, the rate of water consumption is the absolute humidity increase in the process of the evaporative cooling. In addition, an estimation of water excess has been made based on the periodic draining of the unit and due to the water droplets being carried out by the scavenger air.
The following summarise a number of assumptions used in calculation of the energy and water consumption of the Munters Oasis™ unit as well as the costs of water and electricity associated with various locations.

Munters Oasis™ – Indirect Evaporative Cooler – Desktop Energy and Water Study 61
Rev: C
Parameter Value
Supply set point Temperature to the Data Hall [°C] 26°C
Return set point Temperature from the Data Hall [°C] 38°C
Maximum scavenger air volume to supply air volume 1.1
Process Air Fan power at 63m3/s (kW) 41.7 kW
Process Air Fan Heat Gain [K] 0.7°C
Scavenger Air Fan SFP [W/l/s] Variable, max 1.0
Proportion of circulation air filtrated 25%
Heat recovery efficiency (DRY) Variable
Heat recovery efficiency (WET) Variable
DX Cooling Efficiency (SEER) 4.0
DX cooling active only when off-coil temperature of the process air is equal or higher than supply set point temperature
Water use excess (loss, due to conductivity control/bleed rate) 25%
Minimum outside temperature for evaporative cooling [°C] Variable
Location by location utility costs and carbon coefficients are shown below, shown in the location currency.
Location Electricity Rate Water Rate Carbon Coefficient
01. Harbin (HeiLongJiang), China 0.58 RMB¥/kWh 3.1 RMB¥/m³ 0.97 kg CO2/kWh
02. Urumqi (Xinjiang), China 0.38 RMB¥/kWh 4.44 RMB¥/m³ 0.97 kg CO2/kWh
03. Hohhot, Inner Mongolia 0.46 RMB¥/kWh 3 RMB¥/m³ 0.97 kg CO2/kWh
04. Beijing, China 0.67 RMB¥/kWh 6.21 RMB¥/m³ 0.97 kg CO2/kWh
05. Shijiazhuang (HeBei), China 0.57 RMB¥/kWh 4.33 RMB¥/m³ 0.97 kg CO2/kWh
06. Tokyo, Japan 18 ¥ yen/kWh 200 ¥ yen/m³ 0.44 kg CO2/kWh
07. Zhengzhou (Henan), China 0.6 RMB¥/kWh 3.25 RMB¥/m³ 0.97 kg CO2/kWh
08. Nanjing (Jiangsu), China 0.65 RMB¥/kWh 1.95 RMB¥/m³ 0.97 kg CO2/kWh
09. Chongqing, China 0.65 RMB¥/kWh 3.25 RMB¥/m³ 0.97 kg CO2/kWh
10. Shanghai, China 0.75 RMB¥/kWh 5 RMB¥/m³ 0.97 kg CO2/kWh
11. Wuhan (Hubei), China 0.63 RMB¥/kWh 2.35 RMB¥/m³ 0.97 kg CO2/kWh
12. Hangzhou (ZheJiang), China 0.8 RMB¥/kWh 2.65 RMB¥/m³ 0.97 kg CO2/kWh
13. Guangzhou (Guangdong), China 0.69 RMB¥/kWh 2.2 RMB¥/m³ 0.97 kg CO2/kWh
14. Hong Kong, Hong Kong 1.11 HKD $/kWh 7.11 HKD $/m³ 0.79 kg CO2/kWh
15. Manila, Philippines 4.46 PHP ₱/kWh 25.07 PHP ₱/m³ 0.53 kg CO2/kWh
16. Kuala Lumpur, Malaysia 0.5 MYR/m² 1.32 MYR/m² 0.75 kg CO2/kWh
17. Singapore, Singapore 0.2 SGD $/kWh 1.2 SGD $/m² 0.57 kg CO2/kWh
18. Perth, Australia 0.18 AUD $/kWh 2.8 AUD $/m² 0.99 kg CO2/kWh
19. Sydney, Australia 0.18 AUD $/kWh 2.2 AUD $/m² 0.99 kg CO2/kWh
20. Melbourne, Australia 0.18 AUD $/kWh 2.9 AUD $/m² 0.99 kg CO2/kWh

Munters Oasis™ – Indirect Evaporative Cooler – Desktop Energy and Water Study 62
Rev: C
Basis of Calculations - Chilled Water Units
The same global assumptions regarding the data hall arrangement were used in the analysis of the various systems, therefore the total IT load, set point temperatures, weather files and tariffs are the same for the chilled water system as for the Munters cooling system.
Chilled water system is composed of the major elements such as:
Chilled water cooling system with the chillers and pumps, CRAC units of which the main elements are fans.
Only the above elements directly involved in cooling are considered in the calculation, the fresh air ventilation system and lighting of the data hall is neglected.
Energy spent on chillers depends on the chillers energy efficiency ratio. The data from the manufacturers provide efficiencies for a range of outside temperatures. Based on this, the overall energy consumption of the chillers was calculated (for both, standard and free cooling chillers)
Pumps were modelled based on the assumed pressure head of the primary and secondary pumps, temperature difference between flow and return and efficiency of the motors.
Finally, fans within CRAC units were assumed to run at constant speed (due to the constant maximum cooling load) with volume calculated based on the cooling capacity and air temperature difference (return – supply).
The input parameters assumed in the energy calculations are summarised in the tables below (Note: EER figures include the energy requirements of the circulating pumps and chiller).
Parameter Value
Supply set point Temperature to the Data Hall [°C] 26°C
Return set point Temperature from the Data Hall [°C] 38°C
CRAC unit Fan SFP [W/l/s] 0.65
DAO CRAC unit Fan SFP [W/l/s] 0.75
CRAC unit Fan Heat Gain [K] 1
Chilled Water DT (Flow – Return) [K] 7
Pumps Efficiency [%] 66%
Pressure Head of the Primary Pumps [m] 15
Pressure Head of the Secondary Pumps [m] 20
Various chiller EERs are shown following, the standard chiller arrangement is assumed to have a flat EER of 4.1.

Munters Oasis™ – Indirect Evaporative Cooler – Desktop Energy and Water Study 63
Rev: C
0
5
10
15
20
25
30
-30°C -25°C -20°C -15°C -10°C -5°C 0°C 5°C 10°C 15°C 20°C 25°C 30°C 35°C 40°C 45°C
EER
)
AMBIENT TEMPERATURE
FREE COOLING CHILLER EER

Munters Oasis™ – Indirect Evaporative Cooler – Desktop Energy and Water Study 64
Rev: C
Validation of Results
The section of the report investigates the energy and water consumption results calculated for a range of locations as shown in this report and compares them against the figures obtained from the Munters selection tool. All figures shown in the report thus far are based on Cundall’s analysis and calculations, without influence from Munters as to the accuracy of these results.
There are differences between the results, which could be for the following reasons:
Both calculation tools have a different calculation methodology.
o Munters selection tool seems to incorporate the performance data for 25 typical weather conditions (dry bulb temperature) and calculates the annual performance by splitting outdoor conditions into those 25 groups.
o Cundall calculation procedure used in this report assesses the performance of the cooling unit separately for each hour of the year taking into account the specific weather conditions for each particular hour (dry bulb and wet bulb temperature).
Set up of the calculation procedure. A number of assumptions have been made in the calculation procedure which may have an impact on the final results. All of the items below have been assumed based on the Munters’s selection tool outputs or information provided by Munters, however, their validity needs to be carefully reviewed in order to confirm the results:
o Performance Coefficients, e.g. pump power, SFP, DX COP figures.
o Control strategy, e.g. set point temperatures, modulating fan powers, etc
o Calculation methodology, including the formulas selected to describe all the phenomena occurring in the cooling units, assumption of the ideal processes (e.g. ideal humidification), etc.
A large variation in water consumption has been observed. The Cundall model saturates all the scavenger air prior to entering the heat exchanger. This is not a true representation of the process in the Munters unit wherein, in fact, a constant evaporation process is taking place as air passes up through the heat exchanger, maintaining saturation. This will result in better efficiency and more water evaporated.
All the above factors may have a bearing on the final results.
The following table details the total energy and water calculated by Munters and Cundall independently. The major discrepancies noted are relate to the occurrence of hot and dry conditions where the measured performance of the units exceeds the simplified operation within this calculation. It is expected that the necessarily simplified assumption of the heat exchanger efficiency has resulted in the underestimation of the units performance where high differential between the ambient and saturated condition exists.
The Munters results have been proven to be conservative in comparison to laboratory testing of the units operating in varying environmental conditions. Cundall have been involved in witness testing the units under different ambient conditions and can verify the results as being accurate.

Munters Oasis™ – Indirect Evaporative Cooler – Desktop Energy and Water Study 65
Rev: C
Location Munters Calculations Cundall Calculations
Energy Difference
Water Difference Energy
[kWh] Water [m³]
Energy [kWh]
Water [m³]
Tokyo 513,815 8,254 535,969 3,644 4% -56%
Sydney 452,570 8,487 471,050 6,255 4% -26%
Melbourne 410,062 8,331 430,598 4,255 5% -49%
Perth 433,602 8,678 453,410 8,592 5% -1%
Singapore 1,254,857 8,575 1,335,210 12,335 6% 44%
Hong Kong 809,187 9,061 895,280 9,483 11% 5%
Hohhot 475,202 5,236 433,954 5,050 -9% -4%
Shanghai 647,873 7,965 646,924 6,252 0% -22%
Beijing 475,149 6,707 546,352 8,067 15% 20%
Shijazhuang 492,403 7,131 546,743 8,619 11% 21%
Chongqing 599,663 8,864 664,047 7,538 11% -15%
Urumqi 464,112 5,175 425,081 5,979 -8% 16%
Hangzhou 600,083 7,863 648,790 7,280 8% -7%
Nanjing 602,648 7,081 644,279 7,073 7% 0%
Wuhan 642,730 7,871 691,643 8,650 8% 10%
Guangzhou 812,553 9,336 857,094 9,735 5% 4%
Zhengzhou 512,956 7,294 579,150 8,056 13% 10%
Harbin 430,279 4,645 452,678 4,297 5% -7%
Note: Due to the late inclusion of Manila and Kuala Lumpur comparison results are not available at this point in time.

Munters Oasis™ – Indirect Evaporative Cooler – Desktop Energy and Water Study 66
Rev: C
Appendix B: - Unit Selection and Application
Oasis™ Indirect Evaporative Cooler Configurations
In order to assess the Oasis™ Indirect Evaporative Cooler performance, a typical unit selection is presented in Figure 12; details of which are tabulated in Appendix A: - Basis of Calculations. The selection is based on a hypothetical scenario for a data hall IT load of 720kW, which is to be supported by six Oasis™ Indirect Evaporative Coolers at (N+1). Four unit sizes are available rated at 100kW, 200kW and 300kW and 400 as well as a container based unit for international shipping to APAC region, All units can be configured for top, bottom or front supply and return.
The selection presents a typical unit for the most efficient deployment in this test case, with efficient air flow management systems such as hot aisle containment to be employed in the data hall. The maximum air volume duty of the external scavenger fans for this selection is 68,000 m³/h (per unit) and the internal recirculation fans 56,785 m³/h (per unit), however, it must be emphasised that these are design maximum capacities and that during normal operation the scavenger air volume flow rates will reduce, as they modulate to suit the ambient conditions.
The unit is designed to supply a constant volume of air into the data hall if IT load remains constant. The supply fans are controlled by a pressure differential between the supply aisle and return plenum. The control strategy used to ensure constant supply temperature is by means of a combination of variable scavenger fan volume and variable mechanical cooling duty. Evaporative cooling is a fixed variable (on/off), that is self-scaling as evaporation rate is a function of ambient conditions. If ambient temperatures climb above the achievable evaporative cooling duty of the unit, then mechanical cooling can be scaled to ‘top-up’ the required duty.
Figure 12: 3D representation of a floor mounted Oasis™ Indirect Evaporative Cooler (100kW to 300kW range).

Munters Oasis™ – Indirect Evaporative Cooler – Desktop Energy and Water Study 67
Rev: C
When making a selection for a particular location and application, the cost of electricity and water can be factored in to minimise the final operational costs. By raising or reducing the point at which evaporative cooling is activated, the amount of water and the amount of electricity consumed can be manipulated.
Figure 13: Specific Fan Power (SPF) vs Temperature (DB) using Oasis IEC
The unit can be configured to be roof or floor mounted. The process air enters the top of the unit and is drawn down by the fans and through the polymer tube heat exchanger. The process air then passes through an evaporator coil (if fitted), and out of the front or bottom of the unit into the data hall. Scavenger air is drawn into the base of the unit and up through the polymer tube heat exchanger by high level fans. Air leaving the heat exchanger passes through a mist eliminator and condenser before being exhausted. The roof mounted unit shown in Figure 12 has its supply to the data hall at the base of the unit with scavenger air being pulled in from the side and exhausted out of the top. The unit is inherently flexible to the individual needs of a project.

Munters Oasis™ – Indirect Evaporative Cooler – Desktop Energy and Water Study 68
Rev: C
Figure 14: Example Oasis™ IEC arrangement; roof mounted unit.
Figure 15: Example Oasis™ IEC arrangement; side mounted unit with direct wall ducting.

Munters Oasis™ – Indirect Evaporative Cooler – Desktop Energy and Water Study 69
Rev: C
The Oasis™ Indirect Evaporative Cooler uses a patented evaporative polymer tube heat exchanger module (Figure 16) that is the heart of the Oasis cooling philosophy. The number of modules within a unit will vary depending on its rating. Multiple polymer ribbed tubes mounted in an aluminium frame create a large surface area for heat transfer to take place. The tube profile causes a large degree of turbulence in the air stream that improves heat transfer and leads to inherent increases in static pressure. It should be noted that the pressure loss, and the required fan power, across this type of heat exchanger is significantly less than a tightly fitted plate design. The polymer tubes and the aluminium housing that contains them provides excellent corrosion resistance in the harshest of environments. The water spray and welded stainless steel sump is a robust and reliable cooling method. Deposits that accumulate on the tubes during evaporation are dislodged by a pressure difference across the tubes causing them to vibrate.
Figure 16: Polymer tube heat exchanger, detailed view.
Figure 17: Oasis™ Indirect Evaporative Cooler polymer heat exchanger function diagram

Munters Oasis™ – Indirect Evaporative Cooler – Desktop Energy and Water Study 70
Rev: C
The patented polymer tube heat exchanger is an innovative design that has already been manufactured and deployed. An increasing number of Munters clients requested additional performance verification from an external authority. Munters commissioned Intertek to verify the performance of a notional heat exchanger. This test confirmed the performance of the heat exchange system against figures quoted by Munters.
Efficiency figures for the polymer tube heat exchanger from the manufacturer state that when running dry, the heat exchanger is up to 56.6% efficient. This figure then climbs to a maximum 83.5% when wetted and with increased scavenger air flow.
Mains, grey or harvested water that has been suitably treated can be used for evaporative cooling as opposed to other units with misting that require a mains supply. The chemical make-up of the water changes as the evaporation process progresses. Dirty air that passes through the heat exchanger will also contain contaminants such as pollen and dust that are deposited and washed into the sump. Automatic controls constantly measure the water content and are designed to dump the sump water when calcium content climbs above a set point.
As with any evaporative cooler, the reuse of water used for evaporative cooling needs to be monitored and managed to ensure no outbreaks of legionella occur. Legionella typically enters the system via potable make-up water for the evaporation process. The legionella bacteria then requires certain conditions for concentrations to increase. The Oasis™ Indirect Evaporative Cooler maintains the water in a dark environment, light being an essential component for legionella growth. Water within the unit is continuously moving, eliminating any stagnant water needed for legionella to grow. Sump water temperature is also monitored and dumped if it climbs too high or is left standing for too long. Regular cleaning and drying out of the unit kills any bacteria that might be present and removes any accumulated nutrients.
The unit and its various functions can be viewed in operation at https://www.Munters.com/oasismovie or directly on You Tube https://youtu.be/Sp7Aru39CsE
For all Munters data center related information visit www.Munters.com/datacenters or email [email protected]
Some images showing the internal cooling mechanism of the unit are given in Figure 18

Munters Oasis™ – Indirect Evaporative Cooler – Desktop Energy and Water Study 71
Rev: C
Figure 18: Munters Oasis™ detailed operational views.

Munters Oasis™ – Indirect Evaporative Cooler – Desktop Energy and Water Study 72
Rev: C
Electrical Infrastructure Requirements
A chilled water data centre has a higher PUE than an IAO solution, as previously described. With IT demand being a relatively fixed load, higher PUE data centres will require additional power to support cooling systems such as chillers, pumps, CRAC units and ancillary equipment, as opposed to an IAO data centre that will require fans, a small amount of pump power, and some DX cooling top up depending on location. This has several knock on cost saving effects.
Reducing the required power (per m²) means that more IT space can be allocated for a given supply of power to site.
Alternatively, an IAO site will need a smaller power supply than a chilled water equivalent, reducing utility costs of getting power to site and making more sites viableviii. Transformer and generator ratings can be reduced along with switchgear and cable sizes. This will have obvious cost benefits as well as easing the construction process.
Part Load Application
A large proportion of a data halls life is spent at part load. This can be for many reasons such as initial phased deployment, maintenance/equipment changeover, or the installed server demand rising and falling. IAO systems are extremely efficient at part load. The air and fan based system is able to take advantage of the fan laws which dictate that consumed power will be to the power of three higher as fan duty increases.
Chilled water systems have a number of fixed loads that apply regardless of IT load. Chilled water systems generally have to be designed to satisfy a tighter dead band of load with the inherent limitations this brings.
Clients in the present market are looking for designs that offer low initial capital outlay that can be phased as demand increases, combined with low running costs. Although a chilled water system can be phased, the initial capital outlay and running costs will be higher than an IAO system that simply requires an additional cooling unit and a means to connect it to the data hall.
The Oasis IEC lends itself particularly well to part loading for the reasons given above. Simulated results in Singapore are shown below, the pPUE increases from 1.21 to a maximum of 1.38 at 25% loading.
Figure 19: Performance of a IAC system are part loads, 25% to 100% hall loading.

Munters Oasis™ – Indirect Evaporative Cooler – Desktop Energy and Water Study 73
Rev: C
Appendix C: - Weather Profilesix
Harbin (HeiLongJiang), China

Munters Oasis™ – Indirect Evaporative Cooler – Desktop Energy and Water Study 74
Rev: C
Urumqi (Xinjiang), China

Munters Oasis™ – Indirect Evaporative Cooler – Desktop Energy and Water Study 75
Rev: C
Hohhot, Inner Mongolia

Munters Oasis™ – Indirect Evaporative Cooler – Desktop Energy and Water Study 76
Rev: C
Beijing, China

Munters Oasis™ – Indirect Evaporative Cooler – Desktop Energy and Water Study 77
Rev: C
Shijiazhuang (HeBei), China

Munters Oasis™ – Indirect Evaporative Cooler – Desktop Energy and Water Study 78
Rev: C
Tokyo, Japan
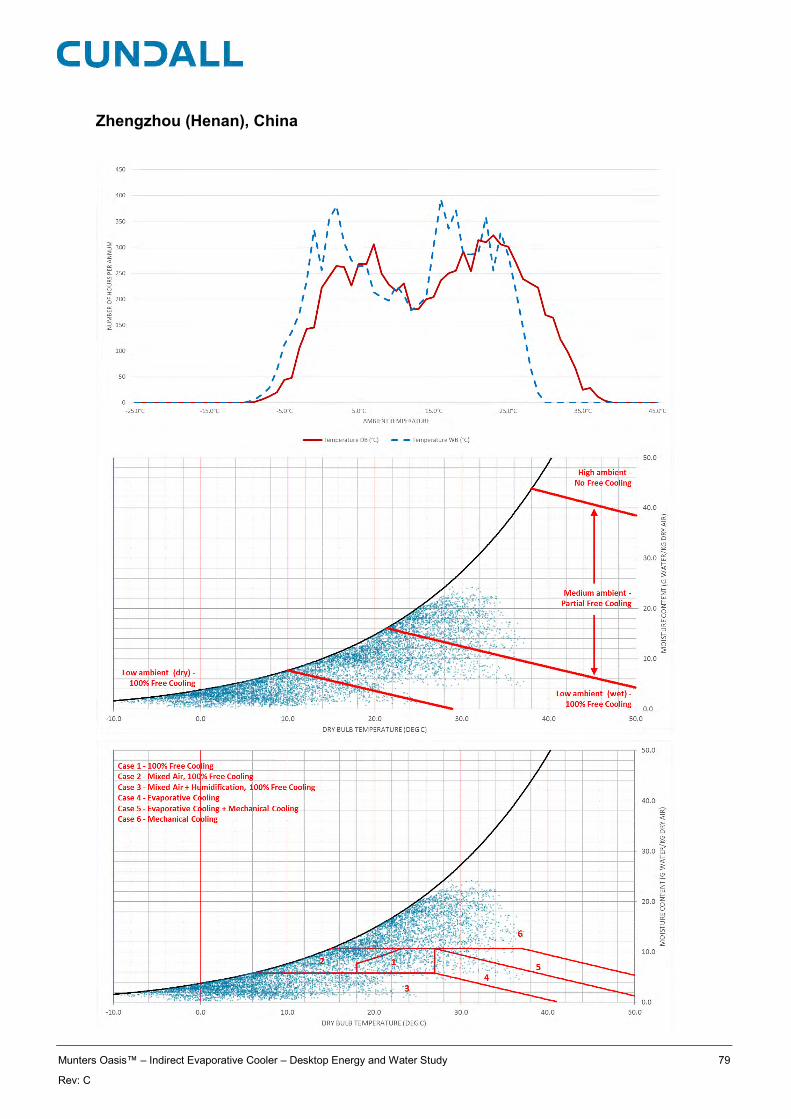
Munters Oasis™ – Indirect Evaporative Cooler – Desktop Energy and Water Study 79
Rev: C
Zhengzhou (Henan), China

Munters Oasis™ – Indirect Evaporative Cooler – Desktop Energy and Water Study 80
Rev: C
Nanjing (Jiangsu), China

Munters Oasis™ – Indirect Evaporative Cooler – Desktop Energy and Water Study 81
Rev: C
Chongqing, China

Munters Oasis™ – Indirect Evaporative Cooler – Desktop Energy and Water Study 82
Rev: C
Shanghai, China

Munters Oasis™ – Indirect Evaporative Cooler – Desktop Energy and Water Study 83
Rev: C
Wuhan (Hubei), China

Munters Oasis™ – Indirect Evaporative Cooler – Desktop Energy and Water Study 84
Rev: C
Hangzhou (ZheJiang), China

Munters Oasis™ – Indirect Evaporative Cooler – Desktop Energy and Water Study 85
Rev: C
Guangzhou (Guangdong), China

Munters Oasis™ – Indirect Evaporative Cooler – Desktop Energy and Water Study 86
Rev: C
Hong Kong, Hong Kong

Munters Oasis™ – Indirect Evaporative Cooler – Desktop Energy and Water Study 87
Rev: C
Manila, Philippines

Munters Oasis™ – Indirect Evaporative Cooler – Desktop Energy and Water Study 88
Rev: C
Kuala Lumpur, Malaysia

Munters Oasis™ – Indirect Evaporative Cooler – Desktop Energy and Water Study 89
Rev: C
Singapore, Singapore

Munters Oasis™ – Indirect Evaporative Cooler – Desktop Energy and Water Study 90
Rev: C
Perth, Australia

Munters Oasis™ – Indirect Evaporative Cooler – Desktop Energy and Water Study 91
Rev: C
Sydney, Australia

Munters Oasis™ – Indirect Evaporative Cooler – Desktop Energy and Water Study 92
Rev: C
Melbourne, Australia

Munters Oasis™ – Indirect Evaporative Cooler – Desktop Energy and Water Study 93
Rev: C
Appendix D: - References
i Kaiser et.al. White Paper #41, 2011, The Green Grid ii Datacenter Dynamics – Focus, Off the Grid,…. And other questions for the future. Volume 3 Issue 33 January/February 2014. iii Newcombe.L, 2011. Manchester to Madrid – Chillers not needed, Version 1.0 iv http://epi.yale.edu/pollution-map/ v http://www.datacenterknowledge.com/inside-microsofts-dublin-mega-data-center/ vi http://www.datacenterknowledge.com/archives/2009/07/15/googles-chiller-less-data-center/ vii http://www.datacenterknowledge.com/archives/2009/07/15/googles-chiller-less-data-center/ viii Tozer.R et.al. 2012. Minimising Data Centre Total Cost of Ownership Through Energy Efficient Analysis. CIBSE ASHRAE Technical Symposium. ix http://apps1.eere.energy.gov/buildings/energyplus/weatherdata_about.cfm;jsessionid=1A9A0DA1B01E74BE3D4909C0DF685C4A.eere?CFID=3916890&CFTOKEN=84e77c00c4fd7bc5-45249B84-E552-AB00-D2442F111462A77B