oat in metabolites secondary(avena sativa l.) entries and testing of their biological activity. 13th...
TRANSCRIPT
ls tr tor
OF
L
BIOLOGICAL ACTIVITY OF
SECONDARY METABOLITES IN OAT
(AVEÌ{A SATTVA)
By
Sohbat Bahraminejad
Thesis submitted for the degree of Doctor of Philosophy
The University of Adelaide
Faculty of Sciences
School of Agriculture, Food and Wine
Discipline of Plant and Food Science
December 2006
Table of Contents
ACKNOWLEDGEMENTS V
PUBLICATION FROM THE THESIS
vil
VI
tx
XI
DECLARATION
ABSTRACT
ABBREVIATIONS
1.2.1.21.2.r.3t.2.1.4
LITERATURE REVIEW
1.2 Secondary metabolites...I.2.1 Flavonoids
l.2.l.I Chemistry and structure..........
1
23J4699
Function of flavonoids in plantsFunction of flavonoids in plant defence systemsFlavonoids in oat (Avena sativa)
1.2.2 Saponins ........L2.2.1 Function of saponins in plant defence systems1.2.2.2 Saponins in oat (Avena sativa)......
1.3 Plant defence responses..1.3.1 Hypersensitive response
1.5 Elicitors....1.5.1 Salicylic acid .............1.5.2 Ethylene....1.5.3 Jasmonic acid and methyl jasmonate...1.5.4 Mechanical damage
1.6 Plant parasitic nematodes1.6.1 Cereal cyst nemato de (Heterodera avenae)L6.2 Stem nematode (Ditylenchus dipsaci)
1011
18.18.18L3.2 Systemic acquired resistance..
1.4 Pathogenesis related proteins... 19
.21
.23
20202l
242425
1.7 Nematode control...... 25
1.8 Plant biochemical response to nematodes.............. ........26
I
1
1.9 Oat (Avena sativa).......Quoll
,........279.19.29.3
1.1.1.
Potoroo272828Mortlock
1.10 Aims of the study 29
FLAVONOIDS AND SAPONINS lN OAT (AVENA SATTVA); ANALYSIS OF
THE|R BTOLOGTCAL ACT|V|TY........... ..........30
2.2 Materials and MethodsPlant material and culture methodsInduction of secondary metabolites in oat.....Extraction and high performance liquid chromatography anaIyses..............Genetic variation of flavone-C-glycosides and the effect of MJ treatment...Effectiveness of MJ application on concentration of FCGs..............Application of Tween 20 plus MJ on concentration of FCGsChanges in concentration of FCGs after MJ application
Bioassays of bacterial pathogens..Induction of active compounds in the oat shoots by MJHigh voltage paper electrophoresis ............Detection, purification and bioassays of saponins ............LC-mass spectrometry identifi cation of saponinsInduction of active compounds in the oat shoots by homogenisation...........
2.2.17 Statistical analysis
2,3 Results......2.3.1 Separation and identification of flavonoids.................
2.2.8 Cloning and induction of a PR5 gene in oat by MJ........2.2.8.1 Plant material...............2.2.8.2 RNA extraction and quantification..............2.2.8.3 cDNA synthesis and reverse transcription polymerase chain reaction2.2.8.4 Cloning2.2.8.5 Digoxygenin PR5 probe synthesis....2.2.8.6 Probe quantification..............2.2.8.7 Northern blot and hybridization of Avena sativa PR5 (AsPR5)
2.2.9 Pathogens and culture methods2.2.10 Bioassays of fungal pathogens
2.2.12.2.22.2,32.2.42.2.52.2.62.2.7
2.2.112.2.122.2.132.2.142.2.152.2.16
2.3.22.3.32.3.42.3.52.3.6
30
3232323233343435353536313840404l424344444546474950
5151535562636466697273
The effect of MJ treatment on flavone-C-glycosides................Effect of MJ application methods on the induction of FCGsEffect of Tween 20 on the induction of FCGsChanges in concentration of FCGs after MJ application.............Cloning and induction of a PR5 gene in oat by MJ........
2.3.7 Antimicrobial activity of shoot crude extracts2.3.8 Induction of active compounds in oat shoots by MJ2.3.9 Fractionation of shoot extracts and testing for biological activity.2.3.10 Saponins in the shoot extract of oat and antifungal activity
2.3.11 Purification and identification of saponins2.3.12 Bioassay of saponins2.3.13 Induction of active compounds in the oat shoots by homogenisation
2.4 Discussion2.4.1 Variation in FCGs in oat accessions.
76..81..84
2.4.22.4.32.4.42.4.52.4.6
3.2.43.2.53.2.63.2.7
MJ and FCGs in oat.........FCG quantification in oat roots and shootsBioassay with crude extract fractions of oat shootsBioassay of saponinsEffect of MJ on antifungal activity of crude extracts
8585858l878889
91
9292929394949696
METABOLITES CORRELATED WITH CEREAL CYST NEMATODE
RESTSTANCE rN OAT (AVENA SATTVA)
3.2 Materials and Methods3.2.1 Plant Material .............3.2.2 Plant culture and maintenance..3.2.3 Flavonoid extraction and assessment by HPLC
Search for metabolites associated with CCN female count.............Metabolite extraction from oat roots and HPLC analysisInduction of secondary metabolites in oat.....LC mass spectrometry identification.............
9t
3.3 Results...... ....................973.3.I Flavone-C-glycosides concentration and nematode resistance .....913.3.2 Metabolites associated with CCN resistance.. .............983.3.3 Induced metabolites in oat roots.......... ....104
3.4 Discussion 107
GENERAL DISCUSSION AND FUTURE RESEARCH 111
4.1 Metabolites associated with CCN resistance.............4.1.1 Genetic variation for FCG concentration in oat.....4.1.2 Correlation of secondary metabolites and CCN female counts.....
4.2.1 Antimicrobial activity of flavonoids in oat4.2.2 Antifungal activity of saponins in oat .......
4.2 Antimicrobial activity of flavonoids and saponins 113113lt4
111111112
1154.3 Methyl jasmonate and secondary metabolites in oat plants4.3.1 MJ and FCGs in oat.........4.3.2 MJ and the effect on other secondary metabolites in the oat roots 115
117
115
lll
APPENDICES
4.1 List of oat accessions obtained from SARDI, SA, 4ustra1ia..........................117
^.2 Formulation of University of California (UC) mix.. ...120
4.3 Hoagland's solution (Hydroponic Sales and Services, SA, Australia)..........121
^.4 Optimising the method of FCGs extraction
44.1 Materials and methods....44.1.1 Effect of exposure time to methanol on the concentration of FCGs .
A4.I.2 Effect of butanol on the concentration of FCGs1.4.2 Results
1.4.2.1 Changes in the method of FCG extraction
122122122122123123
4.5 CCN count data used to identify extreme individuals in SSD population. Themost susceptible lines had mean CCN counts of between 7 to 13, whereas the mostresistant individuals had CCN counts less than 1. In many of the susceptible lines, forexample lines22,74rl5l and 154, the CNN count was lower in 2001 than in 2000 and
REFERENCES 126
IV
Acknowledgements
I would like to express my deepest thank to Drs Carolyn Schultz, Ian Riley and
Pamela Zwer lor their supervision, support, encouragement and guidance throughout
the course of this study.
I wish to thank Prof. Otto Schmidt for encouragement and providing laboratory
facilities and to Dr Robert Asenstorfer for his help in data analysis, valuable discussion,
encouragement and assistance. I sincerely thank Dr Max Tate and Dr Kerrie Davies for
their encouragement, Dr Kevin Williams for providing the data of CCN resistance and
valuable comments.
I would like to thank Dr Anne Osbourn from John Innes centre, UK, for
providing samples of avenacin and avenacoside.
My special thanks to Jelle Lahnstein and Yoji Hayasaka for HPLC and LC-MS
analysis and their constructive comments.
I gratefully acknowledge:
SARDI Oat Breeding group (Sue Hoppo and Jenny Emery), SARDI Field Crop
Pathology group (John Lewis, Milanka Matic, Danuta Schot, Esther Cappio and Jan
Gooden). People in Otto's lab (Dr Mehdi Sohani, Reza Hosseini, Nicki Featherstone
and Mohammad Mahbubur Rahman), people in Ian's lab especially Zhao Zeng Qi,
people in Carolyn's lab (Natalie Kibble, Michael Tran, Rodney Davies and Umesh
Nagasandra).
I would like to gratefully acknowledge Ministry of Science, Research and
Technology of Iran for scholarship grant.
Finally, I wish to express my deepest and heartiest gratitude to my wife,
Zahraalsadat Mirmoeini for her support during this undertaking and to my daughter
Saharnaz.
V
Publication from the thesis
Bahraminejad S, Asenstorfer R E, Riley lT, Zwer P K, Schultz C J, and Schmidt
O. 2006. Genetic variation of flavonoid defence compound concentrations in oat
(Avena sativa L.) entries and testing of their biological activity. 13th Australasian Plant
Breeding Conference, Christchurch, New Zealand. pp. I 127 - I 132
Bahraminejad S, Asenstorfer R E, Riley I T, and Schultz C. J. (2007, in press)
Analysis of the Antimicrobial Activity of Flavonoids and the Shoots of Oats (Avena
s ativa L. ). Journal of Phytopathology.
V1

Declaration
This work contains no material which has been accepted for the award of any other
degree or diploma in any university or other tertiary institution and, to the best of my
knowledge and belief, contains no material previously published or written by another
person, except where due reference has been made in the text.
I give consent to this copy of my thesis, when deposited in the University Library,
being available for loan and photocopying.
Date: G 'Ol. O-?

To my w|fe, Zqhraalsadat
and
My daughter, Saharnaz
vlll
Abstract
Flavone-C-glycosides (FCGs) and saponins are important defence compounds
in many species of plants. The concentration of FCGs in 72 oat accessions rwas
determined in a pilot experiment to explore the variation of this trait. Concentration of
FCG compounds ranged from 1.32 to 12.83 mg (rutin equiv.)/g dry shoot. This
variation was significant in subsequent experiments evaluating 2l and 5 cultivars,
respectively.
The effect of methyl jasmonate (MJ) on FCG concentration was studied on 2l
accessions in more detail. No significant induction of FCGs was observed in the shoots
of MJ treated and untreated plants. The activity of MJ was confirmed by showing the
induction of the oat thaumatinJike gene (PR5) in the roots but not shoots of oat cv.
Quoll.
Crude extracts from the shoots of oat cv. Quoll were tested against four species
of bacteria and eight species of fungi. Bacterial growth was not inhibited by the crude
methanolic extract. The mycelial growth of all Pyrenophora species tested, except P.
avenae DAR 33699, was inhibited by the methanolic crude extract of oat, whereas the
mycelia growth of Fusariurn graminearum, Mycosphaerella pinodes and Rhizoctonia
solani was not inhibited. Fractions with high concentrations of FCGs had no inhibitory
effect against Pyrenophora teres f. teres or Pyrenophora teres f. maculata. The highest
concentration of antifungal activity was found in fractions containing the saponins,26-
des glucoavenaco side A (26-DGA) and 26 - des glucoavenacoside B (26-DGB ).
A single seed descent population of oat generated from the cross between
Potoroo, a cultivar resistant to cereal cyst nematode (CCN; Heterodera avenae), and
Mortlock, a susceptible cultivar, was used to identify metabolites correlated with CCN
IX
resistance. This population had been assessed for CCN infestation each year from 2000
to 2002 and against stem nematode (Ditylenchus dipsaci) in 2001 as part of an
unrelated study, and showed segregation for resistance to these nematodes. In this
study, 30 SSD extreme lines that showed high and low numbers of white female
nematodes were selected. Three compounds were found in the methanolic extract of oat
roots that had negatively significant correlation with the CCN female counts. These
compounds were partially characterised by ultraviolet-visible (UV-vis) and liquid
chromatography-mass spectrometry (LC-MS). No significant correlation was found
between previously identified avenacins in oat roots and CCN female counts. There
was also no significant correlation found between flavonoids in oat roots and CCN
female counts and flavonoids in oat shoot and stem nematodes scores.
In an independent experiment the induction of methyl jasmonate on secondary
metabolites in oat roots was examined. Twelve high performance liquid
chromatography (HPlC)-identified peaks were induced by exogenous application of
MJ. LC-MS analysis identified selected induced peaks similar to avenacoside A and/or
26-desglucoavenacoside B in oat roots. This indicates for the first time that the pathway
could be active in roots as well as shoots. Two root' avenacins, avenacin Ã-2 and
avenacin B-1 were induced by MJ, one of these, avenacin Ã-2, negatively correlated
with CCN female counts. However, the correlation was not significant based on this
analysis of the extreme subset of the SSD population.
The results in this study provides several important areas for further research
that in future should allow plant breeders to develop lines with better resistance to
nematodes.
X
Ara
bp
BYDVCCN
26-DGA
26-DGB
cDNA
DIG
DNA
dNTPs
DTT
DW
EDTA
equiv.
ES
FCGs
Gga
Ggt
glc
HPLC
HR
HVPE
IPTG
JA
LB
I,C-MS
LSD
MMJ
MOPS
mRNA
MQ water
Abbreviations
arabinosyl
base pair(s)
barley yellow dwarf virus
cereal cyst nematode
26-desglucoavenacoside A26-desglucoavenacoside B
complimentary deoxyribonucleic acid
digoxygenin
deoxyribonucleic acid
deoxynucleotide triphosphates
dithiothreitol
dry weight
ethylenediaminetetraacetic acid
equivalent
electrospray
flavone-C-glycosides
Gaeumannomyce s graminis v aL av enae
G. graminis var. triticiglucosyl
high performance liquid chromatography
hypersensitive response
high voltage paper electrophoresis
isopropyl-B-D-thiogalactopyranoside
jasmonic acid
Luria-Bertini
liquicl chromatography-mass spectrometry
least significant difference
molar
methyl jasmonate
3-(N-morpholino) propane sulfonic acid
messenger RNA
milliQ water
x1
MWNZ
PBS
PCR
PDA
PR
PTLC
RB
Rha
RNA
rRNA
RT
Rt
SA
sad
SARDI
SBA
SDS
SE
SN
SSC
SSD
TAE
TLC
X-Gal
molecular weight
New Zealand
phosphate-buffered saline
polymerase chain reaction
potato dextrose agar
pathogenesis related
preparative TLC
randomised block
rhamnosyl
ribonucleic acid
ribosomal RNA
room temperature
retention time
salicylic acid
saponin-deficient
South Australian Research and Development Institute
soft buffer agar
sodium dodecyl sulphate
standard error
stem nematode
sodium chloride-sodium citrate solution
single seed descent
tris acetate EDTA
thin layer chromatography
5 bromo-4-chloro-3 -inodlyl-p-D-galactopyranoside
xlt
Chapter One
Literature Review
1.1 Introduction
Plants are subject to attack by a wide range of organisms, including fungi,
bacteria, viruses, nematodes and insects. They respond to attack through different
mechanisms, such as rapid production of salicylic acid (SA), methyl jasmonate (MJ),
ion fluxes, strengthen physical barriers, production of pathogenesis-related (PR)
proteins and secondary metabolites. Pathogens themselves employ various strategies to
overcome the plant defence systems. The interaction between plant and pathogens
include plant resistance, allowing plant survival, or plant susceptibility, causing yield
loss or even plant death.
Use of plants with natural defence mechanisms is safe, economical and the ideal
strategy for pest and pathogen control, because the risks of environmental hazards are
insignificant and the need for pesticides reduced. To improve resistance in crops, a
comprehensive understanding of the mechanisms of resistance is needed. The defence
response of plants to pests and pathogens involves many biochemical processes. One of
the well-studied mechanisms is the production of secondary metabolites.
This literature review begins with a brief review of the structure and function of
two important classes of secondary metabolites, the flavonoid and saponins, with a
focus on their defence functions. This review also discusses the role of PR proteins in
plant defence systems and the importance of elicitors in identifying signif,rcant defence
genes and metabolites in plants. The remainder of this review will focus on the
important oat cultivars in South Australia and review the breeding priorities such as the
1
significance of nematodes including cereal cyst nematode (CCN) and stem nematode
(SN) on reducing the yield of cereals will be discussed. Plant biochemical responses to
the nematodes as an approach to understand resistance mechanisms will also be
presented. The potential of oat compounds to control diseases that may support use of
oat as a beneficial rotation crop will be considered.
1.2 Secondary metabolites
Plants produce two major groups of metabolites, 1) primary metabolites like
carbohydrates, lipids, amino acids and nucleic acids that are necessary for growth and
development and 2) secondary metabolites such as organic acids, phenolic compounds,
saponins, flavonoids, alkaloids, volatile oils, etc. that are generally not essential for the
growth and development of plant (Dixon, 2001). The high number of secondary
metabolites (about 100,000) encourages scientists to use this rich diversity to improve
plant and animal defence system. However, this diversity has made it difficult to
employ molecular and genetic techniques for determining the function of each
metabolite in plant defence systems (Dixon, 2001). Some of the secondary metabolites
give plants characteristics, for example terpenoids in chilli peppers give taste and
flavonoids in orange give colour and flavour (Cowan, 1999; Harborne and Williams,
2000). Some of the secondary metabolites also protect plants due to their antimicrobial
properties (Cowan, 1999; Harborne and Williams, 2000). Active secondary metabolites
in plant defence system can be categorised into three broad groups, 1) constitutively
exposed compounds such as phytoanticipins that exist in healthy plants in their
biologically active forms (Osbourn, 1996), 2) signalling molecules that activate a
variety of responses, or 3) induced compounds such as phytoalexins (Dixon et al.,
2002). The distinction between phytoalexins or phytoanticipins is not obvious, as some
2
compounds may be phytoalexins in one species and phytoanticipins in another species
(Dixon,2001).
1.2.1 Flavonoids
1.2.1.1 Chemístry and structure
Flavonoids are one of the largest group of plant secondary metabolites and are
present in a wide range of plants including agricultural plants, fruits, vegetables and
cereals (Schijlen et al., 2004). Over 6400 different flavonoid compounds have been
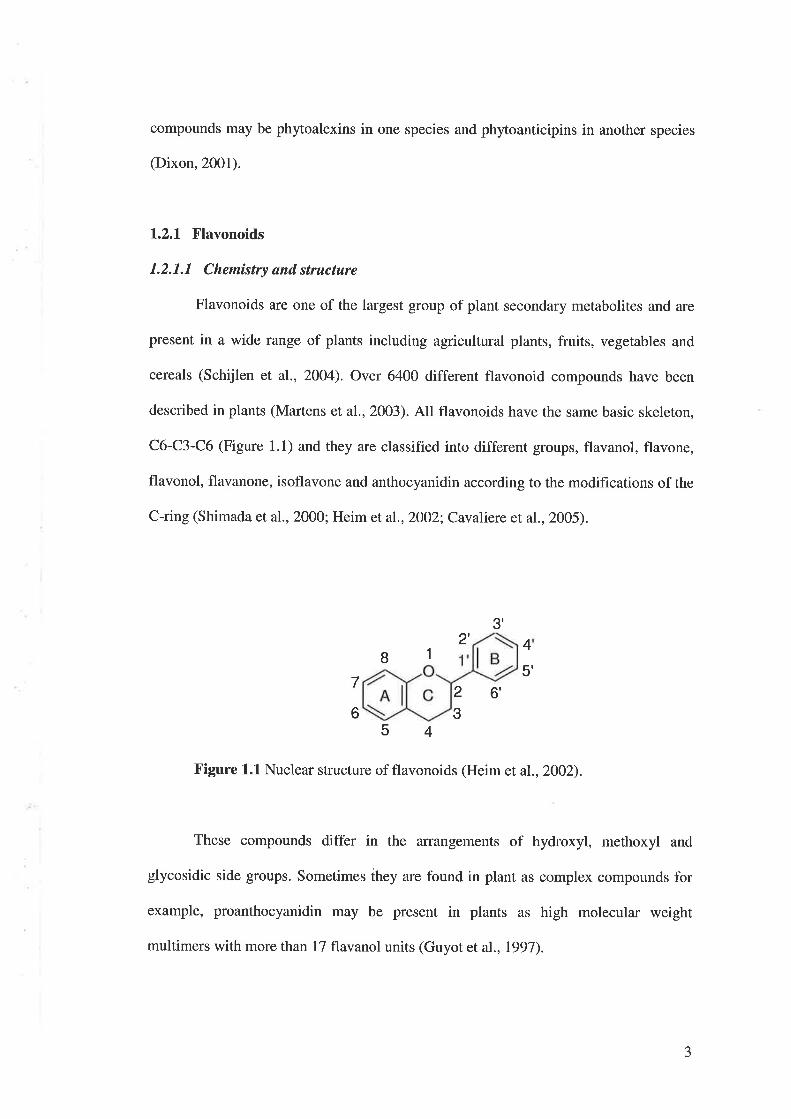
described in plants (Martens et a1.,2003). All flavonoids have the same basic skeleton,
C6-C3-C6 (Figure 1.1) and they are classified into different groups, flavanol, flavone,
flavonol, flavanone, isoflavone and anthocyanidin according to the modifications of the
C-ring (Shimada et al., 2000; Heim et al.,2OO2; Cavaliere et a1.,2005).
8 1
z',J
6'
4
5'7
62
354
Figure 1.1 Nuclear structure of flavonoids (Heim et al.,2OO2).
Thcse compounds differ in the arrangenents of hydloxyl, ntethoxyl and
glycosidic side groups. Sometimes they are found in plant as complex compounds for
example, proanthocyanidin may be present in plants as high molecular weight
multimers with more than l7 flavanol units (Guyot et al., 1997).
3
It has been shown that the different functional groups of the rings provide
different functions. For example, flavones generally have higher antifungal activity
than flavanone (Weidenborner and Jha, 1997). Contradictory reports of the activity of
flavonoids with and without hydroxyl group have been published (Cowan, 1999). For
example, it has been reported that flavonoids without hydroxyl group on their B-ring
are more active against micro-organisms than those with hydroxyl group. However,
other research has shown that hydroxylated flavonoids have more activity against
pathogens than unhydroxylated flavonoids (Cowan, 1999). UV-B treatment results in a
higher level of B-ring hydroxylation suggesting that this modification provides UV
protection (Ryan et al., 2002).
1.2.1.2 Function of flavonoíds in plants
Flavonoids have various functions such as antioxidants (Dixon and Steele,
1999; Harborne and Williams, 2000; Peterson, 2001), inducers of rhizobial nod genes
in leguminous plants (Dixon and Steele, 1999; Shimada et a1., 2000; Dixon et al.,2OO2;
Shimada et al., 2003) attractors of pollinator insects by providing pigmentation and
flower colour (Harborne and Williams, 2000; Moriguchi et al., 20Ol; Schijlen et a1.,
2004), stimulators of pollen germination (Dixon and Paiva, 1995), regulators of auxin
transpofters (Dixon and Paiva, 1995) protectors against ultraviolet light (Harborne and
Williams, 2O0O; Ryan and Moura, 2OO2; Ryan et al., 2OO2), frost (Swiderski et al.,
2004), pathogens and herbivores (Harborne and Williams, 2OOO; Simmonds, 2001).
One of the most important and useful effects of flavonoids is their antioxidant
property. This properly is attributed to their capacity to transfer electrons to free
radicals like vitamin E radicals, activate key antioxidant enzymes, inhibit oxidases
(Heim et al., 2OO2) and inhibit oxidation of proteins (Harborne and Williams, 2000).
The number of flavan nuclei, the position and types of substitutions all affect the
4
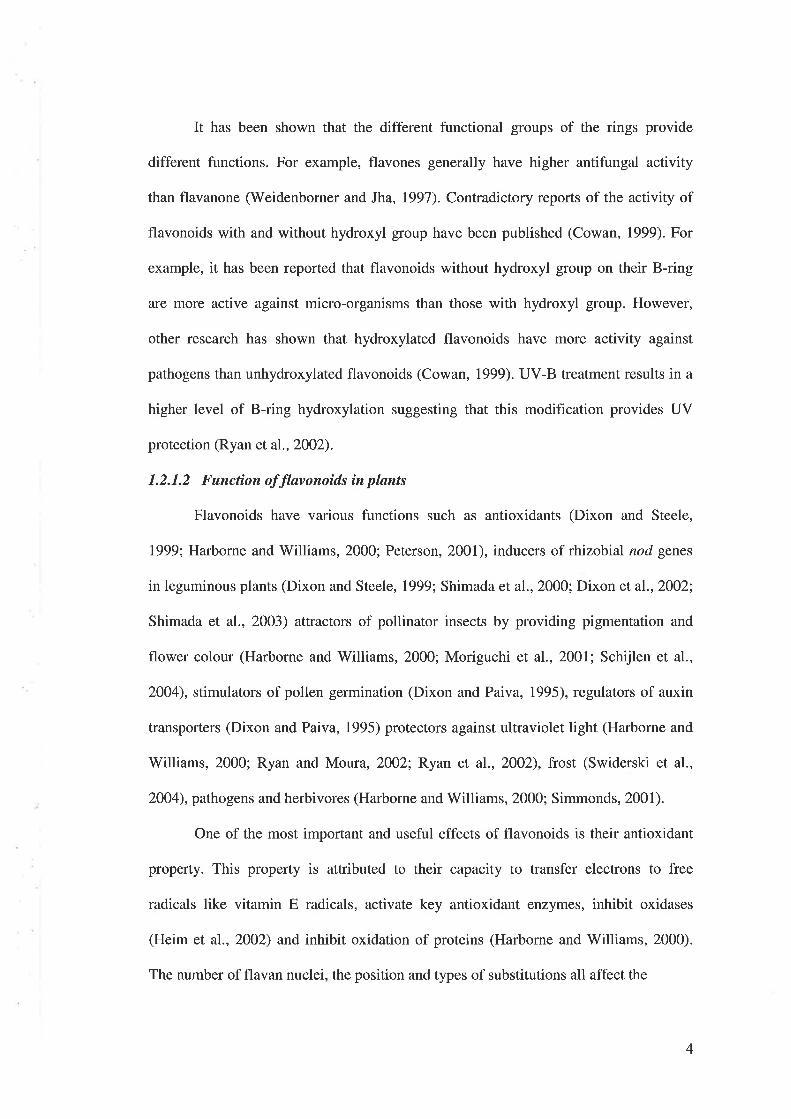
Tablel.L Classification, structure and dietary sources of flavonoids (adapted from
Heim etal.,2OO2)
Coloured fruit,Cherry, Raspberry,Strawberry
ApigenidinCyanidin
Anthocyanidin
SoybeanSoybeanSoybeanSoybean
GenestinGenisteinDaidzinDaidzein
o
Isoflavone
Citrus, GrapefruitCitrus fruitCitrus fruitLemonOrange
NaringinNaringeninTaxifolinEriodictyolHesperidin
o
Flavanone
Leek, Broccoli,Endives, Grapefruits, Black teaOnion, Lettuce,Broccoli, Tomato,Tea, Berries, Olive,oil, Apple skinCranberry Grapes
Kaempferol
Quercetin
Myricetin
OH
o
Flavonol
Fruit skinsParsley, CeleryRed pepperCitrus, Tomatoskin, Buckwheat
ChrysinApigeninLuteolinRutin
o
Flavone
TeaTea
CatechinEpicatechin
cOH
FlavanolSourceFlavonoidGeneral structureClass
5
antioxidant properties of flavonoid (Heim et al,2OO2), with the structure of the B ring
in the flavan nucleus being the primary indicator of the antioxidant activity in these
compounds (Pannala et al., 2001). Das and Pereira (1990) showed that a carbonyl group
and a double bond between C-2 and C-3 increased the antioxidant activity.
Flavonoids have long been studied as signalling molecules for beneficial micro-
organisms in the rhizosphere in leguminous plants (Dixon and Steele, 1999).
Flavonoids especially 5-deoxyflavonoids and S-deoxyisoflavonoids act as inducers of
rhizobial nod genes in host-specific symbiotic nitrogen fixation (Shimada et al.,2OO3).
There has been interest in producing these compounds in non-leguminous plants
because of isoflavonoids protection against certain forms of cancer (Schijlen et al.,
2004).
Flavonoids absorb strongly the UV region of the light spectrum, and therefore
protect plants from the harmful effects of UV (Ryan et al., 2002; Ambasht and
Ambasht, 2005). Markham et al. (1998) compared the response of UV-tolerant rice cv.
l;|l{202 and UV-susceptible cv. Dular against high UV levels. They found that
flavonoids are induced in tolerant cultivar by UV, but not in the susceptible cultivar.
The effect of elevated COz on flavonoid concentration was studied by Estraite et al.
(1999). They discovered that high levels of COz increased the concentrations of
flavonoids in leaves of wheat by l4Vo when compared to control plants. Rising CO2
concentrations in air increased the photosynthetic rate making carbon more available.
The greater contents of flavonoids in the leaf help the plant to protect itself against UV
radiation damage.
1.2.1.3 Function of fløvonoíds ín plønt defence systems
The inhibitory effects of flavonoids on feeding behaviour of pests and the
growth of pathogens have been studied. Dreyer and Jones (1981) found that the more
6
polar phenolic fraction gave the strongest feeding avoidance for Schizaphis graminunt.
Apigenin-C-glycoside, which is in phloem of rice plants, can change the feeding
behaviour of the brown plant hopper, Nilaparvata lugens (Grayer et al., 1994). Grayer
et al. (1994) showed that when plant hoppers ate rice stems with high level of
flavonoids, the weights of the plant hoppers decreased. Also, it has been shown that a
glycosyl flavone isolated from corn silk can inhibit the growth and development of corn
worm, Heliothis zea (Elliger et al., 1980). The flavonoid, sakuranetin, is a
phenylpropanoid with inhibitory effects against Ditylenchus angustus, which is a
damaging nematode in South Asia (Plowright et aI., 1996). Five days after inoculation
of a resistant cultivar with the stem nematode, the concentrations of flavanone
sakuranetin and the phenylpropanoid chlorogenic had increased (Plowright et al.,
t996).
The effect of flavonoids on pathogen growth has been well studied. Dillon et al.
(1997) showed that there was a strong correlation between resistance to blast in rice
plants and the accumulation of flavonoids. Moreover, they found that there was a
genetic difference between rice cultivars in terms of phytoalexins. The sensitivity of
major rice pathogens to inhibition by certain flavonoids was studied by Padmavati et al.
(1997). They revealed that naringenin, a flavonoid, could inhibit the growth of
Xanthomonas strains and prevent spore germination of Pyricularia oryzae in rice
plants. A study on the antifungal activity of flavonoids on 34 different fungi, indicated
that flavone has a higher antifungal activity than flavanone (Weidenborner and Jha,
1997). They confirmed the results of other researchers, which showed that Fusarium
could metabolise antifungal compounds. The flavonoids that are important in plant
defence of the selected crops are listed in Table 1.2.
7
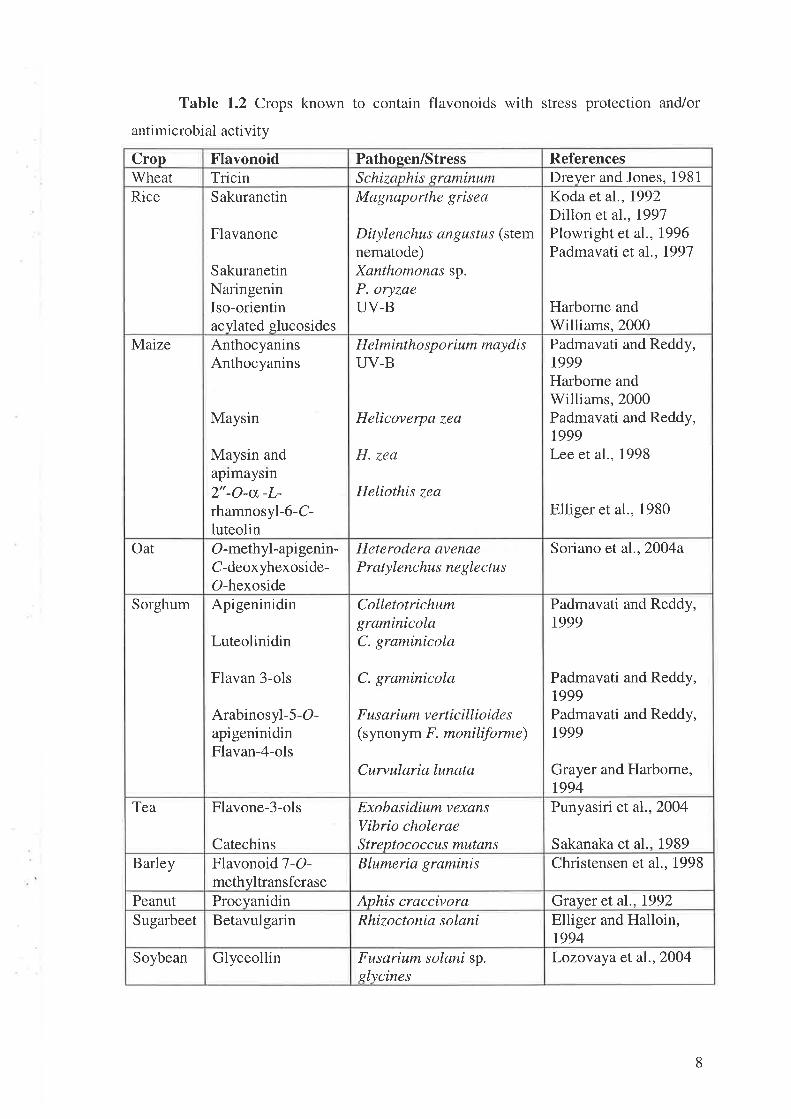
Table 1.2 Crops known to contain flavonoids with stress protection and/or
antimicrobial activity
Lozovaya et aI.,2004Fusarium solani sp.glycines
GlyceollinSoybean
Elliger and Halloin,1994
Rhizoctonia solaniBetavulgarinSugarbeetGrayer et a1.,1992Aphis craccivoraProcyanidinPeanut
Christensen et al., 1998Blumeria graminisFlavonoid 7-O-methyltransferase
Barley
Punyasiri et aL.,2004
Sakanaka et al., 1989
Exobasidium vexansVibrio choleraeStreptococcus mutans
Flavone-3-ols
Catechins
Tea
Padmavati and Reddy,t999
Padmavati and Reddy,1999Padmavati and Reddy,t999
Grayer and Harborne,t994
ColletotrichumgraminicolaC. graminicola
C. graminicola
F us arium v erticillio ide s(synonym F. moniliþrme)
Curvularia lunata
Apigeninidin
Luteolinidin
Flavan 3-ols
Arabinosyl-5-O-apigeninidinFlavan-4-ols
Sorghum
Soriano et al., 2004aHeterodera avenaeP ratylenchus ne glectus
O-methyl-apigenin-C-deoxyhexoside-O-hexoside
Oat
Padmavati and Reddy,1999Harborne andWilliams,2000Padmavati and Reddy,1999Lee et al., 1998
Elliger et al., 1980
H elmintho s p o rium ruay di sUV-B
Helicoverpa zea
H. zea
Heliothis zea
AnthocyaninsAnthocyanins
Maysin
Maysin andaplmaysln2"-O-a -L-rhamnosyl-6-C-luteolin
Maize
Koda et aI.,1992Dillon et al.,1997Plowright et a1.,1996Padmavati et a1.,1997
Harbome andWilliams,2000
Magnaporthe grisea
Ditylenchus angustus (stemnematode)Xanthomon¿¿s sp.P. oryzaeUV-B
Sakuranetin
Flavanone
SakuranetinNaringeninIso-orientinacylated glucosides
RiceDreyer and Jones, 1981Schizaphis graminumTricin'WheatReferencesPathoeen/StressFlavonoidCrop
8
L2.1.4 Flavonoíds ín oat (Avena sativa)
Research on flavonoids in oat is limited to few papers that cover structure,
biological activity and changes with environmental conditions. A signif,rcant variation
was found among oat cultivars for the concentration of all phenolic compounds except
that of ferulic and p-cumaric acids (Emmons and Peterson, 2001). This research also
showed that the environment has a significant effect on the concentration of phenolics
and total free phenolics. The abundant flavonoids in leaves of oat are apigenin-C-
pentohexoside as major component, luteolin-C-pentohexoside and O-methyl-apigenin-
O-deoxyhexoside-C-hexoside (Soriano et al.,2OO4). These flavone-C-glycosides in oat
were induced by methyl jasmonate (MJ) and nematodes. Furthermore, high level of
flavone-C-glycosides restricted the invasion of Heterodera avenae in oat roots (Soriano
et al.,2OO4).
1.2.2 Saponins
Saponins are a major family of secondary metabolites that contain an aglycon
hydrophobic core and sugar chains with hydrophilic property (Osbourn, 2O03; Martin
and Magunacelaya, 2005). These compounds are glycosylated triterpenoid, steroid or
steroidal alkaloids (Hostettmann and Marston, 1995; Papadopoulou et al., 1999) with a
diverse range of activities including antimicrobial, anti-insect, allelopathic, haemolytic
and surfactant properties. Sapo is the Latin word for soap and reflects their surfactant
properties as saponins produce stable foams when shaken with water (Hostettmann and
Marston, 1995; Onning and Asp, 1996; Osbourn, 2003). Saponins are synthesised from
mevalonic acid through the isoprenoid pathway (Hostettmann and Marston, 1995).
Triterpenoids and steroids are produced from the cyclisation of 2,3-oxidosqualene (Qi
et at,2004; Jenner et al., 2005; Townsend et a1.,2006).
9
Saponins are produced in a wide range of plant species particularly
dicotyledonous plants (Papadopoulou et al., 1999: Osbourn et al., 2OO3). The presence
of saponins in oat (Avena sativa) is noteworthy given their apparent absence from most
other cereals such as rice, wheat and barley (Hostettmann and Marston, 1995).
1.2.2.1 Functíon of saponins in plant deþnce systems
Saponins have long been known to have strong biological activity. The
antibacterial activity of saponins is relatively weak but their antifungal activity is strong
(Okazaki et a1.,2004). Extracts from oat roots have been shown to attract and then lyse
zoospores of Pythium species and Phytophthora cinnamomi. Further work has shown
that this property is due to the presence of avenacin (Deacon and Mitchell, 1985).
o-tomatine, which is present in tomato (Lycopersicum esculentum),has been shown to
have strong antifungal and weak antibacterial activity. The antifungal activity of this
saponin was proven against Fusarium oxysporuln, Aspergillus spp., Candida albicans
and Trichophyton spp. (Hostettmann and Marston, 1995). Fusaríum solani can infect
ripe tomato fruits because they contain low levels of saponins, but it is not able to infect
green tomato fruits as they have a high level of o-tomatine (Osbourn, 1996).
Medicagenic acid glycosides are the dominant saponins in lucerne roots and were found
to inhibit the growth of Trichoderma viride, Sclerotium rolfsii, Rhizopus mltcco,
Aspergillus niger, Phytophthora cinnamomi and Fusarium oxysporum (Hostettmann
and Marston,1995; Kohli et al., 2001).
It has been shown that the aqueous extracts of the Chilean tree, Quillaia
saponaria, have nematicidal effects (Martin and Magunacelaya, 2005). This research
also suggested that saponin and non-saponin fractions have a synergistic effect on the
control of nematode populations (Martin and Magunacelaya, 2005).
10
The membraneolytic properties of saponins against fungi is a result of the
interaction of saponins with sterols in the membrane of fungi (Osbourn, 1996; Armah et
al., 1999; Kohli et al.,2OOl). It has been suggested that fungi with low levels of sterols
in their membrane should be resistant to saponins (Kohli et al., 2001) but this has not
been tested. In general, maximum antifungal activity is obtained from monodesmosidic
saponins, with a single sugar chain in one side of the molecule, that contains four or
five sugar residues, which can increase water solubility and thereby increase the
antifungal activity (Hostettmann and Marston, 1995). However, weak haemolytic
activity of bisdesmosidic saponins, with two sugar chains in both sides of the molecule,
was repofted (Woldemichael and Wink, 2001).
1.2.2.2 Saponins in oøt (Avena sativa)
Oat is unique among cereals in producing two different families of saponins, the
steroidal avenacosides in the shoots (Onning et al., 1993; Onning and Asp, 1996;
Osbourn et al., 2003) and the triterpenoid avenacins in roots (Crombie et al., 1986;
Crombie and Crombie, 1986).
Saponins in oat shoots: In 1953 a bitter-tasting compound with foaming and haemolytic
property was isolated from the leaves of oat (Onning and Asp, 1996). Thirteen years
later, Tschesche and Schmidt named this compounds avenacosides (Onning and Asp,
1996). The first two avenacosides compounds were identified as avenacoside A and
avenacoside B (Figure 1.2)by Tschesche and Lauven (cited in Onning and Asp, 1996).
Qualitative and quantitative analyses of saponins have been performed using
thin layer chromatography (TLC) (Tschesche et al., 1969; Curl et al., 1985) and high
performance liquid chromatography (HPLC) (Kesselmeier and Strack, 1981).
Avenacoside A and avenacoside B are bisdesmosidic saponins. They have two
11
A) shoots B) roots
26
ocHo
R2
o R2
o-otc- j-nra-oD-glc
R1 R2
R1
R1
Avenacoside AAvenacoside B26-DGA26-DGB
OHOHHH
HglcHglc
glcglcHH
Avenacin A-1Avenacin A-2Avenacin B-1Avenacin B-2
NHCH3H
NHCH3H
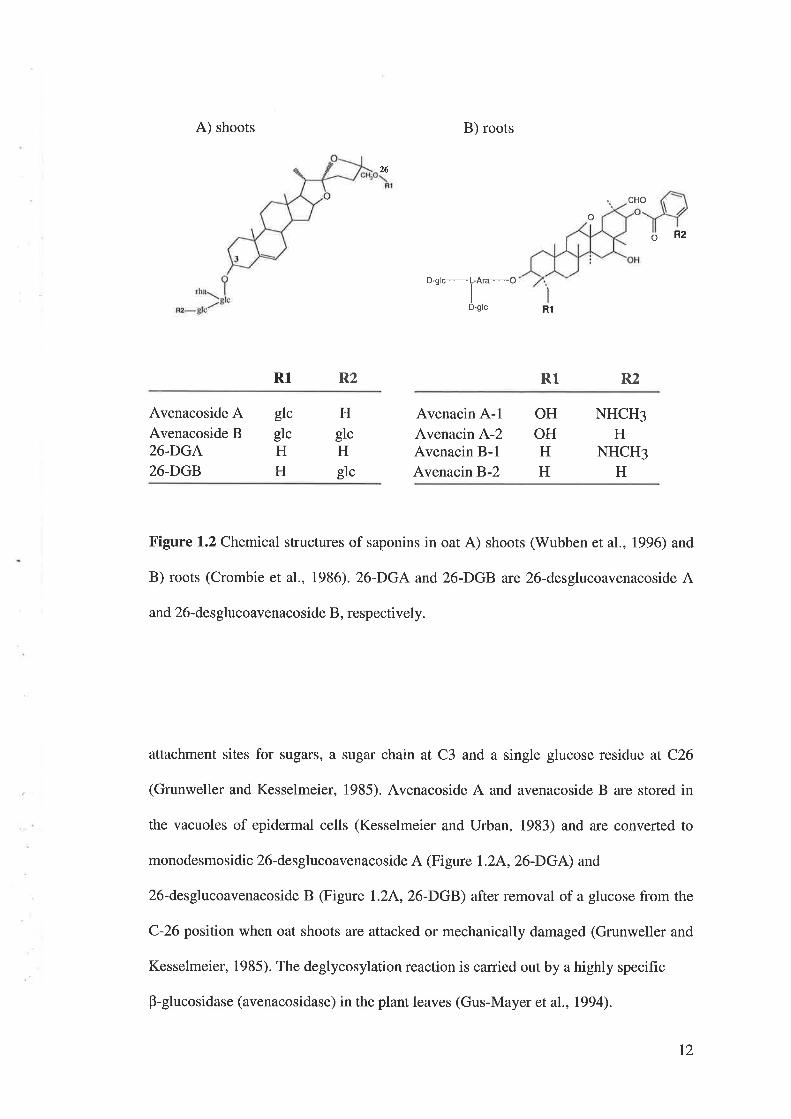
Figure 1.2 Chemical structures of saponins in oat A) shoots (Wubben et al., 1996) and
B) roots (Crombie et al, 1986). 26-DGA and 26-DGB are 26-desglucoavenacoside A
and 26-desglucoavenacoside B, respectively.
attachment sites for sugars, a sugar chain at C3 and a single glucose residue at C26
(Grunweller and Kesselmeier, 1985). Avenacoside A and avenacoside B are stored in
the vacuoles of epidermal cells (Kesselmeier and Urban, 1983) and are converted to
monodesmosidic 26-desglucoavenacoside A (Figure 1.2A, 26-DGA) and
26-desglucoavenacoside B (Figure I.2^,26-DGB) after removal of a glucose from the
C-26 position when oat shoots are attacked or mechanically damaged (Grunweller and
Kesselmeier, 1985). The deglycosylation reaction is carried out by a highly specific
p-glucosidase (avenacosidase) in the plant leaves (Gus-Mayer et al., 1994).
t2
The biological activity of 26-DGA and 26-DGB in oat was tested against a few
fungi. Luning and Schlosser (1976) tested 26-DGA and 26-DGB against 15 different
fungi and they measured their sensitivities using leakage of free amino acids from cells
as a measure of the membranlytic activity. They found that both pathogens and non-
pathogens infecting oat leaves, Drechslera (Pyrenophora) avenacea, Septoria
avenacea, Alternaria solani, Septoria cyclaminis and Fusarium culmorum are
insensitive to 26-DGB, whereas important pathogen such as Gaeumannomyces
graminis var. avenae, G. graminis var. tritici, Ascochyta pisi, F. avenaceum aÍe
sensitive to the saponin in oat leaves. Drechslera teres and D. gramineø showed low
levels of leaked amino acids when exposed to 26-DGB. Luning and Schlosser (1976)
were one of the researchers to suggest that the sensitivity of the fungi could be due to
sterols in their membrane, based on the absence of sterols in Pythium.
Luning and Schlosser (1975) partially purified B-glucosidase from homogenated
oat leaves by high-speed centrifuge in 10,000 g. In 1985, Grunweller and Kesselmeier
(1985) were able to purify and characterised the specific B-glucosidase responsible for
activation of avenacosides from the non-specific p-glucosidase in homogenised oat
leaves. In 1994, a protein (As-P60) was isolated from oat seedlings and identified as the
specific B-glucosidase responsible for activation of avenacosides (avenacosidase). The
amino acid sequence of this protein showed significant sequence identity with
B-glucosidases involved in defence mechanisms of dicotyledonous plants and it had
34Vo sequence identity with bacterial and mammalian B-glucosidase (Gus-Mayer et al.,
1994).
Some fungal pathogens are able to detoxify the active saponins in oat shoots by
removing the sugar chain at the C3 position (Hostettmann and Marston, 1995; Osbourn,
1996; V/ubben et al., 1996). Septoria avenae f. sp. avenaø (Wubben et al., 1996),
13
Stagonospora avenqe (Morrissey et al., 2000; Bleddyn Hughes et al., 2004) and
Botrytis cinerea (Quidde et al., 1999) are three fungi that can detoxify 26-DG^ and 26-
DGB. Botrytis cinerea can degrade and detoxify the antifungal activity of the 26-
desglucoavenacosides and other saponins like u-tomatine in tomato and digitonin in
Digitalis (Quidde et al., 1999). The gene encoding the major p-glucosidase responsible
for detoxifying saponins from the foliar blast fungus, S. avena¿, was cloned and the
protein showed similarity to other saponin-detoxifying enzymes in Septoria,
Gaeumannomyces and Botrytis (Quidde et al., 1999).
The first reports on the quantification of saponins in the shoots of oat, which
was carried out using TLC (Tschesche et al., 1969), indicated that the avenacoside A
and B content in oat grains was estimated to be 0.04%o and more recently, the content of
total saponins in rolled oat was estimated to be 0.lVo (Onning and Asp, 1996). Nisius
(1988) indicated that there is a natural variation among the genera of Avena for
avenacoside. No saponins were detected in shoots of A. clauda, A. pilosa and A.
ventricosa using TLC. Despite this research, there is still no evidence to show any
correlation for sensitivity of these species to pathogens and absence of saponin in their
shoots (Osbourn, 1996). Onning et al. (1993) determined the avenacoside A and
avenacoside B content of 16 oat cultivars using HPLC. They found that the saponin
content was significantly different among oat cultivars and it ranged from O.O2-0.O5Vo
based on dry matter.
Saoonins in oat roots: An antifungal compound called avenacin was isolated from oat
roots (Maizel et al., 1964). This compound is able to give resistance to oat against the
wheat take-all fungus, Gaeumannornyces graminis var. tritici, previously known
Ophiobolus graminis (Burkhardt et al., 1964; Maizel et al., 1964; Luning et al., 1978).
I4
Four avenacins were isolated and identified as avenacin A-1, A-2, B-1, B-2 (Figure
l.2B). Both, avenacin
A-1 and B-1, show strong blue fluorescence under UVJight (366 nm) due to N-methyl
anthranilate in their structures which is unique to saponins (Luning et al., 1978;
Crombie and Crombie, 1986). The UV florescent property facilitated the isolation,
partial quantification, screening and bioassay of these compounds. The other two root
saponins, avenacin A,-2 and B-2, have a benzoate group in their structures and are not
florescent (Crombie and Crombie, 1986; Trojanowska et a1.,2000). Avenacin A-1 and
A-2 have one extra oxygen compared to avenacin B-1 and B-2, respectively as in
Figure 1.28 (Begley et al., 1986). The trisaccharide chain common to all four avenacins
contains two glycolyl residues and one arabinosyl residue at the C3 position (Crombie
et al., 1987).
The importance of avenacins in plant protection comes from studies on the
effect of wheat take-all fungus, G. graminis var. tritici (Ggt) and oat take-all fungus,
G. graminis vaÍ. avenae (Gga). Oat is resistant to Ggt sffains that lack avenacinase and
susceptible to Gga (Crombie et al., 1986; Osbourn et al., 1991) whereas non-saponin
containing cereals, wheat and barley, are susceptible to both variants of fungi (Bowyer
et al., 1995). Goodwin and Pollock (1954) were able to attribute the resistance of oat to
fluorescent compounds found in the root tips. The sensitivity of an oat species lacking
avenacin, A. Iongiglumis, to Ggt suggests that avenacin may be a good indicator of oat
resistance to fungal pathogens (Osbourn et al., 1994). The esterified avenacins with
methylanthranilate group (A-1 and B-1) showed more toxicity against fungi than
avenacin A-2 and B-2 (Crombie et al., 1987; Hostettmann and Marston, 1995).
According to Maizel et al. (1964), avenacin at 50 pg/ml could inhibit 50Vo of the
growth of Candida albicans and Pythium irregulare, l2.5%o of Botrytis cinerea growth.
15
Oat mutants that lack saponin biosynthesis were generated from diploid oat, A. strigosa,
using sodium azide and examined against Ggt (Papadopoulou et al., 1999). These
saponin-deficient (sad) mutants were susceptible to Ggt, whereas the wild-type
A. strigosa, showed lower sensitivity to the fungi. The involvement of avenacin in
increasing the plant resistance was confirmed by assessing the F2 progeny from the
crosses between mutants and wild type oat plants (Papadopoulou et al., 1999). These
mutants have provided robust tool for investigating saponin biosynthesis and should
provide a greater understanding of the key enzymes and genes in the pathway in the
future (Townsend et al., 2OO6).
As seen with fungi response to avenacoside in oat shoots, some fungi are
resistant to avenacin either due to altered membrane composition or producing an
avenacin-detoxifying enzyme (Bowyer et al., 1995). Fungal species llke Pythium lack
sterols in their membrane (Luning and Schlosser, 1976), therefore, saponins cannot
interfere with their membranes, resulting in no toxicity (Luning and Schlosser, 1976).
Among eight tested fungi, Pythium ultimum was the only fungus that did not show
inhibition when exposed to avenacins (Turk, 2005). Bioassays of avenacin on Fusarium
avenaceum showed that this fungi is resistant to lower levels of avenacins and sensitive
to higher levels of avenacins,5OTo inhibition at20O prg/ml avenacin A-1, (Luning et al.,
1978; Crombie et a1., 1986).
The presence and activity of avenacinase is a determinant of pathogenicity of
fungi on oat. The infection of oat by take-all fungi, Gga, is attributed to saponin-
detoxifying enzyme, avenacinase (Bowyer et al., 1995; Papadopoulou et al., 1999).
Osbourn et al. (1991) demonstrated that the isolates of Gga have 100 times more
avenacinase activity than isolates of Ggt. They also partially characterised a single
protein species of molecular weight 110 kD using SDS polyacrylamide gel
16
electrophoresis that was responsible for the activity. The gene encoding the avenacinase
was cloned and polyclonal antisera for avenacinase has also been raised (Bowyer et al.,
1995; Osbourn, 1996). It is possible that there are other mechanisms for detoxification,
since Australian isolates of Ggt lacking avenacinase are able to infect oat. This property
is attributed to either resistance in the level of membrane or misrecognition in
clarification of the fungus (Osbourn, 1996).
The presence of avenacins in both monocots and dicots plants is limited to the
genus of Avena and the closely related species tall oatgrass, Arrhenatherum elatius
(Osbourn, 2OO3). Turk (2005) searched 189 genotypes of Poaceae for avenacins using
their fluorescence propefiy and found that none of them showed accumulation of
avenacin except Avena spp. The distribution of avenacin in oat roots was investigated
by Crombie and Crombie (1986). They studied 11 species of oat and found that the
avenacin content in oat roots varied from 0.22-l.O mg/g dry weight (DW) and the
relative contents of each avenacin ranged from 47-60 7o A-l; 5-77o B-l:30-43Vo A-2;
3-6Vo B-2. They identified traces of avenacin A-1 in Arrhenatherum elatius. The
concentration of avenacins declined with the age of Avena sativa plants from 5.26 mg/g
DW (3-4 days old) to 0.52 mglg (77 days old). Using the fluorescence property of
avenacin A-1, Osbourn et al. (1994) found that avenacin A-1 as the major avenacin in
oat roots and avenacin B-1 are localised to the epidermal cell layer of root tips. The
concentration of total avenacin in the root tips (12.76 mg/g DW) is more than double
that of the rest of oat roots (5.01 mg/g D'W, Crombie and Crombie, 1986). Turk (2005)
quantified avenacin A-1 in the root tips of 35 Avena genotypes using TLC. A
significant difference was found among oat genotypes for the concentration of avenacin
A-1 varying from{.J to 6.5 mg/g fresh weight.
l7
1.3 Plant defence responses
Numerous defence mechanisms have evolved in plants to protect them against
pathogens and herbivores. Some of the important mechanisms are described below.
1.3.1 Hypersensitive response
One of the best known and most powerful inducible defence responses that is
activated by the invasion of pathogens is the hypersensitive response (HR) (Stuiver and
Custers, 2OOl; Bertini et al., 2003). The HR is defined as a programmed cell death
reaction restricting pathogen spread from the site of infection (Vernooij et al., 1994;
Bertini et al.,2OO3). A HR is initiated when a gene product from the pathogen binds to
a plant receptor leading to a rapid defence response (Glazebrook, 2001). The interaction
between the plant and pathogens causes rapid necrosis at the site of pathogen
penetration and can also induce systemic acquired resistance (Peterson et al., 2000). In
the HR the first reaction after pathogen attack is an oxidative burst. The induction of
HR is rapid and very important in restricting pathogen penetration.
1.3.2 Systemic acquired resistance
When pathogens and pests invade plants, the first response occurs at the site of
infection. However, uninfected parts of the plant respond to the primary infection by
increasing their general resistance against the same or other pathogens (Vernooij et al.,
1994; Schweizer et" al., 1998; Bertini et al., 2003). This non-specific resistance is
known as systemic acquired resistance (SAR) and is present in many plant species and
provides protection against viruses, fungi and bacteria (Ryals et al., 1994). Suprisingly,
there are only a few reports on SAR in cereals (Schweizer et al., 1998; Bertini et al.,
2003).
18
Several studies have shown that the onset of systemic acquired resistance is
correlated with the accumulation of SA throughout the plant (Peterson et al., 2000). SA
is thought to act as a signalling molecule (Peterson et al., 2000) that ultimately induces
the expression of a set of pathogenesis related (PR) genes (Schweizer et al., 1998;
Glazebrook,2OOl). A number of PR genes were induced in rice by mechanical
treatment (Schweizer et al., 1998). PR4 genes were induced in wheat by SAR chemical
inducers such as 54,2,6- dicholoroisonitric acid, benzo (1,2,3) tltiodiazole 7-
carbothiotic acid S-methyl ester, MJ and wounding treatment (Bertini et al., 2003).
1.4 Pathogenesis related proteins
Pathogenesis-related proteins are coded by the host plant and induced by pest
and pathogen attack or by other stresses (Liljeroth et al.,20Ol; Bravo et a1., 2003). PR
proteins can be grouped into 14 families based on amino acid sequences and functional
properties (Hoffmann-Sommergraber, 2OO2). Some PR proteins are constitutively
expressed in some organs of plants (Hoffmann-Sommergraber,2oo2).
PR proteins can be induced in cereals and their antifungal role has been well
studied in cereals, Caruso et al. (1999) found that a number of PR proteins were
induced in wheat infected with Fusarium culmorum. They showed that two isoforms of
B-1, 3-glucanase (PR2) and three isoforms of chitinase (PR3) were induced upon
infection. Furthermore, activity of wheatwins (PR4) and peroxidase were increased in
the early stages after inoculation. Accumulation of several PR proteins has been
reported in barley in response to infection by Bipolaris sorokiniana inchtding PRI and
thaumatin-like (PR5) (Liljeroth et al., 2001). Agrawal et al. (20O2) showed that two
major PR proteins, OsPR5 and OsPR10, accumulated in rice in response to inoculation
with the fungal elicitor, chitosan. Pests attack in cereal plants also induce PR proteins.
Attack of barley plants by oat aphid (Rhopalosiphum padi) induces PR proteins
I9
(Forslund et al., 2000). One chitinase (PR3) and four isoforms of B-1, 3-glucanase
(PR2) were induced in barley by oat aphids, but PRla and PR5a were not induced.
1.5 Elicitors
Elicitors are factors that produce a defence response by activating specilic
signalling pathways and genes. Elicitors can induce enzymes involved in lignification
(Campbell and Sederoff, 1996) and PR protein production (Xu et al., 1994: Liljeroth et
al.,20Ol) and they are grouped into biotic, abiotic factors and synthetic compounds.
The biotic elicitors include carbohydrates, lipids and proteins produced by pest
and pathogen and stimulate a response by the plant. Abiotic elicitors include
mechanical damage, drought, frost, salinity and so on. There are several key defence
compounds that also induce defence responses in plants, such as SA, jasmonic acid
(JA), MJ, ethylene, benzo (1,2,3) thiodiazole 7-carbothiotic acid s-methyl ester and
nitric oxide. This literature review will explain the important abiotic elicitors with an
emphasis on MJ.
1.5.1 Salicylic acid
SA accumulates endogenously in leaves infected by pathogens and this
compound induces SAR genes, PrR genes and ultimately resistance based on observed
plant protection against pathogen infection. Exogenous SA acts the same as
endogenous SA in tobacco (Vernooij et al., 1994). Salicylic acid is the generator for
plant defence reactions and is produced from trans-cinnamic in higher plants through
the intermediate orthocumaric acid (Ryals et al., 1994). Bertini et al. (2003) showed
that PR4 genes in wheat are activated by exogenous SA application. It has been shown
20
that SA induces resistance in rice against blast disease, which is caused by
Møgnaporthe grisea (Song and Goodman,20O2).
1.5.2 Ethylene
Endogenous ethylene (CzH+) is known as a growth and development regulator
in plants (van Loon et a1.,2006). This hormone has several roles in the plants including,
seed germination and seedling growth, leaf abscission, organ senescence and fruit
ripening (Bleecker et al., 1988; van Loon et al.,2OO6). It has been shown that the level
of ethylene in plants is enhanced by wounding and pathogen attack (Bleecker et al.,
1988; van Loon et al, 2006). Ethylene regulates plant responses to biotic stresses like
pathogens and abiotic stresses such as drought (Chen et al., 2005).
1.5.3 Jasmonic acid and methyl jasmonate
Jasmonic acid (JA) and its methyl ester, MJ (Figure 1.3) play important roles in
plants as growth regulators (Ananieva and Ananiev, 1997; Biondi et al., 20Ol; Sasaki et
al., 2001), and as signal molecules in plant defence system (Thaler, 1999; Ryan and
Moura, 2002). JA (Figure 1.3) is synthesised from linolenic acid in five steps (Biondi et
al., 2001). It was first isolated from the fungus Lasiodiplodia theobromae (Creelman
and Mullet, 1995). Both water deficiency and JA induce a similar response with the
induction of several genes in plants, suggesting that JA could have a role in protection
against drought (Creelman and Mullet, 1995).
The effect of jasmonic acid treatment on pests in the tomato was investigated by
Thaler (1999). He showed that the damage on tomato leaves due to pests in plants
treated with a foliar spray of JA was 6OVo less than control plants. Flavonoids in oat,
which are shown to be involved in resistance to CCN, were induced by MJ
2t
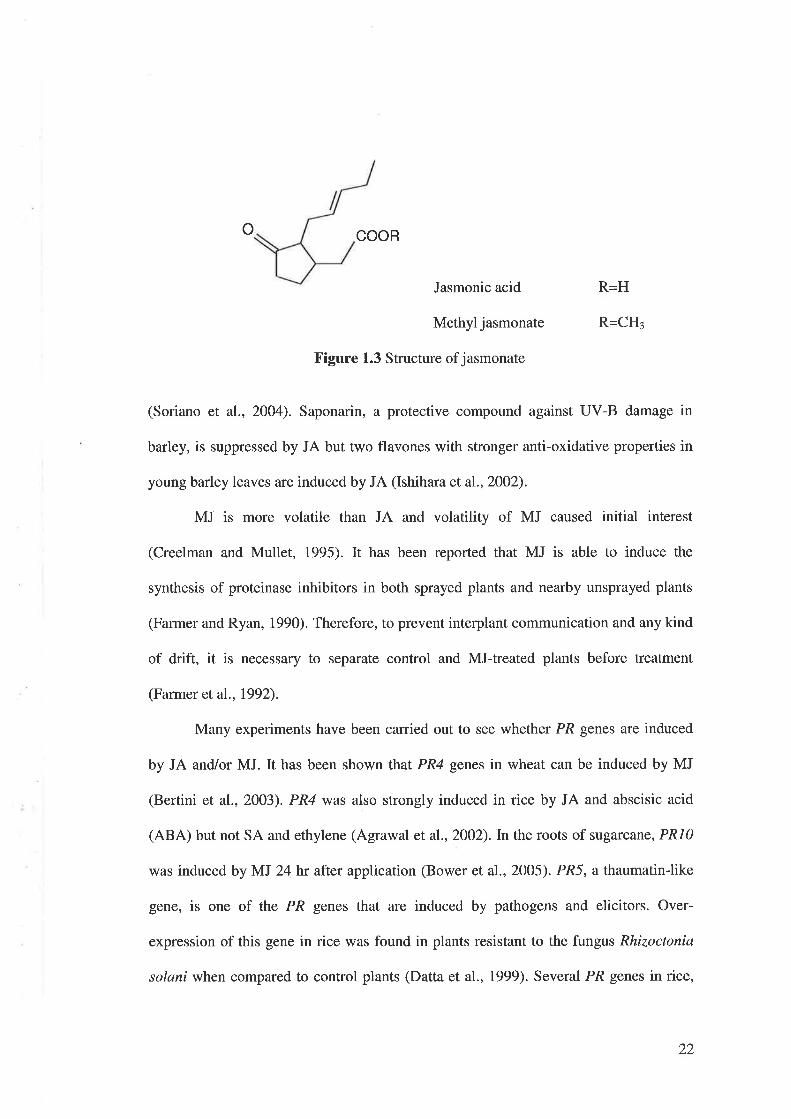
o COOR
Jasmonic acid
Methyl jasmonate
Figure 1.3 Structure of jasmonate
R=H
R=CH:
(Soriano et al., 2004). Saponarin, a protective compound against UV-B damage in
barley, is suppressed by JA but two flavones with stronger anti-oxidative properties in
young barley leaves are induced by JA (Ishihara etal,2OO2).
MJ is more volatile than JA and volatility of MJ caused initial interest
(Creelman and Mullet, 1995). It has been reported that MJ is able to induce the
synthesis of proteinase inhibitors in both sprayed plants and nearby unsprayed plants
(Farmer and Ryan, 1990). Therefore, to prevent interplant communication and any kind
of drift, it is necessary to separate control and MJ-treated plants before treatment
(Farmer et al., 1992).
Many experiments have been carried out to see whether PR genes are induced
by JA and/or MJ. It has been shown that PR4 genes in wheat can be induced by MJ
(Bertini et al., 2003). PR4 was also strongly induced in rice by JA and abscisic acid
(ABA) but not SA and ethylene (Agrawal et a1.,2002). In the roots of sugarcane, PRL0
was induced by MJ 24lr after application (Bower et al., 2OO5). PA5, a thaumatinlike
gene, is one of the PR genes that are induced by pathogens and elicitors. Over-
expression of this gene in rice was found in plants resistant to the fungus Rhizoctonia
solani when compared to control plants (Datta et al., 1999). Several PR genes in rice,
22
PR2, PR3, PR5 and PR9, were shown to be induced and their proteins accumulated by
JA and rice blast fungus, Magnaporthe grisea (Schweizer et al., 1997).In sunflower,
the defensin (PR5-1) gene was induced by either JA and/or SA, 6 and 24 hr after
application, respectively (Hu et a1.,2003). Xu et al. (1994) showed that PRI and PR5 in
tobacco were induced by a combination of MJ and ethylene.
The increased resistance conferred by external application of MJ appears to cost
plants based on the measurement of many different factors. For example, different
researcher have observed reduced number of flowers (Thaler, 1999), delayed flowering
and fruit ripening (Heil, 2002), reduced growth (Heijari et al., 2005) and induction of
leaf senescence and reduced grain weight (Beltrano et al., 1998). Baldwin (1998)
showed that if MJ-induced plants had not been attacked by herbivores, less seeds were
obtained compared to control plants, therefore it is suggested that MJ should be applied
when the attack is predictable and induction is necessary rather than constitutively. In a
four-year experiment on the effect of JA on the yield and phenology of tomato, there
was no significant difference between yield of JA-treated and control tomato when
tomato were grown under natural and experimentally reduced the levels of herbivores
(Thaler, 1999). There are some examples where the positive effects of MJ could
compensate the negative effects of exogenous JA. For example, positive effects of JA
on the reducing the plant damage by herbivores could compensate the negative effects
on tomato such as reducing the number of flowers (Thaler, 1999).
1.5.4 Mechanical damage
Mechanical damage such as wounding induces many of the same defence
reactions and genes as chemical compounds. In rice, wounding of one leaf, induced a
number of PR genes (Schweizer et al., 1998). Similarly in wheat, PR4 genes were
23
expressed at 1-3 days after wounding (Bertini et al.,2OO3). Li et al. (2001) observed
that two serine protease inhibitor-encoding genes (Inh-I and Inh-II) were expressed at
the site of wounding and throughout tomato plants by mechanical wounding of a single
leaflet.
1.6 Plant parasitic nematodes
The crop losses due to nematodes are estimated to be about llVo in the world
and cost about USD 80 billion (Agrios, 2OO4). More than 20 important crops suffer
losses due to nematodes (Trivedi, 1998). Two out of 17 orders of nematodes,
Tylenchida and Dorylaimida, are plant parasitic and members of Dorylaimida are
vectors of plant viruses (Strange and Scott, 2005). Two of the devastating nematodes,
Heterodera avenae and Ditylenchus dipsaci, are related to this thesis and will be
described.
1.6.1 Cereal cyst nematode (Heterodera avenøe)
This nematode was first reported on oat in Britain in 1908 by Theobald and then
on wheat in 1909 and was first known as cereal root eelworm (Southey, 1956). The first
recording of CCN in Australia and South Australia was made by Davidson in 1930
(Stanton and Fisher, 1985).
CCN is a destructive pathogen that can cause serious damage on wheat and oat.
The grain yielcl losses of wheat clue to CCN in south-eastern Australia have been
estimated on average 87o (costing AUD 54 million in 1986/87) and in some farms it can
be more than 50Vo (Brennan and Murray, 1988; Rathjen et al., 1998; Ogbonnaya et al.,
2001). Oat yield loss due to CCN in infected paddocks could be as high as 8l7o in
South Australia where an intolerant cultivar is sown (Zwer et al., 2005).
24
1.6.2 Stem nematode (Ditylenchus dipsaci)
This nematode can cause serious damage on more than 450 different plant
species and is considered one of the most destructive nematodes (Strange and Scott,
2005). It has been reported that this nematode can reduce the oat grain yield by SOVo
(Grainger, 1956).
1.7 Nematode control
Different methods of control are advised to manage and restrict nematodes. A
good chemical control for CCN was obtained on severely infested farms by spraying
with aldicarb (Temik 10G) carbofuran at 1.5-2.5 kg/ha (Trivedi, 1998) and ethylene
bromide (Stanton and Fisher, 1985). Biological control of CCN with the parasitic
bacterium, Pasteuria penetrqns, has also been advised (Trivedi, 1998). Crop rotation is
a cultural method of control where non-host crops can restrict the number of CCN in
the soil to minimise disease (Trivedi, 1998). Fallow management and control of host
weeds during fallow can reduce the number of cysts because rain in the absence of host
plants causes many cysts to hatch without forming of new generation (Amir and
Sinclair, 1996). Use of resistant and tolerant cultivars is the most feasible and
economical method to control nematodes due to environmental concerns and
effectiveness of the method (Martin eta1.,2004).
Resistance to nematodes is defined as the ability of the plant to inhibit and
prevent the reproduction of nematodes whereas tolerance to nematodes is the capacity
of the plant to withstand, grow and yield well in presence of nematodes (Rathjen et al.,
1998). Several resistance genes for CCN have been identified and evaluated in wheat
and its relatives (Ogbonnaya et al., 2OOl; Martin et al., 2OO4; Safari et al., 2005). A
gene designated Crel on chromosome 28 of 4US10894, Cre3 on chromosome 2D and
25
Cre4 of Aegilops tauschi, Cre2, Creí and Cre6 (CreX) of Aegilops ventricosct, CreR of
secale cereal, CreT of Aegilops triuncialis, CreS in a cultivar Festiguay and CreF of
Frame and Yipti are some of these genes (Ogbonnaya et al., 20Ol; Martin et a1., 2004:
Safari et al., 2005). Several genes for CCN resistance, Hal, Ha2 from Chebec, Ha3,
Ha4 ftom Galeon have been reported for barley (Kretschmer et al., 1997: Barr et al.,
1998; Seah et al., 2000).
1.8 Plant biochemical response to nematodes
It is well known that plants respond to nematode attack by producing
nematicidal compounds either as phytoanticipins or phytoalexins. In a study on the
interaction between soybean-cyst nematode (SCN), Heterodera glycines, and
glyceollin, Huang and Barker (1991) found that glyceollin I, an isoflavone derivative
compound, accumulated in a resistant cultivar after inoculation with SCN. Mixtures of
saponin and non-saponin fractions of Quillaja saponaria are active against several
nematodes including Meloidogyne and Pratylenchus (Martin and Magunacelaya,2005)
as ¿ìre flavonoids in oat against H. avenae and P. neglectus (Soriano et al., 2OO4),
sakuranetin in rice against D. angustus (Plowright et al., 1996), polyacetylenes in roots
of safflower (Carthamus tinctorious) against several nematodes (Akhtar and Mahmood,
1994), 2O-hydroxyecdysone in spinach (Spinacia oleracea) against H. avenae, H.
schachtä, P. neglectus and M. javanica (Soriano et al., 2004). Sincocin is the trade
tratne of a contmercial procluct that combines natural products from four different plant
species, prickly pear, southern red oak, mangrove and sumac and protects orange, sugar
beet, cassava and sunflower against nematode attack (Chitwood, 2002). Some steroid
and triterpenoid compounds in Asparagus, Fabaceae and Acacia, are reported to inhibit
the growth and development of nematodes (Chitwood, 2OO2). JA and/or invasion of
26
CCN in roots of oat induce a protein, ASP45, that is detected by a wheat-germ
agglutinin antibody (Oka et al., 1997). The identification of the phytochemicals that are
induced by nematodes has allowed the development of a new nematicidal chemical
with enhanced activity and reduced environmental concerns (Chitwood,2OO2).
Incorporating the resistant genes from wild relatives is an important approach
for nematode control. However, finding the most appropriate accessions in terms of
resistance and tolerance genes and/or metabolites is a prerequisite. Understanding the
plant's response to nematode invasion in term of producing phytochemicals should
provide methods for identifying protective phytochemicals. These chemicals could be
used to identify new accessions for breeding progrÍìms.
1.9 Oat (Avens. sativu)
Oats are resistant to a number of important crop diseases, and are grown in crop
rotations to limit build up of pathogens (Soriano et a1.,2004) such as Gaeumannonxyces
graminis var. tritici (Maizel et al., 1964) and Helminthosporium sp. (Sebesta et al.,
2001). Growing an oat crop is an effective way to reduce the population density of root
lesion nematodes, Pratylenchus thornei (Hollaway, 2OO2) and alter the soil microflora
to suppress pathogens such as Verticillium sp. (Konagai et al., 2005). Quoll, Potoroo
and Mortlock are three important cultivars that are widely grown in South Australia.
The characteristics of these cultivars will be described.
1.9.1 Quoll
Quoll was generated from a cross between a tall plant type designated
MIOLRP-86-3 as female parent and a dwarf, hull-less seed cultivar named Bandicoot in
1987 (SARDI, 2000). Quoll is a dwarf feed cultivar that is 1) susceptible and intolerant
27
to CCN, 2) moderately tolerant to stem nematode, 3) moderately resistant to stem rust,
4) moderately resistant to leaf'rust 5) moderately resistant to septoria, 6) moderately
susceptible to barley yellow dwarf virus (BYDV) and 7) moderately susceptible to
bacterial blight (Zwer eta1.,2004;Zwq et al., 2005).
1.9.2 Potoroo
Potoroo was generated in 1984 from a cross between an F1 plant obtained from
the cross between NZ Cape (OX80; 226-2H) and an Avena sterilis line Cc 4658 (OX79:
ll9-20) and Echidna in South Australia. The purpose of this cross was to generate a
new cultivar with resistance and tolerance to CCN (Barr et al., 1994). Potoroo is 1)
resistant and tolerant to CCN, 2) moderately resistant and moderately tolerant to SN, 3)
moderately resistance and tolerantto Pratylenchus neglectus,4) susceptible to stem rust
5) moderately susceptible to leaf rust, 6) very susceptible to septoria andT) moderately
susceptible to BYDV (Wallwork, 2003). Potoroo is a feed grain for sheep and cattle
(Zwer etal.,2O04).
1.9.3 Mortlock
Mortlock is classified as a tall, milling variety of oat. This cultivar is 1)
moderately susceptible and intolerant to CCN, 2) very susceptible and very intolerant to
SN, 3) moderately susceptible to stem rust, 4) moderately susceptible to BYDV, 5)
susceptible to leaf rust and 6) susceptible to septoria flMallwork, 2003).
28
1.10 Aims of the study
Major aims of this study were:
1) Explore the extent of genetic variation of oat accessions for both constitutive and
induced levels of flavonoid concentration;
2) Test the antimicrobial activity of flavonoids and other metabolites in oat;
3) Use single seed descent populations generated from Mortlock and Potoroo to
identify metabolites involved in oat resistant to nematodes.
29
Chapter Two
Flavonoids and Saponins in Oat (Avena sativa); Analysis of
their Biological Activity
2.1 Introduction
Oat (Avena sativa),like many crops, is susceptible to pests and diseases that
cause substantial losses worldwide, including Australia. However, oat is resistant to a
number of important crop diseases, and are grown in crop rotation to limit the built up
of pathogens (Soriano et al., 2004), such as Gaeumannornyces graminis var. tritici
(Maizel et al., 1964) and Helminthosporium sp. (Sebesta et al., 2001).
Two major groups of secondary metabolites, saponins and flavonoids are
reported to confer disease resistance in oat (Osbourn et al., 2003; Soriano et al., 2004).
Saponins are an important group of secondary metabolites that can protect plants from
antimicrobial attack, but are lacking in many cereals (Carter et al., 1999; Haralampidis
et al., 2001). Oat plants contain several saponins including avenacin in the roots, which
can inhibit some pathogens (Crombie et al., 1986; Crombie and Crombie, 1986;
Osbourn et al, 1994; Turk, 2005). Oat shoots contain avenacoside A and B, which are
converted to active antifungal compounds, 26-desglucoavenacoside A (26-DGA) and
26-desglucoavenacoside B (26-DGB), when plants are attacked by pathogens (Luning,
1975; Laudenbach and Kesselmeie4l9S2; V/ubben et al., 1996).
Flavonoids, another group of secondary metabolites with important roles in
plant biology, are distributed widely in the grasses (Dillon et al., 1997; Lee et al.,
1998). These polyphenolics have many functions including stimulating the growth of
beneficial micro-organisms (Shimada et al., 2000), protecting plants against UV stress
30
(Estiarte et al., 1999) and inhibiting pathogens (Dillon et a1.,1997; Weidenborner and
Jha, 1997; Simmonds, 2001; Punyasiri et al, 2OO4; Soriano et a1.,2004).
One approach for finding defence genes, proteins and secondary metabolites in
plants is to use elicitors particularly chemical signal molecules. Many different elicitors
induce flavonoids in plants. Jasmonic acid (JA) induced two flavones with potent anti-
oxidative properties in young barley leaves (Ishihara et a1.,2002). Moreover, Soriano et
al. (2004) showed that FCGs measured at 254 nm in the shoots and roots of the oat cv.
Quoll were significantly induced by methyl jasmonate (MJ) and nematode infection.
These flavonoids were identified by mass spectrometry and shown to be O-methyl-
apigenin-C-deoxyhexoside-O-hexoside, apigenin-C-hexoside-O-pentoside and luteolin-
C-hexoside-O-pentoside. The concentration of these compounds in oat cv. Quoll
increased in the roots (l OVo) and shoots (l3l%o) after MJ treatment. While all three
flavonoids were induced by MJ, only O-methyl-apigenin-C-deoxyhexoside-O-hexoside
had antinematode activity (Soriano et al.,2OO4).
In this chapter, we investigate the genetic variation of FCGs in the shoots of 72
oat accessions in the South Australian Research and Development Institute (SARDÐ
collection, which included cultivars, breeding lines and wild accessions from 13
different countries. The effect of MJ on the concentration of FCGs in the accessions
will be explored. The antimicrobial activity of the oat shoot extracts containing FCGs
will also be described.
3I
2.2 Materials and Methods
2.2.1 Plant material and culture methods
One hundred and fifteen accessions of oat, supplied by the Oat Breeding Group,
South Australian Research and Development Institute (SARDD were chosen for a pilot
experiment (Appendix 1). A few seeds of each entry were sown into a pot containing
steam pasteurised (65'C for 45 min) University of California (UC) mix (Appendix 2).
Osmocote (Scotts, Australia), a slow release fertiliser, was included at the time of
sowing. Plants received Hoagland's solution (Appendix 3) every second day and tap
water on alternate days.
2.2.2 Induction of secondary metabolites in oat
Seeds of oat and wheat were gefininated either in a glasshouse or a growth
chamber (22"C light/18'C dark, 12 hr cycle). After three weeks, half of the pots in the
experiment were treated with 0.1 mM MJ solution by drenching. Control plants
received ultrafiltered water (MQ, Millipore), filtered through a 0.45 pm membrane.
Pots drenched with MJ were separated from control pots before treatment by
transferring to a similar glasshouse or growth chamber. Plants were harvested after 3 or
5 days as indicated. The shoots and roots were separated and frozen immediately in
liquid nitrogen. They were stored at -80oC until extraction.
2.2.3 Extraction and high performance liquid chnrmatography analyses
Samples stored at -80oC were freeze-dried and ground to a fine powder using a
coffee grinder (Breville, Australia). Sixty mg of ground sample was extracted with 10
ml methanol for 48 hr by shaking in an orbital mixer at 130 rpm. Then, 3 ml MQ water
was added to 7 ml methanolic extract and lipids were removed with 10 ml n-hexane
32
mixed at 130 rpm for 48 hr. Eight ml of the methanolic phase was evaporated in a water
bath (45"C) by ventilating the tubes with compressed air. The residue was redissolved
in 5 ml MQ water, 5 ml of l-butanol (HPLC grade) was added and mixture was shaken
by an orbital mixer for 24 hr. A 4 ml aliquot of the resulting butanol phase was
evaporated as above. The final residue was dissolved in 0.4 ml45Vo v/v methanol in
water immediately prior to high performance liquid chromatography (HPLC) analysis.
Reversed-phase (RP)-HPLC was performed with a C18 column (Waters
Sphersorb ODS-2, 4.6 x 150 mm, 5 pm particle column). Isocratic elution was used
with methanol: water (45:55 v/v) mobile phase at 1 ml/min. Elution was monitored at
UY 254 nm (Soriano et al., 2004). Quantification of the compounds was performed
comparing the data for the compounds with a regression equation for a set of rutin
standards (0.2,0.4,0.6, 0.8 and 1 mg/ml) dissolved in45Vo methanol with heating.
Alternatively, separation was achieved on a C18 column (Altech Platinum
EPSCl8 1004, 7 x 53 mm) by gradient elution, at a flow rate 0.5 ml/min at 55"C.
Starting with Solvent A (2.5Vo formic acid) and Solvent B (l%o formic acid: 60Vo
acetonitrile:39Vo water) was increased from O to 4OEo over 18 min, subsequently from
40 to lÙOVo over 3 min, and finally l00%o Solvent B for 1 min. Compounds were
monitored at both 254 and 340 nm.
2.2.4 Genetic variation of flavone-C-glycosides and the effect of MJ treatment
Seecls were sor'ryn in an augmentecl design experiment with two factors, MJ
application and cultivar (Federer et al., 2001). Seeds were germinated and grown in a
glasshouse in Adelaide in December 20O3. The augmented design meant that only 23 of
115 oat accessions were sown in replicate (n=2) to provide an indication of
33
experimental error. All other accessions were sown as single pots (50 x 50 mm) of at
least 6 plants initially and culled to two plants five days after sowing.
From the above pilot experiment, 21 accessions covering a wide range of
constitutive and induced concentrations of flavonoids were selected. The seeds were
sown in two replicates in a randomised block (RB) design in the glasshouse in July
2004. Six seeds were sown in each pot (75 x75 mm) and after germination the number
of plants was reduced to four.
In the next experiment, five out of 21 accessions in the second experiment were
selected and seeds were germinated in a growth chamber to minimize changes in
environmental conditions. Seeds were sown in a RB design in three replicates. Six
seeds were sown in each pot (50 x 50 mm) and all plants were kept.
2.2.5 Effectiveness of MJ application on concentration of FCGs
Seeds of oat cv. Quoll were sorwn in four replicates (6 seeds per 125 x 125 mm).
Plants were treated with MJ, using one of three methods,2l days after sowing. Each
treatment was performed in a different growth chamber, but all had similar conditions.
Control plants received MQ water containing O.lVo Tween 20. Test plants were treated
with MJ by: 1) drenching (0.5 mM MJ in O.lVoTween2O);2) vapour (6 mI0.5 mM MJ
loaded onto cotton wool until saturated and kept in a plastic bag); or 3) spray (0.5 mM
MJ dissolved in dimethyl sulfoxide) (Binns et al., 2001).
2.2.6 Application of Tween 20 plus MJ on concentration of FCGs
A randomised block design was used in a growth chamber with the similar
conditions described in Section 2.2.2. Seeds (n=6) of Quoll were sown in the pot (125
mm diameter) containing UC potting mix. In this experiment three treatments were
34
tested with 5 replicates for each; 1) Control plants (MQ water containing O.I7o Tween
2O),2) 0.1 mM MJ solution and 3) 0.I mM MJ plus O.lVo'lween 20. Plants in each pot
(75 x 75 mm) were received 50 ml of solutions by drenching, 15 days after planting.
Plants were harvested 3 days after treatment and immediately frozen in liquid nitrogen.
Then the samples were ground and FCGs were extracted using the method described in
Section 2.2.3. Analysis was carried out using gradient elution of HPLC mentioned in
Section 2.2.3.
2.2.7 Changes in concentration of FCGs after MJ application
The seeds of three oat cultivars, Possum, Quoll, Wintaroo, were sown in UC
potting mix (four seeds per pot, 50 x 50 mm). Five days after sowing, two seedlings
were retained. 0.1 mM MJ solution was made and 10 ml solution was drenched onto the
surface of the soil around the plants 15 days after planting. Control plants received l0
ml MQ water. Plants were harvested at different days (1 to 7 days) after MJ application.
Harvesting, grinding, FCGs extraction and analysis were performed as described in
Section 2.2.3.
2.2.8 Cloning and induction of a PRS gene in oat by MJ
2.2.8.1 Plnnt material
Seeds of oat cv. Quoll were gro\/n in 10 plastic pots (150 mm diameter)
containing five plants each as described in Section 2.2.1. After three weeks, five pots
were drenched with 0.1 mM MJ. Plants were harvested24 hr after treatment, from three
pots each of control and MJ treated plants. Roots and shoots were separated and frozen
in liquid nitrogen prior to extraction for flavonoid analysis at 340 nm. Plants from the
35
remaining two pots of each treatment were separated into shoots and roots and
immediately ftozen in liquid nitrogen and stored at -80oC prior to RNA extraction.
2.2.8.2 RNA extractíon and quantification
Total RNA was extracted from shoots and roots of Quoll plants by Trizol,
according to manufacturer's instructions (Invitrogen, Mount Waverley, Victoria,
Australia). The plant material (0.2 Ð was ground in liquid nitrogen in a pestle and
mortar. One ml Trizol was added to the ground samples that were in 2 ml microfuge
tubes and incubated in room temperature (RT) for 5 min. Then 0.2 ml chlorofoÍn was
added to homogenised sample and the samples were shaken vigorously by hand for 15
sec and incubated for 3 min at RT. The tubes were centrifuged at 15,700 g at 4"C for 15
min. The aqueous phase was transferred to a clean 1.5 ml tube and RNA was
precipitated with 0.5 ml isopropyl alcohol and incubated for 15 min at RT. Then the
tubes were centrifuged at 8,600 g at 4"C for 10 min. The supernatant was discarded and
RNA pellet was washed with 1 ml of 75Vo ethanol followed by vortexing and
centrifuging at 6,500 g at 4"C for 5 min. The RNA pellet was dried in a fume hood for
15 min and redissolved in 30 ¡rl RNAase-free water.
RNA concentration was measured by either spectrophotometer (Biospec-mini,
Shimadzu, Japan) at 260 and 280 nm or NanoDrop spectrophotometer (NanoDrop@
ND-1000, usA).
Quality of the RNA was assessed by running on a l7o agarose/ formaldehyde
gel (0.6 g agarose melted in 44.1 ml MQ water and then 2.6 ml 10x MOPS, 0.2 M
MOPS, 0.05 M NaAc, 0.01 M EDTA, pH 7.0, and 9.9 ml formaldehyde were added
and mixed by swirling). RNA samples ìwere prepared for electrophoresis by adding 32
¡rl of the stock solution (for 8 samples; 40 ¡rl 10x MOPS, 70 ¡rl formaldehyde, 200 pl
formamide, 12 ¡rl ethidium bromide, 1 mg/ml) to a tube containing 10 pg RNA mixed
36
in 2 ¡i loading buffer. The gel was run at 76 Y for about 2 hr till the dye migrated to
two-third of the gel length. The gel was visualised using UV light and photographed
with a ruler. Finally it was put in the container containing 10x SSC (0.3 M NaCl, 30
mM sodium citrate, pH 7.0) and agitated slowly for 30 min.
2.2.8.3 zDNA synthesis and reverse transcriptíon polymerase chøín reaction
Genomic DNA was removed from RNA samples using the DNA free kit
(Ambion, Austin, TX, USA) according to the manufacturer's insttuctions. 10 pg RNA,
1 ¡rl 10x DNase I buffer, 1 ¡rl DNase I and water (to 10 ¡rl) were mixed well in an 0.5
ml microfuge tube and incubated at 37"C for 30 min. 5 ¡rl DNase inactivation regent
was added to the sample and mixed. The tube was spun at Il,20O g for 1 min to pellet
the inactivate slurry. The clear aqueous phase was used for cDNA synthesis.
First strand cDNA was synthesised using Superscript III according to the
manufacturer's instructions (Invitrogen, CA, USA). Two ¡rg RNA (equal to 6 pl), 1 pl
oligo (dT) primer (50 ¡rM), 1 ¡rl 10 mM dNTP were mixed and the volume was made
up to 13 ¡rl by adding 5 pl sterile water and incubated at 65"C for 5 min followed by
putting straight onto ice. Seven pl of a master mix (4 pl 5x first strand buffer, 1 pl 0.1
M dithiothreitol (DTT), 1 pl RNase OUT and I pl Superscript III) was added to the
tube and incubated at 55'C for t hr. Then 30 ¡rl sterile water was added to the tube and
kept at -20C.
To do reverse transcription - polymerase chain reaction 19 ¡rl of a master mix
(10 ¡rl 10x loading buffer,4 pl 50 mM MgCl2,2 ¡tl lO mM dNTP,2 ¡rl forward primer
(100 ng/¡rl), 2 Wl reverse primer (100 ngl¡rl), 0.4 ¡rl Taq DNA polymerase and to
volume 95 ¡rl with MQ water) was added to each of 3 200 ¡rl thin walled PCR tubes and
either 1 pl water as a negative control, or 1 ¡rl of first strand cDNA, or 1 pl of l/20
diluted first strand cDNA were added to one of the tube. PCR reaction was performed
37
in a PCR machine (PTC-100, MJ research, Inc., MA, USA) according to the following
program: 94"C for 2 min,35 cycles of 94"C for 2O sec, 55"C for 30 sec,72"C for 60
sec and then held at 23"C. Primers were designated to an oat PR5 gene, GenBank
accession number L39774, (forward: 5'-GAAGCAGTCGTCCAACATCA-3' and
reverse: 5'-TGTCAACTACAACGGCTGGA-3'). PCR products were run on lVo
agarose gel containing ethidium bromide at about 4OO ¡tgtL and observed under UV
light.
2.2.8.4 Cloníng
The re-amplified PCR product was cloned to pGEM@-T easy using Promega kit
(Promega, Annadale, Australia) according to the manufacturer's instructions. Ligation
was carried out using the following protocol: 5 ¡rl 2x rapid ligation buffer, T4 DNA
ligase, 2 pl pGEM@-T Easy vector (25 ngl¡ú),1 ¡.rl PCR product, I pl T4 DNA ligase
and 1 ¡rl sterile water were mixed in an 0.5 ml microfuge tube by pipetting and
incubation at RT for t hr. Transformation was carried out using heat shock method by
adding 2 ¡ùligated vector to 50 pl Escherichia coliDH5a cells (Stratagene, CA, USA)
and putting on ice for 2O min. Then, the tube was placed in a water bath adjusted at
42"C for 45 sec, returned immediately to ice and left for 2 min. Finally 900 ¡rl SOC
medium (2.0 g Bacto@-tryptone, 0.5 g Bacto@-yeast extract, 1 ml 1 M NaCl, 0.25 ml
1M KCl, I ml2M Mg'* stock and 1 ml glucose bring to 100 ml with sterile water) was
added to the tube containing cells and incubated for t hr at 37"Cby shaking at 200 rpm.
Two M Mg2* stock was made with 20.33 g MgCl26HzO and 24.65 gMgSOaTHzO and
MQ water to final volume of 100 ml. 100 pl SOC media containing the ligation mix of
E. coli transformed cells (after spinning the tubes containing the cells) was spread over
the LB media plates containing ampicillin + isopropyl-l+hio-B-D-galactopyranoside
38
(PTG) + 5 bromo-4-chloro-3-inodlyl-B-D-galactopyranoside (X-Gal) and incubated at
37"C overnight.
Luria Bertani (LB) + agar + IPTG + X-Gal + ampicillin were provided as
follows: To make 1 L LB medium, 10 g Bacto@-tryptone, 5 g Bacto@-yeast extract and
5 g NaCl were dissolved in water and pH was adjusted to 7.0 with NaOH. To make LB
+ agar + ampicilin, 15 g agar was added to 1 litre of LB medium, autoclaved and
cooled to 50"C, prior to addition of ampicillin at final concentration 100 pg/ml. Finally
medium in each Petri dish was supplemented with 40 ¡r120 mM IPTG and 40 ¡rl X-Gal.
White colonies (n=24) were touched on a patch plate and used as a template for
PCR amplification. A standard PCR reaction with primer PCR 1 (5'-CAC AGG AAA
CAG CTA TGA CC-3') and PCR 2 (5'-GTC ACG ACG TTG TAA AAC GAC-3')
were used. The patch plate was incubated upside down at 37"C overnight. The same
PCR conditions and programme were used to amplify the PR5 gene.
Positive clones were cultured in yellow cap (10 ml) tubes containing 2.5 ml LB
liquid + ampicilin medium and rotated overnight at 37"C. The grown bacteria were
divided to two parts, 800 ¡rl was mixed with 200 prl sterile SOVo glycerol and kept in
-80'C and the remaining was used for plasmid purification. Plasmids were purified
using a QIAprep Spin Miniprep kit (QIAGEN, Doncaster, Australia) according to the
manufacturer' s instructions.
The concentration of each sample after purification was obtained using a
NanoDrop spectrophotometer. Samples (between 500-900 ng of purified plasmid DNA)
were sequenced with 6.4 pmol of one of the gene specific primers. Nucleotide and
predicted amino acid sequences of two clones were analysed using a National Center
for Biotechnology Information (NCBI) program and alignments were performed using
ClustalW (http://www. ebi. ac.uk/clustalw/).
39
2.2.8.5 Digoxygenin PRS probe synthesis
A digoxygenin (DIG) labelled probe was made in two rounds of PCR using
protocol described in (Finckh et al.,l99l). The PCR reaction was made as follows: for
2x l0O pl PCR reactions; 20 ¡rl 10x buffer, 8 pl 50 mM MgCl2, 10 ¡rl 5 mM dNTPs, 2
¡,rl forward primer (200 ngl¡rl) ,2 y"l reverse primer (200 ng/pl), 0.8 ¡rl Taq polymerase,
were mixed with water (165.2 pl). Plasmid DNA obtained from miniprep was diluted
1:1000 and 1:2000. One pl diluted DNA was added to 99 pl PCR reaction. The PCR
program was: 94oC for 2 min, 55 cycles of 94"C for 20 sec, 55"C for 30 sec,'12"C for
30 sec and then held at 23"C. PCR products were run on a l%o agarose gel and
visualised under UV light. To do the second round, the following PCR reaction was
made: for 2 PCR reactions; 10 ¡rl 10x buffer, 4 ¡rl 50 mM MgCl2, 2 pl DIG labelling
mix (Roche Diagnostics, Mannheim, Germany), I pl 200 ng/¡tl reverse primer, 0.4 pl
Taq polymerase, were mixed with water (77.6 t;'J). Five ¡rl first round product was
added to the PCR reaction. The PCR programme was performed as in the first round.
2.2. 8. 6 P rob e quanffic utio n
To quantify the labelled probe, a serial dilution of the labelled probe was made
(1:5, 1:50, 1:500, 1:5,000, 1:50,000) in water and compared to control DNA (Roche
Diagnostics, Mannheim, Germany). One pl of each dilution was blotted onto nylon
membrane (#NOOH00010, Osmonics. Inc., MA, USA). DNA was fixed to the
membrane by crossJinking using UV irradiation (BIO-RAD). The membrane was
wetted in a small amount of Buffer 1 (0.1 M maleic acid, 0.15 M NaCl, pH 7.5) and
then it was incubated in Buffer 2 which is l%o Block in Buffer l. lVo Block was made
by dissolving 10 g Block (Roche Diagnostics, Mannheim, Germany) in 100 ml DEPC
treated maleic acid buffer (Buffer 1, 0.1 M maleic acid pH 7.5, 0.15 M NaCl). One ¡rl
anti-DIG antibody was added to Buffer 2 and incubated for 5 min at RT. The
40
membrane \ /as rù/ashed twice in Buffer I for 5 min at RT by shaking. It was incubated
in Buffer 3 (0.1 M Tris'Cl at pH 9.5, 0.1 M NaCl) for 2 min. The membrane, probe side
up, was placed onto a cut plastic bag. The chemiluminescent substrate, CSPD (Roche
Diagnostics, Mannheim, Germany), was diluted in Buffer 3 (1:100) and applied over
the membrane evenly. Excess CSPD was removed prior to exposing to X-ray film and
incubation at 37"C. The probe was quantified by comparing the dilutions to the DNA
control.
2.2.8.7 Northern blot and hybridízatíon of A*ena sativa PR5 (AsPRS)
A northern blot was performed with the oat PR5 gene. RNA from the gel was
transferred to the nylon membrane using capillary action in 10x SSC, (for 1 L 10x SSC;
175.3 g NaCl, 88.2 g Na citrate at pH 7.0). RNA was fixed to the membrane by UV
cross-linking (BIO-RAD) at 150 mJ. Excess salt was washed from the membrane by
slow shaking in a container containing 2x SSC for 5 min. Hybridization was achieved
as follows:
Pre-hybridizatlon was caried out by adding 9 ml pre-hybridisation (Pre-hyb) solution
containing 5OVo (v/v) formamide, 5x SSPE (3.6 M NaCl, 0.2 M NaHzPO+, 0.02 M
EDTA p}J7.4),2VoBlock in maleic acid buffer, O.lVolatroyl sarcosine andTVo SDS to
membrane in hybridization bottle and put into the hybridization oven (RATEK,
Australia) at 42"C for t hr. 10 ¡rl/10 ml DIG probe was added to pre-hyb solution in the
hybridization bottle and hybridized at 42"C overnight. Post hybridization washes were
twice in 2x SSC- 0.17o SDS for 5 min at RT by shaking. Then the membrane was
washed twice in 0.5x SSC-0.17o SDS for 15 min at 65'C. Detection was performed by
equilibrating the membrane in Buffer I for 2 min. The membrane was added to a bottle
containing 10 ml Buffer 2.The bottle was incubated for 30 min at RT. One ¡rl anti-DIG
antibody was added to buffer 2 and left for 30 min. Anti-DIG Buffer 2 was discarded
4t
and membrane Ìwas washed twice with Buffer I for 15 min prior to incubation in Buffer
3 for 2 min. The CSPD was diluted 1:100 in Buffer 3 and visualisation was as before.
2.2.9 Pathogens and culture methods
A range of fungi and bacteria (Table 2.1) werc cultured for use in bioassays.
A 5 mm diameter plug of a given fungus (respectively, Fusarium graminearum,
Rhizoctonia solani, Pyrenophora teres 1. teres, P. teres 1. maculata and P. avenae) was
transferred to potato dextrose agar (PDA) media lDifcorM) and incubated at25"C in the
dark until mycelia were approximately 25 mm from the edge of the plates.
Mycosphaerella pinodes was grown on PDA and incubated at 25oC, with 12 hr
lighldark cycle. Pyrenophora tritici-repentis was grown on V8 medium, 200 ml
Campbells V8 Juice, 3 g CaCO3, 20 g Bacto-agar (Cheong et al., 2004).
To culture bacteria, soft buffer agar (SBA; 60Vo 0.2 M NaHzPO+, 4OVo 0.2 M
NazHPO+ and 7 glI- Bacto-agar adjusted to pH 7) held at about 60oC was inoculated
with 300 ¡rl suspension from 5-day-old broth culture of bacteria. The concentration of
bacteria was adjusted to 5 x 10⁸ cells ml-l using a haemocytometer and the optical
density at 600 nm (OD600) was recorded. Soft buffer agar was mixed with the bacteria
by swirling. Suspensions of Ps¿zdomonas were poured over Kings B medium (20 g
Bacto Proteose Peptone No. 3, 1.96 g IçHPO4'3H2O,1.5 g MgSOaTHzO, 10 g glycerol
and 20 g Bacto-agar in I liter MQ water adjusted at pH 7.2). Suspensions of
Rathayibacter and "Corynebacterium" were poured over M523 medium (10 g sucrose,
2 g casamino acids, 2 gyeast extracts,2 g KzHPOq,0.3 g MgSOaTHzO,15 g agar in 1
L MQ water) to give a uniform overlay.
42
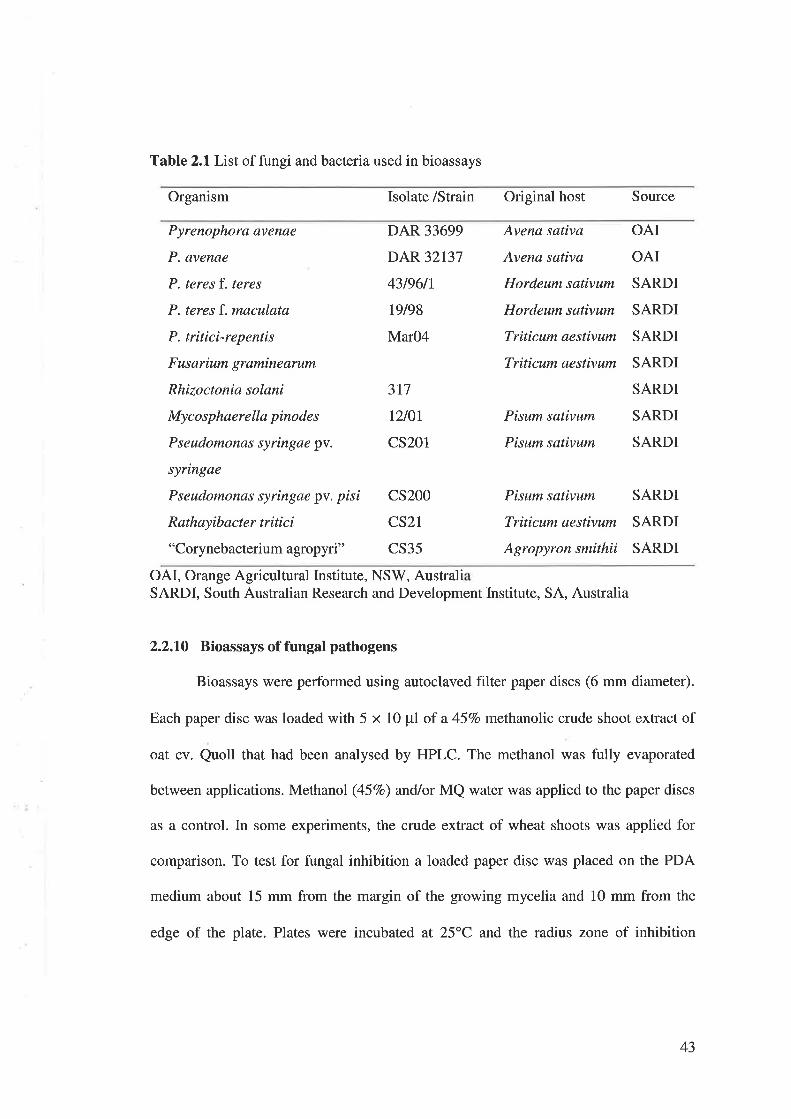
Table 2.1. List of fungi and bacteria used in bioassays
Organism Isolate /Strain Original host Source
Pyrenophora avenae
P. avenae
P. teres f. teres
P.teresf.maculata
P. tritici-repentis
Fusarium graminearum
Rhizoctonia solani
Mycos phaerella pinode s
Pseudomonas syringae pv.
syringae
Pseudomonas syringae pv. pisi
Rathayibacter tritici"Corynebacterium agropyri"
DAR 33699
DAR 32137
43t96tr
t9t98
Mar04
317
t2/01
CS201
CS2OO
CS21
CS35
Avena sativa
Avena sativa
Hordeum sativum
Hordeum sativum
Triticum aestivum
Triticum aestivum
Pisum sativum
Pisum sativum
Pisum sativum
Triticum aestivum
Agropyron smithii
OAI
OAI
SARDI
SARDI
SARDI
SARDI
SARDI
SARDI
SARDI
SARDI
SARDI
SARDI
OAI, Orange Agricultural Institute, NSW, AustraliSARDI, South Australian Research and Development Institute, SA, Australia
2.2.10 Bioassays of fungal pathogens
Bioassays were performed using autoclaved filter paper discs (6 mm diameter).
Each paper disc was loaded with 5 x 10 ¡rl of a 45Vo methanolic crude shoot extract of
oat cv. Quoll that had been analysed by HPLC. The methanol was fully evaporated
between applications. Methanol (45Vo) and/or MQ water was applied to the paper discs
as a control. In some experiments, the crude extract of wheat shoots was applied for
comparison. To test for fungal inhibition a loaded paper disc was placed on the PDA
medium about 15 mm from the margin of the growing mycelia and 10 mm from the
edge of the plate. Plates were incubated at 25"C and the radius zone of inhibition
43
(distance between the centre of the paper disc and margin of the inhibited mycelium)
was recorded.
The gradient concentration of the shoots of oat crude extract (50 pl, 100 pl and
150 pl) was applied on P. teres f. teres in two replicates. In this experiment, 8 mm
diameter paper disc was used due to high volume of some treatments. The growth of
fungus was monitored every 6 hr and photographed every l2hr.
2.2.11 Bioassays of bacterial pathogens
A loaded paper disc was prepared as described above and placed on the soft
buffer agar inoculated with the respective bacteria. The plate was inverted and
incubated at 25"C for about three days and the diameter of the inhibition zone ìwas
recorded.
2.2.12 Induction of active compounds in the oat shoots by MJ
In a preliminary experiment, a bioassay experiment was performed using
methanolic crude extract of the material obtained in Section 2.2.6 in three replicates.
Crude methanolic extract was produced from 60 mg of ground shoots of each treatment
and 50 ¡rl was loaded onto paper frlter disc. P. teres f . teres was used in this experiment.
In the second experiment, the seeds of two oat cultivars, Mortlock and Potoroo
were sown in the pots containing UC potting mix in 12 replicates in the growth
chamber. Three weeks after sowing, replicates \ryere divided into two groups, one group
as control plants and another group moved to a growth chamber with similar condition
to be treated with 0.1 mM MJ.
The plants were harvested 3 days after MJ treatment. Methanolic crude extract
of the shoots was extracted as explained previously. Five mg/100 pl crude extract of
44

each treatment was prepared and 60 pl was loaded onto 5 mm filter paper disc. The
loaded paper discs were put onto PDA medium, 10 mm away from grown mycelium of
P. teres f. teres. This experiment was carried out in four replicates. The inhibition
radius zone of each paper disc was recorded 1 5, 1 8 and 2l hr after inoculation.
2.2.13 High voltage paper electrophoresis
Methanolic extracts of shoots were fractionated by preparative high voltage
paper electrophoresis (HVPE). Shoot extracts (300 pl) were applied along the central
axis of a piece of cellulose paper (115-285 mm; 1 Chr; Whatman, UK). Several
independent electrophoresis runs were performed to accumulate sufficient material.
HVPE paper was placed over a glass rod to minimize surface contact between the two
wells of the electrophoresis tank (Model 715;b Betheseda Research Laboratories,
Gaithersburg, MD, USA) containing 0.1 M borate buffer (3.09 g H¡BO¡, 1.756 g NaOH
dissolved in 1 L water and adjusted to pH 10). Electrophoresis was performed for 45
min at 300 V. Fractions were identified under UV light (UVGL-25, CA, USA) at 254,
366 nm. Relative mobility (RMoc) was estimated using compounds in a standard
solution (2 mglml orange G,2 mglnú xylene cyanol F.F, 2 mg/ml sodium azide, 10
mg/ml fructose and 10 mg/ml 2--deoxyadenosine in water (Tate, 1981). Orange G
(Sigma-Aldrich, St. Louis, MO, USA) was applied as an anionic standard and 2'-
deoxyadenosine (Sigma-Aldrich, St. Louis, MO, USA) as a neutral standard (Tate,
1981). Bands were excised and fractions were recovered by eluting with 45Vo methanol.
The fractions were dried under vacuum and dissolved in 4 ml deionized water.
Fractions were then passed through a C18 column (SepPak Classic; Waters
Corporation, Milford, MA, USA) to remove borate buffer and the compounds were
eluted from the column with 5 ml of methanol. The samples were dried in the vacuum
45
concentrator and then redissolved in 500 ¡tl45Vo methanol. Samples were analysed by
HPLC and 50 pl was assayed against different fungi for biological activity
2.2.1,4 Detection, purification and bioassays of saponins
The shoots of MJ treated Quoll plants were ground and extracted using
methanol, hexane, butanol and ìwater as described in Section2.2.3. The aqueous phase
of the extraction was loaded onto 0.5 g RP-C18 preconditioned cartridge and bound
material was washed with 20ml MQ water, then sequentially eluted with 11 x 8 ml
40Vo methanol and finally with 4 x 8 ml 6OVo methanol. The compounds in the aqueous
phase were analysed by thin layer chromatography (TLC) separated initially with
butanol: ethanol: ammonia, 7:2:5 vlvlv, (Hostettmann and Marston, 1995), then with
chloroform: methanol: water (140:70:11) and finally the plates were stained with
p-anisaldehyde solution (Wubben et a1.,1996) and baked at 130'C. The 40Vo methanol
fractions containing single band was pooled and used for bioassay against P. teres.f.
teres and liquid chromatography-mass spectrometry (LC-MS) for identification.
The butanol phase, after drying, was redissolved in water and loaded onto a 10 g
RP-C18 column (SepPak; Corporation, Milford, USA) and fractions were obtained
using a range of methanol concentrations (0, 40 and 6OVo methanol). For further
purification of the saponins, tbe 6OVo methanol elution was collected, dried and
dissolved in l00%o methanol. This was loaded on a 160 x 20 mm C18 column (silica
gel 60, Merck KGA, Darmstadt, Germany) and eluted with a solvent system of
chloroform: methanol (8:2 vlv). A total of 43 fractions (8 ml) were collected.
Alternatively, the 60Vo methanol elution of butanol phase was separated by preparative
TLC using aluminium-backed plates (0.20 mm, silica 60, Merck) with chloroform:
methanol: water (70:35:5.5 vlvlv) as the solvent. Collected fractions were analysed by
46
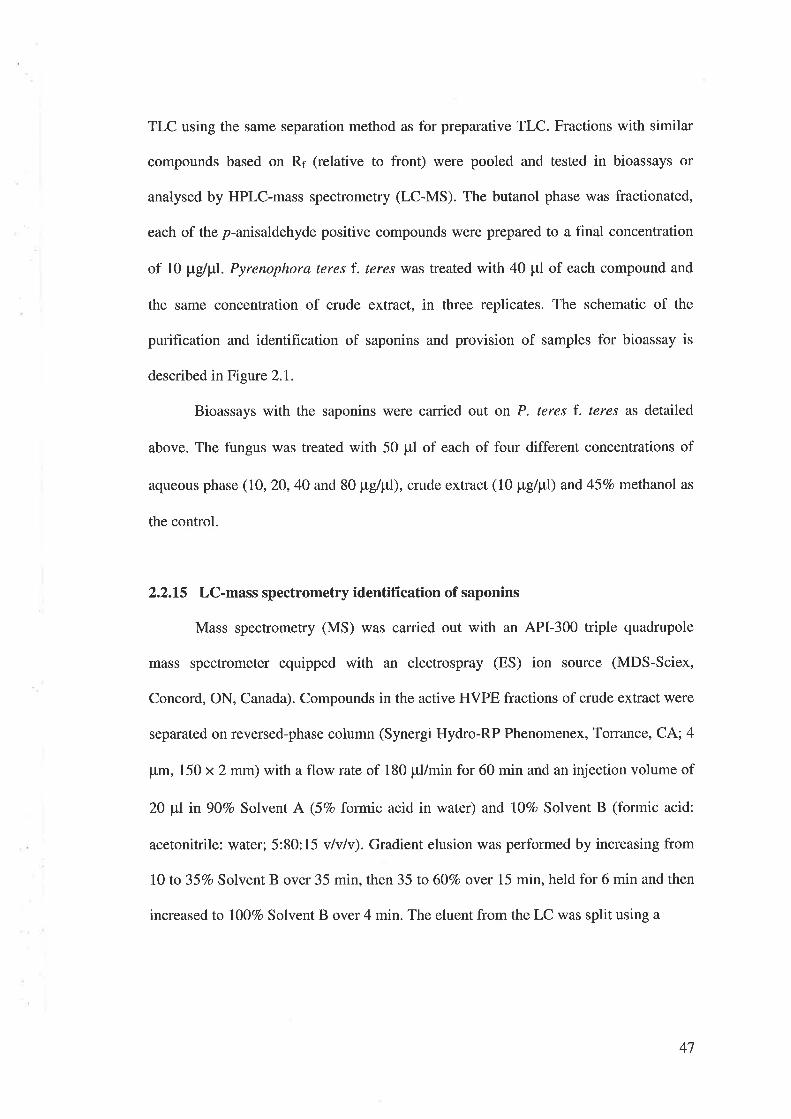
TLC using the same separation method as for preparative TLC. Fractions with similar
compounds based on R¡ (relative to front) were pooled and tested in bioassays or
analysed by HPLC-mass spectrometry (LC-MS). The butanol phase was fractionated,
each of the p-anisaldehyde positive compounds were prepared to a final concentration
of 10 ¡rg/pl. Pyrenophora teres f. teres was treated with 40 ¡tl of each compound and
the same concentration of crude extract, in three replicates. The schematic of the
purification and identification of saponins and provision of samples for bioassay is
described in Figure 2.1.
Bioassays with the saponins were carried out on P. teres f. rcres as detailed
above. The fungus was treated with 50 pl of each of four different concentrations of
aqueous phase (1O,20,40 and 80 ¡rg/¡tl), crude extract (10 pg/ttl) and 45Vo methanol as
the control.
2.2.15 LC-mass spectrometry identification of saponins
Mass spectrometry (MS) was carried out with an API-300 triple quadrupole
mass spectrometer equipped with an electrospray (ES) ion source (MDS-Sciex,
Concord, ON, Canada). Compounds in the active HVPE fractions of crude extract were
separated on reversed-phase column (Synergi Hydro-RP Phenomenex, Torrance, CA; 4
pm, 150 x 2 mm) with a flow rate of 180 pl/min for 60 min and an injection volume of
20 pl in 907o Solvent A (5Vo formic acid in water) and lOVo Solvent B (formic acid:
acetonitrile: water; 5:80:15 v/vlv). Gradient elusion was performed by increasing from
lO ß 35qo Solvent B over 35 min, then 35 to 6OVo over 15 min, held for 6 min and then
increased to l00%o Solvent B over 4 min. The eluent from the LC was split using a
47
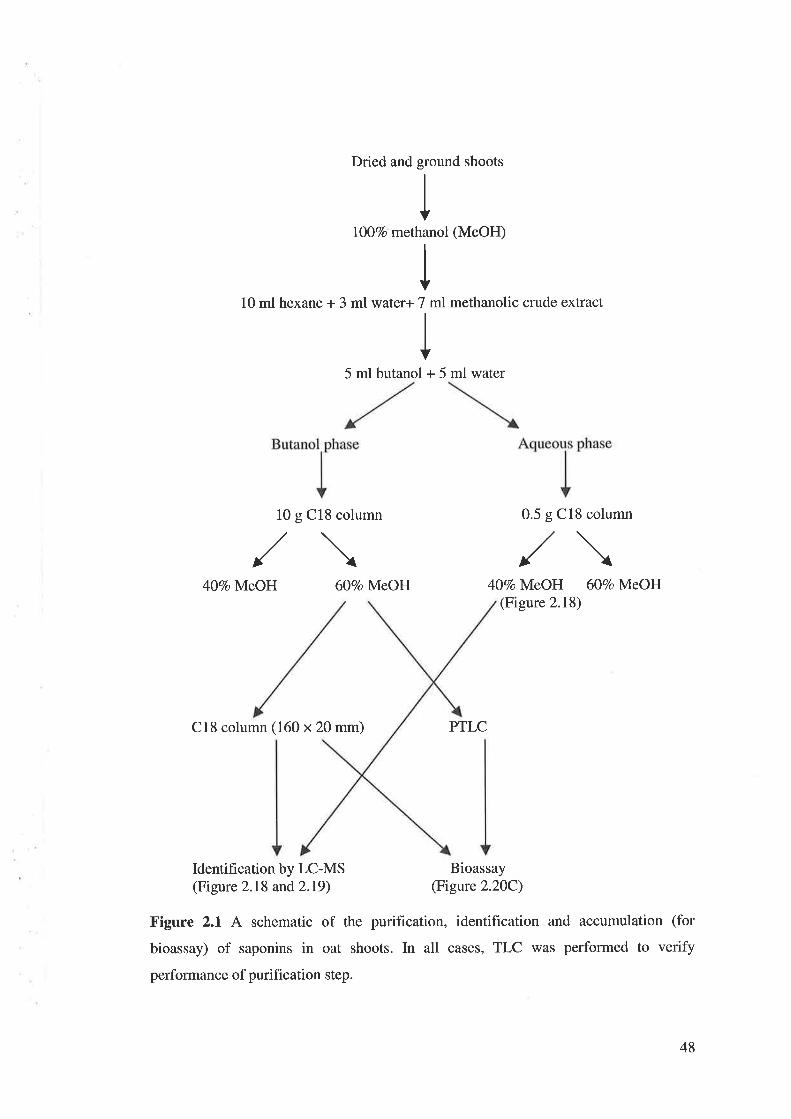
Dried and ground shoots
IÙOVo methanol (MeOH)
10 ml hexane + 3 ml water+ 7 ml methanolic crude extract
5 ml butanol + 5 ml water
/\ /\
10 g C18 column
6O7o l|¡4eOH
0.5 g C18 column
OVolr/:gOIl íOToM.eOH(Figure 2.18)
4OTolN{.yOH
C18 column (160 x 20 mm)
Identification by LC-MS(Figure 2.18 and2.l9)
PTLC
Bioassay(Figure 2.20C)
Figure 2.1 A schematic of the purification, identification and accumulation (for
bioassay) of saponins in oat shoots. In all cases, TLC was performed to verify
performance of purification step.
48
T-piece such that 22.5Vo of the total flow was delivered to the mass spectrometer and
77.5Vo to the UV detector (HP 1100, Agilent) monitoring at 254 nm and 340 nm. The
mass spectrometer was operated in either positive or negative ion scan mode and
scanned from m/z 100 to m/z 2000 with a step size of 0.2 Da and dwell time of 0.25
msec.
The ES needle, orifice and ring potentials were set at 5,000 V, 30 V and 250 Y,
respectively. The curtain (nitrogen) and nebulizer (air) gases were set at 8 and 12 units,
respectively. The mass spectral data was processed using Bio-Multiview (Version
1.2þ3, PE Sciex) and Analyst (Version 1.4) software.
To improve identification of the purified saponins, LC-MS was modified as
follows. The elution profile started with a hold at 107o Solvent B for 5 min, increasing
to IOOVo Solvent B from 5 to 35 min and held at IOOVo Solvent B for 30 min. The mass
spectrometer was scanned from m/z 50 to m/z 2000. The samples were monitored at 200
nm and 210 nm.
2,2.16 Induction of active compounds in the oat shoots by homogenisation
Saponins were extracted from the shoots of l2-day-old Quoll seedlings by
extracting the shoots for t hr with three volumes of hot methanol (60"C) as described
by Wubben et al. (1996). To extract avenacoside A and B, fresh leaves that were folded
once or twice in a 10 ml tube were exposed to hot methanol (60"C) directly after
harvesting. To extract 26-DGA and 26-DGB, oat shoots were homogenised in one
volume MQ water using a plastic homogeniser at room temperature. After t hr
incubation at RT, they were extracted with three volumes hot methanol for t hr. After
centrifugation at 5,500 g for 15 min and filtration through Whatman filter paper No 541
49
(55 mm), the clear supernatant containing either avenacoside A and B or 26-DGA and
26-DGB was dried under vacuum (Wubben et al, 1996). To give a concentration of
5 mg/100 ¡rl, 15 mg of each sample was dissolved in 300 ¡il 45Vo methanol. Sixty pl of
each extract was loaded onto paper disc in four applications 15 pl of each and the
methanol evaporated between applications. The loaded paper discs were placed 15 mm
away from the grown mycelia of P. teres f. teres (in four replicates). Forty five per cent
methanol was used as a negative control. Measure of activity against the fungi was
provided by calculating the radius inhibition zone.
2.2.17 Statistical analysis
Analysis of variance was performed using Genstat (Version 6.1; VSN
International Ltd, Oxford, UK). Mean analysis was carried out by Duncan's multiple
range test by combining control and MJ treated data and least significant differences
(LSD) were also calculated. A paired /-test was also used to test for significant
difference is in FCGs concentration between MJ treated and control plants.
50
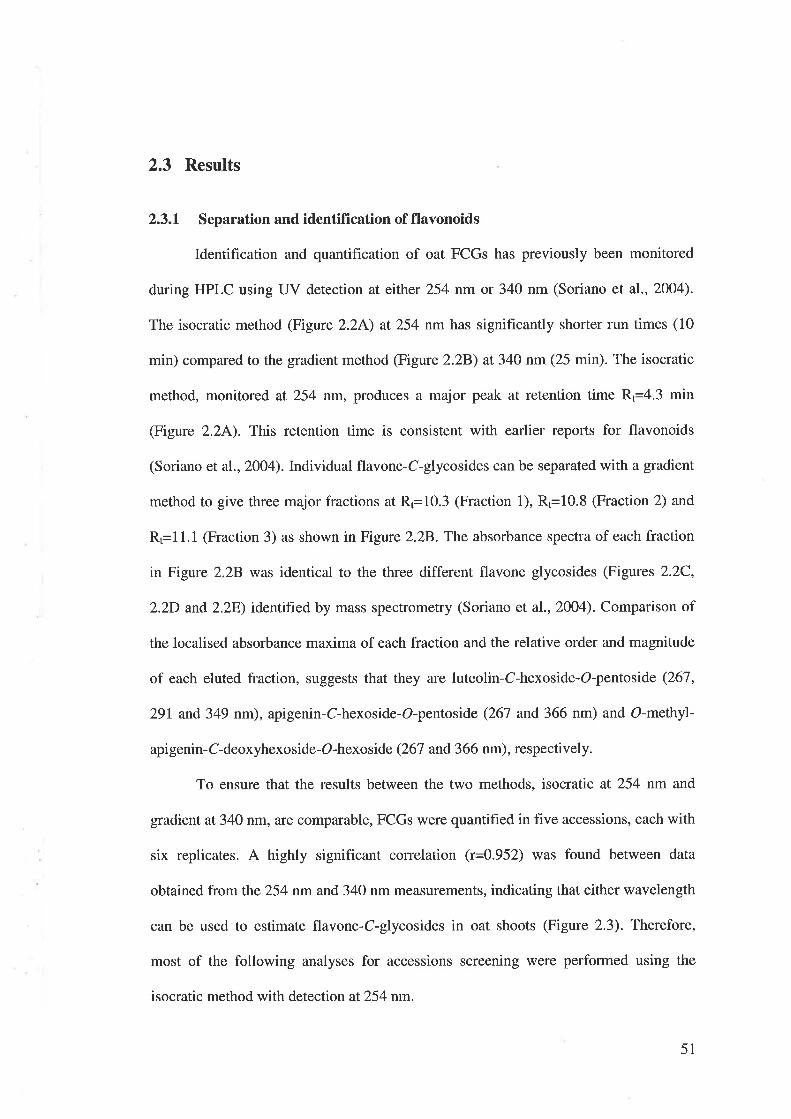
2.3 Results
2.3.1 Separation and identification of flavonoids
Identification and quantification of oat FCGs has previously been monitored
during HPLC using UV detection at either 254 nm or 340 nm (Soriano et al., 2OO4).
The isocratic method (Figure 2.2A) at 254 nm has significantly shorter run times (10
min) compared to the gradient method (Figure 2.28) at34O nm (25 min). The isocratic
method, monitored at 254 nm, produces a major peak at retention time R,={.1 ¡ln
(Figure 2.2A). This retention time is consistent with earlier reports for flavonoids
(Soriano et al.,2OO4). Individual flavone-C-glycosides can be separated with a gradient
method to give three major fractions at R1=lQ.l (Fraction 1), R,=19.3 (Fraction 2) and
Rt=l1.1 (Fraction 3) as shown in Figure 2.28. The absorbance spectra of each fraction
in Figure 2.28 was identical to the three different flavone glycosides (Figures 2.2C,
2.2D and 2.28) identified by mass spectrometry (Soriano et al., 2004). Comparison of
the localised absorbance maxima of each fraction and the relative order and magnitude
of each eluted fraction, suggests that they are luteolin-C-hexoside-O-pentoside (267,
291 and 349 nm), apigenin-C-hexoside-O-pentoside (267 and 366 nm) and O-methyl-
apigenin-C-deoxyhexoside-O-hexoside (267 and 366 nm), respectively.
To ensure that the results between the two methods, isocratic at 254 nm and
gradient at34O nm, are comparable, FCGs were quantified in five accessions, each with
six replicates. A highly significant correlation (r=0.952) was found between data
obtained from the 254 nm and 340 nm measurements, indicating that either wavelength
can be used to estimate flavone-C-glycosides in oat shoots (Figure 2.3). Therefore,
most of the following analyses for accessions screening were performed using the
isocratic method with detection at254 nm.
51
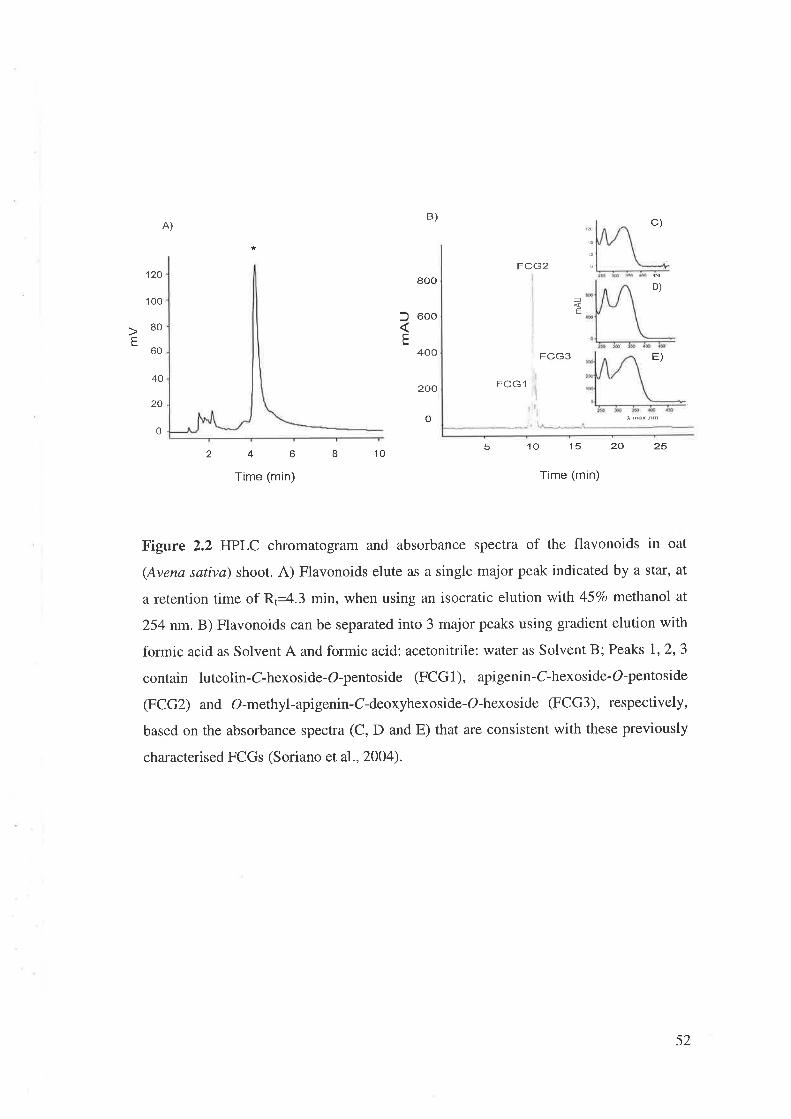
B)A) c)
D)
E)400
200
FÇG2120
100
80
60
40
20
0
aoof
EI ooo
E EFCG3
FCGl,ii¡
I
,,'i
10 15 20 25
o
2 4 b I l0 5
Time (min) Time (min)
Figure 2.2 HPLC chromatogram and absorbance spectra of the flavonoids in oat
(Avena sativa) shoot. A) Flavonoids elute as a single major peak indicated by a star, at
a retention time of Rt=4.3 min, when using an isocratic elution with 45Vo methanol at
254 nm. B) Flavonoids can be separated into 3 major peaks using gradient elution with
formic acid as Solvent A and formic acid: acetonitrile: water as Solvent B; Peaks 1,2,3
contain luteolin-C-hexoside-O-pentoside (FCG1), apigenin-C-hexoside-O-pentoside
(FCG2) and O-methyl-apigenin-C-deoxyhexoside-O-hexoside (FCG3), respectively,
based on the absorbance spectra (C, D and E) that are consistent'with these previously
characterised FCGs (Soriano et al., 2OO4).
52
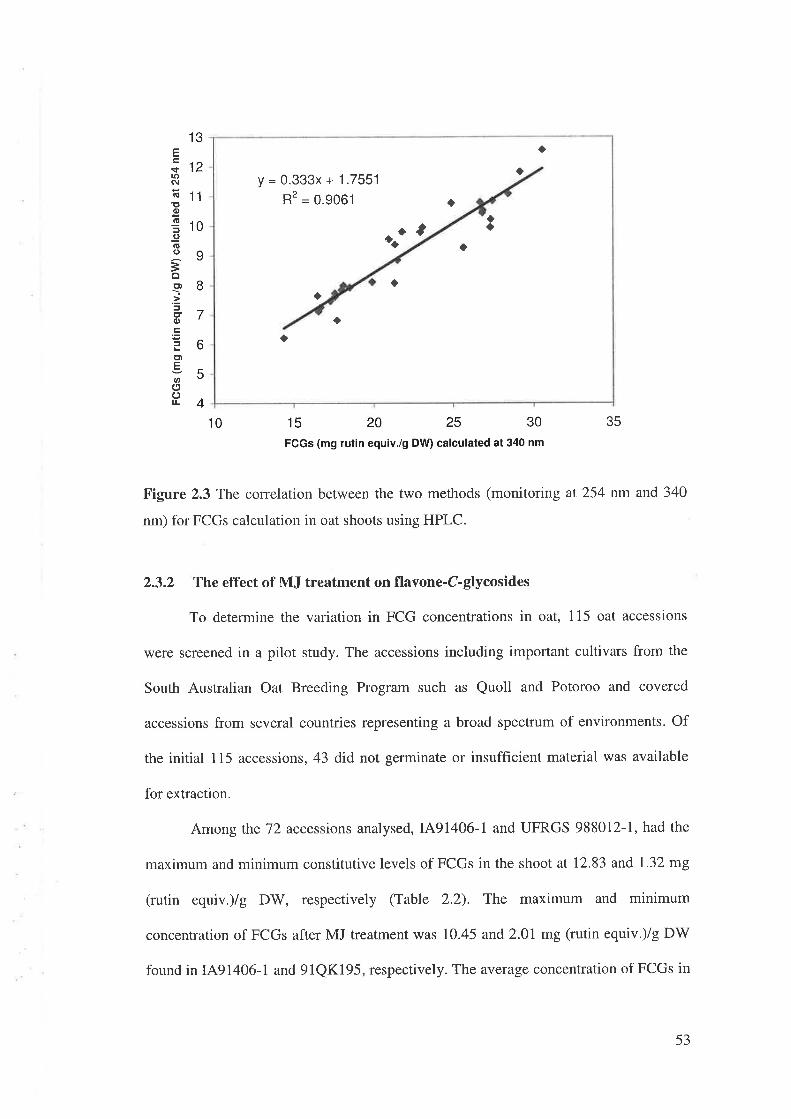
oa
ao
a
oo
a
oa
t
y=0.333x+1.7551R2 = o.906l
aOÔ
31
12
11
E<froô¡¡úõ6)(E
El¿(lto
=oct)-ì.¿Eotr
ct)Eatool¡-
10
9
B
7
6
5
410 15 20 25 30
FCGs (mg rutin equiv./g DW) calculated at 340 nm
35
Figure 2.3 The correlation between the two methods (monitoring at 254 nm and 340
nm) for FCGs calculation in oat shoots using HPLC.
2.3.2 The effect of MJ treatment on flavone-C-glycosides
To determine the variation in FCG concentrations in oat, 115 oat accessions
were screened in a pilot study. The accessions including important cultivars from the
South Australian Oat Breeding Program such as Quoll and Potoroo and covered
accessions from several countries representing a broad spectrum of environments. Of
the initial 115 accessions, 43 did not germinate or insufficient material was available
for extraction.
Among the72 accessions analysed, 1491406-1 and UFRGS 988012-1, had the
maximum and minimum constitutive levels of FCGs in the shoot at 12.83 and 1.32 mg
(rutin equiv.)/g DW, respectively (Table 2.2). The maximum and minimum
concentration of FCGs after MJ treatment was 10.45 and 2.01mg (rutin equiv.)/g DW
found in I491406-1 and 91QKl95, respectively. The average concentration of FCGs in
53
the shoots in control plants was 6.03 + 0.23 and for MJ treated plants it was 6.01 + 0.20
mg (rutin equiv.)/g DW. It was not possible to analyse the data following the planned
augmented design because seeds of 43 samples did not germinate and therefore most of
the replicates were lost. Although there were some accessions where FCGs were higher
or lower in the MJ treated samples (Table 2.2), paired /-test showed treatment with MJ
did not significantly induce FCGs in oat accessions.
From the 72 accessions analysed, 21 accessions (bold accessions inTable2.2)
were selected for the next experiment. The 21 accessions were chosen because they
spanned a wide range of concentrations of FCGs and they had different responses to MJ
(increased, decreased and unchanged). All 2l samples were grown in duplicate.
Analyses of variance (ANOVA) showed significant differences among the accessions
with respect to expression of FCGs in the shoot (P<0.01). The accessions could be
classified into different groups based on FCG concentration in their shoots (Figtre 2.4).
Accessions I491406-1 and Kingfisher had maximum and minimum concentrations of
flavonoids, with 5.496 and 3.461 mg (rutin equiv.)/g DW, respectively. Again there
was no significant difference in the mean concentration of FCGs in MJ treated and
untreated plants (Figure 2.4).
To better control the environmental conditions and confirm the results, five of
the 27 accessions (underlined accessions in Figure 2.4) were selected and tested in a
randomised block design with three replicates in a growth chamber. Accessions IA
91406-l and 91QKl95 were selected for further analysis because of high concentration
of FCGs and a slight reduction in concentration of FCGs in MJ treated plants.
L'Gorskij was selected because it showed there was no change in the concentration of
FCGs in response to MJ. Potoroo was selected because it showed the largest increase in
FCGs in response to MJ. Finally, Quoll was chosen because Quoll is an important
54
cultivar in the South Australian breeding program and is also representative of
accessions with low level of FCGs (level e). Analysis of the FCGs was carried out by
HPLC at 254 nm. There was significant genetic variation of FCG concentration in oat
accessions and mean comparison (P<0.05) revealed that these accessions could be
classified into three groups (Figure 2.5). Accession IA91406-I had the highest
concentration of FCGs with 11.26 mg (rutin equiv.)/g DW and accession 91QK195 had
the lowest concentration of FCGs with 7.57 mg (rutin equiv.)/g DW in their shoot. It
should be noted that the rank of accession 91QK195 changed from the highest level of
FCGs (level a, Figure 2.4) in the previous experiment to the lowest level (level c,
Figure 2.5) in this experiment. The concentrations observed (Figure 2.5) are higher than
the previous experiment (Figure 2.4), which possibly is due to differences in
environmental conditions of growth chamber compared to the glasshouse.
There was no induction of FCGs by MJ. The lack of MJ induction was further
investigated, as this was in contrast to a previous study by Soriano et al. (2004).
2.3.3 Effect of MJ application methods on the induction of FCGs
To determine whether the method of MJ application had an impact on FCGs
induction, three different methods of MJ application (drench, volatile and spray) were
tested on oat cv. Quoll. The concentration of FCGs was the same in control plants and
in plants treated with MJ by vapour and spray treatment (Figure 2.6). MJ application
by drenching significantly reduced the levels of FCGs (Figure 2.6).
55
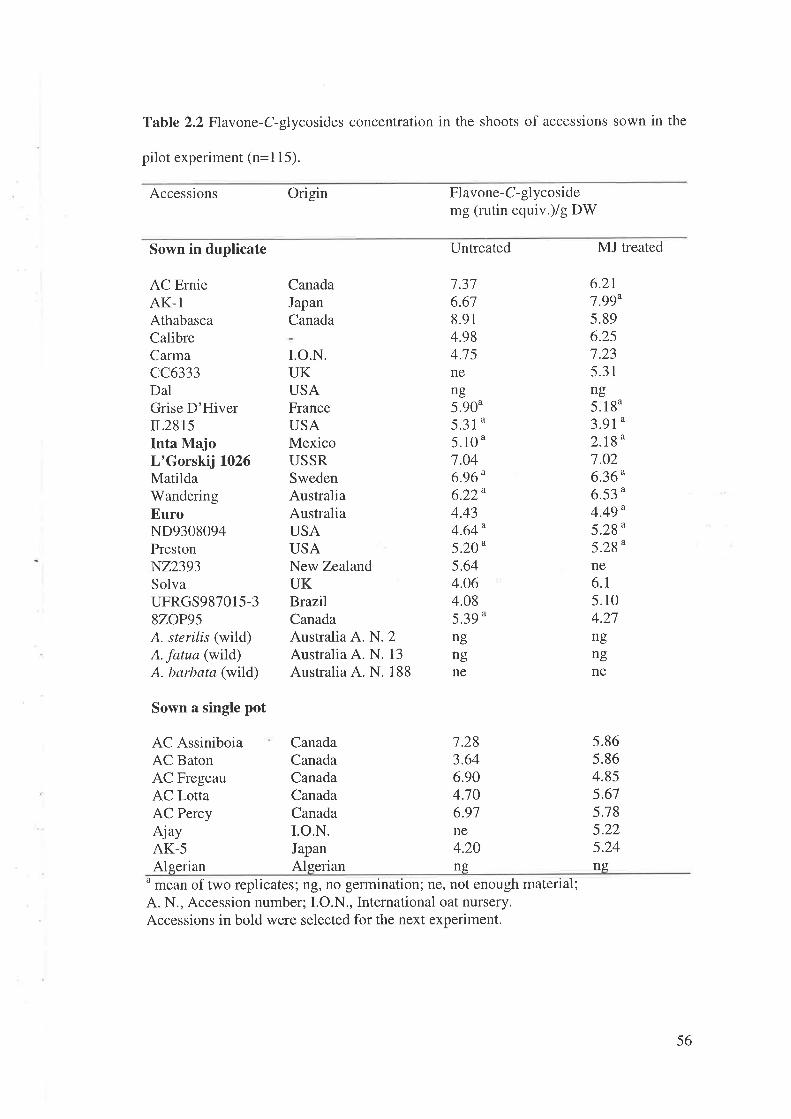
Table 2.2 Flavone-C-glycosides concentration in the shoots of accessions sown in the
pilot experiment (n=1 1 5).
Accessions Origin Flavone-C-glycosidemg (rutin equiv.)/g DW
Sown in duplicate Untreated MJ treated
AC ErnieAK-1AthabascaCalibreCarmacc6333DalGrise D'HiverrL2815Inta MajoL'Gorskij L026MatildaWanderingEuroND9308094PrestonN22393SolvaUFRGS987015-39ZOP95A. sterilis (wild)A, fatua (wild)A. barbata (wild)
r.o.N.UKUSAFranceUSAMexicoUSSRSwedenAustraliaAustraliaUSAUSANew ZealandUKBrazilCanadaAustralia A. N. 2Australia A. N. 13Australia A. N. 188
CanadaCanadaCanadaCanadaCanadar.o.N.JapanAlgerian
Sown a single pot
CanadaJapanCanada
7.376.678.914.984.7 5neng5.90u5.31u5.10 u
7.046.96^6.22u4.434.64"5.20u5.644.064.085.39ungngne
1.283.646.904.706.91ne4.20ng
6.2t7.ggu5.896.257.235.31ng5.1 8u
3.9r"2.rgu7.026.36"6.53"4.49u5.28u5.28"ne6.t5.104.27ngngne
AC AssiniboiaAC BatonAC FregeauAC LottaAC PercyAjavAK-5Algerian
5.865.864.855.675.785.225.24ng
u mean of two replicates; ng, no germination; ne, not enough material;A. N., Accession number; I.O.N., International oat nursery.Accessions in bold were selected for the next experiment.
56
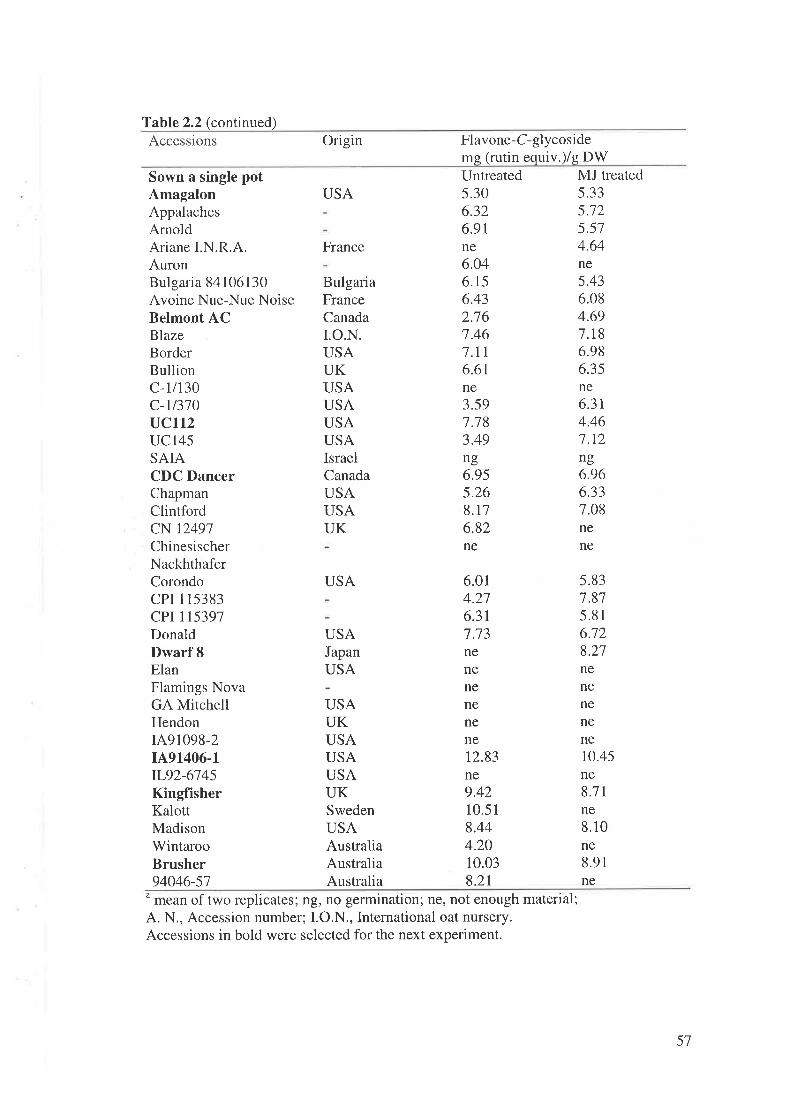
Table 2.2 (continued)Accessions Origin Flavone-C-glycoside
ms (rutin equiv.)/g DWSown a single potAmagalonAppalachesArnoldAriane I.N.R.A.AuronBulgaria 84106130Avoine Nue-Nue NoiseBelmont ACBlazeBorderBullionc-1/130c-11370UCII2UCI45SAIACDC DancerChapmanClintfordcN 12491ChinesischerNackhthaferCorondocPI 1 15383cPr 1 15397DonaldDwarf IElanFlamings NovaGA MitchellHendonr491098-2I491406-1rL92-6745KingfisherKalottMadisonWintarooBrusher94046-51
BulgariaFranceCanadar.o.N.USAUKUSAUSAUSAUSAIsraelCanadaUSAUSAUK
USA
France
USA
USAJapanUSA
Untreated5.306.326.9tne6.046.156.432.767.467.tr6.61ne3.597.783.49ng6.955.268.176.82ne
MJ treated5.335.125.574.64ne5.436.084.697.186.986.35ne6.314.467.12ng6.966.337.08nene
6.014.276.3t7.13
5.837.875.816.728.27
USAUKUSAUSAUSAUKSwedenUSAAustraliaAustraliaAustralia
nenenenene10.45ne
nenenenenene12.83ne9.4210.518.444.2010.038.21
8.71ne8.10ne8.91ne
u mean of two replicates; ng, no germination; ne, not enough material;A. N,, Accession number; I.O.N., International oat nursery.Accessions in bold were selected for the next experiment.
57
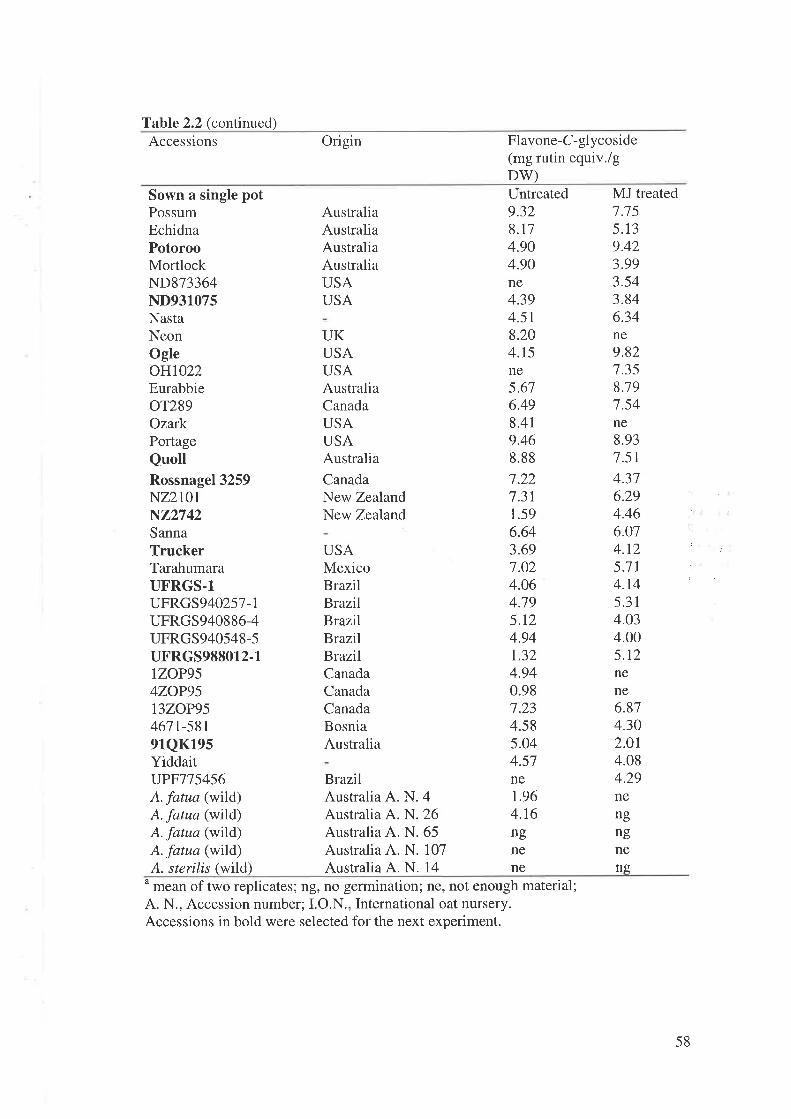
Table 2.2 (continued)Accessions Origin Flavone-C-glycoside
(mg rutin equiv./gDV/)
Sown a single potPossumEchidnaPotorooMortlockND873364ND931075NastaNeonOgleowlo22Eurabbieor289OzarkPortageQuollRossnagel 3259NZ2t0tN22742SannaTruckerTarahumaraUFRGS-1UFRGS940257-1UFRGS940886-4UFRGS940548-5UFRGS988012-1lzoP954ZOP95t3zoP95467t-58191QK19sYiddaituPw75456A. fatua (wild)A. fatua (wild)A. fatua (wild)A. fatua (wild)A. sterilis (wild)
AustraliaAustraliaAustraliaAustraliaUSAUSA
UKUSAUSAAustraliaCanadaUSAUSAAustraliaCanadaNew ZealandNew Zealand
Untreated9.328.174.904.90ne4.394.5t8.204.r5ne5,676.498.419.468.88
7.227.311.596.643.697.024.064.795.r24.941.324.940.987.234.585.044.57ne1.964.t6ngnene
MJ treated1.755.139.423.993.543.846.34ne9.827.358.797.54ne8.937.514.376.294.466.074.I2 ' ,
5.71 '4.145.314.034.005.12nene6.874.302.014.084.29nengngne
USAMexicoBrazilBrazilBrazilBrazilBrazilCanadaCanadaCanadaBosniaAustralia
BrazilAustralia A. N. 4Australia A. N. 26Australia A. N. 65Australia A. N. 107Australia A. N. 14 ng
u mean of two replicates; ng, no germination; ne, not enough material;A. N., Accession number; LO.N., International oat nursery.Accessions in bold were selected for the next experiment.
58
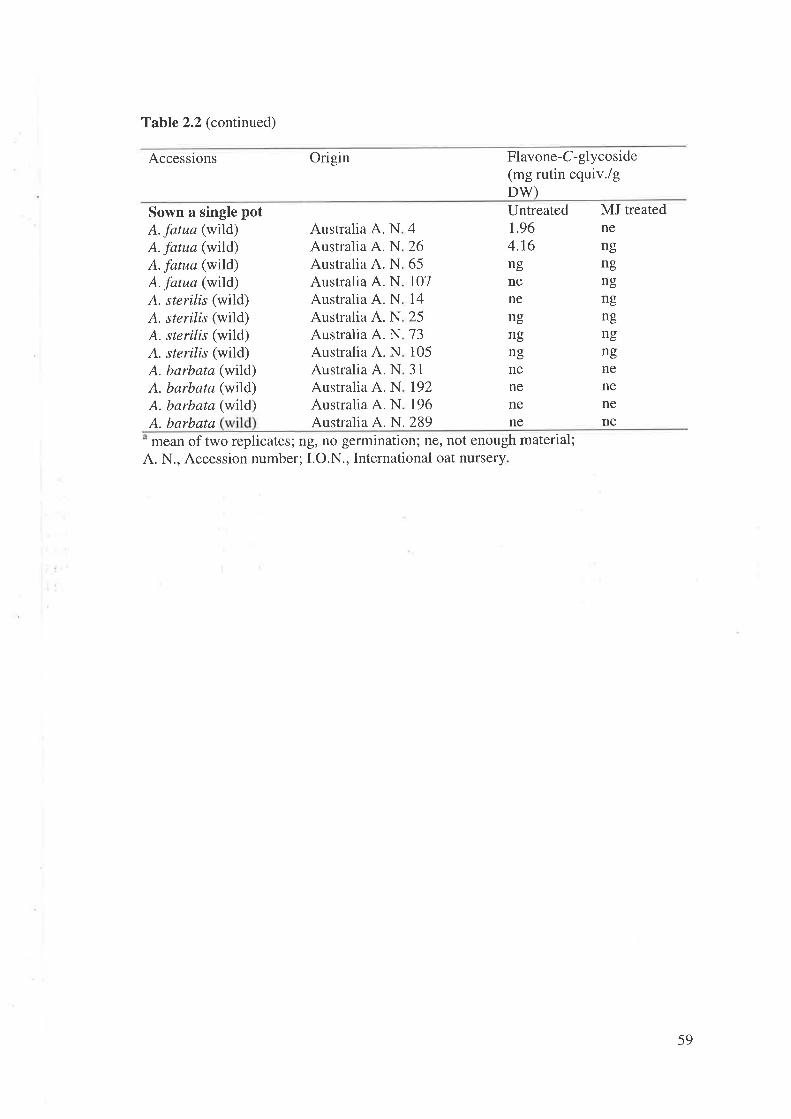
Table 2.2 (continued)
Accessions Origin Flavone-C-glycoside(mg rutin equiv./gDW)
Sown a single potA. fatua (wild)A. fatua (wild)A. fatua (wild)A. fatua (wild)A. sterilis (wild)A. sterilis (wild)A. sterilis (wild)A. sterilis (wild)A. barbata (wild)A. barbata (wild)A. barbata (wild)
Australia A.Australia A.Australia A.Australia A.Australia A.Australia A.Australia A.Australia A.Australia A.Australia A.Australia A.
Untreated1.964.16ngnenengngngnenenene
NNNNNNNNNNN
42665toll425t31053l192r96
MJnensngngngngngngnenenene
treated
A. barbata Australia A. N. 289mean of two replicates; ng, no germination; ne, not enough material;
A. N., Accession number; I.O.N., International oat nursery
59
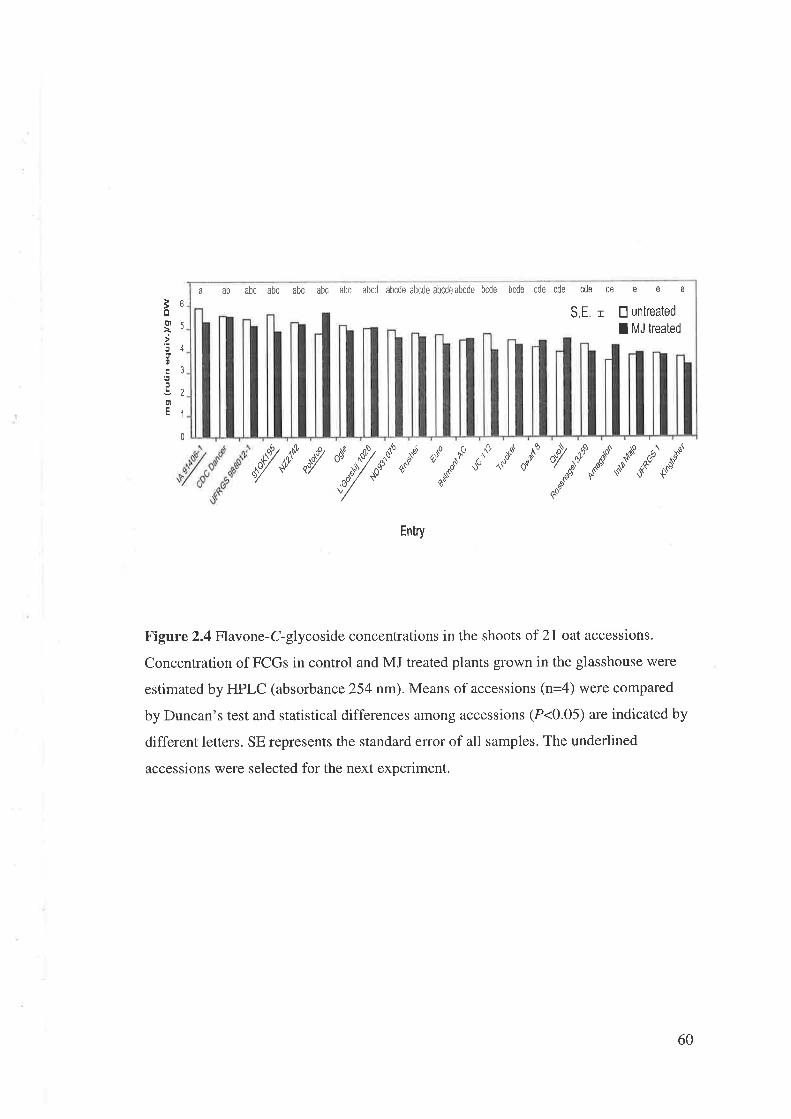
a ab abc abc abc abc âbc abcd abcce abcde abcdeabcde bcde bcde cde cde
untreated
MJ treated
deeeeEI
cde
S,E. rIoo
.tJo0j
EI
oE
6
5
4
3
2
1
0
/-É-,/ .þ%r- ,-f,i*J nÑ op ** %/-n-t,**-.ou oC
Entry
Figure 2.4Flavone-C-glycoside concentrations in the shoots of 2l oat accessions.
Concentration of FCGs in control and MJ treated plants grown in the glasshouse were
estimated by HPLC (absorbance 254 nm). Means of accessions (n=4) were compared
by Duncan's test and statistical differences among accessions (P<0.05) are indicated by
different letters. SE represents the standard error of all samples. The underlined
accessions were selected for the next experiment.
60
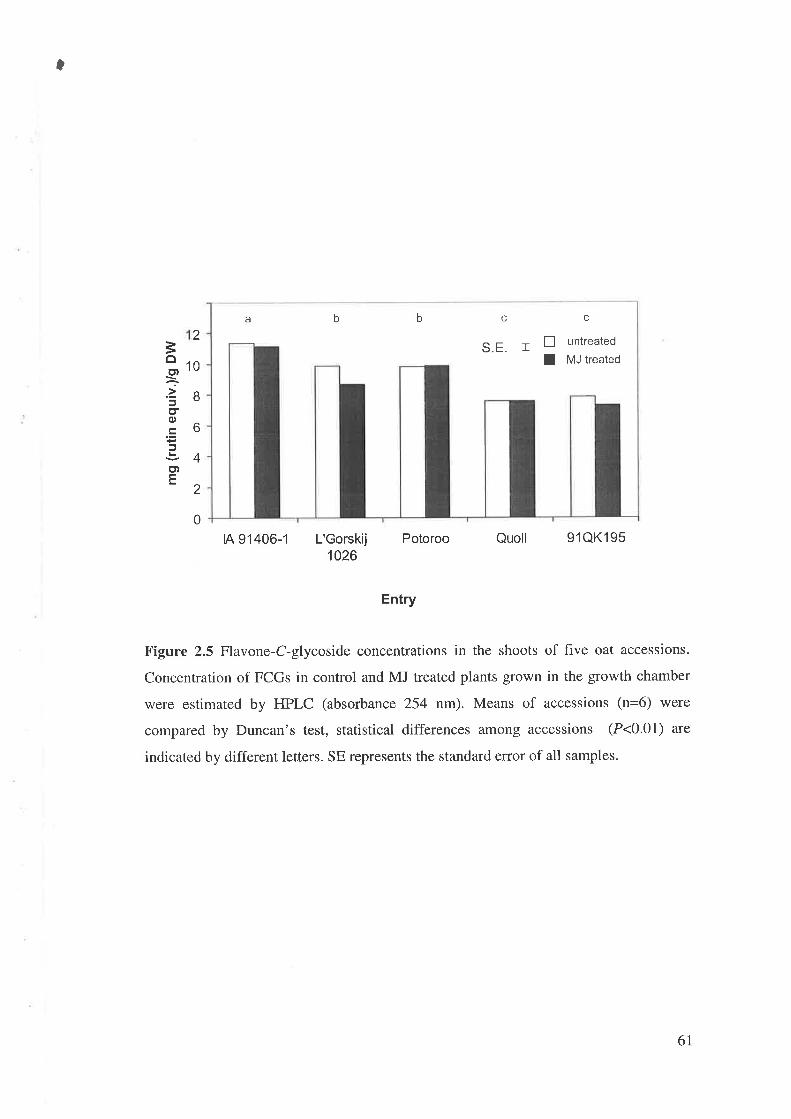
t
1=oct)
.¿JctoL.E
ct)E
2
0
B
6
4
2
0tA 91406-1 L'Gorskij
1026Potoroo Quoll 91QK195
Entry
Figure 2.5 Flavone-C-glycoside concentrations in the shoots of five oat accessions.
Concentration of FCGs in control and MJ treated plants grown in the growth chamber
were estimated by HPLC (absorbance 254 nm). Means of accessions (n=6) were
compared by Duncan's test, statistical differences among accessions (P<0.01) are
indicated by different letters. SE represents the standard error of all samples.
a cbb
S.E. rc
¡ untreated
I MJ treated
61
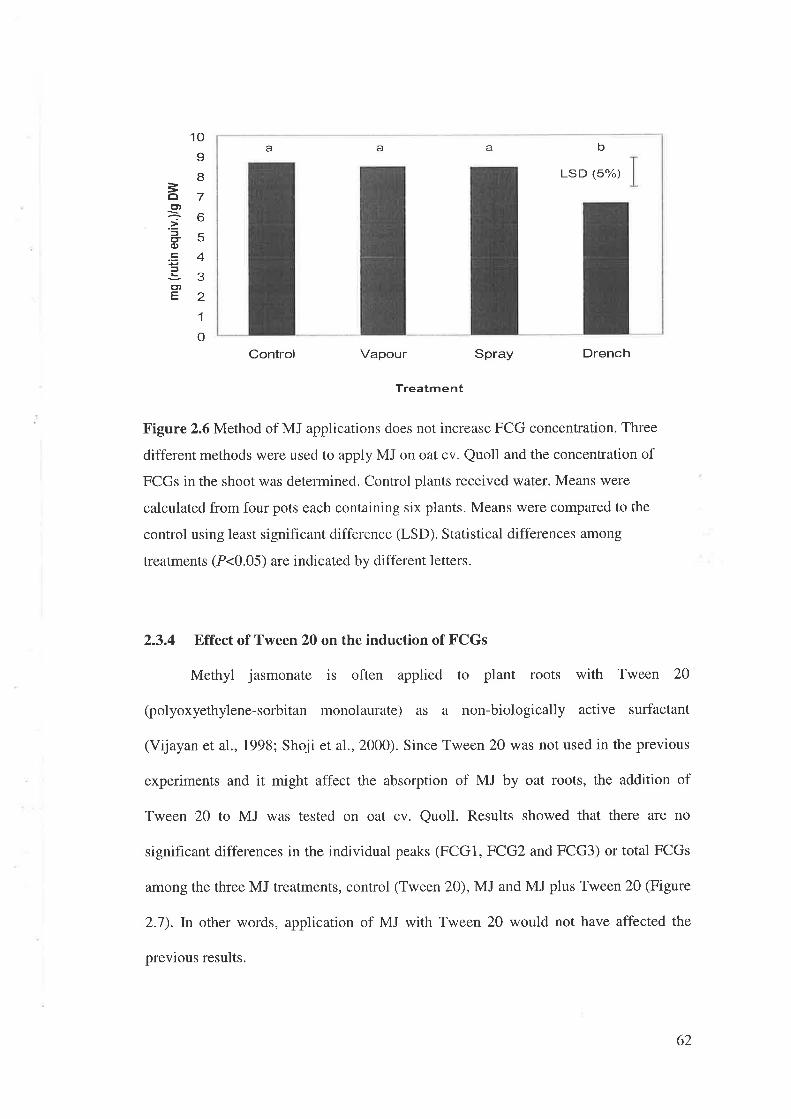
a a a b
LSD (5%)
Control Vapour Spray Drench
Treatment
Figure 2.6 Method of MJ applications does not increase FCG concentration. Three
different methods were used to apply MJ on oat cv. Quoll and the concentration of
FCGs in the shoot was determined. Control plants received water. Means were
calculated from four pots each containing six plants. Means were compared to the
control using least significant difference (LSD). Statistical differences among
treatments (P<0.05) are indicated by different letters.
2.3.4 Effect of Tween 20 on the induction of FCGs
Methyl jasmonate is often applied to plant roots with Tween 20
(polyoxyethylene-sorbitan monolaurate) as a non-biologically active surfactant
(Vijayan et a1., 1998; Shoji et al., 2000). Since Tween 20 was not used in the previous
experiments and it might affect the absorption of MJ by oat roots, the addition of
Tween 2O to MJ was tested on oat cv. Quoll. Results showed that there are no
significant differences in the individual peaks (FCGI, FCG2 and FCG3) or total FCGs
among the three MJ treatments, control (Tween 20), MJ and MJ plus Tween 20 (Figure
2.7). In other words, application of MJ with Tween 20 would not have affected the
previous results.
=Êrct
.ËEo,.FJ
E')E
oII7b
54321
o
1
62
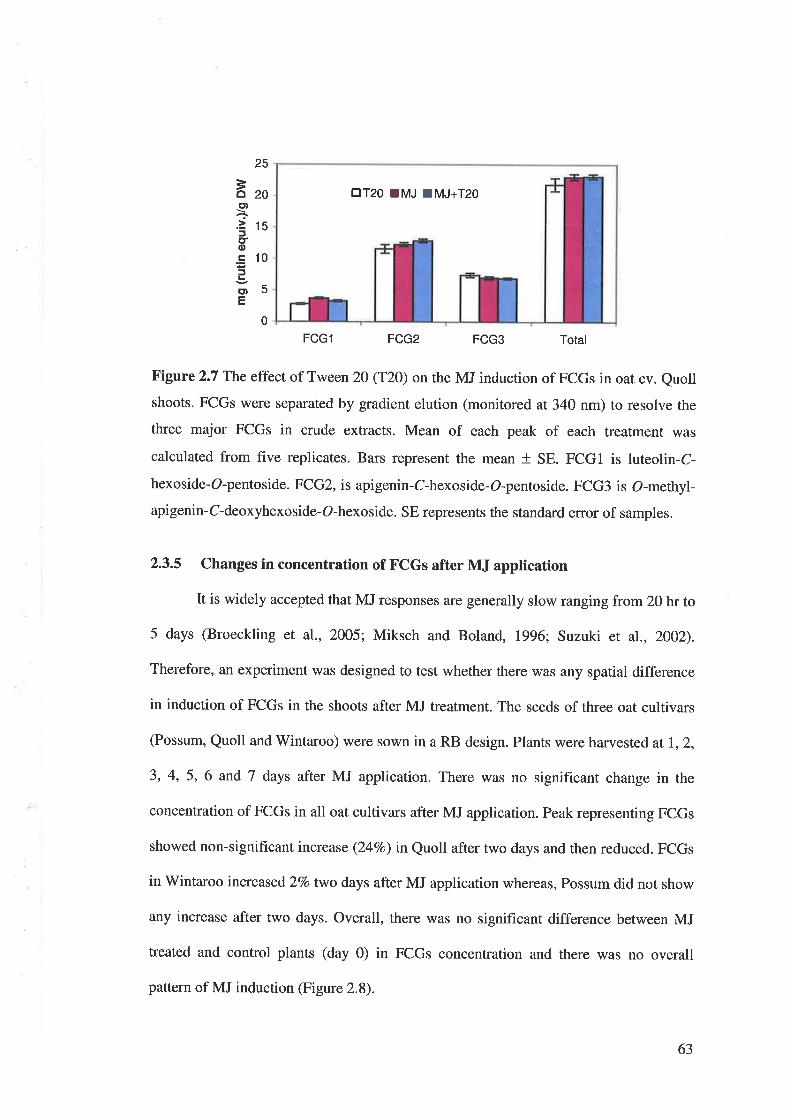
25
=a20ct)
.Ë ls5CTo.= 105Gn5E
0
FCGl FCG2 FCG3 Total
Figure 2.7 The effect of Tween 20 (T2O) on the MJ induction of FCGs in oat cv. Quollshoots. FCGs were separated by gradient elution (monitored at 340 nm) to resolve the
three major FCGs in crude extracts. Mean of each peak of each treatment was
calculated from five replicates. Bars represent the mean * SE. FCGI is luteolin-C-hexoside-O-pentoside. FCGZ, is apigenin-C-hexoside-O-pentoside. FCG3 is O-methyl-
apigenin-C-deoxyhexoside-O-hexoside. SE represents the standard error of samples.
2.3.5 Changes in concentration of FCGs after MJ application
It is widely accepted that MJ responses are generally slow ranging from 20 hr to
5 days (Broeckling et al., 2oo5; Miksch and Boland, 1996; suzuki et al., 2002).
Therefore, an experiment was designed to test whether there was any spatial difference
in induction of FCGs in the shoots after MJ treatment. The seeds of three oat cultivars
(Possum, Quoll and Wintaroo) were sown in a RB design. Plants were harvested at 1, 2,
3, 4, 5,6 and 7 days after MJ application. There was no signif,cant change in the
concentration of FCGs in all oat cultivars after MJ application. Peak representing FCGs
showed non-significant increase (24Vo) in Quoll after two days and then reduced. FCGs
in Wintaroo increased 2Vo two days after MJ application whereas, Possum did not show
any increase after two days. Overall, there was no significant difference between MJ
treated and control plants (day 0) in FCGs concentration and there was no overall
pattern of MJ induction (Figure 2.8).
trT20 ¡MJ IMJ+T2O
63
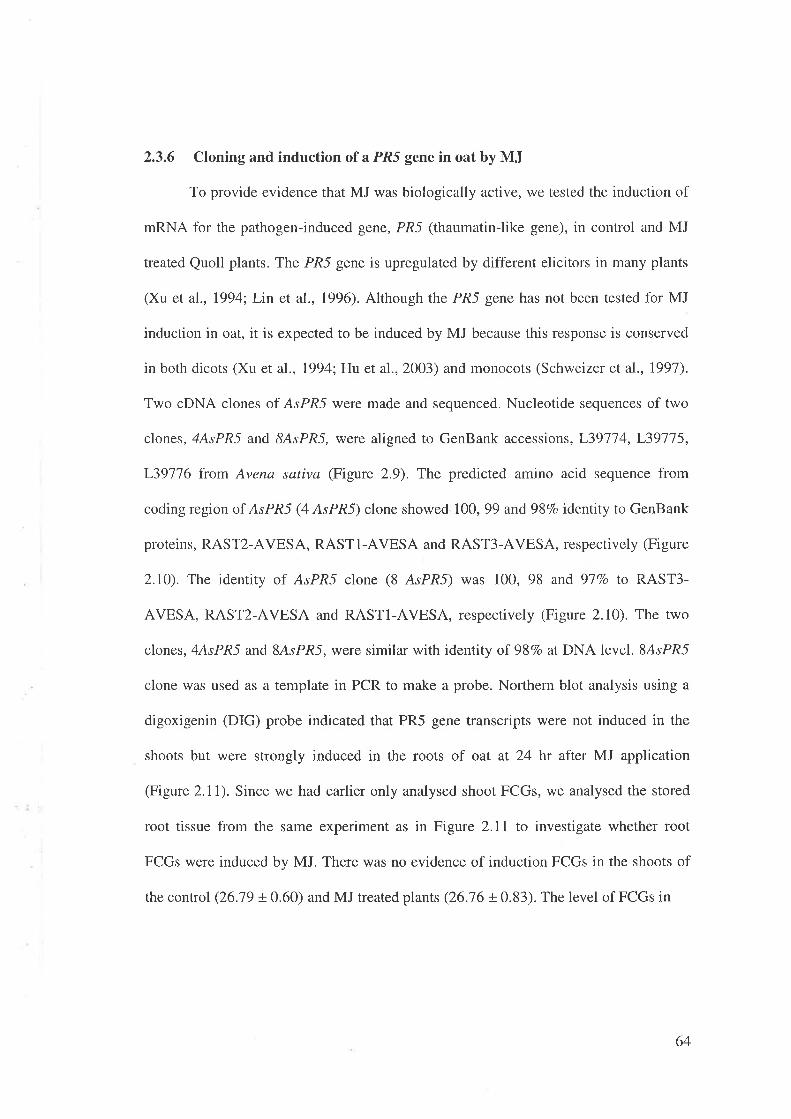
2.3.6 Cloning and induction of a PRS gene in oat by MJ
To provide evidence that MJ was biologically active, we tested the induction of
mRNA for the pathogen-induced gene, PR5 (thaumatin-like gene), in control and MJ
treated Quoll plants. The PR5 gene is upregulated by different elicitors in many plants
(Xu et a1., 1994; Lin et al., 1996). Although the PR5 gene has not been tested for MJ
induction in oat, it is expected to be induced by MJ because this response is conserved
in both dicots (Xu et al., 1994: Hu et al.,2OO3) and monocots (Schweizer et al., 1997).
Two cDNA clones of AsPR5 were made and sequenced. Nucleotide sequences of two
clones, 4AsPR5 and 8AsPR5, were aligned to GenBank accessions, L39774, L39115,
L39716 from Avena sativa (Figure 2.9). The predicted amino acid sequence from
coding region of AsPR5 (4 AsPRS) clone showed 100, 99 and 98Vo identity to GenBank
proteins, RAST2-AVESA, RAST I -AVESA and RAST3-AVESA, respectively (Figure
2.lO). The identity of AsPR5 clone (8 AsPR5) was 100, 98 and 917o fo RAST3-
AVESA, RAST2-AVESA and RASTI-AVESA, respectively (Figure 2.lO). The two
clones, 4AsPR5 and 8AsPR5, were similar with identity of 98Vo at DNA level. 8AsPR5
clone was used as a template in PCR to make a probe. Northern blot analysis using a
digoxigenin (DIG) probe indicated that PR5 gene transcripts were not induced in the
shoots but were strongly induced in the roots of oat at 24 hr after MJ application
(Figure 2.11). Since we had earlier only analysed shoot FCGs, we analysed the stored
root tissue from the same experiment as in Figure 2.ll to investigate whether root
FCGs were induced by MJ. There ,was no evidence of induction FCGs in the shoots of
thecontrol (26.1910.60)andMJtreatedplants (26.76 t0.83).Thelevelof FCGsin
64
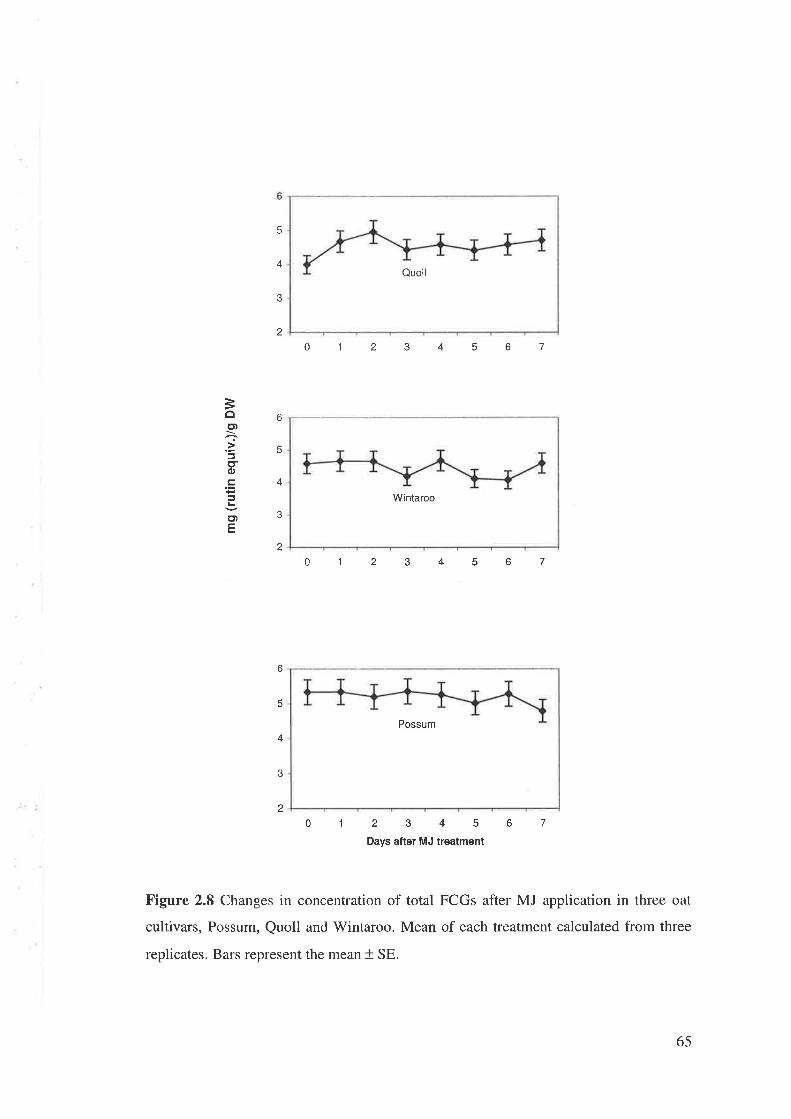
Ouoll
5
4
3
6
5
2
2
=og)
-.zJctog5
E)E
4
3
2
0f234567
01234567
0f234567
6
5
4
3
Days after MJ treatment
Figure 2.8 Changes in concentration of total FCGs after MJ application in three oat
cultivars, Possum, Quoll and Wintaroo. Mean of each treatment calculated from three
replicates. Bars represent the mean * SE.
Wintaroo
Possum
65
the roots was too low for accurate quantification (Figure 2.12). The roots contain
abundant compounds at R¡>22 min that are not FCGs based on UV absorption and
spectrum (data not shown).
2.3.7 Antimicrobial activity of shoot crude extracts
FCGs in oat are reported to be active against nematode (Soriano et al., 2OO4),
but their antimicrobial activity has not been tested. Therefore, shoot crude extracts of
oat were tested against bacteria and fungi. The growth of P. teres f. teres (Figure
2.I3^) and P. avenae DAR 32137 (Figure 2.138) was clearly inhibited by shoot crude
extracts from Quoll shoots as were all other Pyrenophorø tested (Figure 2J3D and
Figure 2.138) except P. avenae DAR 33699 (Figure 2.13C). Negligible inhibition was
observed with Quoll crude extract in M. pinodes (Figure 2.13F). The growth of P.
avenae DAR 32137, which is regarded as a compatible pathogen of oat, was inhibited
with crude extract from oat shoots (Figure 2.138). P. avenae DAR 33699 did not give
any inhibition in this experiment (Figure 2.13C). No inhibition of Fusarium
graminearum, Rhizoctonia solani, Pseudomonas syringae pv. syringae, Pseudomonas
syringae pv. pisi, Rathayibacter tritici and "Corynebacterium agropyri" was found
(data not shown).
The inhibitory effect of oat crude extracts on P. teres 1. teres was much higher
than that observed for wheat cv. 4us10348 extracts (Figure 2.13A).In contrast, both
oat and wheat had similar, albeit low levels of inhibition against M. pinodes (Figure
2.13F).
As mentioned above, the growth of P. teres f. teres was inhibited by shoot
crude extract of oat. To investigate the reaction of fungus with higher concentration of
66
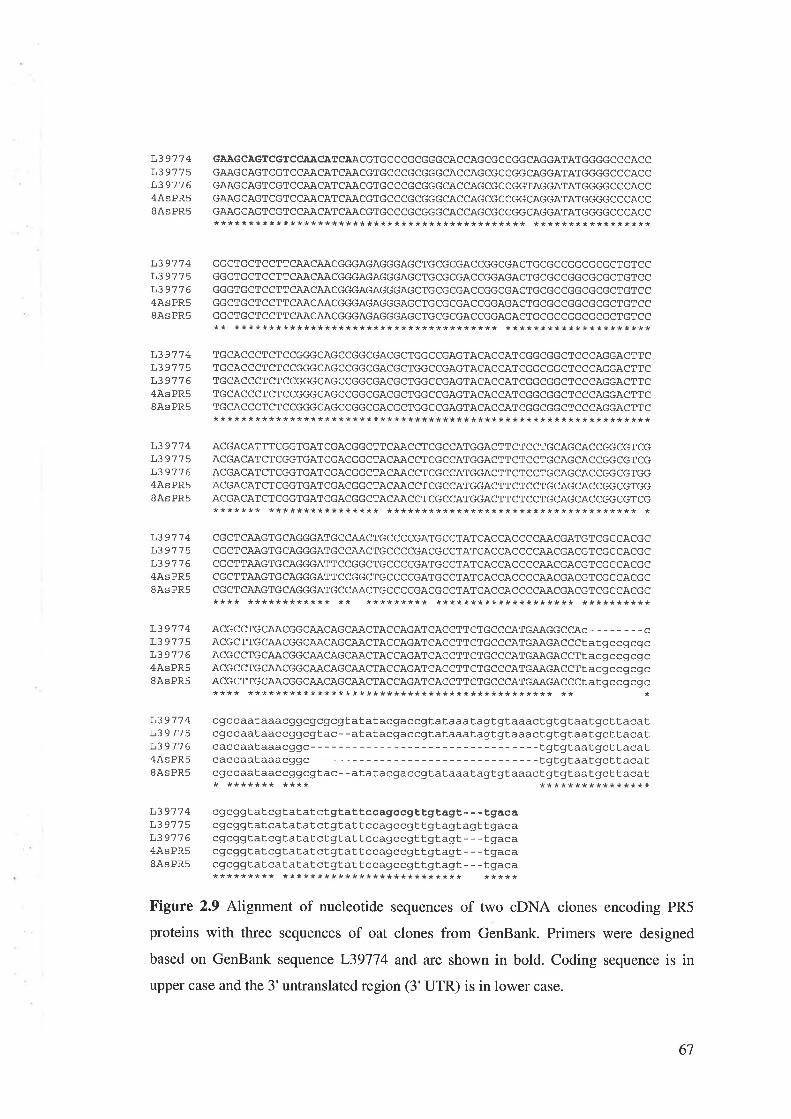
L3977 4L3977sL3917 64AsPRS8AsPR5
L39774L39715L397764AsPR58AsPR5
L3977 4L39775L391 7 64AsPR58AsPR5
L39774L39715L397'164AsPR58AsPR5
L3917 4L39775L397 7 64AsPR58AsPR5
L397'7 4L39775L397'764AsPR58AsPR5
L3977 4L39775L397764AsPR58ASPR5
L3977 4L39'77sL397 7 64AsPR58ASPR5
GAÃGCÀGTCGTCCAÀCATCAACGTGC CCGCGGGCACC.A,GCGC CGGCAGGATATGGGGC C CACCGAÄ,GCAGTCGTC CAACATCAACGTGC CCGCGGGCACCAGCGC CGGCAGGATATGGGGC C CACCGAAG CAGTCGTC CAÄ.CATCAACGTGC CCGCGGGCACCAGCGC CGGTAGGATATGGGGC C CACCGAAG CAGTCGTC CAÃCATCAACGTGCCCGCGGGCACCAGCGC CGGCAGGATATGGGGC C CACCGAAGCAGTCGTC CAÄCATCAACGTGCCCGCGGGCACCAGCGCCGGCAGGATATGGGGC C CAC C* *** * * ** * * * ** ** * * * * ** ** ** * * *** ** * * * * * * * ** ** * * * * * * * ** * * ** * * ** **
GGCTGCTCCTT CAACAACGGGAGAGGGAGCTGCGCGACCGGCGACTGCG C CGGCGCGCTGTC CGGCTGCTCCTT CAACAACGGGAGAGGGAGCTGCGCGACCGGAGACTGCGC CGGCGCGCTGTC CGGGTGCTCCTT CAACAACGGGAGAGGGAGCTGCGCGACCGGCGACTGCGC CGGCGCGCTGTCCGGCTGCTC CTT CA.A.CAACGGGAGAGGGAGCTG CGCGACCGGAGACTGCGC CGGCGCGCTGT CCGGCTGCTC CTT CAÄCAACGGGAGAGGGAGCTG CGCGACCGGAGACTGCGC CGGCGCGCTGT CC* * * *** *** ** ** * * *** * * * ** ** ** * ** * * * *** * ** * * * * * ** ** * * * * * * * ** * ** *
TGCAC CCT CT CCGGGCAGCCGGCGACGCTGGC CGAGTACACCATCGGCGGCTCC CAGGACTTCTGCACCCTCTCCGGGCAGCCGGCGACGCTGGCCGAGTACACCATCGGCGGCTCCCAGGACTTCTGCACCCTCT CCGGGCAGCCGGCGACGCTGGCCGAGTACACCATCGGCGGCTC C CAGGACTTCTGCACCCTCT CCGGGCAGCCGGCGACGCTGGCCGAGTACACCATCGGCGGCTC C CAGGACTTCTGCACCCTCTCCGGGCAGCCGGCGACGCTGGCCGAGTACACCATCGGCGGCTCCCAGGACTTC***************************************************************ACGACATTTCGGTGATCGACGGCTTCAACCTCGCCATGGACTTCTCCTGCAGCACCGGCGTCGACGACAT CTCGGTGATCGACGGCTACAÃ,C CTCGCCATGGACTT CTC CTGCAGCACCGGCGTCGACGACATCTCGGTGATCGACGGCTACAACCTCGCCATGGACTTCTCCTGCAGCACCGGCGTGGACGACATCT CGGTGATCGACGGCTACAACCT CGCCATGGACTT CT CCTGCAGCAC CGGCGTGGÄ,CGACATCTCGGTGATCGACGGCTACAACCTCGCCATGGACTTCTCCTGCAGCACCGGCGTCG* * * * * ** * * *** ** * * * * * * * * * * *** * ** * * * * * * ** * ** * *** * ** * ** * ** ** * * * *
CGCT CAÄ,GTGCAGGGATGC CA.ACTGC C C CGATGCCTATCAC CAC C CCAACGATGT CGC CACGCCGCTCAÄGTGCAGGGATGCCAÄCTGCCCCGACGCCTATCÄ,CCACCCCAACGACGTCGCCACGCCGCTT,AAGTGCAGGGATTCCGGCTGCCCCGATGCCTATCACCACCCCAACGACGTCGCCACGCCGCTTAAGTGCAGGGATTCCGGCTGCCCCGATGCCTÄ,TCACCACCCC,AÂCGACGTCGCCACGCCGCT CAÄ,GTGCAGGGATGCCAACTGC C CCGACGCCTÄ,TCAC CACCCCAACGACGTCGC CACGC**** ************ ** ********* ******************** **********ACGCCTGCAÄCGGCAACAGCAACTACCAGATCACCTTCTGCCCATGAAGGCCAC - - - - - - - - cACGCTTGCAACGGCAACAGCAACTACCAGATCACCTTCTcCCCATGAAGACCCT atgccgcgcACGCCTGCAACGGCAACÀGCAACTACCAGATCACCTTCTGCCCATGAAGACCTT acgccgcgcACGCCTGCA.A,CGGCA-A,CAGCAACTACCAGATCACCTTCTGCCCATGAå,GACCTtacgccgcgcACGCTTGCAACGGCAACAGC.AÄCTACCAGATCACCTTCTGCCCATGAAGACCCT atgccgcgc**** * ** * * * ** * * ** * * ** ** * * * * * ** * * * ** * * ** ** ** * * ** * * * * *
cgccaaf aaacggcgcgcgtatatacgaccgtataaatagtgt aaactgtgtaatgcttacatcgccaataaccggcgtac - - atatacgaccgtataaatagtgtaaactgtgtaatgcttacatcaccaat.aaacggc- - - - - - tgtgtaatgcttacatcaccaataaacggc- - - - - - - tgtgtaatgcttacatcgccaataaccggcgtac - - atat.acgaccgtataâatagtgtaaactgtgtaatgcttacat* ******* **** ****************cgcggtatcgtatatctgtat,tccagccgÈtgtagt - - - tgacacgcggtatcatatat ctgtat tccagccgttgtagtagttgacacgcggtatcgtatatctgtattccagccgttgtagt - - - tgacacgcggtatcgtatatctgtattccagccgttgtagt - - - tgacacgcggtatcatatatctgtattccagccgttgtagt - - - tgaca********* ************************** *****
Figure 2.9 Alignment of nucleotide sequences of two cDNA clones encoding PR5
proteins with three sequences of oat clones from GenBank. Primers were designed
based on GenBank sequence L39714 and are shown in bold. Coding sequence is inupper case and the 3'untranslated region (3'UTR) is in lower case.
67
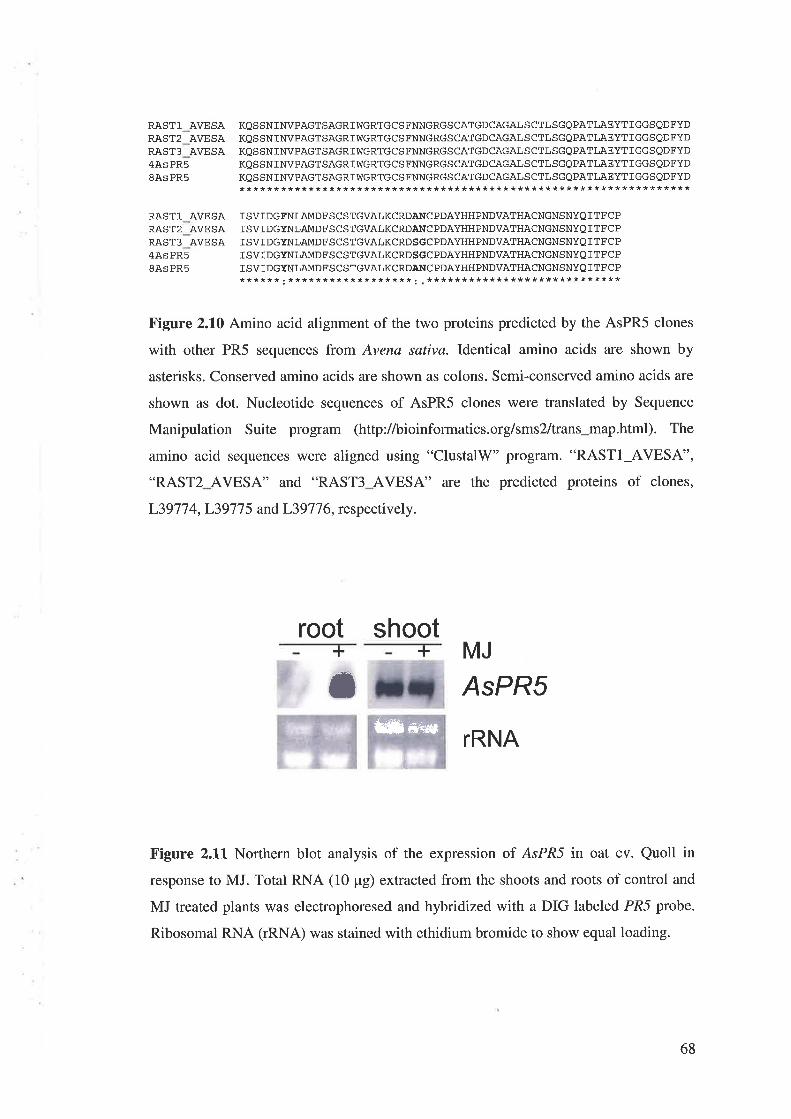
RAST1 AVESARÄST2 AVESAR.AST3 AVESA4AsPR58AsPR5
KQSSNTNVPAGTSAGRf WGRTGCS FNNGRGSCATGDCAGALS CTLSGQPATLAEYT IGGSQDFYDKQSSNINVPAGTSAGRI WGRTGCS FNNGRGSCATGDCAGALS CTLSGQPATLAEYT IGGSODFYDKQSSNTNVPAGTSAGRT WGRTGCS FNNGRGSCATGDCAGALS CTLSGQPATLAEYT IGGSQDFYDKQSSNINVPAGTSAGRT WGRTGCS FNNGRGSCATGDCAGALS CTLSGQPATLAEYT TGGSODFYDKQSSNINVPAGTSAGRTWGRTGCSFNNGRGS CATGDCAGALS CTLSGOPATLAEYT TGGSODFYD*****************************************************************
RAST]- AVESARÀST2 AVESARÀST3 AVESA4AsPR58ASPR5
T SVIDGFNLAMDFSCSTGVALKCRDAIi¡CPDAYHHPNDVATHACNGNSNYQ TTFCPI SVIDGYNLAMDFSCSTGVALKCRDANC PDAYHHPNDVATHACNGNSNYQ ITFCP] SVIDGYNLAMDFSCSTGVALKCRDSGC PDAYHHPNDVAT1IACNGNSNYQ ITFCPI SVIDGYNLAIVIDFS CSTGVALKCRDSGC PDAYHHPNDVATI{ACNGNSNYQ I TFCPI SVIDGYNLAMDFS CSTGVALKCRDANC PDAYHHPNDVATHACNGNSNYOI TFCP******.****************** : .*******************+********
Figure 2.10 Amino acid alignment of the two proteins predicted by the AsPR5 clones
with other PR5 sequences from Avena sativa. Identical amino acids are shown by
asterisks. Conserved amino acids are shown as colons. Semi-conserved amino acids are
shown as dot. Nucleotide sequences of AsPR5 clones were translated by Sequence
Manipulation Suite program (http://bioinformatics.org/sms2/trans_map.html). The
amino acid sequences were aligned using "ClustalW" program. "RASTI-AVESA",
"RAST2 AVESA" and "RAST3 AVESA" are the predicted proteins of clones,
L3977 4, L397 7 5 and L397 I 6, respectively.
root shoot+ MJ
AsPRS
rRNA
Figure 2.1L Northern blot analysis of the expression of AsPR5 in oat cv. Quoll in
response to MJ. Total RNA (10 pg) extracted from the shoots and roots of control and
MJ treated plants was electrophoresed and hybridized with a DIG labeled PR5 probe.
Ribosomal RNA (rRNA) was stained with ethidium bromide to show equal loading.
+r ü
å
*flþ *r*
68
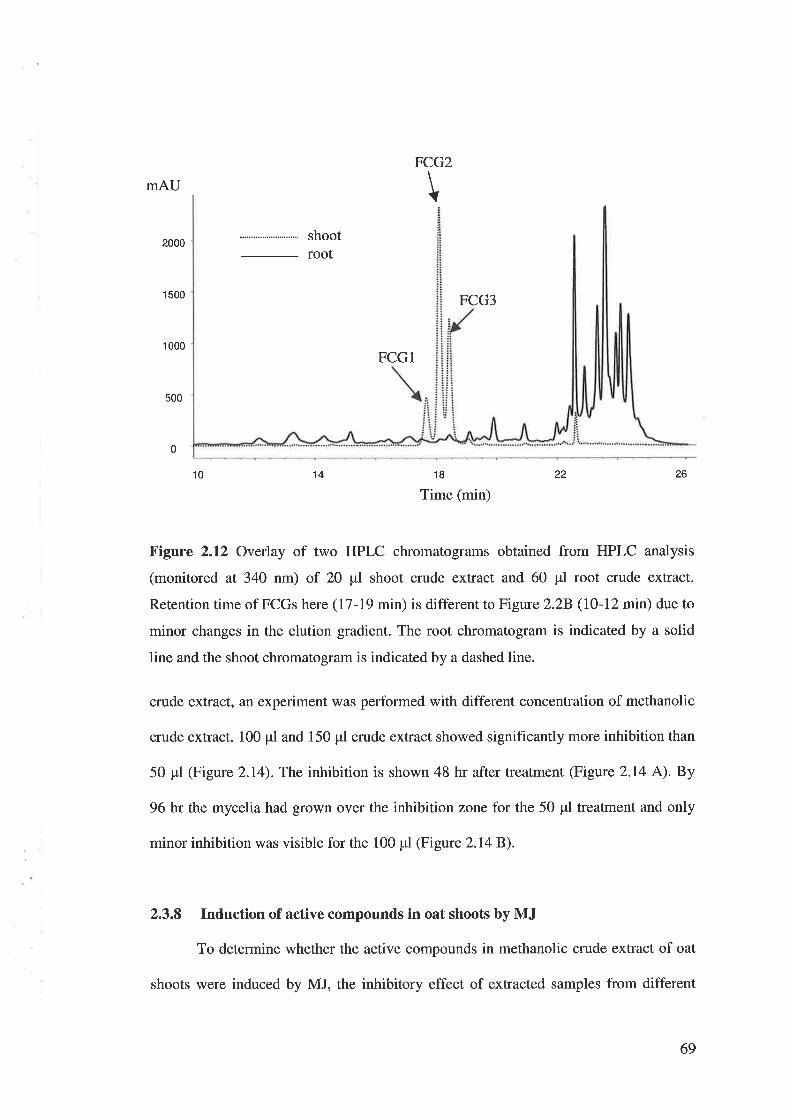
FCG2rnAU
-.---..-.--.-.- shoot
-
root
1 500 FCG3
1 000FCGl
0
10 14 1B
Time (min)22 ¿o
Figure 2.12 Overlay of two HPLC chromatograms obtained from HPLC analysis
(monitored at 340 nm) of 2O ¡tl shoot crude extract and 60 ¡rl root crude extract.
Retention time of FCGs here (17-19 min) is different to Figure 2.28 (lO-12 min) due to
minor changes in the elution gradient. The root chromatogram is indicated by a solid
line and the shoot chromatogram is indicated by a dashed line.
crude extract, an experiment was performed with different concentration of methanolic
crude extract. 100 ¡rl and 150 ¡rl crude extract showed significantly more inhibition than
50 ¡rl (Figure 2.14). The inhibition is shown 48 hr after treatment (Figure 2.14 lt). By
96 hr the mycelia had grown over the inhibition zone for the 50 ¡rl treatment and only
minor inhibition was visible for the 100 pl (Figure 2.148).
2.3.8 Induction of active compounds in oat shoots by MJ
To determine whether the active compounds in methanolic crude extract of oat
shoots were induced by MJ, the inhibitory effect of extracted samples from different
\
2000
500
69
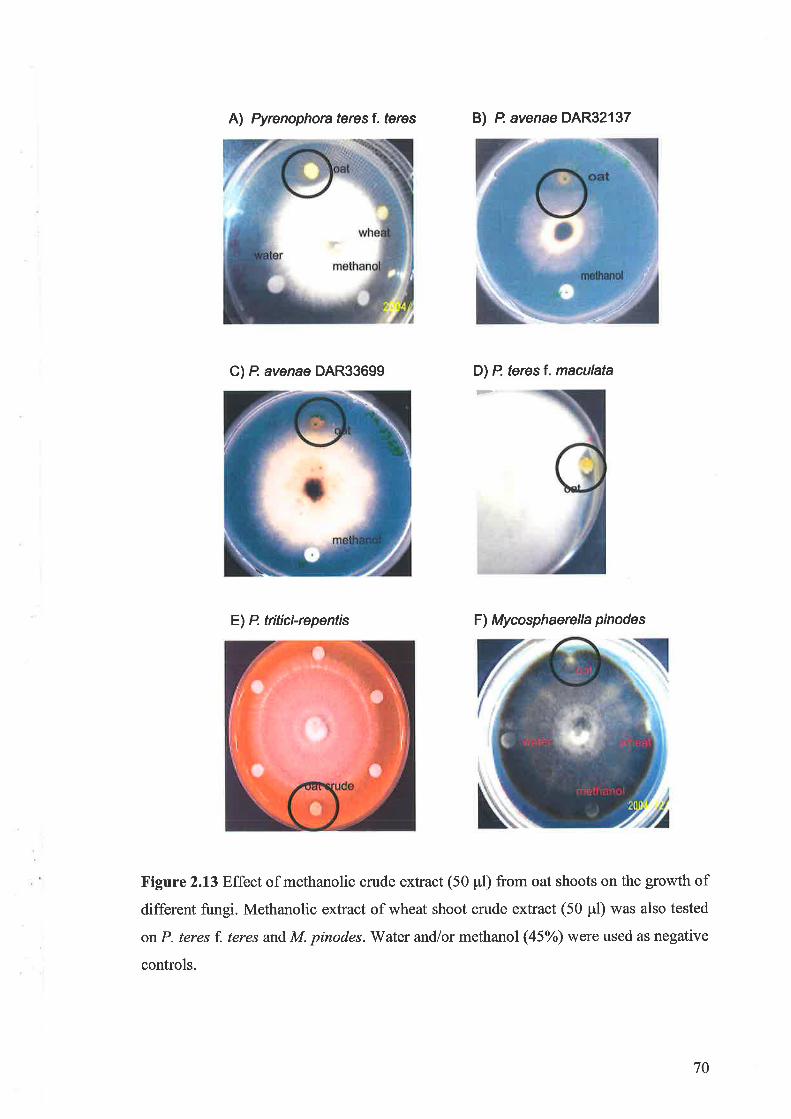
A) Pyrenophora teres f. fercs B) P avenae DAR32137
C) P avenae D4R33699 D)Pferesf.maculata
El P triticl-repentis F) Mycosphaerella pinodes
Figure 2.13 Effect of methanolic crude extract (50 frl) from oat shoots on the growth ofdifferent fungi. Methanolic extract of wheat shoot crude extract (50 pl) was also tested
on P. teres f. teres and M. pinodes. 'Water and/or methanol (45%) were used as negative
controls.
70
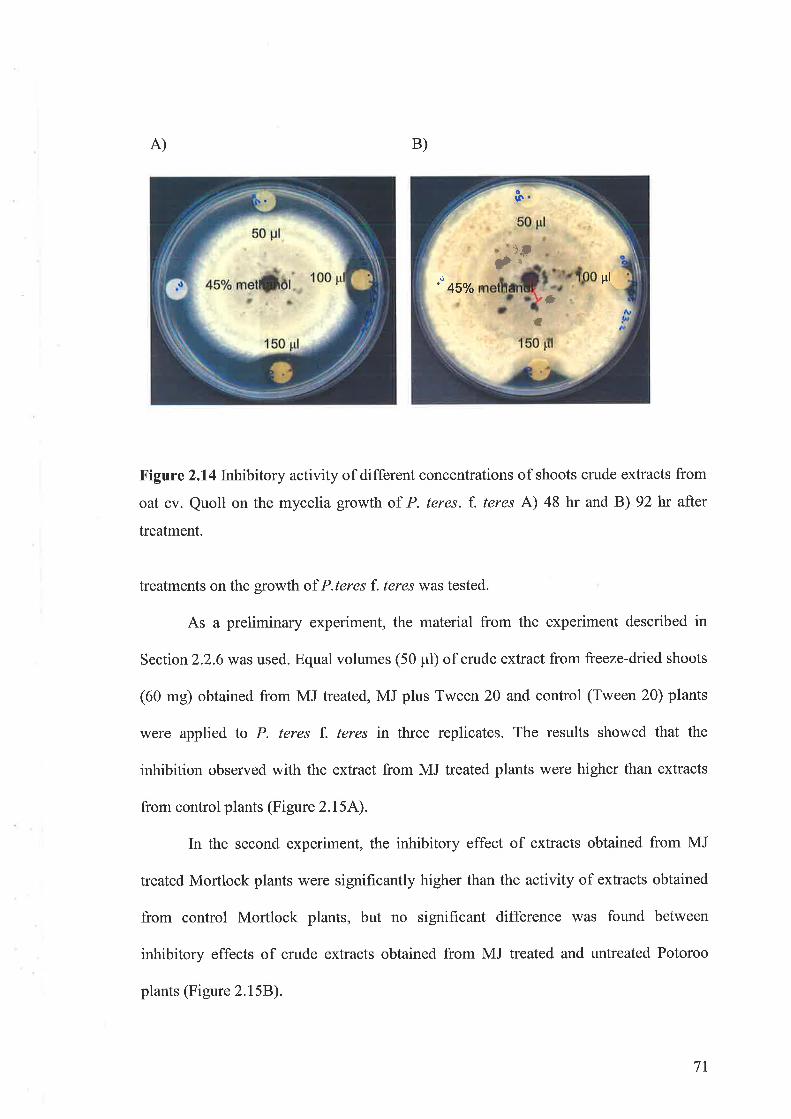
B)A)
Figure 2.l4lt'firibitory activity of different concentrations of shoots crude extracts from
oat cv. Quoll on the mycelia growth of P. þres. f. teres A) 48 hr and B) 92 hr after
treatment.
treatments on the growth of PJeres f. tures was tested.
As a preliminary experiment, the material from the experiment described in
Section 2.2.6 was used. Equal volumes (50 pl) of crude extract from freeze-dried shoots
(60 mg) obtained from MJ treated, MJ plus Tween 20 and control (Tween 20) plants
were applied to P. teres f. teres in three replicates. The results showed that the
inhibition observed with the extract from MJ treated plants were higher than extracts
from control plants (Figure 2.I5A).
In the second experiment, the inhibitory effect of extracts obtained from MJ
treated Mortlock plants were significantly higher than the activity of extracts obtained
from control Mortlock plants, but no significant difference was found between
inhibitory effects of crude extracts obtained from MJ treated and untreated Potoroo
plants (Figure 2.158).
' 450./0d pl
t :i¡l
a
otf\
G
¡
150 ür
5Q pt,
7l
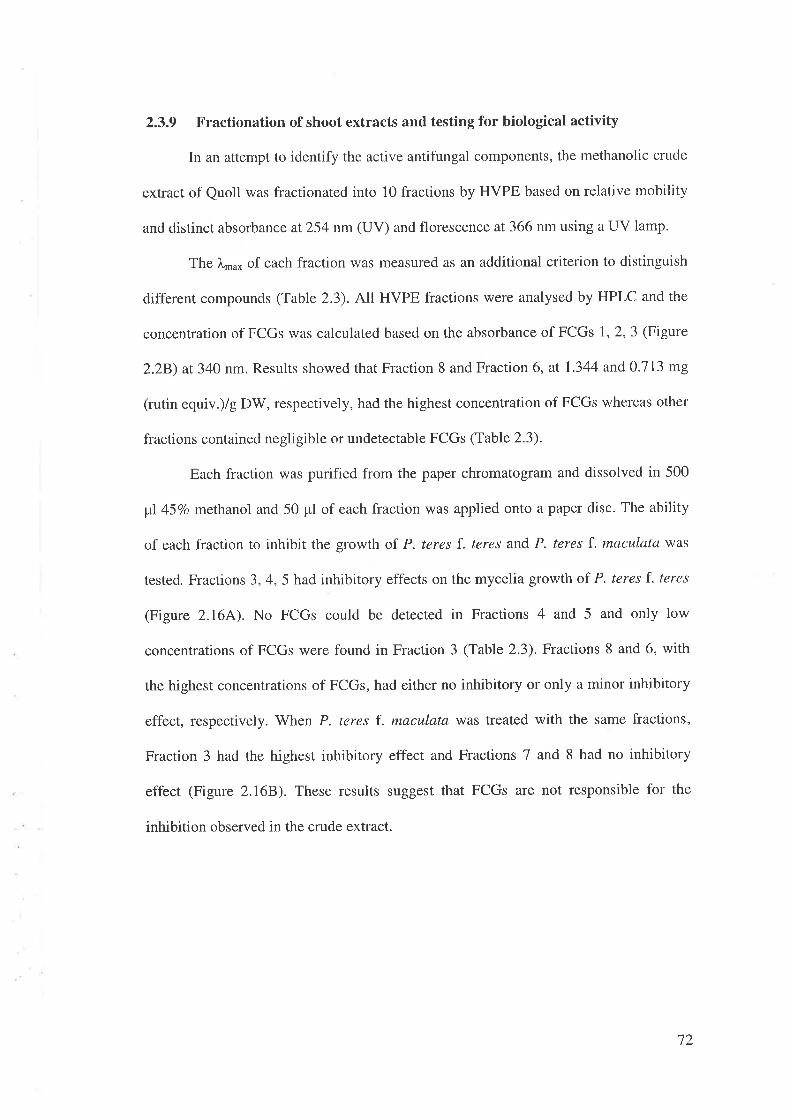
2.3.9 Fractionation of shoot extracts and testing for biological activity
In an attempt to identify the active antifungal components, the methanolic crude
extract of Quoll was fractionated into 10 fractions by HVPE based on relative mobility
and distinct absorbance at254 nm (UV) and florescence at 366 nm using a UV lamp.
The À.u* of each fraction was measured as an additional criterion to distinguish
different compounds (Table 2.3). All HVPE fractions were analysed by HPLC and the
concentration of FCGs was calculated based on the absorbance of FCGs 7,2,3 (Figure
2.28) at 340 nm. Results showed that Fraction 8 and Fraction 6, at 1.344 and 0.713 mg
(rutin equiv.)/g DW, respectively, had the highest concentration of FCGs whereas other
fractions contained negligible or undetectable FCGs (Table 2.3).
Each fraction was purified from the paper chromatogram and dissolved in 500
¡i 45Vo methanol and 50 pl of each fraction was applied onto a papff disc. The ability
of each fraction to inhibit the growth of P. teres f . teres and P. teres f . maculata was
tested. Fractions 3,4,5 had inhibitory effects on the mycelia growth of P. teres f . teres
(Figure 2.16A). No FCGs could be detected in Fractions 4 and 5 and only low
concentrations of FCGs were found in Fraction 3 (Table 2.3). Fractions 8 and 6, with
the highest concentrations of FCGs, had either no inhibitory or only a minor inhibitory
effect, respectively. When P. teres f . maculata was treated with the same fractions,
Fraction 3 had the highest inhibitory effect and Fractions 7 and 8 had no inhibitory
effect (Figure 2.168). These results suggest that FCGs are not responsible for the
inhibition observed in the crude extract.
72
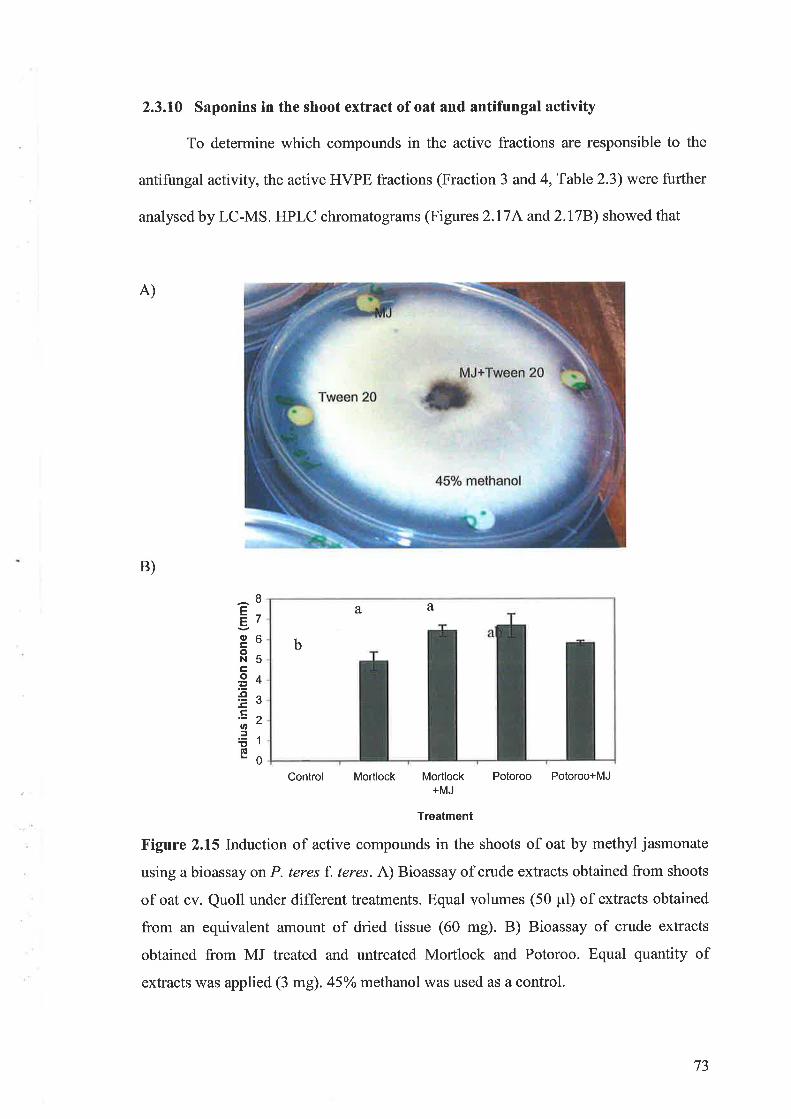
2.3.10 Saponins in the shoot extract of oat and antifungal activity
To determine which compounds in the active fractions are responsible to the
antifungal activity, the active HVPE fractions (Fraction 3 and 4,Table 2.3) were further
analysed by LC-MS. HPLC chromatograms (Figur es 2.17 A and 2.178) showed that
A)
B)
Control Mortlock Mortlock Potoroo Potoroo+MJ
Treatment
Figure 2.15 Induction of active compounds in the shoots of oat by methyl jasmonate
using a bioassay on P. teres f. teres. A) Bioassay of crude extracts obtained from shoots
of oat cv. Quoll under different treatments. Equal volumes (50 pl) of extracts obtained
from an equivalent amount of dried tissue (60 mg). B) Bioassay of crude extracts
obtained from MJ treated and untreated Mortlock and Potoroo. Equal quantity ofextracts was applied (3 mg). 45o/omethanol was used as a control.
EE(,coNcoE.Ett,.=!tg
I7
6
5
4
3
2
1
0
+MJ
b
L a
73
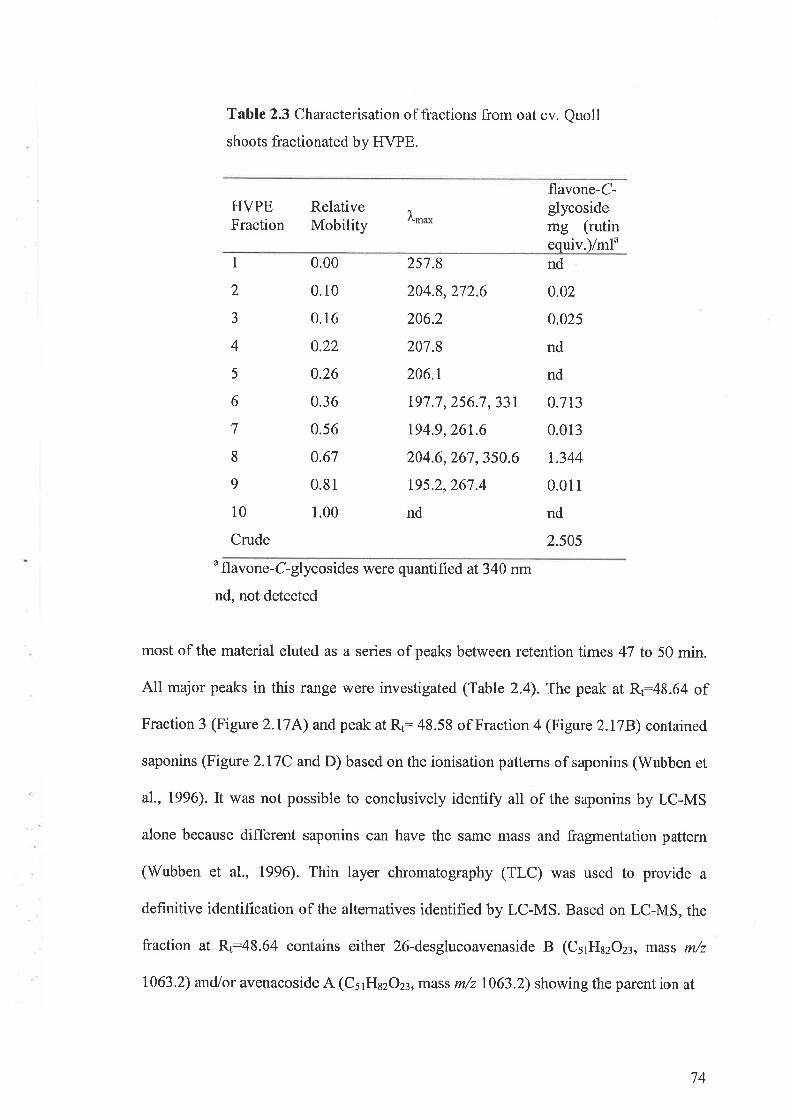
Table 2.3 Characterisation of fractions from oat cv. Quollshoots fractionated by HVPE.
HVPEFraction
RelativeMobility f,-u*
flavone-C-glycosidemg (rutinequiv.)/mlu
I
2
aJ
4
5
6
7
8
9
10
Crude
0.00
0.10
0.16
0.22
0.26
0.36
0.56
0.67
0.81
1.00
nd
0.02
0.025
nd
nd
0.713
0.013
1.344
0.011
nd
2.505
257.8
204.8,272.6
206.2
207.8
206.r
r97 .7,256.7 ,331t94.9,26t.6
204.6,267,350.6
r95.2,267.4
nd
'flavone-C-glycosides were quantified at 340 nm
nd, not detected
most of the material eluted as a series of peaks between retention times 47 to 50 min.
All major peaks in this range were investigated (Table 2.4). The peak at R¡:48.64 of
Fraction 3 (Figure 2.17A) and peak at R1:48.58 of Fraction 4 (Figure 2.178) contained
saponins (Figure 2.17C and D) based on the ionisation patterns of saponins (Wubben et
a1., 199ó). It was not possible to conclusively identify all of the saponins by LC-MS
alone because different saponins can have the same rnass and fragmentation pattern
(Wubben et al., 1996). Thin layer chromatography (TLC) was used to provide a
definitive identification of the alternatives identified by LC-MS. Based on LC-MS, the
fraction at R,:43.64 contains either 26-desglucoavenaside B (C51H¡2O1, rrràss m/z
1063.2) and/or avenacoside A (C51H32O23, mâss m/z 1063.2) showing the parent ion at
14
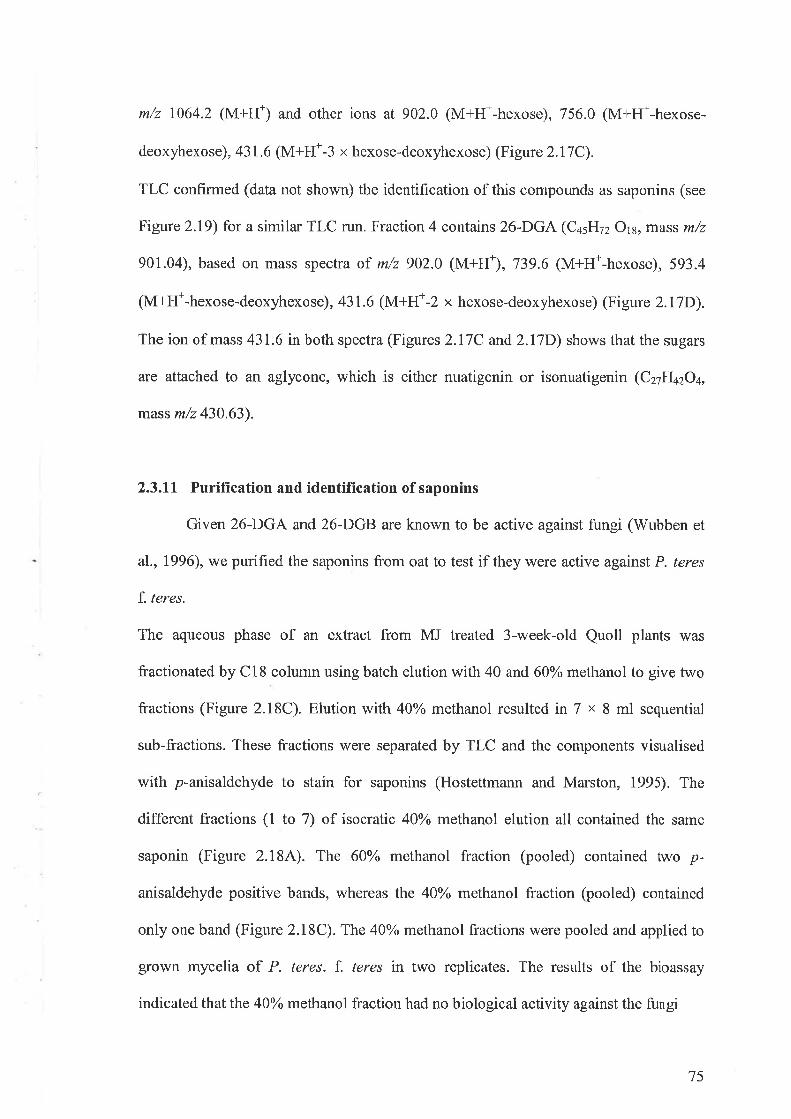
m/z 1064.2 (M+H) and other ions at 902.0 (M+H+-hexose), 75ó.0 (M+H+-hexose-
deoxyhexose), 431.6 (M+H+-3 x hexose-deoxyhexose) (Figure 2.17C).
TLC conhrmed (data not shown) the identification of thìs compounds as saponins (see
Figure 2.19) for a similar TLC run. Fraction 4 contains 26-DGA (Cqslúz Oß,mass m/z
901.04), based on mass spectra of m/z 902.0 (M+H*), 739.6 (M+H+-hexose), 593.4
(M+H*-hexose-deoxyhexose), 431.6 (M+H+-2 x hexose-deoxyhexose) (Figure 2.17D).
The ion of mass 431.6 in both spectra (Figures 2.I7C and 2.17D) shows that the sugars
are attached to an aglycone, which is either nuatigenin or isonuatigenin (C27Ha2Oa,
mass m/z 430.63).
2.3.11 Purifïcation and identification of saponins
Given 26-DGA and 26-DGB are known to be active against fungi (Wubben et
aI.,1996), we purified the saponins from oat to test if they were active against P. teres
f. teres.
The aqueous phase of an extract from MJ treated 3-week-old Quoll plants was
fractionated by Cl8 colurnn using batch elution with 40 and 600/o methanol to give two
fractions (Figure 2.18C). Elution with 40% methanol resulted in 7 x 8 ml sequential
sub-fractions. These fractions were separated by TLC and the components visualised
with p-anisaldehyde to stain for saponins (Hostettmann and Marston, 1995). The
different fractions (1 to 7) of isocratic 40o/o methanol elution all contained the same
saponin (Figure 2.184). The 60% methanol fraction (pooled) contained two p-
anisaldehyde positive bands, whereas the 40Yo methanol fraction (pooled) contained
only one band (Figure 2.18C). The 40o/o methanol fractions were pooled and applied to
grown mycelia of P. teres. f. teres in two replicates. The results of the bioassay
indicated that the 40Yo methanol fraction had no biological activity against the fungi
75
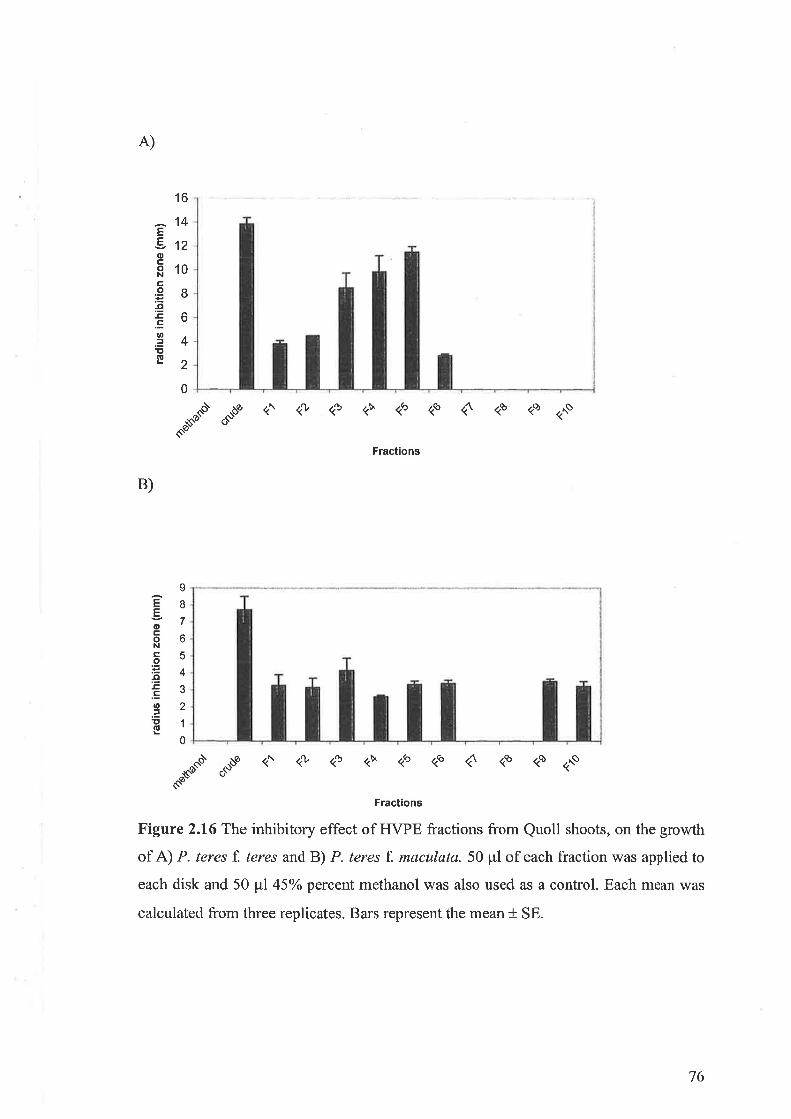
A)
EEocoNco'5E.sat
õg
16
14
12
10
Io
4
2
0
""-a "". (\ * € (ù '? (6 Ó <s (q (no
Fractions
B)
EE(l,coNo
E.8,.Ett,JEg
9
B
7
6
5
4
3
2
1
0
.<,ê -"" (\ ,& e (u ,þ (b ó (s (s o.oas-
Fractions
Figure 2.16 The inhibitory effect of TIVPE fractions from Quoll shoots, on the growth
of A) P- teres f. teres and B) P. teres f. maculata. 50 ¡rl of each fraction was applied to
each disk and 50 ¡t|45% percent methanol was also used as a control. Each mean was
calculatecl from three replicates. Bars represent the mean + SE.
76
(Figure 2.188), The single band of the 4OYo methanol fraction is avenacoside B
(C57He2O2s, mass m/z 1225.3) basecl on LC-MS and publishecl ionisation data for
desglucoavenacoside B (Wubben et a1., 1996) with the presence of one extra glucose.
The MS (negative mode) of this compound indicated a strong ion at m/z 1224.2 (M-H*)
(Fignre 2.18D). The ionisation pattern in positive mode of this compound was'. m/z
1226.2 (M+H*), 1063.8 (M+H*-hexose), 901.8 (M+H+-2xhexose), 139.6 (M+H+-
3xhexose), 593.8 (M+H+-3xhexose-deoxyhexose), 431.0 (M+H+-4xhexose-
deoxyhexose) and 413.2 (M+H+-4xhexose-deoxyhexose-water) as shown in Figure
2.188. The minor band elutedby 60% methanol (Figure 2.18C) was not of sufficient
purity for identification. However, this band was later isolated and fractionated from
the butanol phase as follows.
The butanol phase from the shoot extract was further fractionated by C18 RP
and the resulting 60% methanol fraction was further purified using C18 silica gel and
resulted in more than 30 fractions. Fraction 11 to 30 containedp-anisaldehyde positive
compounds with R¡values of 0.22,0.31,0.40 and 0.50 (Figure 2.19 ^).
The elution
profiles of the different saponins overlap. The fractions containing only a single
saponin (based on R¡) were pooled. For example, Compound 1 (R¡ 0.50) eluted in
Fractions 7l-12, Compound 2 (R, 0.40) eluted in Fractions 14-15, Compound 3 (Rr
0.31) eluted in Fractions 17, 18 and 19 (Figure 2.I9A). Subsequent TLC separation of
the TLC purified compounds showed each fraction contained only a single cornpound
(clata not shown).
The iclentity of each of the purified saponins was preclictecl based on published
TLC profiles of saponins (Wubben et al., 1996) and confirmed by LC-MS. The MS in
negative mocle of Compound I revealed a single major ion at m/z 900.0 (M-H), but
there were no apparent fragmentations of this ion (Figure 2.198).In contrast, theMS in
77
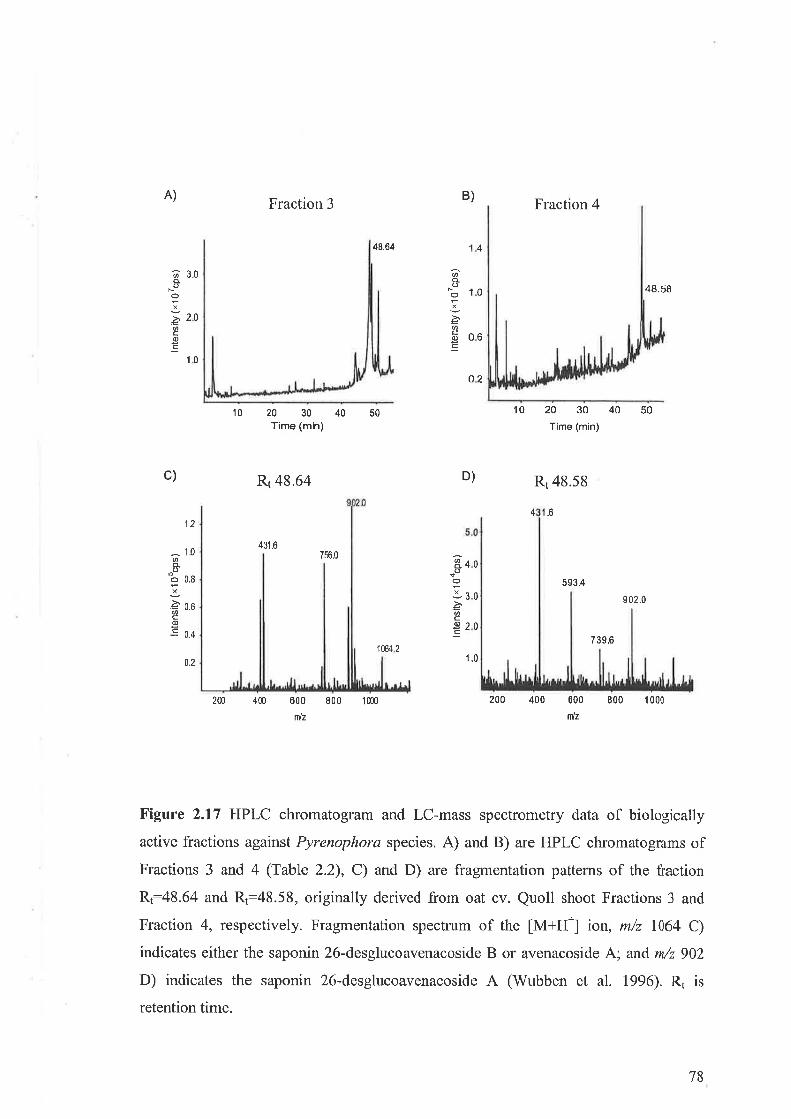
A)
c)
B)
øoÈox
.àac0)c
3.0
't0
2m 4m
Fraction 3
20 30Time (mh)
Rr 48.64
43't6756.0
600
¡rlz
40 50
800 1m
Fraction 4
20 30
Time (min)
.o
593.4
40 50
902.0
48.64
1æ42
Øo-oo
'ØcoE
14
10
06
o2
48.58
20
l0
t0
D) Rr 48.58
4
04
30
2 0
ØoooX
,õcoc
12
^ 10aoo'Ë o.ax
à o.ooco=- 0.4
0.2
739.6
1.0
200 400 800 r 000600
nlz
Figure 2.17 HPLC chromatogram and LC-rnass spectrometry data of biologically
active fractions against Pyrenophor¿z species. A) and B) are HPLC chromatogralns ofFractions 3 and 4 (Table 2.2), C) and D) are fragmentation patterns of the fiaction
Rt:48.64 and R1:48.58, originally derived from oat cv. Quoll shoot Fractions 3 and
Fraction 4, respectively. Fragmentation spectmm of the [M+H+] ion, m/z 1064 C)
indicates either the saponin 26-desglucoavenacoside B or avenacoside A; ancl n/z 902
D) inclicates the saponin 26-desglucoavenacoside A (Wubben et al. 1996). R¡ isretention time.
78
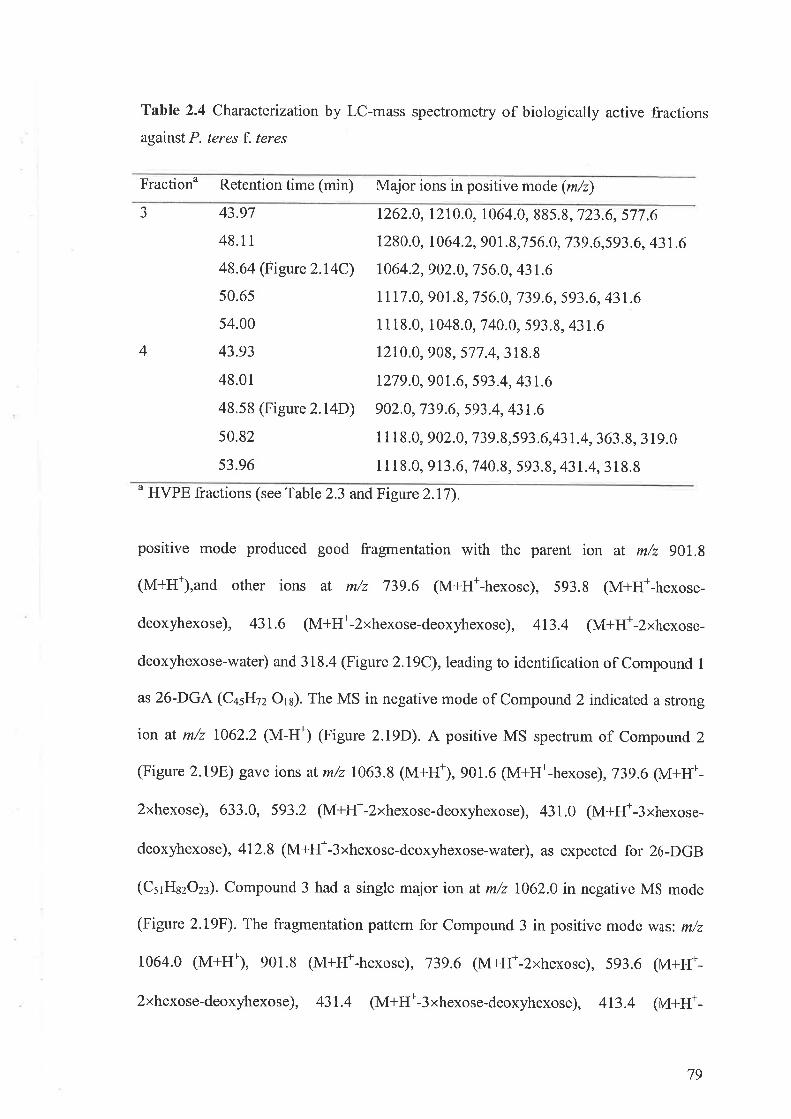
Table 2.4 Characterization by LC-mass spectrometry of biologically active fractions
against P. teres f. teres
Fraction" Retention time (min) Major ions in positive mode (m/z)
J
4
43.97
48.11
48.64 (Figure 2.14C)
50.65
54.00
43.93
48.01
48.58 (Figure 2.14D)
50.82
53.96
7262.0, 1210.0, I 064.0, gg5. g,'723.6, 577 .6
1280.0, 1064.2, 901.9,756.0, 739.6,593.6, 43L61064.2, 902.0, 7 56.0, 43 1.6
7117.0, 901.9, 7 56.0, 739.6, 593.6, 431.6
1 1 18.0, 1049.0, 7 40.0, 593.9, 431.6
1210.0, g0g, 577.4, 3I g.g
r27 9.0, 90r.6, 593.4, 43 1.6
902.0, 739.6, 593.4, 431.6
1 1 18.0, 902.0, 739.9,593.6,431.4,363.9, 319.0
1 1 I 8.0, 913.6, 7 40.9, 593.9, 431.4, 3 1 g.ga HVPE fractions (see Table 2.3 andFigure 2.17).
positive mode produced good fragmentation with the parent ion at m/z 901.8
(M+H*),and other ions at m/z 739.6 (M+H+-hexose), 593.8 (M+H+-hexose-
deoxyhexose), 431.6 (M+H+-2xhexose-deoxyhexose), 413.4 (M+H*-2xhexose-
deoxyhexose-water) and 318.4 (Figure 2.19c),leading to identifrcation of Compound I
as 26-DGA (C+sHtz Ors). The MS in negative mode of Compound 2 indicated a strong
ion at m/z 7062.2 (M-H*) (Figure 219D). A positive MS spectrum of Compound 2
(Figure 2.198) gave ions at m/z 1063.8 (M+H), 901.6 (M+H+-hexose), 739.6 (M+H+-
2xhexose), 633.0, 593.2 (M+Ff-2xhexose-deoxyhexose), 431.0 (M+H+-3xhexose-
deoxyhexose), 412.8 (M+H+-3xhexose-deoxyhexose-water), as expected for 26-DGB
(C51Hg2O23). Compound 3 had a single major ion at m/z 1062.0 in negative MS mode
(Figure 2.19F). The fragmentation pattem for Compound 3 in positive mode wus: m/z
1064.0 (M+H+), 901.8 (M*H+-hexose), 739.6 (M+H*-2xhexose), 593.6 (M+H*-
2xhexose-deoxyhexose), 431.4 (M+H+-3xhexose-deoxyhexose), 413.4 (M+H*-
79
3xhexose-deoxyhexose-water) (Figure 2.IgG). The ionisation pattem confirms that the
Compound 3 is avenacoside A (C51Hg2O23). Cornpound 4 (R¡ 0.22) was identified in the
aqu€olls phase as avenacoside B (Figure 2.184, C, D, E).
2.3.12 Bioassay of saponins
When the aqueous phase extract containing only two of the four saponins
(avenacoside A and avenacoside B) was used at different concentrations against P.
þres f. teres, no inhibition \Mas observed (Figure 220A) whereas the crude extract
showed inhibition. The four purified saponins that have been visualised as single band
byTLC (Figure 2.208) were also tested in abioassay (Figure 2.20C).Initially,50 and
250 ¡tg of each of the purified saponins were used in separate experiments and minor
inhibition of mycelium growth was observed for 26-DGB and 26-DGA (data not
shown). When the bioassay was repeated with 400 ¡rg of each saponin it was observed
that 26-DGB had a greater inhibitory activity than 26-DGA, but the crude extract had
even higher activity (Figure 2.20C). The minor inhibition observed with avenacoside A
and B was not cornplete and mycelia were present throughout the inhibition zone,
whereas the zone around 26-DGA has much less mycelia.
In summary, 26-DGA and 26-DGB are active compounds against P.teres f.
teres and this is consistent with other reports of activity against other fungi (Wubben et
al. 1996).
80
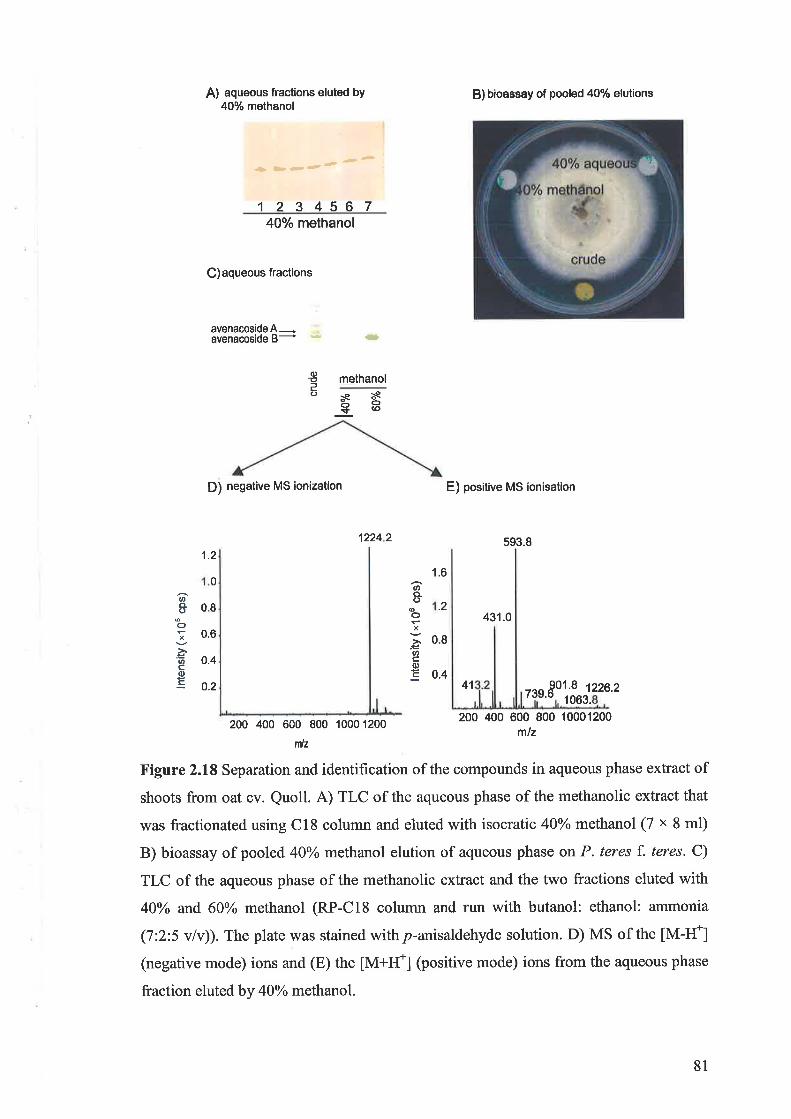
C)aqueous fractions
avenacoside Aavenacoside B
A) aqueous fraclions eluted by40% methanol
-lb-t---1
123456740% methanol
B) bioassay of pooled 40% elutions
E) positive MS ionisation
593.8
431.0
41 '1.8 nza.z1063.
200 400 600 800 10001200mlz
rD
o,EPo
methanol
D) negative MS ionization
200 400 600 800 10001200
rnlz
so(oso$
1224 2
1.2
I .6
.2
08
0.4
(to.(,ox
,-{,
c(t,c
ato.()
oX
ocoe.
0
08
0.6
0.4
0.2 73s.80
Figure 2.18 Separation and identification of the compounds in aqueous phase extract ofshoots from oat cv. Quoll. A) TLC of the aqueous phase of the methanolic extract that
was fractionated using C18 column and eluted with isocratic 40%o methanol (7 x 8 ml)
B) bioassay of pooled 40olo methanol elution of aqueous phase on P. teres f. teres. C)
TLC of the aqueous phase of the methanolic extract and the two fractions eluted with
40o/o and 600/o methanol (RP-C18 column and run with butanol: ethanol: ammonia
(7:2:5 v/Ð). The plate was stained withp-anisaldehyde solution. D) MS of the tM-H.l(negative mode) ions and (E) the tM+Ifl þositive mode) ions from the aqueous phase
fraction eluted by 40% methanol.
81
Figure 2.19 Separation and identification of the compounds in butanol phase after
extraction of compounds from shoots of oat cv. Quoll. A) TLC analysis of saponins
from the C18 (silica gel) separation of the compounds from the butanol phase. The
order of elution of the individual saponins is 26-DGA, 26-DGB, avenacoside A,avenacoside B based on previous studies (Wubben et al., 1996). The plate was stained
with p-anisaldehyde solution and baked at 130oC. The fractions that contained each
single saponin wete pooled for further analysis (as underlined). cr is crude extract. MS
of saponin at Rr:0.50 (purified from TLC Fractions 11 and 12)innegativeB) and
positive mode C), at R¡: 0.40 of Fractions 14 and 15 in negative D) and positive mode
E) and at R¡ : 0.3 1 of Fractions 17, I 8 and I 9 in negative (F) and positive rnode G).
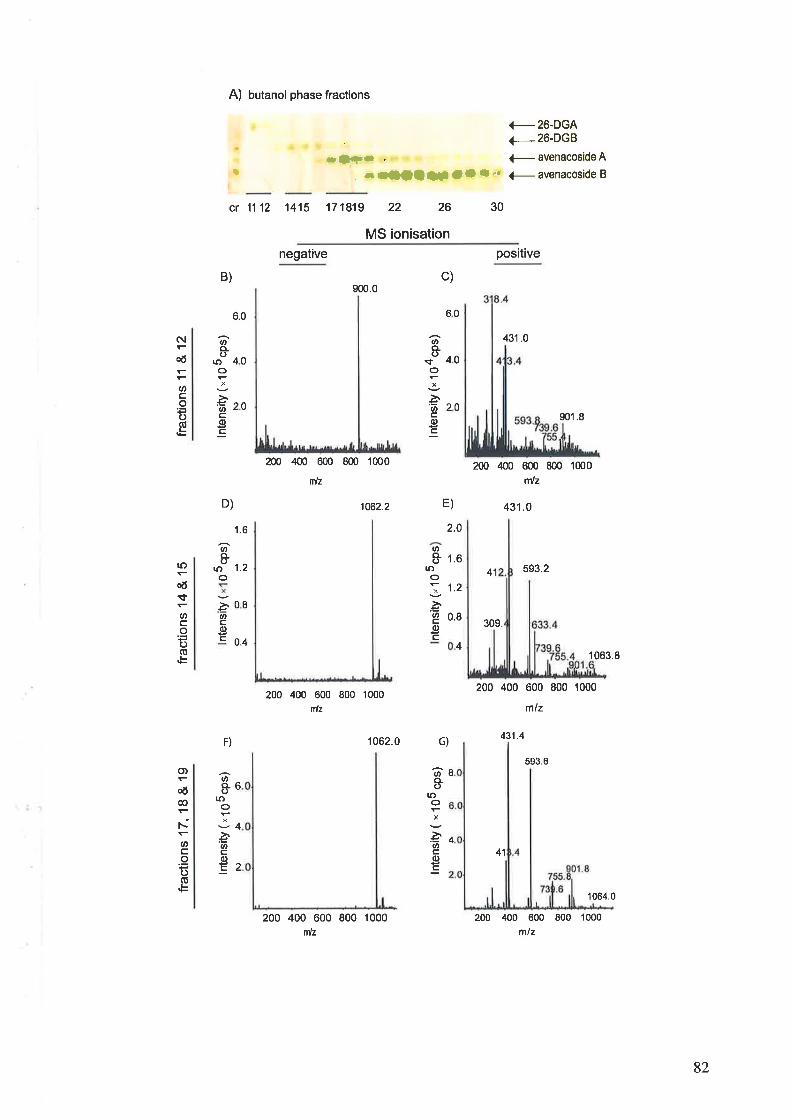
fract
ions
11
&'1
2
oln
tens
ity ('
105ç
s)N
òoo
qt
mln
tens
itY (
't04c
ps)
Nò
ooO
J oo
o,
cps)
50
lnte
nsity
( ,1
05 ç
s)
fract
ions
14
& 1
5
o @
È
(ns
tynt
eo L
fract
ions
17,
18
& 1
9
lnte
nsity
("lO
5cps
)1
l\)
o 0¡ = o !, J 0¡ ch o 0¡ o * o J U'
lr() À
J 5 ql { @ (o
cn Ol\)
= 6' o) =. 9N ¿o)
o (o qt * o
@ I b
9) o
N I À IÉ
Õ I o IË ßE N
O
(¡, o
! o 9.. =, o
À q) b
I bo
N I 5 o (fr
Cf)
e-a æ I I o
ào)
N o o 5 o oÉ
8 o o o o o o o
N o o À o-o { No)
o o (Þ o o o o o
I r!l I I a I I I I T 11
11$
sr
lsN
)I
I üö
P P
6)6
)ö
ö @
>ää @
>
o o) N o 6ì
s (¡) b
1ù ocp
s
ô(,1
0 5
- À,
('r (0 st tus
nsity 9 @ (, o (o
nte
àcÞ
N o oè5 @
o-o À
lo)
NO
c¡ o o o o o
q @ s, o
À
N o o à o o3 ùg
o @ o o o o oo C
D s, æ
o o 5 o
oo N.)
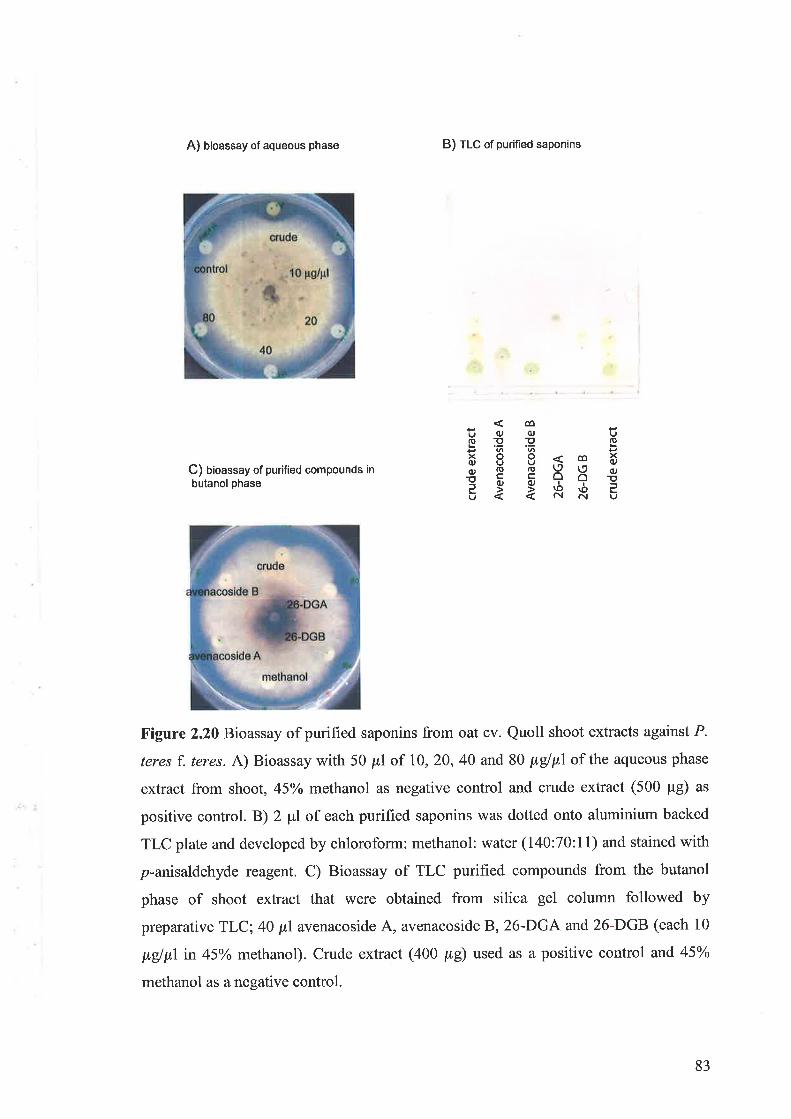
A) bioassay of aqueous phase B) TLC of purified saponins
C) bioassay of purified compounds inbutanol phase
Figure 2.20 Bioassay of purified saponins from oat cv. Quoll shoot extracts against P.
þres f. þres. A) Bioassay with 50 ¡r,1 of 10, 20, 40 and 80 þglpl of the aqueous phase
extract from shoot, 45o/o methanol as negative control and crude extract (500 pg) as
positive control. B) 2 ¡r1 of each purified saponins was dotted onto aluminium backed
TLC plate and developed by chloroform: methanol: water (140:70:11) and stained with
p-anisaldehyde reagent. C) Bioassay of TLC purified compounds from the butanol
phase of shoot extract that were obtained from silica gel column followed by
preparative TLC;40 ¡.tl avenacoside A, avenacoside B, 26-DGA and 26-DGB (each 10
þglLLl in 45o/o methanol). Crude extract (a00 p,g) used as a positive control and 45Yo
methanol as a negative control.
üuoUro-oEAÈ.6'6Þõ I I_<€ q E XB €=crot-î3 ë ë RR t
83
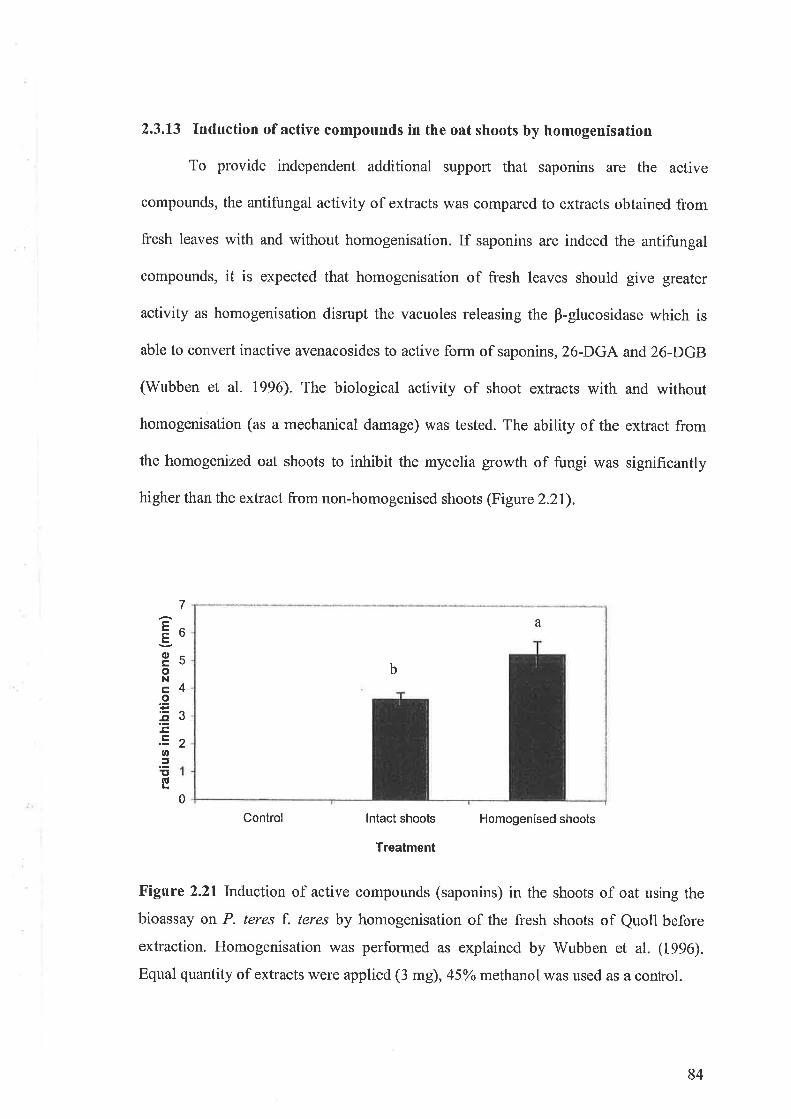
2.3.13 Induction of active compounds in the oat shoots by homogenisation
To provide independent additional support that saponins are the active
compounds, the antifungal activity of extracts was compared to extracts obtained from
fresh leaves with and without homogenisation. If saponins are indeed the antifungal
compounds, it is expected that homogenisation of fresh leaves should give greater
activity as homogenisation disrupt the vacuoles releasing the p-glucosidase which is
able to convert inactive avenacosides to active form of saponins, 26-DGA and 26-DGB
(Wubben et al. 1996). The biological activity of shoot extracts with and without
homogenisation (as a mechanical damage) was tested. The ability of the extract from
the homogenized oat shoots to inhibit the mycelia growth of fungi was significantly
higher than the extract from non-homogenised shoots (Figure 2.21).
Control lntact shoots
Treatment
Homogenised shoots
Figure 2.21 Induction of active compounds (saponins) in the shoots of oat using the
bioassay on P. teres f. teres by homogenisation of the fresh shoots of Quoll before
extraction. Homogenisation was performed as explained by Wubben et al. (1996).
Equal quantity of extracts were applied (3 mg), 45o/o methanol was used as a control.
EE(¡,troNcoþL'î,.=õGI
7
6
5
4
3
2
0
b
a
84
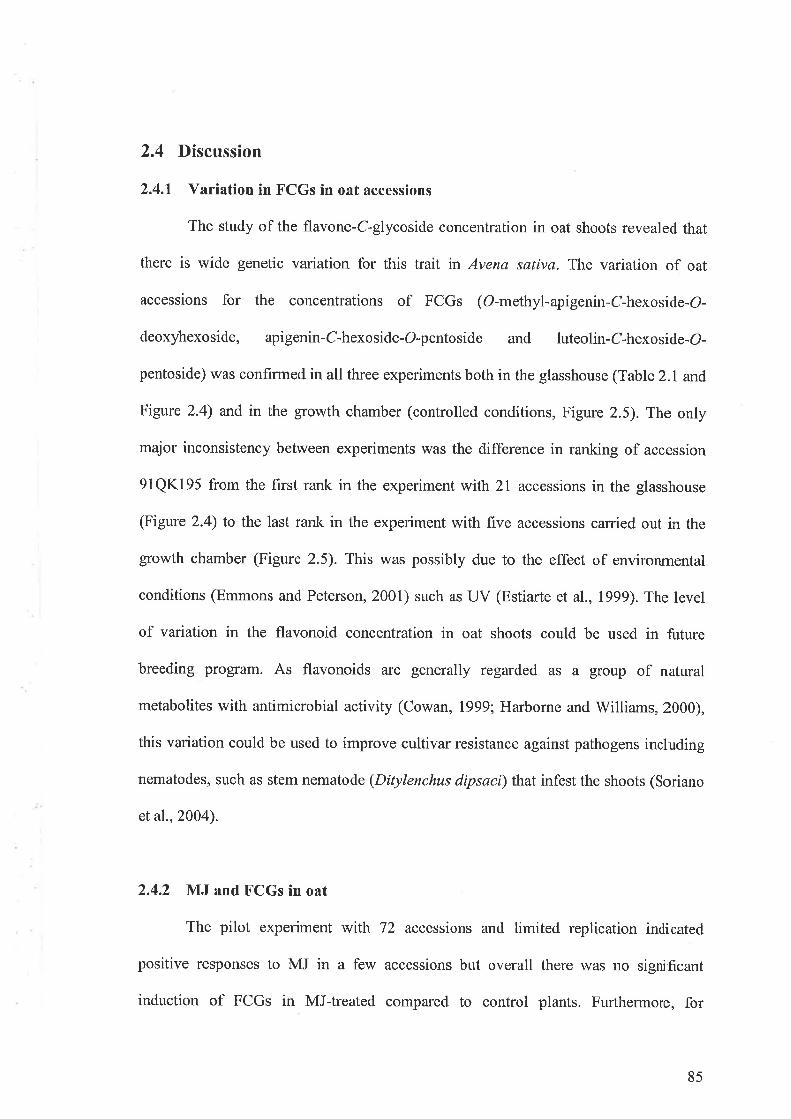
2.4 Discussion
2.4.1 Variation in FCGs in oat accessions
The sttrdy of the flavone-C-glycoside concentration in oat shoots revealed that
there is wide genetic variation for this trait in Avena sativa. The variation of oat
accessions for the concentrations of FCGs (O-methyl-apigenin-C-hexoside-O-
deoxyhexoside, apigenin-C-hexoside-O-pentoside and luteolin-C-hexoside-O-
pentoside) was confirmed in all three experiments both in the glasshouse (Table 2.1 and,
Figure 2.4) and in the growth chamber (controlled conditions, Figure 2.5). The only
major inconsistency between experiments was the difference in ranking of accession
91QK195 from the first rank in the experiment with 21 accessions in the glasshouse
(Figure 2.4) fo the last rank in the experiment with five accessions carried out in the
growth chamber (Figure 2.5). This was possibly due to the effect of environmental
conditions (Emmons and Peterson,200l) such as UV (Estiarte et al., 1999). The level
of variation in the flavonoid concentration in oat shoots could be used in future
breeding program. As flavonoids are generally regarded as a group of natural
metabolites with antimicrobial activity (Cowan, 1999; Harborne and Williams, 2000),
this variation could be used to improve cultivar resistance against pathogens including
nematodes, such as stem nematode (Ditylenchus dipsaci) that infest the shoots (Soriano
et a1.,2004).
2.4.2 MJ and FCGs in oat
The pilot experiment with 72 accessions and lirnited replication indicated
positive responses to MJ in a few accessions but overall there \ryas no significant
induction of FCGs in MJ-treated compared to control plants. Furthermore, for
85

accessions where MJ induction was seen, it was not reproclucible in subsequent
experiments. For example, the concentration of FCGs in Potoroo and Quoll increased
by.tp to 20 and 160/o, respectively, after MJ treatment in the experiment with only two
replicates (Figure 2.4), but in the growth chamber experiment with three replicates,
there were no significant differences in FCG concentrations between MJ treated and
control plants for these two cultivars (Figure 2.5).
The absence of MJ induction is in contrast to the significant induction of FCGs
by MJ previously reported (Soriano et al., 2004). One explanation is that MJ induction
is unreliable and only occurs under particular circumstances. The possibility that
technical issues r'vere responsible for the differences between our results and Soriano et
al. (200a) was ruled and the same cultivar (Quoll) was used in all experiments to test
effectiveness of MJ application. The results presented here represent multiple
independent experiments with several replications (Figures 2.4,2.5,2.6, 2.7 and 2.8).
Three different methods of MJ application were tested and none of the methods
increased FCGs concentration (Figure 2.6). One possibility was that MJ was not getting
to the plants. Therefore, the effectiveness of Tween 20 as a surfactant was studied. No
significant difference was found between the concentration of FCGs in the shoots of oat
treated by MJ and MJ plus Tween 20 (Figure 2.7) and neither treatment had a
significant affect on the induction of FCGs in oat shoots. It was confirmed that the MJ
applied to oat plants was biologically active, based on the expression of AsPRS (Figure
2.ll).In this experiment, it was shown that oat PrR5 gene is induced in roots by MJ as
observed for other monocots (Schweizer et al., 1997) and dicots (Xu et al., 1994; Hu et
al.,2003).
86
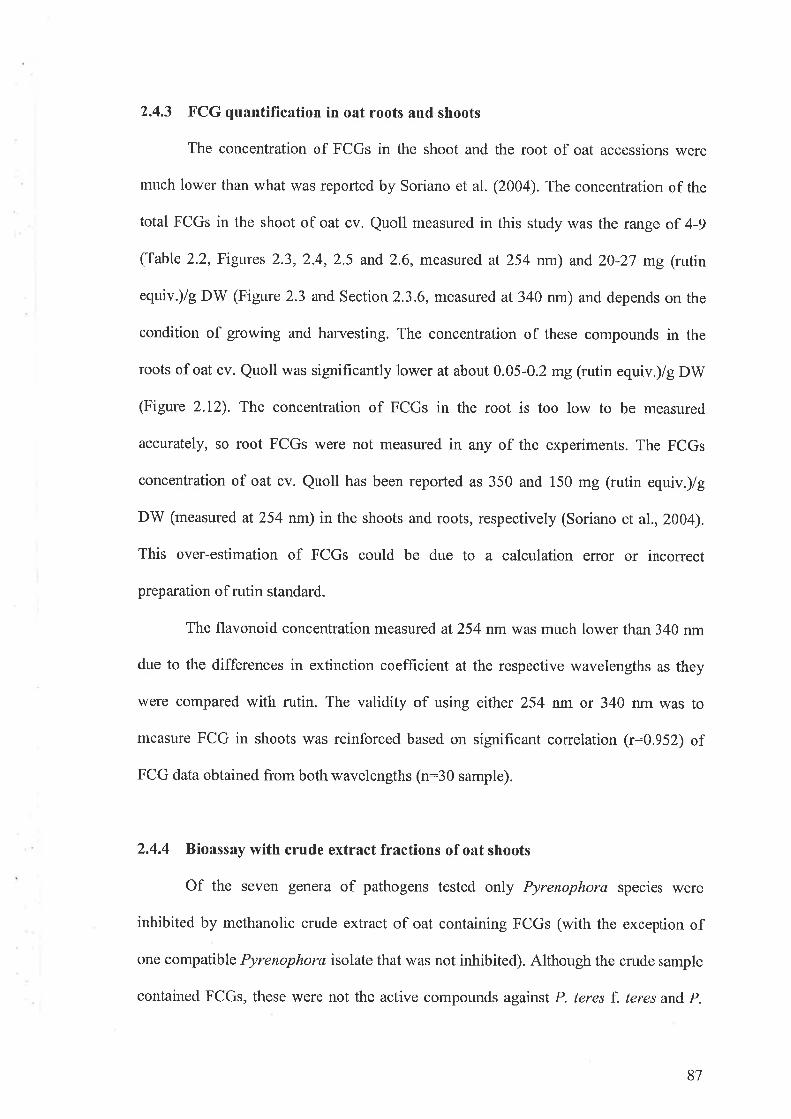
2.4.3 FCG quantification in oat roots and shoots
The concentration of FCGs in the shoot and the root of oat accessions were
rnuch lower than what was reported by Soriano et al. (2004). The concentration of the
total FCGs in the shoot of oat cv. Quoll measured in this study was the range of 4-9
(Table 2.2, Figures 2.3, 2.4, 2.5 and 2.6, measured at 254 nm) and 20-27 mg (rutin
equiv.)/g D'W (Figure 2.3 and Section 2.3.6, measured at 340 nm) and clepends on the
condition of growing and harvesting. The concentration of these compounds in the
roots of oat cv. Quoll was significantly lower at about 0.05-0.2 rng (rutin equiv.)/g DW
(Figure 2.I2). The concentration of FCGs in the root is too low to be measured
accurately, so root FCGs were not measured in any of the experiments. The FCGs
concentration of oat cv. Quoll has been reported as 350 and 150 mg (rutin equiv.)/g
DW (measured at 254nm) in the shoots and roots, respectively (Soriano et al., 2004).
This over-estimation of FCGs could be due to a calculation effor or incorrect
preparation of rutin standard.
The flavonoid concentration measured at254 nm was much lower than 340 nm
due to the differences in extinction coefficient at the respective wavelengths as they
were compared with rutin. The validity of using either 254 nm or 340 nm was to
measure FCG in shoots was reinforced based on significant coruelation (r:0.952) of
FCG data obtained from both wavelengths (n:30 sample).
2.4.4 Bioassay with crude extract fractions of oat shoots
Of the seven genera of pathogens tested only Pyrenophora species were
inhibited by methanolic crude extract of oat containing FCGs (with the exception of
one compatlble Pyrenophora isolate that was not inhibited). Although the crude sample
contained FCGs, these were not the active compounds against P. teres f . teres and P.
87
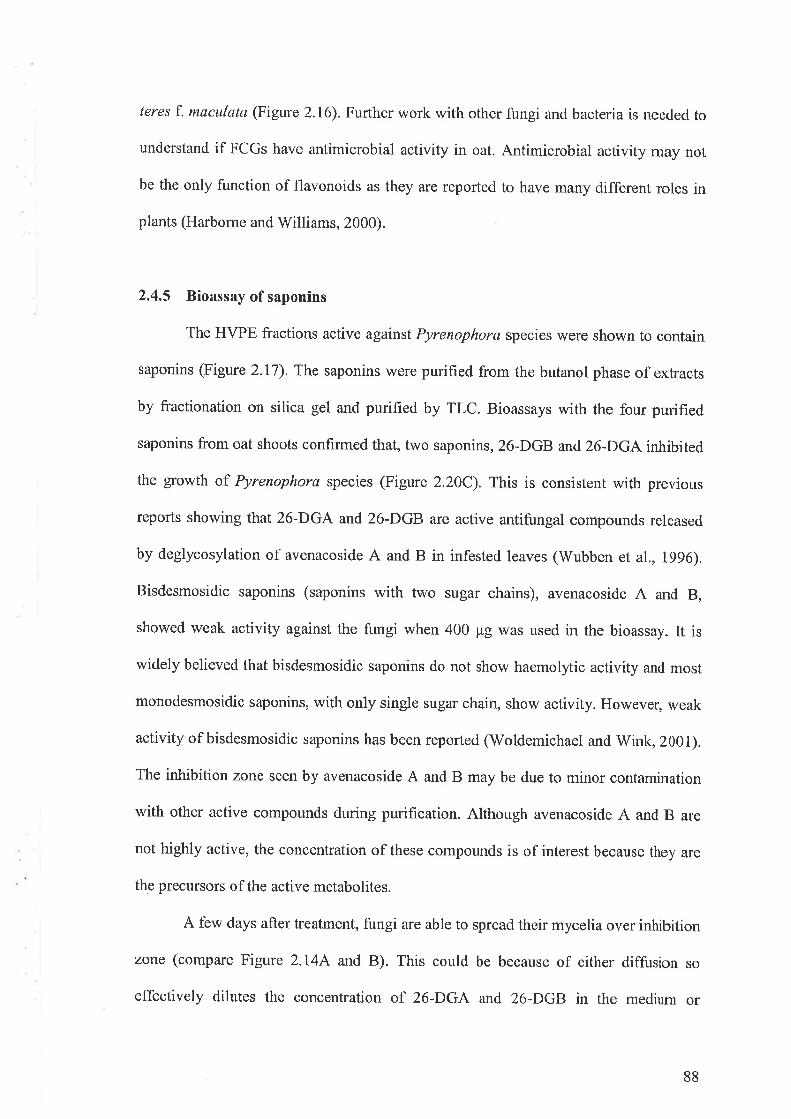
teres 1. maculata (Figure 2.16). Further work with other fungi and bacteria is needed to
understand if FCGs have antimicrobial activity in oat. Antimicrobial activity may not
be the only function of flavonoids as they are reported to have many different roles in
plants (Harbome and'Williams, 2000).
2.4.5 Bioassay of saponins
The HVPE fractions active against Pyrenophora species were shown to contain
saponins (Figure 2.17). The saponins were purified from the butanol phase of extracts
by fractionation on silica gel and purified by TLC. Bioassays with the four purified
saponins from oat shoots confirmed that, two saponins, 26-DGB and 26-DGA inhibited
the growth of Pyrenophora species (Figure 2.20C). This is consistent with previous
reports showing that 26-DGA and 26-DGB are active antifungal compounds released
by deglycosylation of avenacoside A and B in infested leaves (Wubben et al, 1996).
Bisdesmosidic saponins (saponins with two sugar chains), avenacoside A and B,
showed weak activity against the fungi when 400 pg was used in the bioassay. It is
widely believed that bisdesmosidic saponins do not show haemolytic activity and most
monodesmosidic saponins, with only single sugar chain, show activity. However, weak
activity of bisdesmosidic saponins has been reported (Woldemichael and Wink, 2001).
The inhibition zone seen by avenacoside A and B may be due to rninor contamination
with other active compounds during purification. Although avenacoside A and B are
not highly active, the concentration of these compounds is of interest because they are
the precursors of the active metabolites.
A few days after treatment, fungi are able to spread their mycelia over inhibition
zone (compare Figure 2.14A and B). This could be becanse of either diffusion so
elfectively dilutes the concentration of 26-DGA and 26-DGB in the mediurn or
88
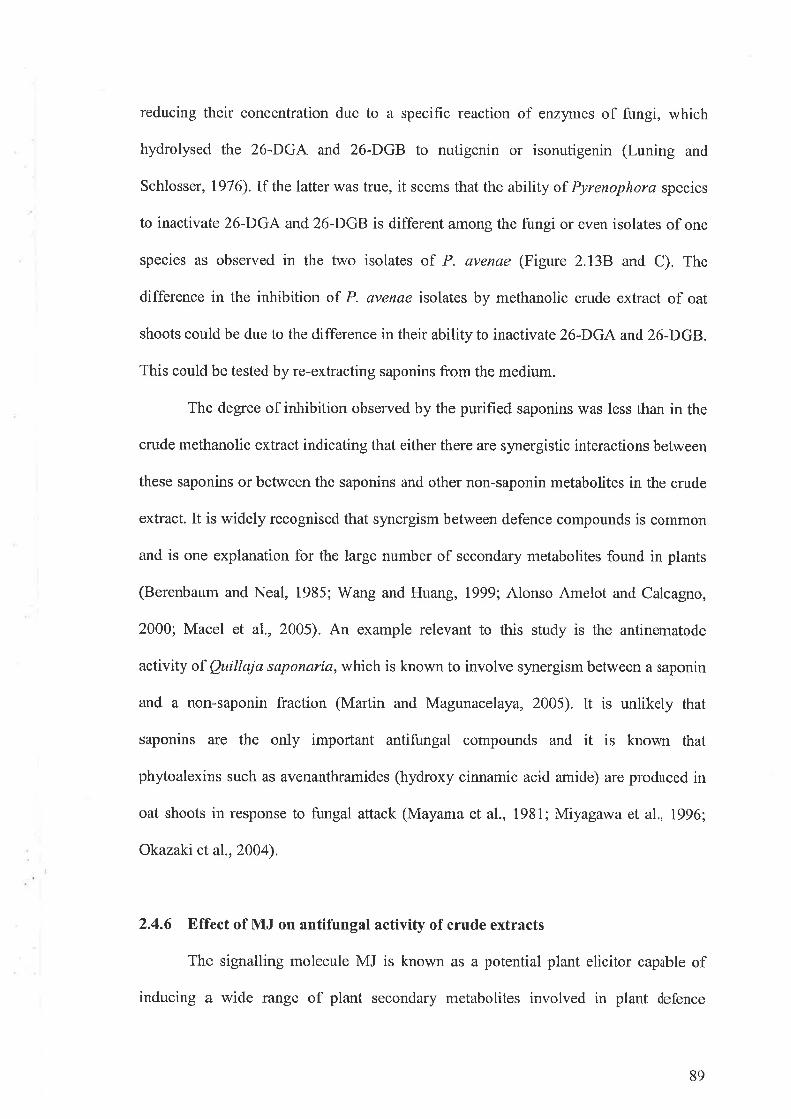
reducing their concentration due to a specific reaction of enzymes of fungi, which
hydrolysecl the 26-DGA and 26-DGB to nutigenin or isonutigenin (Luning and
Schlosser, 1976).If the latter was true, it seems that the ability of Pyrenophora species
to inactivate 26-DGA and 26-DGB is different among the fungi or even isolates of one
species as observed in the two isolates of P. avenae (Figure 2.738 and C). The
difference in the inhibition of P. avenae isolates by methanolic crude extract of oat
shoots could be due to the difference in their ability to inactivate 26-DGA and 26-DGB.
This could be tested by re-extracting saponins from the medium.
The degree of inhibition observed by the purified saponins was less than in the
crude methanolic extract indicating that either there are synergistic interactions between
these saponins or between the saponins and other non-saponin metabolites in the crude
extract. It is widely recognised that synergism between defence compounds is common
and is one explanation for the large number of secondary metabolites found in plants
(Berenbaum and Neal, 1985; Wang and Huang, 1999; Alonso Amelot and Calcagno,
2000; Macel et al, 2005). An example relevant to this study is the antinematode
activity of Quillajø saponaría, which is known to involve synergism between a saponin
and a non-saponin fraction (Martin and Magunacelaya, 2005). It is unlikely that
saponins are the only important antifungal compounds and it is known that
phytoalexins such as avenanthramides (hydroxy cinnamic acid amide) are produced in
oat shoots in response to lungal attack (Mayama et al., 1981; Miyagawa et al., 1996;
Okazaki et a1., 2004).
2,4.6 Effect of IVIJ on antifungal activity of crude extracts
The signalling molecule MJ is known as a potential plant elicitor capable of
inducing a wide range of plant secondary rnetabolites involved in plant defence
89
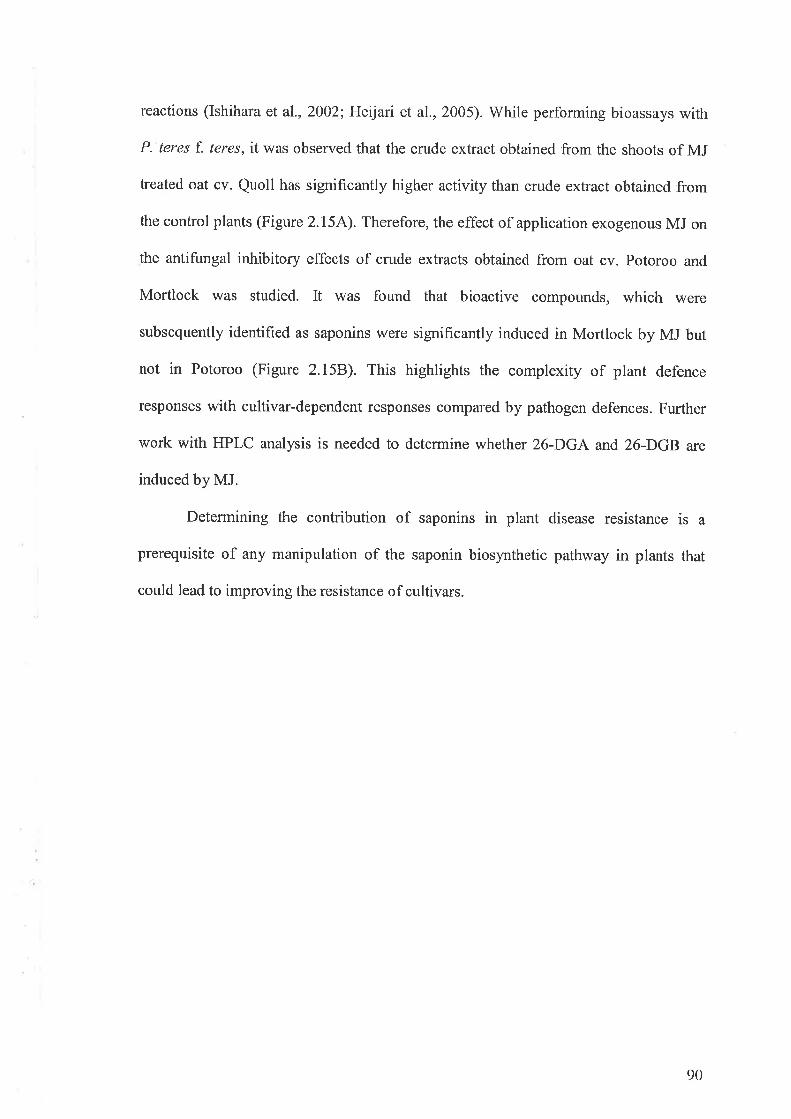
reactions (Ishihara et al., 2002; Heijari et al., 2005). While performing bioassays with
P. teres f. teres, itwas observeclthat the crude extract obtained from the shoots of MJ
treated oat cv. Quoll has significantly higher activity than crucle extract obtainecl from
the control plants (Figure 2.15A). Therefore, the effect of application exogenous MJ on
the antifungal inhibitory effects of cmde extracts obtained from oat cv. Potoroo and
Mortlock was studied. It was found that bioactive compounds, which were
subsequently identified as saponins were significantly induced in Mortlock by MJ but
not in Potoroo (Figure 2.15E}). This highlights the complexity of plant defence
responses with cultivar-dependent responses compared by pathogen defences. Further
work with HPLC analysis is needed to determine whether 26-DGA and 26-DGB are
induced by MJ.
Determining the contribution of saponins in plant clisease resistance is a
prerequisite of any rnanipulation of the saponin biosynthetic pathway in plants that
could lead to improving the resistance of cultivars.
90
Chapter Three
Metabolites Correlated with Cereal Cyst Nematode
Resistance in Oat (Avena sativa)
3.1 Introduction
Cereal cyst nematode (CCN; Heterodera avenae) is one of the most destructive
root pathogens of cereals and is widely distributed in many cereal-growing areas. Plants
react to nematode invasion in several ways including expressing defence genes,
proteins and synthesis secondary metabolites all of which are widely believed to
provide plants with resistance (Giebel, 1979; Huang and Barker, I99I; Oka et al., 1997;
Soriano et al., 2004), Methyl jasmonate (MJ), an inducer of plant defence pathways,
was found to provide protection to oat against CCN and root lesion nernatode
(Pratylenchus neglectus) by reducing the number of invading nematodes and increasing
plant mass (Soriano et al., 2004). This protective effect of MJ was attributed to induced
flavone-C-glycosides (Soriano et al., 2004).
Constitutive phyochemicals likely play a role in nematode resistance. Many
dilferent classes of chemicals are implicated as natural nematicidal compounds,
including alkaloids (Rao et a1.,1996;Zhao,1999; Cunha et al., 2003) saponins (Deepak
et al., 2002; Zinov'eya et a1.,2004; Martin and Magunacelaya,2005), phenolics (Rich
et al., 1977; Oka, 200i; Soriano et al., 2004) and sulphur containing compounds
(Akhtar and Mahmood, 1994; Potter et al', 1999; Zasada and Ferris, 2003,2004).
To search for constitutive compounds associatecl with nematode resistance, the
concentrations of flavonoids and other metabolites from individuals of a single seed
91
descent population (SSD) that was segregating for both CCN resistance and tolerance
and stem nematode (SN) resistance was determinecl. To identify potential induced
compounds for nematode resistance, the metabolites in MJ treated and untreated oat
roots were compared.
3.2 Materials and Methods
3.2.1 Plant Material
A single-seed descent (SSD) population of 170 lines was generated by Pamela
Zwer, SARDI, Australia, from a cross between Potoroo and Mortlock. This population
is segregating for several different disease resistance loci including resistance to CCN
and SN (unpublished data). A laboratory-based bioassay was used to obtain an indicator
of CCN resistance, based on the number of white CCN females developing on the
outside of the rootball (Lewis et al., 1999). The number of nematodes will be called the
"CCN female count" in the rest of the thesis. For stem nematode resistance, the
symptoms of the nematode were scored from 0 (no symptoms) to 5 (dead plants). A
number of SSD lines were selected from the population based on either high or low
CCN females count. CCN female counts (2000-2002) and SN resistance data (2001)
were collected uncler natural conditions with supplementary irrigation in pots as part of
an independent research project by John Lewis, SARDI, and were provided by Dr
Kevin Williarns, SARDI.
3.2.2 Plant culture and maintenance
In the first experiment (to investigate possible differences in FCG
concentration), seeds of the parent lines, Mortlock and Potoroo were sown in four
replicates in the growth chamber (22"C light/I8"C dark, 12 hr cycle). A few seeds of
92
each cultivar were sown into a pot containing steam pasteurised (65"C for 45 rnin)
University of California potting mix (Appendix 2) with Osmocote@ (Scotts, Australia),
a slow release fertiliser. Plants received Hoagland's solution (Beltrano et a1., 1998)
evety other day and tap water on alternate days. After three weeks, plants were
harvested. Shoots and roots rù/ere separated and frozen irnmediately in liquicl nitrogen.
They were stored at -80'C until extraction.
In the second experiment, the seeds of 58 SSD lines along with parental lines
were sown in a complete RB design in three replicates in a growth chamber as
mentioned above.
3.2.3 Flavonoid extraction and assessment by HPLC
Samples stored at -80oC were freeze-dried and ground to a fine powder using a
coffee grinder (Breville, Australia). Sixty mg of ground sample was extracted with 10
ml methanol (HPLC grade) for 12 hr by shaking on an orbital mixer at 130 rpm. Then,
3 ml MQ water was added to 7 ml methanolic extract and lipids were removed with l0
ml n-hexane mixed at 130 rpm for 12 hr. Eight rnl of the methanolic phase was
evaporated in a speed vac concentrator. The residue of shoot and root samples were
dissolved in 0.4 and, 0.2 ml 45Yo v/v methanol in water, respectively, and immediately
were analysed by HPLC as described in Section2.2.3. The extraction method used here
were different from Section 2.2.3 in two parts: 1) a reduced time of exposure to
methanol was usecl from 48 hr to 12 hr that gave no significant difference in yield of
FCG (Appendix ,{4.1) and 2) the butanol step was omitted which gave more FCGs
(Appendix A4.2).
93
3.2.4 Search for metabolites associated with CCN female count
The availability of a single seed descent population (SSD) segregating for CCN
resistace and tolerance and stem nematocle resistance provides an opportunity to
identify compounds that are important for resistance or tolerance. Potoroo is resistant
and tolerant to CCN, whereas Mortlock is moderately susceptible and intolerant.
Potoroo is moderately resistant and moderately tolerant to stem nematode, but Mortlock
is very susceptible and very intolerant to stem nematode (Table 3.1, Wallwork,2003)).
Resistance to CCN was based on the number of CCN females developing on the
outside of the rootball (Lewis et al., 1999). Resistance to SN was based on the
syrnptoms of the nematodes on the plants.
Fifteen resistant and 15 susceptible SSD lines were selected from the 170 SSD
lines based on the 2000 to 2002 CCN female counts (Appendix 5). Forty seeds of each
SSD line were genninated in a misting cabinet in a polyvinyl chloride (PVC) pipe sieve
(50 mm height and 90 mm diameter) with a nylon insect screen mesh across one end,
suspended above a plastic funnel to provide good drainage and air flow. The
experiment was carried out in three replicates. After five days, the root tip of main roots
was excised (about 7 mm) with a sterile surgical blade and transferred into a 1.5 ml
microfuge tube containing 150 p,l 50% methanol (HPLC grade) in batches of 20 for
each line in each replicate. Samples were frozen in liquicl nitrogen and then stored at
-900c.
3.2.5 Metabolite extraction from oat roots and HPLC analysis
Each frozen batch of root tips was ground in a microfuge tube containing 200 yt"l
50% methanol using a plastic homogeniser (Bel-Art Products, # F19923-0001). The
material was pelleted by centrifugation and re-extractecl with 4 x 250 ¡i 50o/o methanol
94
Each time the sample was centrifuged at 16,450 g for 5 min and the supematant was
collected and pooled. Sarnples were air-dried using a speedy vac and the final residue
was dissolved in 80 ¡-rl 45o/o methanol ancl centrifuged at high speed to remove any
insoluble material.
Reversed-phase (RP-HPLC) was perlormed with a C18 column (Waters
Sphersorb ODS-2, 4.6 mm x 150 mm, 5 pm particle) using a gradient elution applied at
a flow rate of 0.8 ml/min at 40oC. Samples were dissolved in 80 ¡rL 45olo rnethanol.
Separation started with 95o/o Solvent A (water) and 5Yo Solvent B (acetonitrile) and
followed with a gradient from 5 to 70o/o Solvent B over 17 rnin, and then increasing to
100% over 1 min and held at 100% for 2 min. Finally buffer B was reduced to 5olo over
I min and the column re-equilibrated for 7 min. Compounds were monitored with UV
detection at223,255 and 340 nm. The extraction and HPLC analysis for each SSD line
was performed in the same day to minimise possible degradation. The mean and
standard error of the data for each line were calculated using Excel 2000. Genstat
(Version 6.1; VSN International Ltd, Oxford, UK) was employed to determine the
correlation between the areas under the peak for each line and the CCN female count.
The significant peaks were collected, accumulated, concentrated and analysed by LC-
mass spectrometry in positive and negative ionization modes.
95
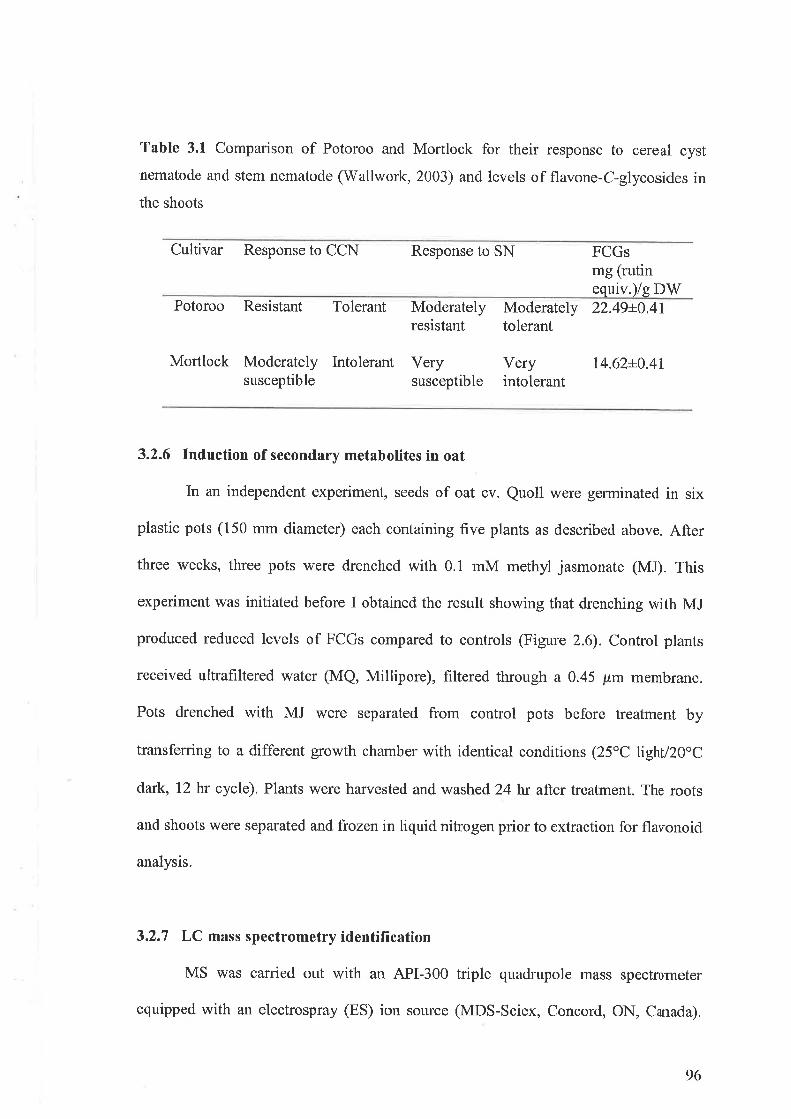
Table 3.1 Comparison of Potoroo and Mortlock for their response to cereal cyst
nematode ancl stem nematode (Wallwork,2003) and levels of flavone-C-glycosides inthe shoots
Cultivar Response to CCN Response to SN FCGsrng (rutinequiv.)/g DW
Potoroo Resistant Tolerant Moderatelyresistant
Verysusceptible
Moderately 22.49+0.47tolerant
Veryintolerant
Mortlock Moderately Intolerantsusceptible
14.62L0.41
3.2.6 Induction of secondary metabolites in oat
In an independent experiment, seeds of oat cv. Quoll were gerlninated in six
plastic pots (150 mm diameter) each containing five plants as described above. After
three weeks, three pots were drenched with 0.1 mM methyl jasmonate (MJ). This
experiment was initiated before I obtained the result showing that drenching with MJ
produced reduced levels of FCGs compared to controls (Figure 2.6). Control plants
received ultrafiltered water (MQ, Millipore), filtered through a 0.45 ¡rrn membrane.
Pots drenched with MJ were separated from control pots before treatment by
transferring to a different growth charnber with identical conditions (25oC lightl2}"C
durk, 12 hr cycle). Plants were harvested and washed 24 hr after treatment. The roots
and shoots \ryere separated and frozen in liquid nitrogen prior to extraction for flavonoicl
analysis.
3.2.7 LC mass spectrometry identilïcation
MS was carried out with an API-300 triple quadrupole mass spectrorneter
equipped with an electrospray (ES) ion source (MDS-Sciex, Concord, ON, Canada).
96
Compounds in the active fractions of the crude extract r,À/ere separated using a reversed-
phase column (Synergi Hydro-RP Phenomenex, Torrance, CA; 4 ¡-rm, 150 x 2 mm)
with a flow rate of 200 ¡rl/min for 60 min and an injection volume of 20 ¡"Ll in 100%
Solvent ^
(2.5% formic acid in water) and Oo/o Solvent B (formic acid: acetonitrile:
water; 1:60:39 vlvlv). Gradient elution was performed by increasing lrom 0 to 20%o
Solvent B over 10 min, then 20 to 60Yo over 8 min, followecl by 60 to 100% over 7 min,
held steady for l0 min and finally decreasing to 20o/o Solvent B over 1 min. The mass
spectrometer was operated in either positive or negative ion scan mode and scanned
from m/z 150 to m/z 2000 with a step size 0.2 Da and dwell time of 0.25 msec. The
electrospray needle, orifice and ring potentials were set at 5000 V, 30 V and 250 V,
respectively. The curtain (nitrogen) and nebulizer (air) gases were set at 8 and 12 units,
respectively. The samples \Mere monitored using a diode array detector (DAD, HP
1100, Agilenl) at254 nm and 340 nm. The mass spectral data was processed using Bio-
Multiview (Version L2þ3, PE Sciex) and Analyst (Version 1.4) software.
3.3 Results
3.3.1 Flavone-C-glycosides concentration and nematode resistance
To determine if the parents of the single seed descent population were
segregating for levels of FCGs, the total concentration of FCGs in the shoots of the
parental lines of the population, Mortlock and Potoroo, \Mas determined using
established protocols (Sections 2.2.3 and 2.3.I). The concentration of FCGs in the
shoots of Mortlock and Potoroo was determined using HPLC monitored at340 nm. The
concentration of FCGs in the parent more resistant to stem nematode, Potoroo, was
significantly higher than in FCGs in susceptible parent, Mortlock (at 22.49 t 0.41 mg
(nrtin equiv.)/g DV/ ancl 14.62 + 0.41 respectively) (Table 3.1). The difference between
97
the parental lines suggests that it was worth screening the SSD lines to cletermine ifthese differences segregate with the CCN females count and SN scores.
Flavonoids were extracted from the roots of 20 SSD lines chosen on the basis of
the resistance phenotypic extremes of CCN female count (Table 3.2) and the shoots of
12 SSD lines chosen on the basis of resistance phenotypic extremes of stem nematode
symptoms on plants (Table 3.3). Flavonoids were also extracted from the parental lines
(Section 3.3.1). For each sample, the concentration of the three known flavonoids,
luteolin-C-hexoside-O-pentoside (FCGI at R¡:10.3), apigenin-C-hexoside-O-pentoside
(FCG2 at Rt:1¡.3) and, O-methyl-apigenin-C-deoxyhexoside-O-hexoside (FCG3 at
R¡:l 1.1) was quantified and they were about 350 fold higher in the shoots (Table 3.3)
than in roots (Table 3.2). There was neither significant correlation between the
concentration of FCGs in the roots and CCN female count nor between the
concentration of FCGs in the shoots and resistance to stem nematode (Table 3.4). The
FCGs data was compared with the CCN female counts for each of the three years,
2000, 2001 and 2002, and the mean of counts in the three years (Table 3.4).
3.3.2 Metabolites associated with CCN resistance
To determine if other metabolites are involved in CCN resistance we extracted
rnetabolites from the root tips of 30 SSD lines (Appendix 5). Methanolic extracts were
analysed by HPLC and 16 peaks were identified (Figure 3.14). The area under the peak
was determined for each of the SSD lines in three replicates. Peaks 1,2 and I were
ignored because they were consistent in both resistant and susceptible lines based on
visual inspection. Two out of 30 lines were removed from analysis due to high standarcl
eror and./or low recovery of all metabolites. Three of the peaks were significantly
98
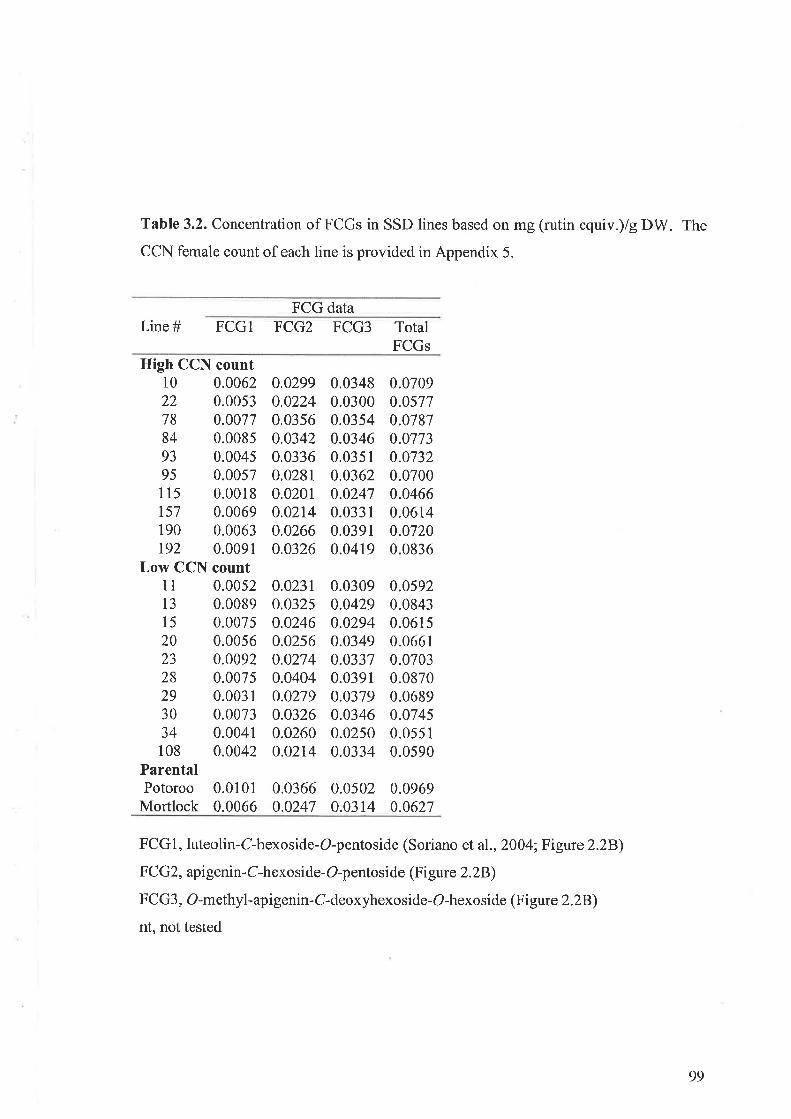
Table 3.2. Concentration of FCGs in SSD lines based on mg (rutin equiv.)/g DW. The
CCN female count of each line is provided in Appenclix 5.
FCG dataLine # FCGI FCG2 FCG3 Total
FCGsHigh CCN count
10 0.006222 0.005378 0.007784 0.008593 0.004595 0.0057115 0.0018ls7 0.0069190 0.0063792 0.0091
Low CCN count11 0.005213 0.008915 0.007520 0.005623 0.009228 0.007529 0.003130 0.007334 0.0041108 0.0042
ParentalPotoroo 0.0101Mortlock 0.0066
0.02990.02240,03s60.03420.03360.02810.02010.02140,02660.0326
0.03480.03000.03540.03460.03510.03620.02470.03310.03910.0419
0.07090.05770.07870.07730.07320.07000.04660.06140.07200.0836
0,02310.03250.02460.02s60.02740.04040,02790.03260.0260o.o2r4
0.03660.0247
0.03090.04290.02940.03490.03370.03910.03790.03460.02500.0334
0.05020.0314
0.05920.08430.06150.06610.07030.08700.06890.074s0.05510.0590
0.09690.0627
FCG 1, luteolin-C-hexoside-O-pentosicle (Soriano et al., 2004; Figure 2.28)F CG2, api genin- C-hexo si de- O-p ento side (Fi gure 2.28)
FCG3, O-methyl-apigenin- C-deoxyhexoside-O-hexoside (Figur e 2.28)
nt, not tested
99
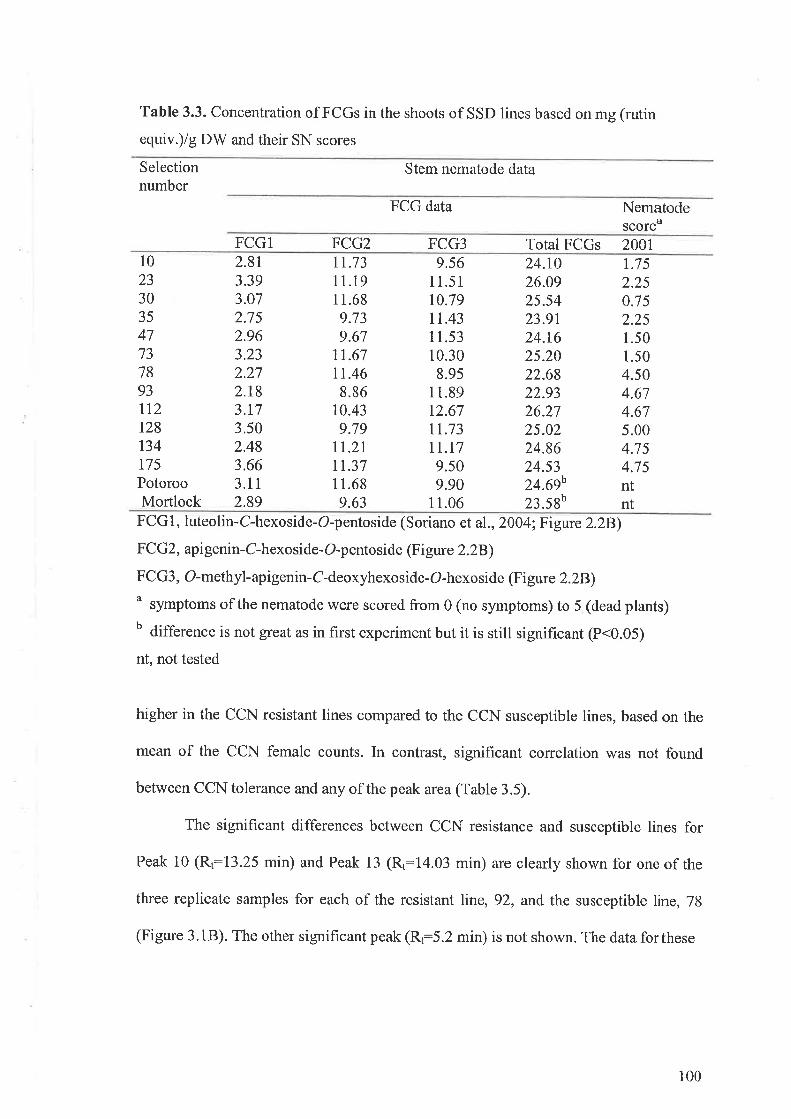
Table 3.3. Concentration of FCGs in the shoots of SSD lines based on mg (rutin
equiv.)/g DW and their SN scores
Selectionnumber
Stem nematode data
FCG data Nematodescore"
FCGI FCG2 FCG3 Total FCGs 20011023303547737893t12728734t75PotorooMortlock
2.8r3.393.072.752.963.232.272.183.t73.502.483.663.112.89
11.731 1.1911.689.739.67
11.67tr.468.86
10.439.79
lt.2r11.37I 1.689.63
9.56I 1.5110.7911.43I 1.5310.308.9s
11.8912.6711.73tt.t79.509.90
1 1.06
24.t026.0925.5423.9r24.1625.2022.6822.9326.2725.0224.8624.5324.69b23.58b
1.7 s2.250.752.25l.s01.504.s04.614.675.004.7s4.75ntnt
FC G 1, luteolin- C-hexoside-O-p entoside (S oriano et al., 200 4; Fi gure 2.28)F CG2, api genin- C-hexosi de- O-p ento side (Fi gure 2.28)FCG3, O-methyl-apigenin-C-deoxyhexoside-O-hexoside (Figur e 2.ZB)u symptoms of the nematode were scored from 0 (no symptorns) to 5 (dead plants)b diffetence is not great as in first experiment but it is still signiñcant (P<0.05)
nt, not tested
higher in the CCN resistant lines compared to the CCN susceptible lines, based on the
mean of the CCN female counts. In contrast, significant correlation was not found
between CCN tolerance and any of the peak area (Table 3.5).
The significant differences between CCN resistance and susceptible lines for
Peak l0 (Rr:13.25 min) and Peak 13 (R¡:14.03 min) are clearly shown for one of the
three replicate samples for each of the resistant line, 92, and the susceptible line, 78
(Figure 3.18). The other significant peak (R¡:5.2 min) is not shown. The data forthese
100
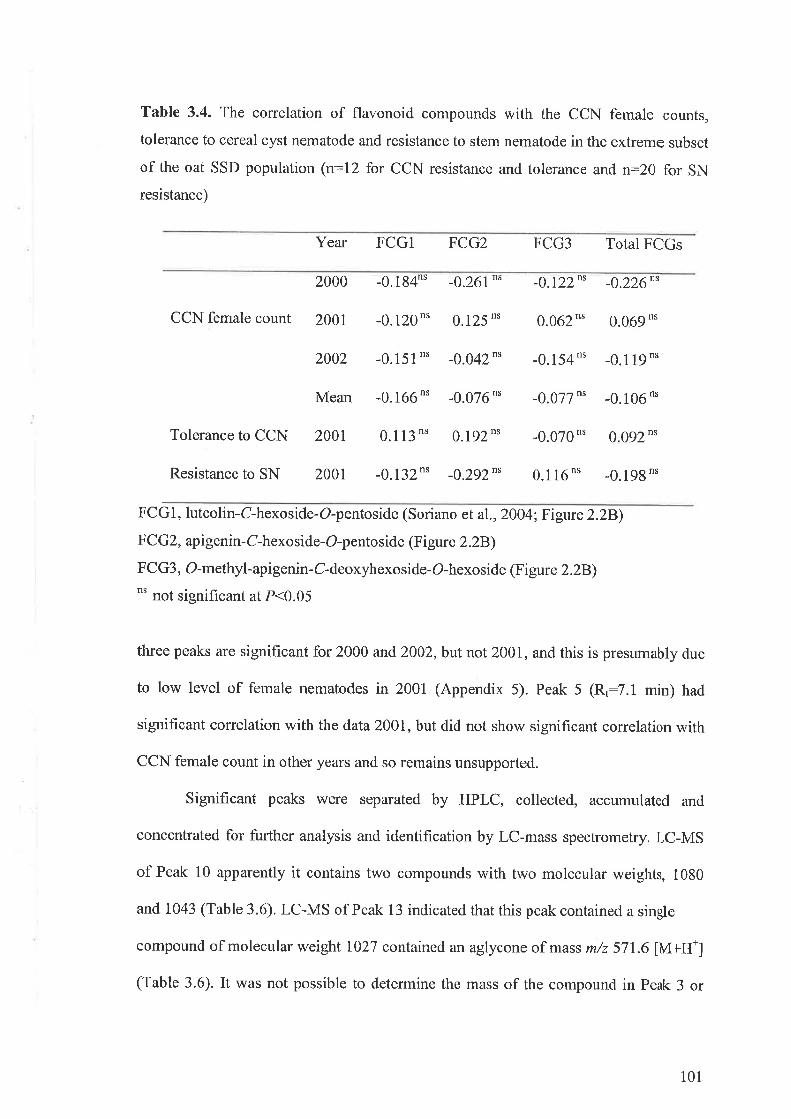
Table 3.4. The correlation of flavonoid compouncls with the CCN female counts,
tolerance to cereal cyst nematocle and resistance to stem nematode in the extreme subset
of the oat SSD population (n:12 for CCN resistance and tolerance and n:20 for SN
resistance)
Year FCG1 FCG2 FCG3 Total FCGs
2000 -0.1g4n' -0.261"' -0.122"' -0.226""
CCN female count 2001 -0.120"' 0.125 n. 0.062n' 0.069n'
2002 -0.151"' -0.042"" -0.154n' -0.1lgn'
Mean -0.166n' -0.076 n' -0.077 n' -0.106 n'
Tolerance to CCN 2001 0. I 13 n' 0. I 92 n' -0.070 "' 0.092 n'
Resistance to SN 2001 -0. 132 n' -0.292"' 0. 1 I 6 n' -0. I 9g "'
FCGl, luteolin-C-hexoside-O-pentoside (Soriano et al., 2004; Figure 2.28)F CGz, api genin- C-hexo side- O-p ento side (Fi gure 2 .28)F C G3, O-methyl- api genin- C- deoxyhexoside- O-hexo side (Figur e 2.28)'' not significant at P<0.05
three peaks are significant for 2000 and 2002, but not 200I, and this is presumably due
to low level of female nematodes in 2001 (Appendix 5). Peak 5 (Rt:7.1 min) had
significant correlation with the data20OI, but did not show significant correlation with
CCN female count in other years and so remains unsupported.
Significant peaks \ryere separated by HPLC, collected, accumulated and
concentrated for further analysis and identification by LC-mass spectrometry. LC-MS
of Peak 10 apparently it contains two cornpounds with two molecular weights, 1080
and 1043 (Table 3.6). LC-MS of Peak 13 indicated that this peak contained a single
compound of rnolecular weight 1027 contained an aglycone of mass m/z 571.6 [M+H+]
(Table 3.6). It was not possible to determine the mass of the compound in Peak 3 or
101
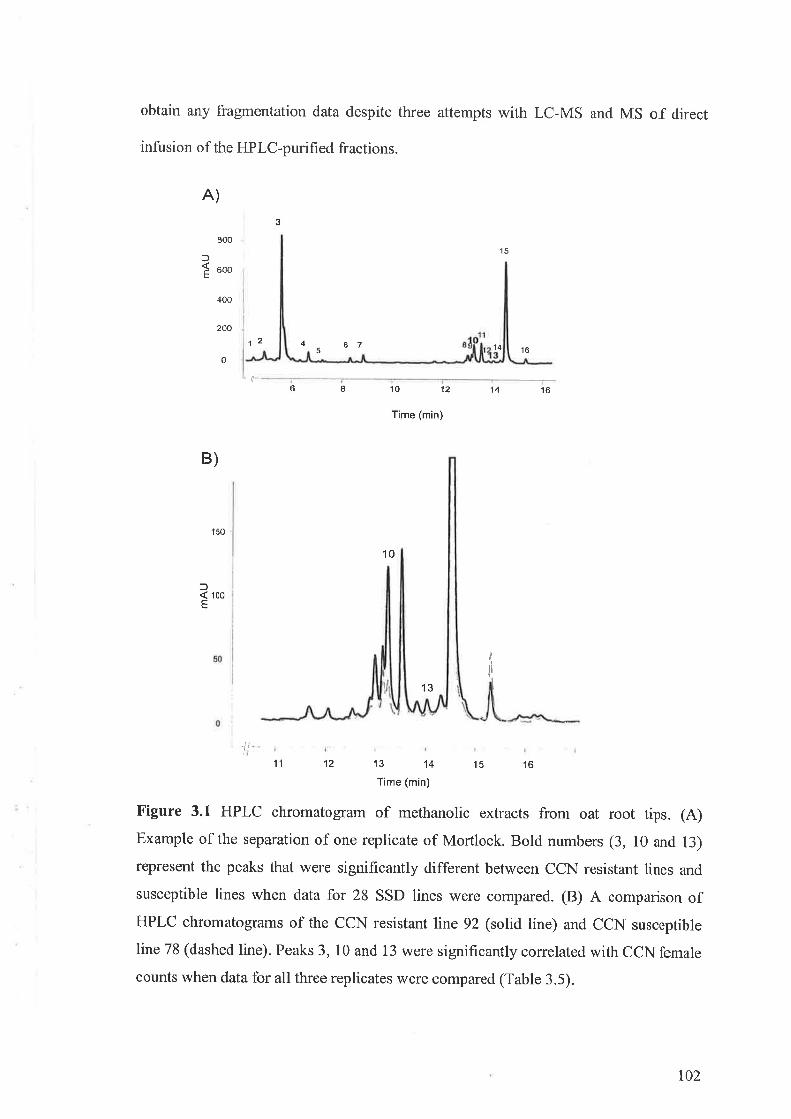
obtain any ftagmentation data despite three attempts \Ã/ith LC-MS ancl MS of direct
infusion of the HPlC-purifiecl fractions.
A)
fE
B)
800
600
400
20012
3
11
67
Time (min)
10
't 3
13 14
Time (min)
15
14 16
14
15 16
45
o
l6 I 10 12 16
150
l< 100E
¿
l|
112
Figure 3.1 HPLC chrornatogram of methanolic extracts from oat root tips. (A)Example of the separation of one replicate of Mortlock. Bold numbers (3, 10 and 13)
represent the peaks that were significantly different between CCN resistant lines and
susceptible lines when clata for 28 SSD lines were cornpared. (B) A comparison ofHPLC chromatograrns of the CCN resistant line 92 (solid line) and CCN susceptible
line 78 (dashed line). Peaks 3, 10 and 13 were significantly correlated with CCN female
counts when data for all three replicates Ìvere compared (Table 3.5).
102
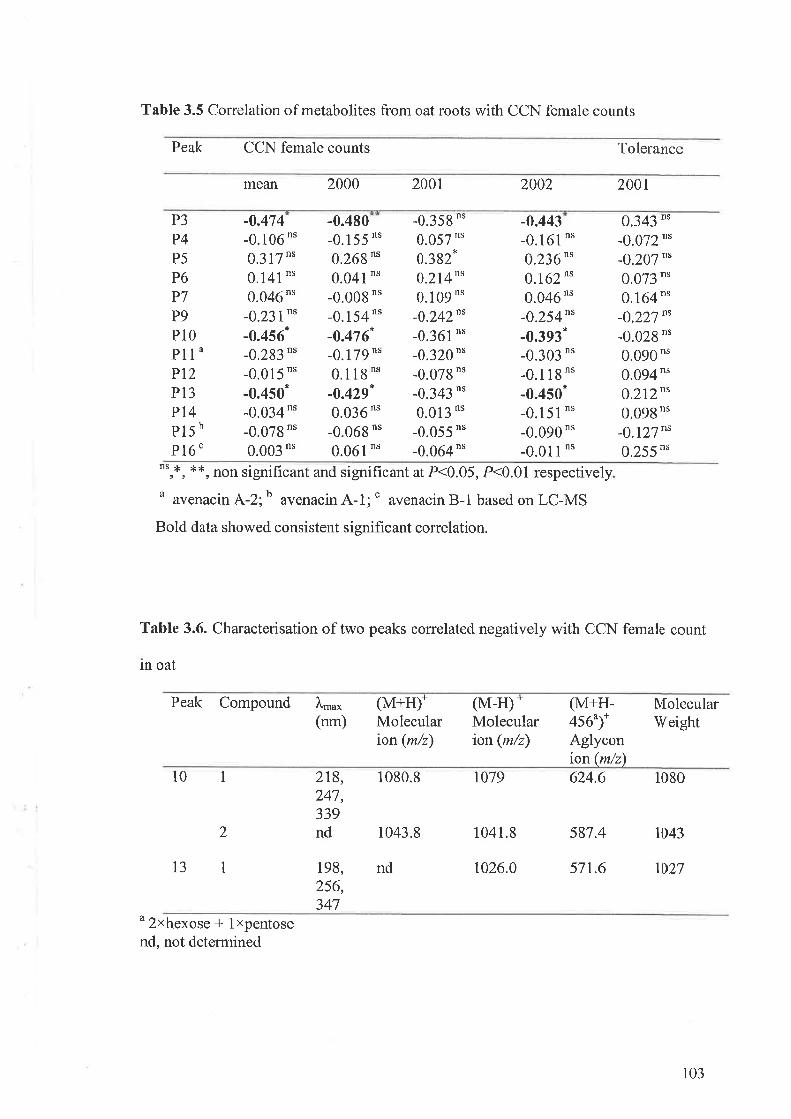
Table 3.5 Correlation of metabolites from oat roots with CCN female counts
Peak CCN female counts Tolerance
mean 2000 200t 2002 2001
P3P4P5P6P7P9P10Pl1 'Pt2Pl3PI4P15 b
P16'
-0.359 n'
0.057 n'
0.382.0.214""0.1 0g n'
-0.242n'-0.361n'-0.320 n'
-0.079 n'
-0.343 n'
0.013 n'
-0.055 n'
-0.064 n'
-0.443 0.343 "'-0.072 n'
-0.20J ""0.073 "'0.164 "'-0,227"'-0.029 "'0.090"'0.094"'0.212"'0.0ggn'-0.127"'0.255 n'
-0.474 -0.480-0.106 n'
0.317 n*
0.141"'0.046n'-0.231""-0.456.-0,293 "'-0.015 n'
-0.450.-0.034 n'
-0.079 "'0.003 n'
-0.155 n'
0.269 n'
0.041n'-0.009 n'
-0. I 54 n'
-0.476.-0.179 n'
0.1 1g n'
-0.429.0.036 n"
-0.069 n'
0.061 n'
-0.161n'0.236n"0.162 n'
0.046 n'
-0.254""-0.393.-0.303 n'
-0.1 1 g n'
-0.450.-0.151n'-0.090 n'
-0.011 n'n',*, **, non signifrcant and significant at P<0.05, P<0.01 respectivelyu avenacin Ã-2;b avenacin A-1; ' avenacin B-1 based on LC-MS
Bold data showed consistent significant correlation.
Table 3.6. Characterisation of two peaks correlated negatively with CCN female count
in oat
Peak Compound Lnu* (M+H)*(nm) Molecular
ion(m/z)
(M-H)-Molecularion(m/z)
(M+H-456^)*Aglyconion(m/z)
MolecularWeight
10 1
13 1
278,247,339nd
r98,256,347
2
1080.8 1079
1043.8
624.6 1080
1041.8 587.4 1043
1026.0 571.6 1027nd
u 2*hexose 1 lxpentosencl, not determinecl
103
3.3.3 Induced metabolites in oat roots
Incluced rather than constitutive compounds may also be important lor
nematode resistance, therefore the effect of soil-drenched exogenous MJ was testecl on
metabolites in roots. Several peaks were induced significantly by MJ in whole roots
(Figure 3.2A). The HPLC chromatogram of untreated Quoll plants highlights that rnany
peaks are significantly lower (eg Peak 7,Peak 11 and Peak 13, Figure 3.28). The
HPLC profile obtained with Quoll (Figure 3.2) is significantly different that for SSD
lines (Figure 3.14) and it is due to using older whole root (Figure 3.2) ruther than root
tips (Figure 3.14)
To identify the compounds in each peak (20 peaks) LC- mass spectrometry was
ernployed in positive and negative modes of ionisation. Characteristics of each peak are
summarised in Table 3.7. The LC-MS analysis of two of the induced peaks, Peak 13
and Peak 15 gave good fragmentation in both modes. The ionisation patterns show that
they have the same mass, 1062.2, as the saponin avenacoside A or 26-
desglucoavenacoside B (26-DGB) that cannot be distinguished by MS (Wubben et al.,
1996). The only difference between the ionisation pattern of Peak 13 and Peak 15
compounds with the avenacoside A or 26-DGB is the presence of the fragment ion m/z
819.8 in negative mode. Whereas, all of the ions seen in positive mode have been
reported for avenacoside A or 26-DGB. This could arise from contamination as it was
found in Peak 14 (Table 3.7) or more likely Peaks 13 and 15 are not avenacosides but
they are similar compounds. Induced Peaks 16 and 20 are consistent with avenacin A-2
and avenacin B-1, respectively (Table 3.7). Peak 18 was not induced by MJ but could
still be iclentified as avenacin A-1 (Table 3.7). The ionisation data for other peaks was
not enough to determine the structure of the metabolites.
104
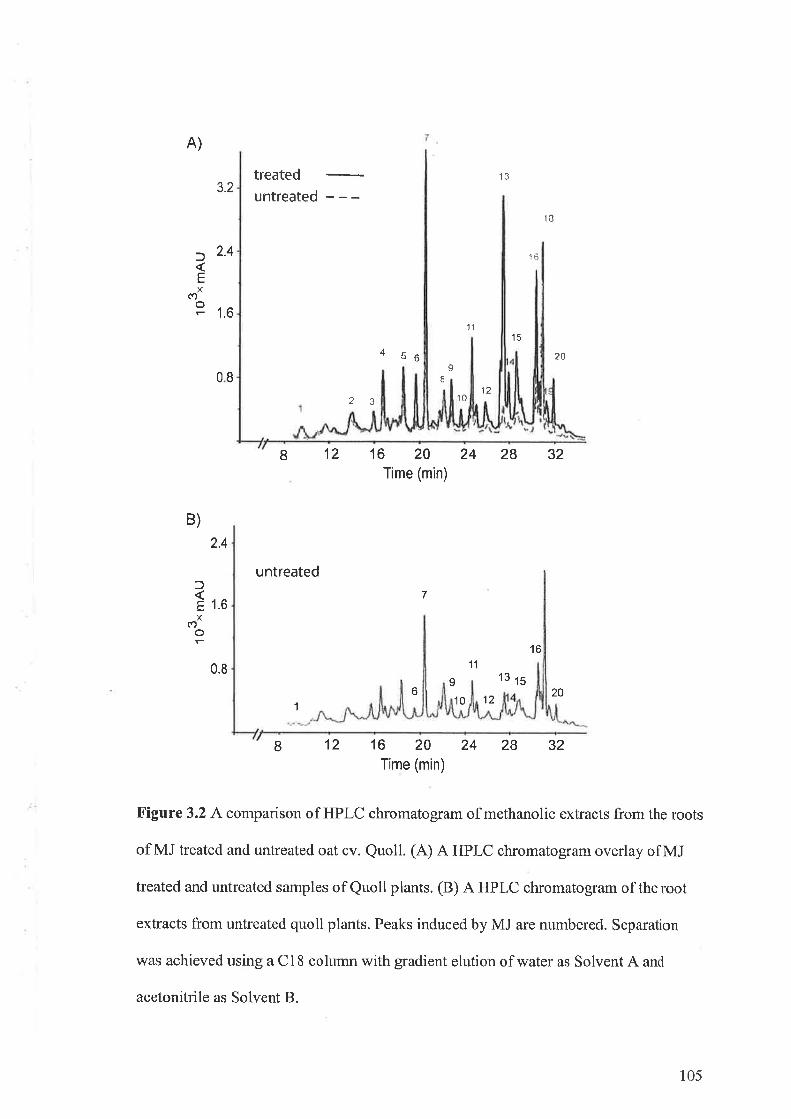
A)
3.2
:) 2.4
E(')X
3 1.6
B)2.4
treateduntreated
13
l8
io
11
15
20
1210
24 28 32
l611
o 13 ts10 12
20
24 28 32
4 s6I
08 I
23
fE
812
untreated
12
16 20Time (min)
7
16 20Time (min)
X(r)o1.6
0.8
r
61
B
Figure 3.2 Acomparison of HPLC chromatogram of methanolic extracts from the roots
of MJ treated and untreated oat cv. Quoll. (A) A HPLC chromatogram overlay of MJ
treated and untreated samples of Quoll plants. (B) A HPLC chromatogram of the root
extracts from untreated quoll plants. Peaks induced by MJ are numbered. Separation
was achieved using a C18 column with gradient elution of water as Solvent A and
acetonitrile as Solvent B.
10s
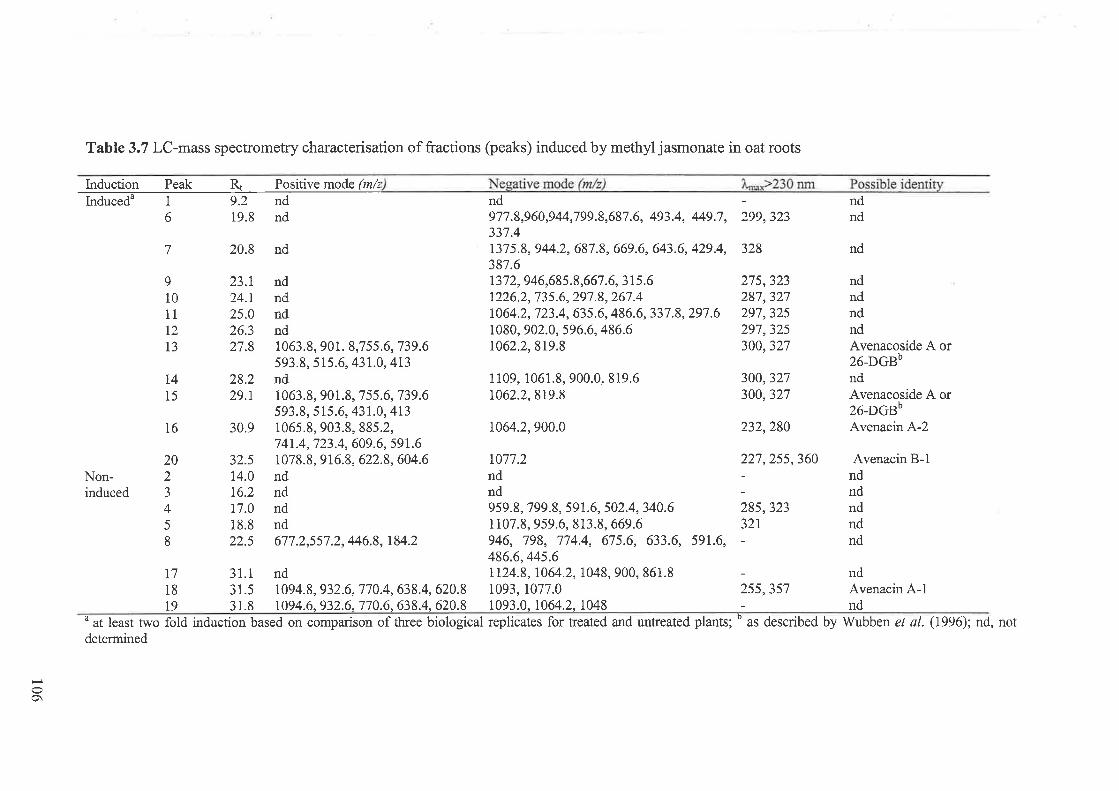
Table 3.7 LC-mass spectrometry characterisation of fractions (peaks) induced by methyl jasmonate in oat roots
lnduction Peak R, Positive mode (m/znc-no
6 19.8 nd 977.8,960,944,799.8,687.6, 493.4, M9.7, 299,323 nd337.4
7 20.8 nd 1375.8,944.2,687.8, 669.6, 643.6, 429.4, 328 nd387.6
9 23.I nd 1372,946,685.8,667.6,315.6 275,323 nd10 24.I nd 1226.2,735.6,297.8,267.4 287,327 nd11 25.0 nd 1064.2,723.4,635.6,486.6,337.8,291.6 297,325 nd12 26.3 nd 1080, 902.0, 596.6,486.6 297,325 nd13 27.8 1063.8,901. 8,755.6,739.6 1062.2,819.8 300,327 Avenacoside A or
593.8, 515.6, 43r.0,4r3 26-DGBb14 28.2 nd 1109, 1061.8,900.0,819.6 300,327 nd15 29.I 1063.8, 901.8, 755.6,739.6 1062.2,819.8 300,327 Avenacoside A or
593.8, 515.6,43r.0,4t3 26-DGBb16 30.9 1065.8, 903.8, 885.2, 1064.2,900.0 232,280 Avenacin A-2
7 4r.4, 723.4, 609.6, 59r.620 32.5 1078.8,916.8, 622.8,604.6 1077.2 227,255,360 AvenacinB-l
Non- 2 I4.0 nd nd - ndinduced 3 16.2 nd nd - nd
4 17.0 nd 959.8, 799.8,591.6, 502.4,340.6 285,323 nd5 18.8 nd 1i07.8, 959.6,813.8, 669.6 321 ndg 22.5 677.2,557.2,446.8,184.2 946, 798, 774.4, 675.6, 633.6, 591.6, - nd
486.6,445.6I7 31.1 nd 1124.8,7064.2,1048,900,861.8 - nd18 31.5 1094.8, 932.6,770.4,638.4,620.8 1093, 1077.0 255,357 Avenacin A-1t9 31.8 1094.6,932.6,710.6,638.4,620.8 1093.0,7064.2,1048 - nd
a at least two fold induction based on comparison of three biological replicates for treated and untreated plants; o as described by Wubben eÍ al. (1996); nd, notdetermined
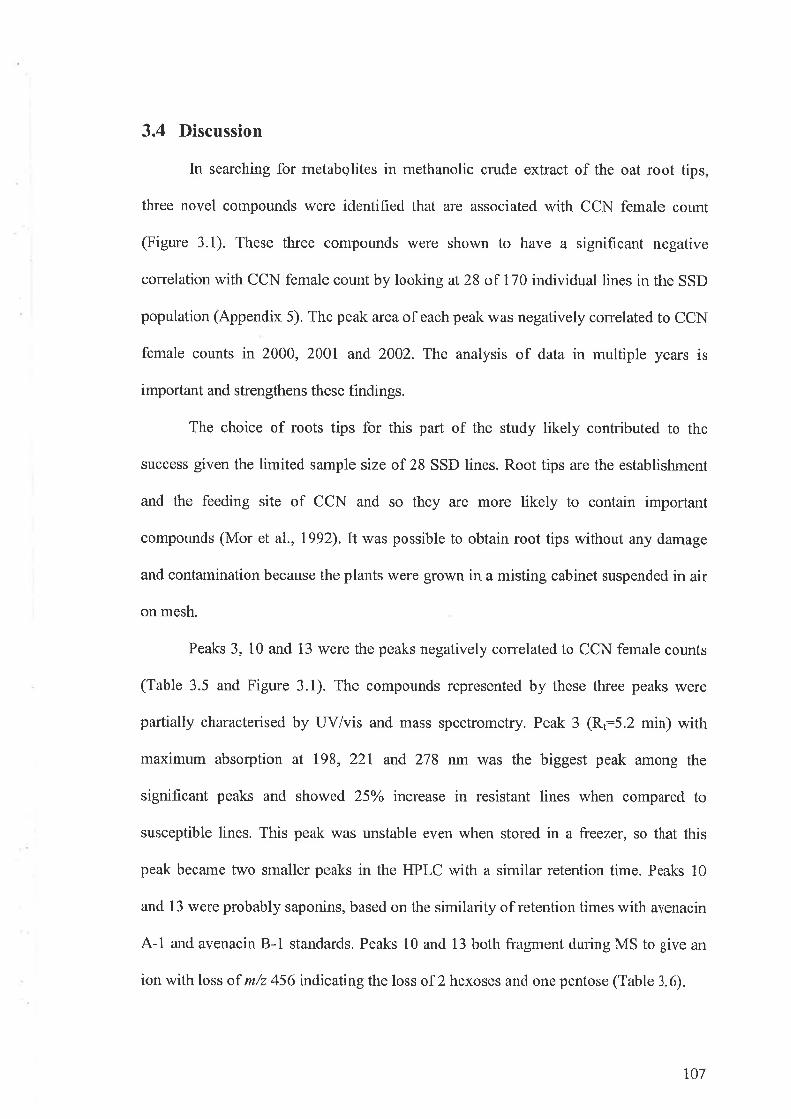
3.4 Discussion
In searching for metabqlites in rnethanolic crude extract of the oat root tips,
three novel cornpounds were identified that are associatecl with CCN female count
(Figure 3.1). These three compounds were shown to have a signifîcant negative
correlation with CCN female count by looking at 28 of 170 individual lines in the SSD
population (Appendix 5). The peak area of each peak was negatively conelated to CCN
female counts in 2000, 2001 and 2002. The analysis of data in multiple years is
important and strengthens these findings.
The choice of roots tips for this part of the study likely contributed to the
success given the lirnited sarnple size of 28 SSD lines. Root tips are the establishment
and the feeding site of CCN and so they are more likely to contain important
compounds (Mor et al., 1992).It was possible to obtain root tips without any darnage
and contamination because the plants were grown in a misting cabinet suspended in air
on mesh.
Peaks 3, 10 and 13 were the peaks negatively correlated to CCN female counts
(Table 3.5 and Figure 3.1). The compounds represented by these three peaks were
partially characterised by UV/vis and mass spectrometry. Peak 3 (Rt:5.2 min) with
rnaximum absorption at t98, 221 and, 278 nm was the biggest peak among the
significant peaks and showed, 25o/o increase in resistant lines when compared to
susceptible lines. This peak was unstable even when stored in a freezer, so that this
peak became two srnaller peaks in the HPLC with a sirnilar retention time. Peaks l0
and l3 were probably saponins, based on the similarity of retention times with avenacin
A-1 and avenacin B-1 standards. Peaks 10 and 13 both fragment during MS to give an
ion with loss of m/z 456 indicating the loss of 2 hexoses ancl one pentose (Table 3.6).
107
Other peaks, not correlated with CCN resistance could be conclusively
identifiecl as the saponins, avenacin A-2 (Peak 11), avenacin A-l (peak 15) and
avenacin B-1 (Peak 16), based on observed LC-MS data of known avenacins (Figure
3.1).
Analysis of flavonoids in the single seed descent population indicated that
flavonoids are not major contributors of constitutive resistance to nematodes based on
analysis of whole roots. The evidence that flavonoids are not responsible for CCN
resistance is increasing, based on the findings that flavonoids are not induced by MJ
(Figures 2.4,2.5,2.6) and the concentration of these compounds in oat roots is very low
(less than 0.1 mglg DW, Figure 2.I2 and Table 3.2). However, it is possible that by
analysing more SSD lines and using only root tips, a significant correlation could be
observed. Alternatively, it is possible that flavonoids are not important in nematode
resistance in the cultivar Mortlock and Potoroo but are important in other cultivars such
as Quoll where flavonoids have been reported as provicling protection against
nematodes (Soriano et a1.,2004).
Current interest in plant resistance to disease includes identifying inducible
defence mechanisms (Osbourn,200l), in part because these mechanisms are less likely
to cornpromise plant yield in the absence of pathogens. MJ is an important elicitor
especially in biotic stress (Staswick et al., 1998). Results of an experiment with MJ on
secondary metabolites in oat roots showed signihcant induction of 11 fractions (Figure
3.24 and Table 3.7). This research led to the identification of two MJ inducible
compounds similar to avenacoside A and/or 26-DGB, which have previously been
shown to be present only in oat shoots (Wubben et a1., 1996). The presence of
avenacoside A derived compounds in oat have not been reported in roots, and it was
thought that they were shoot specific compounds (Tschesche et al., 1969; Wubben et
108
al., 7996). Avenacoside A is a precuÍsor to a potent antiftrngal compound, 26-DGA
(Wubben et al., 1996). To our knowledge, this finding is novel and indicates the
existence of saponin biosynthetic pathway in oat roots as well as oat shoots.
Avenacosides as steroidal saponins and avenacins as triterpenoid saponins were
well known as antilungal compounds in oat roots (Crombie et al., 1986; Wubben et a1.,
1996). Previously it was suggested that avenacins are phytoanticipins, that is,
constitutively produced compounds (Townsend et al., 20Q6). Here, it has been shown
that both avenacin A-2 (Peaks 16) and avenacin B-1 (Peak 20) arc induced by MJ and
therefore may be rnore correctly classified as phytoalexins, whereas avenacin A-1
(Peak 18) was not induced by MJ. Avenacin A-2 (Peak 11 in Figure 3.14 and Peak 16
in Figure 3.2A) showed high, but not significant, negative correlation with CCN female
count and it was significantly induced by MJ. Therefore, it would be worth analysing
rnore SSD lines to determine if a signifrcant correlation exists. In agreement with the
data presented here, the induction of triterpenoid saponins in oat roots may have been
expected because genes involved in saponin synthesis pathway were reported to be
induced by MJ in Glycyrrhiza glabra and Medicago truncatula (Suzuki et a1., 2002;
Hayashi et al., 2003). This MJ induction experirnent will help us to focus on inducible
compounds in future experirnents to determine whether they play a role in nernatode
resistance.
There are several benefits to identifying plant nematicidal cornpounds
(Chitwood, 2002). For example, knowledge of the structure of protective molecules
would allow them to be synthesized to provide safe, nature identical, phytoprotecants.
Structural knowledge will also assist in the understanding of the biosynthetic pathway
and identify targets for future genetic manipulation of genes. This study has identifiecl
more than 10 metabolites that may play a role in biotic stresses, three of which are
109

likely to have antinematode activity. Future studies need to focus of functional testing
of the individual compounds ancl to determine if there are s)mergistic effects of the
three compouncls.
110
Chapter 4
General Discussion and Future Research
4.1 Metabolites associated with CCN resistance
4,1.1 Genetic variation for FCG concentration in oat
The original aim of this project was to determine whether there was significant
genetic variation of flavonoid concentration as a potential protective factor for cereal
cyst nematode resistance in oat roots and shoots. This study was initiated because
flavonoids were shown to be involved in oat resistance to CCN and root lesion
nematode (Soriano et al., 2004). A large number of oat accessions (72 accessions) were
screened from the SARDI genetic resources including wild relatives and important
breeding cultivars. In this study, it was not possible to measure the concentration of
flavonoids in the roots. Roots were of primary interest to this study because a previous
report suggested that flavonoids in roots gave protection against CCN (Soriano et al.,
2004).In the preliminary experiments searching for genetic variation in oat accessions
and the experiment described in Section 2.3.6, the FCG peaks were negligible (Figure
2.12) and were not measured. However, the flavonoids in oat roots (SSD population)
were analysed and quantified using HPLC and correlated to the number of white
females developing in the plants in Table 3.2. Levels of FCGs in roots varieú from
0.046 to 0.096 mg (rutin equiv.)/g DW based on clata in Table 3.2.
A significant variation of concentration of flavonoids was found in the shoots of
a variety of oat accessions in three sequential experiments (Table 2.2 and, Figures 2.4
and 2.5).I491406-1 was the cultivar with highest level of FCGs in both glasshouse
conditions (Table 2.2 and Figure 2.4\ and in growth chambers (Figure 2.5).lt may have
r11
been possible to identify more consistent significant differences if the same controlled
conditions were used for all of experiments. For example the difference in ranking of
accession 91QK195 from the first rank in the experiment in the glasshouse wilh 2l
accessions (Figure 2.4) to the last rank in the experiment carriecl out in the growth
chamber with five accessions (Figure 2.5), may have been attributed to the different
growth conditions.
Most of the FCG extractions performed in this thesis were perforrned on 5 days
as described in Section 2.2.3. By reducing the time of exposure to methanol and
omitting the butanol step, two days can be saved per extraction (Appendix 4). The first
modifìcation was a reduction in tirne of sample exposure to methanol from 48 hr to 12
lrr. In fact, it may be possible to further reduce the extraction time to less than 12 hr and
this should be tested before any future experiments are performed. The second
modification was to omit the butanol step, which gave significantly more FCGs
compared to extraction of FCGs with butanol.
4.1.2 Correlation of secondary metabolites and CCN female counts
In the study of SSD lines to flrnd oat root rnetabolites correlated with CCN
female count, three metabolites were found in oat root tips to have significant
correlation with CCN count. kt this experiment only 30 lines of 170 generated SSD
lines were tested (in three replicates). The peak area of 16 peaks was tested for
correlation to CCN count in 2000, 2007,2002 and CCN tolerance data in 2001. Root
tips were analysed in this experiment as root tips are the sites of establishment ancl
feeding cells for CCN (Mor et al., 1992) and it has been reported that root tips contain
antiflingal compounds like avenacins (Crombie et al., 1987). Attempts to identify the
compounds present in the three significant peaks using LC-MS and MS clirect infusion
It2
gave incornplete information, howevet the mass and absorption maxima (surnrnarised
in Table 3.6) were obtained.
Avenacin A-1, avenacin A-2 and avenacin B-1 were identified in oat roots, but
none showed significant correlation with CCN count or tolerance. Further research on
the effect of avenacin A-2 is suggested as it showed high but not significant correlation
to CCN count and this compound showecl induction by MJ in an independent
experiment (Table 3.7).
The direct application of the three fractions that are correlated to low nernatodes
count and their synergistic effect on the development of CCN is warranted.
Furthermore, it seems worthwhile to study a larger number of SSD lines.
4.2 Antimicrobial activity of flavonoids and saponins
4.2.1 Antimicrobial activity of flavonoids in oat
The antinernatode activity of flavonoids was examined in this research using a
single seed descent population. Results showed that none of the three FCGs had
significant correlation with CCN count and resistance to stem nematode. To understand
antinematode activity of flavonoids, the direct effect of FCGs on nematodes is
necessary.
To extend earlier work which showed that the FCG, O-methyl-apigenin-C-
deoxyhexosicle-O-hexoside, coulcl provide protection against CCN (Soriano et al.,
2004), the possible antifungal and antibacterial activity of oat crude extract was also
tested. Results showed that oat crude extract could not inhibit the growth of the tested
bacteria. Therefore no more bioassay experiments were performed on bacteria. Oat
crude extract containing FCGs could inhibit the mycelial growth of Pyrenophora
113
species. However, HVPE fractionation showed that fractions with high level of FCGs
did not inhibit the growth of fungi. In other words, FCGs are not responsible for the
inhibition of fungal growth observed in the crude extract.
4.2.2 Antifungal activity of saponins in oat
Since it was shown that flavonoids were not the active fractions, the active
HVPE fractions were analysed by LC-MS. Results showed that these fractions contain
saponins (Figure 2.17). The different saponins in oat shoots were purified and
accumulated using PTLC and Cl8 column chromatography. Bioassays with purified
saponins showed that 26-DGB had a greater inhibitory activity than 26-DGA, but the
crude extract had even higher activity. This indicates that there is synergistic effect
between either saponins or saponins and non-saponins fractions, which needs more
investigation.
The reason for the recovery of mycelia growth after inhibition by saponins in
the bioassays (Figures 2.14 and 2.20) deserves further study. It could be because of
either diffusion leading to effectively dilution of the concentration of 26-DGA and 26-
DGB in the medium or inactivation by fungal enzymes. Inactivation of saponins has
been observed in oat attacking isolates of Septoria avenae (Wubben et al., 1996). To
determine whether inactivation is involved it would be necessary to re-extract the
saponins from the mediurn.
TI4
4,3 Methyl jasmonate and secondary metabolites in oat plants
4.3.1 MJ and FCGs in oat
It was reported that MJ courld protect oat roots against major cereal nematodes
by inducing flavone-C-glycosides (Soriano et a1., 2004). In this study, it has been
shown that MJ could induce 12 HPLC fractions in oat cv. Quoll roots (Figure 3.2 and.
Table 3.5) but none of these were FCGs. Furthermore, the concentration of FCGs in oat
roots was too low to rneasure confidently. [n Section 3.3.2, it was shown that there was
no significant correlation between concentration of FCGs and CCN counts when
analysed in a single seed descent population generated from the cross between oat cvs.
Mortlock and Potoroo.
The effect of MJ on FCGs in oat shoots was also investigated. Although the
concentration of FCGs in oat shoots is about 350 fold more than that in oat roots
(Figure 2.12 and Tables 3,2 and 3.3), there was no induction of FCGs by MJ in any of
the independent experiments. The possibility that technical issues were responsible for
the differences between the findings in this thesis and those of Soriano et al (2004) was
eliminated. The same cultivar (Quoll) was used in all experiments (Figures 2.6,2.7 and
2.Il) to test effectiveness of MJ application. All attempts failed to repeat the results of
the earlier study, which showed that FCGs were induced by MJ.
4.3.2 MJ and the effect on other secondary metabolites in the oat roots
Exogenous application of MJ induced 12 HPLC fractions in oat roots. The
induced fractions inclucled avenacin Ã-2, avenacin B-1 and two compounds similar to
avenacosicles. Avenacins are known as antifungal compounds in oat roots (Crornbie et
al., 1986). LC-MS data indicated that there are two compounds in oat roots that are
115
very similar to avenacosides in oat shoots (Figure 3.2 and Table 3.7). This finding is
novel and highlights the complexity of secondary metabolite pathways in plants.
In an independent experiment, saponins in oat cv. Quoll shoots were purifìed
and tested against Pyrenophora teres 1. teres. The results showecl that 26-DGB and26-
DGA are two important antifungal compounds in oat shoots, which is consistent to
other reports (Wubben et al., 1996).It was shown that antifungal compounds were also
present in other oat cultivars (cvs. Potoroo, Mortlock). The induction of antifungal
compounds by MJ was shown in Mortlock and Quoll but not Potoroo based on a
bioassay experiment (Figure 2.I5).It is not known if MJ induces the saponins in oat
shoots and this needs further study. If saponins are important, screening rnore cultivars
and wild relatives will be useful as \Mas for flavonoids. To be more successful, it will be
necessary to overcome germination issues especially for the wild accessions. The lack
of germination could be due to dormancy of the seeds or loss of viability during
storage. If dormancy was case, cold treatment prior to sowing is suggested (Turk,
2005).
The results in this study provides several important areas for further research
that in future should allow plant breeders to develop lines with better resistance to
nematodes.
116
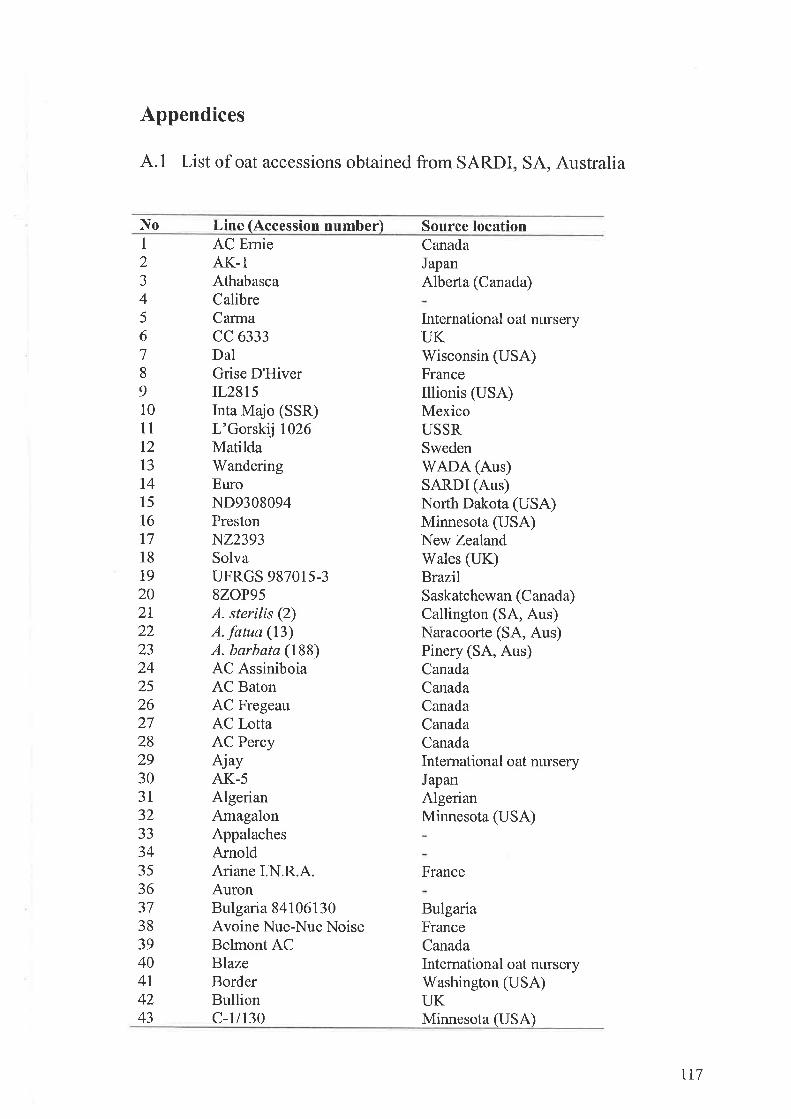
Appendices
4.1 List of oat accessions obtained from SARDI, SA, Australia
No Line (Accession number) Source locationCanadaJapanAlberta (Canada)
International oat nurseryIIKWisconsin (USA)FranceIllionis (USA)MexicoUSSRSwedenV/ADA (Aus)SARDI (Aus)North Dakota (USA)Minnesota (USA)New ZealandWales (UK)BrazilSaskatchewan (Canada)Callington (SA, Aus)Naracoorte (SA, Aus)Pinery (SA, Aus)CanadaCanadaCanadaCanadaCanadaInternational oat nlrrseryJapanAlgerianMinnesota (USA)
France
BulgariaFranceCanadaIntemational oat nurscryWashington (USA)UKMinnesota (USA)
1
2J45618910ll721374l5767718l9202I2223242526272829303132JJ343536373839404t4243
AC EmieAK-IAthabascaCalibreCarmacc 6333DalGrise D'HiverIL28I5Inta Majo (SSR)L'Gorskij 1026MatildaWanderingEuroND9308094PrestonN22393SolvaUFRGS 987015-38ZOP95A. sterilis (2)A. fatua (13)A. barbata (188)AC AssiniboiaAC BatonAC FregeauAC LottaAC PercyAjuvAK-5AlgerianAmagalonAppalachesArnoldAriane LN.R.A.AuronBulgaria 84106130Avoine Nue-Nue NoiseBelrnont ACBlazeBorderBullionc-1/130
tt7
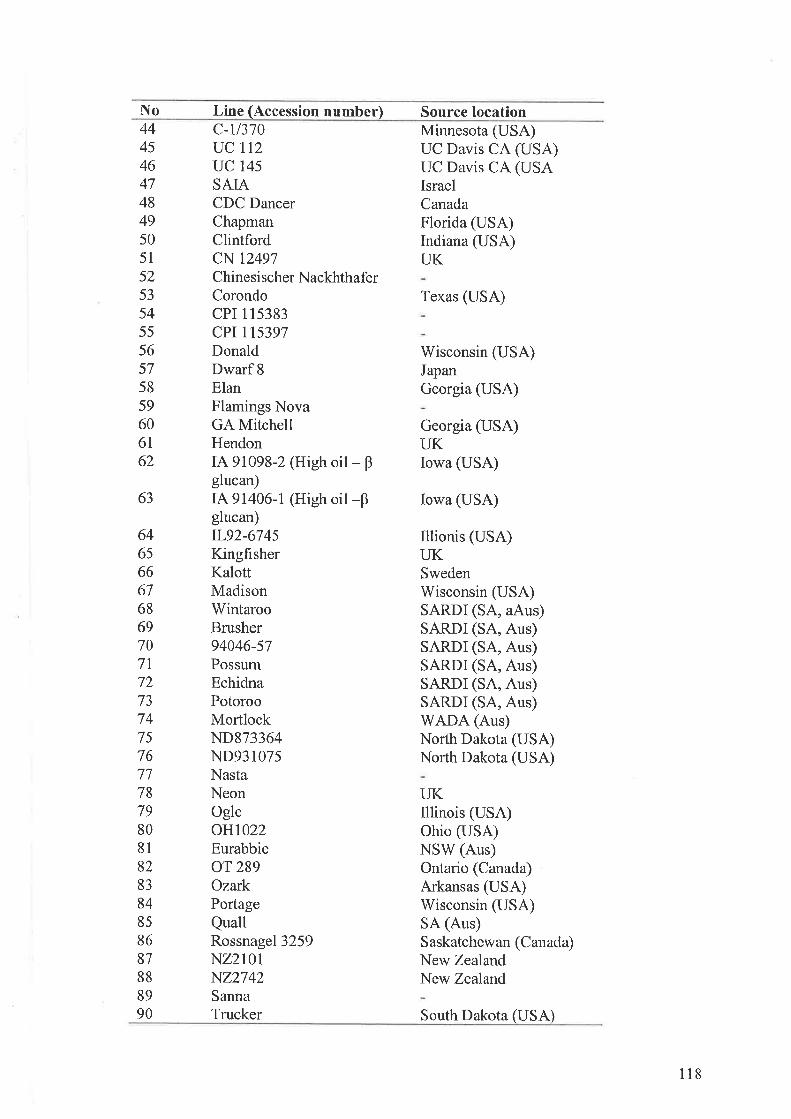
No Lile (Accession number) Source location444546474849505l5253545556575859606t62
63
c-|370UC II2UC 145SAIACDC DancerChapmanClintlordcN 12497Chinesischer NackhthaferCorondocPI 115383cPI 1 75397DonaldDwarf 8ElanFlamings NovaGA MitchellHendonIA 91098-2 (High oil - Bglucan)IA 91406-1 (High oil -pglucan)rL92-6745KingfisherKalottMadisonWintarooBrusher94046-57PossurnEchidnaPotorooMortlockND873364ND931075NastaNeonOgleoHl022EurabbieoT 289OzarkPortageQuallRossnagel 3259N22101NZ.2742SannaTrucker
Minnesota (USA)UC Davis CA (USA)UC Davis CA (USAIsraelCanadaFlorida (USA)Indiana (USA)UK
Texas (USA)
Wisconsin (USA)JapanGeorgia (USA)
Georgia (USA)UKIowa (USA)
Iowa (USA)
Illionis (USA)UKSwedenWisconsin (USA)SARDI (SA, aAus)SARDI (SA, Aus)SARDI (SA, Aus)SARDI (SA, Aus)SARDI (SA, Aus)SARDI (SA, Aus)WADA (Aus)North Dakota (USA)North Dakota (USA)
LIKIllinois (USA)Ohio (USA)NSW (Aus)Ontario (Canada)Arkansas (USA)Wisconsin (USA)SA (Aus)Saskatchewan (Canada)New ZealandNew Zealand
646566676869707I72737475767778798081828384858681888990 South Dakota (USA)
118
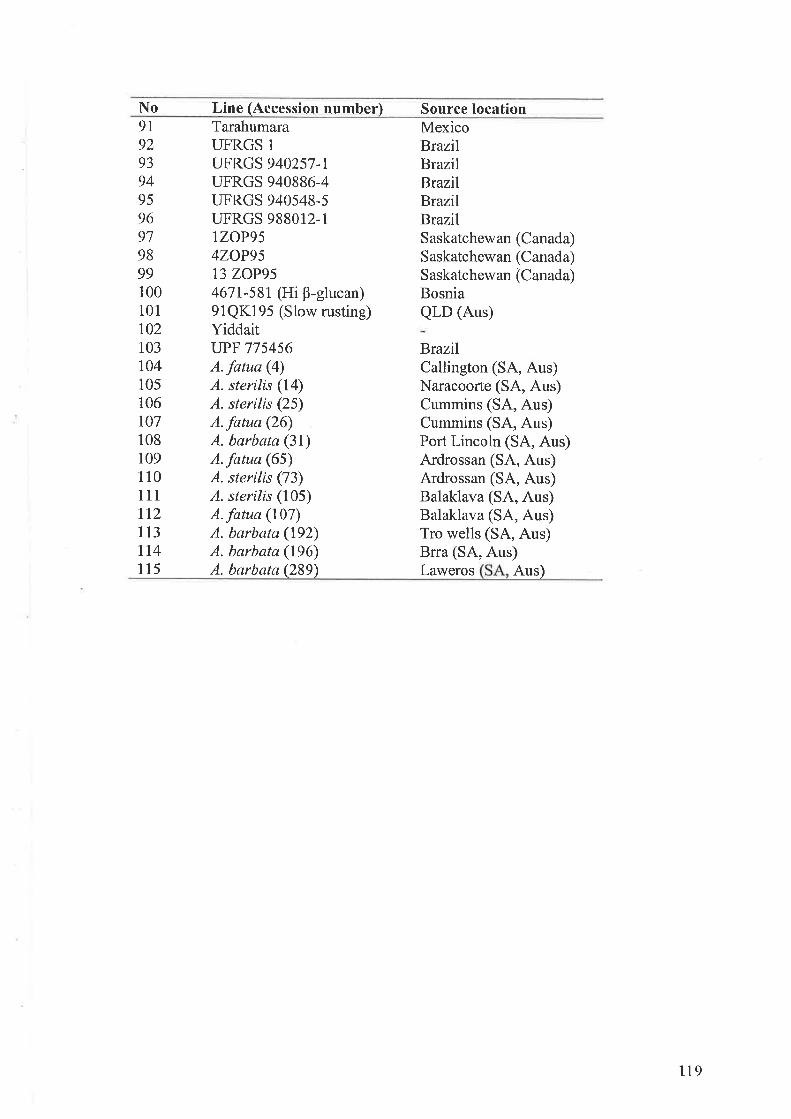
No Line (Accession number) Source location91929394959691989910010110210370410s106107108109110111712113rt4115
TarahumaraUFRGS 1
UFRGS 940257-LUFRGS 940886-4UFRGS 940548-5I.JFRGS 988012-1lzoPg54ZOP9513 ZOP954611-581(Hi p-glucan)91QK195 (Slow msting)YidclaitwF 77s4s6A. fatua (4)A. sterilis (14)A. sterilis (25)A. fatua (26)A. barbata (31)A. fatua (65)A. sterilis (73)A. sterilis (105)A. fatua (107)A. barbata (192)A. barbata (196)A. barbata (289)
MexicoBrazilB¡razilBrazilB¡razilBrazilSaskatchewan (Canada)Saskatchewan (Canada)Saskatchewan (Canada)BosniaQLD (Aus)
B¡razllCallington (SA, Aus)Naracoorte (SA, Aus)Cummins (SA, Aus)Cummins (SA, Aus)Port Lincoln (SA, Aus)Ardrossan (SA, Aus)Ardrossan (SA, Aus)Balaklava (SA, Aus)Balaklava (SA, Aus)Tro wells (SA, Aus)Brra (SA, Aus)Laweros Aus)
119
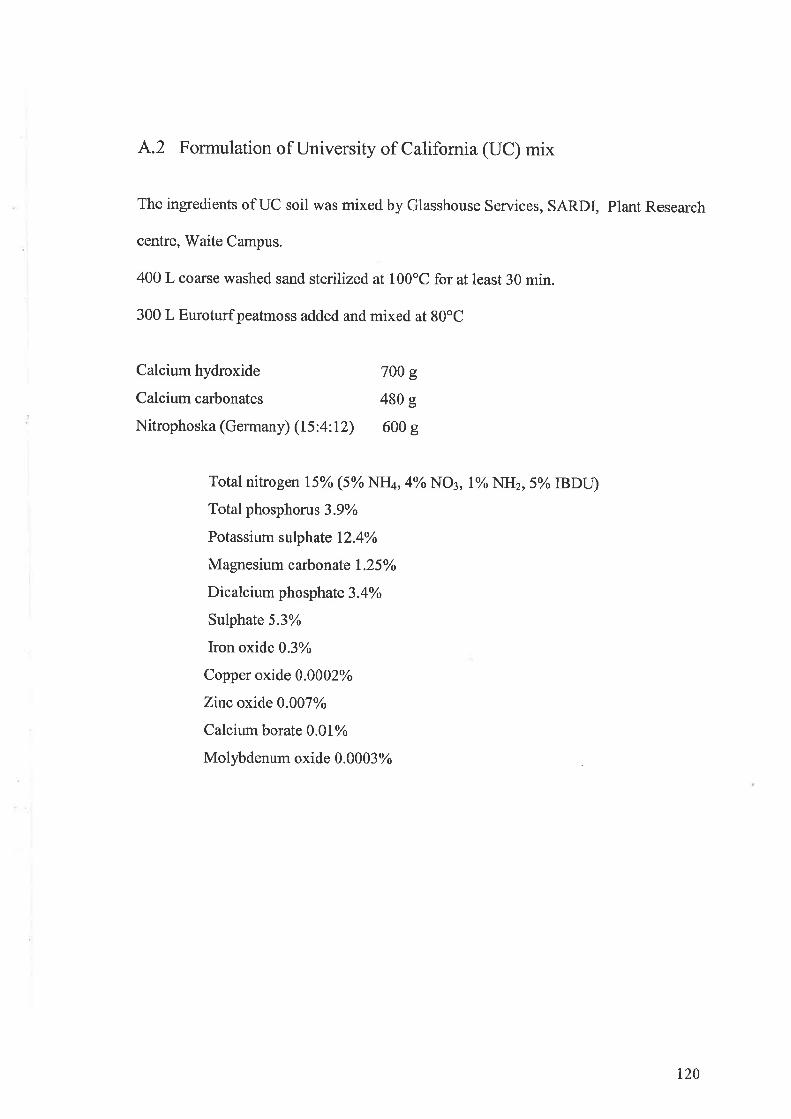
4.2 Formulation of University of Califomia (UC) mix
The ingredients of UC soil was mixed by Glasshouse Services, SARDI, Plant Research
centre, V/aite Campus.
400 L coarse washed sand sterilized. at 100'C for at least 30 min.
300 L Euroturfpeatrnoss added and mixed at 80"C
Calcium hydroxide
Calcium carbonates
Nitropho ska (German y) (I 5 :4 : 12)
700 g
480 g
600 g
Total nihogen l5%o (5% NHa, 4olo NO¡, loá NH2, 5% IBDU)
Total phosphorus 3.9%
Potassium sulphate 12.4%
Magnesiurn carbonate 125%Dicalcium phosphate 3.4%
Sulphate 5.3%
Iron oxide 0.3%
Copper oxide 0.0002%
Zinc oxide 0.007%
Calcium borate 0.U%Molybdenurn oxide 0.0003%
120
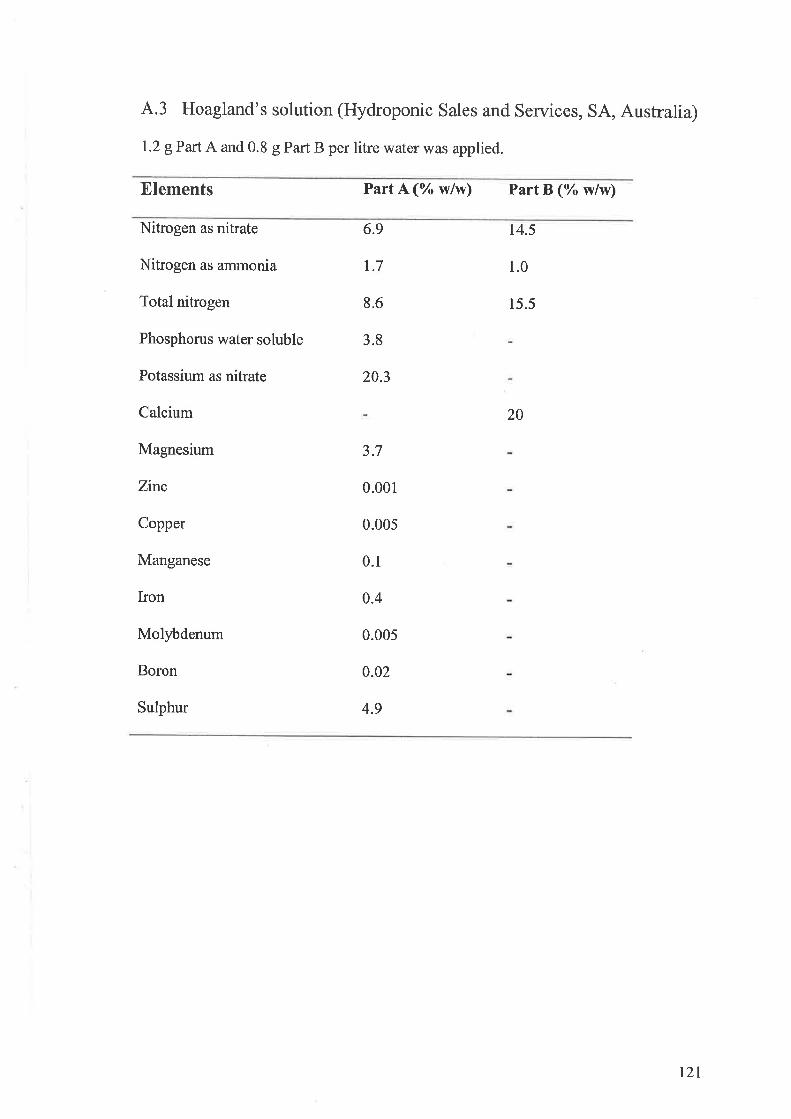
4.3 Floagland's solution (Hydroponic Sales and Services, SA, Australia)
1.2 gPart A and 0.8 g Part B per litre water was applied.
Elements Part A ('/, wlw) Part B ('/, wlw)
Nitrogen as nitrate
Nitrogen as ammonia
Total nitrogen
Phosphorus water soluble
Potassium as nitrate
Calcium
Magnesium
Zinc
Copper
Manganese
Iron
Molybdenum
Boron
Sulphur
6.9
r.7
8.6
3.8
20.3
3.7
0.001
0.005
0.1
0.4
0.005
0.02
4.9
t4.5
1.0
ls.5
20
12t
4.4 Optimising the method of FCGs extraction
44.1 Materials and methods
44,1.1 Effect of exposure time to methanol on the concentrøtion of FCGs
FCGs were extractecl from Quoll shoots (60 mg) using different lengths of time
in methanol, 12, 24,36 and 48 hr. Four replicates were performed at each time point.
After incubation, 7 ml of rnethanolic solution was taken and added to 3 ml MQ water
then exposed to 10 ml n-hexane for 48 hr to remove the lipids. Eight ml of the
methanolic phase was transferred to a 10 ml culture tube ancl evaporated using a speed
vac concentrator (Savant Instruments Inc. Hicksville, NY, USA). The residue was
redissolved in 5 rnl MQ water with a vortex mixer and 5 ml of l-butanol (HPLC grade)
was added, and shaken for 24 hr. Four ml of butanol phase was evaporated as above,
The final residue was dissolved in 0.4 ml 45Yo methanol for assay by HPLC (Section
2.2.3, gradient elution).
44.1.2 Effect of butanol on the concentrøtion of FCGs
Six samples of Quoll shoots (60 mg) were exposed to 10 ml methanol for 48 hr
and then 7 ml methanolic extract was added to 3 ml MQ water and exposed to 10 ml n-
hexane for 48 hr. Eight ml of methanolic phase of each sarnple was taken and divided
into 2 x 4 ml in l0 ml glass culture tubes. Both samples were dried using a speed vac
concentrator. The residue of one tube was dissolved in 2.5 ml MQ water and then 2.5
rnl butanol was added and incubated overnight on an orbital mixer incubator (130 rpm).
Finally 2.4 ml butanol phase was taken, dried, and then residue was dissolved in 400 ¡ll
45o/o melhanol. The residue of the other sample was dissolved in 400 ¡tl45% methanol.
Samples were analysed using HPLC method described in Section 2.2.3.
722
L4,2 Results
44.2.1 Changes ín the method of FCG extrøctíon
The extraction method of Soriano et al. (2004) usecl 48 hr methanol to extract
FCGs. To test whether it was possible to reduce the time of sample exposure to
methanol, shoot samples were treated for four different times (12, 24,36 and 48 hr).
Results indicated that there are no significant differences for peaks representing FCGs
and total FCGs among the treatments (Figure 44.1).
To see if all of the FCGs were effectively extracted into the butanol phase, a
comparison of the butanol and aqueous phase of flavonoid extraction (Section 2.2.3)
showed that FCGs were still present in the aqueous phase, which was previously
discarded (about 20% of total FCGs). The FCGs concentration in each fraction was
quantified. The aqueous fraction (without butanol) contained 28.14+1.84 mg rutin
equiv./g DW significantly (P<0.01) higher than FCGs concentration in extracted
samples with butanol (23.36+1.56 rng rutin equiv./g DW). The samples extracted by
butanol contained fewer additional peaks than samples extracted without butanol when
analysed by HPLC (data not shown). Despite the presence of other peaks, they were at
a different retention time and they did not interfere with FCG quantification. These
findings helped to save time and should provide a more accurate estimation of FCGs
than the initial experiments.
By reducing time of exposure to methanol and omitting the butanol step, two
days were saved for each extraction.
t23
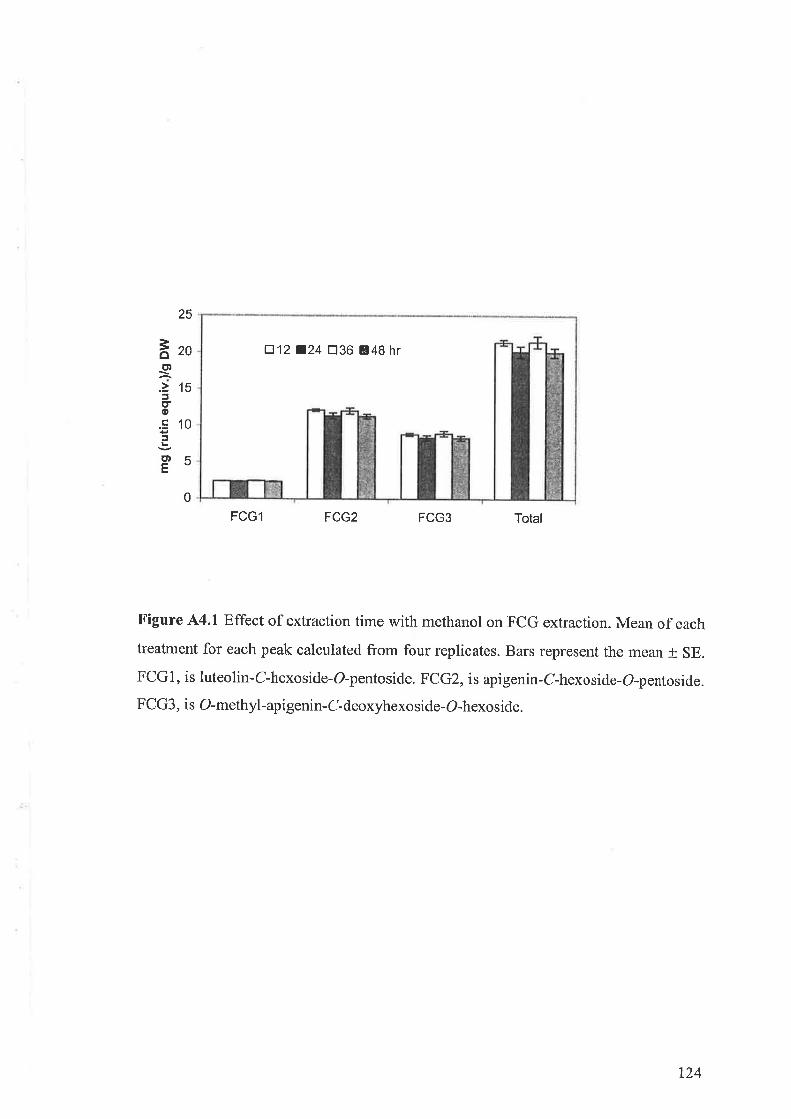
El12 a24 tr36 848 hr
25
ì.^a¿vot1.> 15cro.= 10J
E¡ ÃE"0
FCG,I FCG2 FCG3 Total
Figure 44.1 Effect of extraction time with methanol on FCG extraction. Mean of each
treatment for each peak calculated from four replicates. Bars represent the mean t SE.
FCG1, is luteolin-C-hexoside-O-pentoside. FCG2, is apigenin-C-hexoside-O-pentoside.
FCG3, is O-methyl-apigenin-C-deoxyhexoside-O-hexoside.
r24
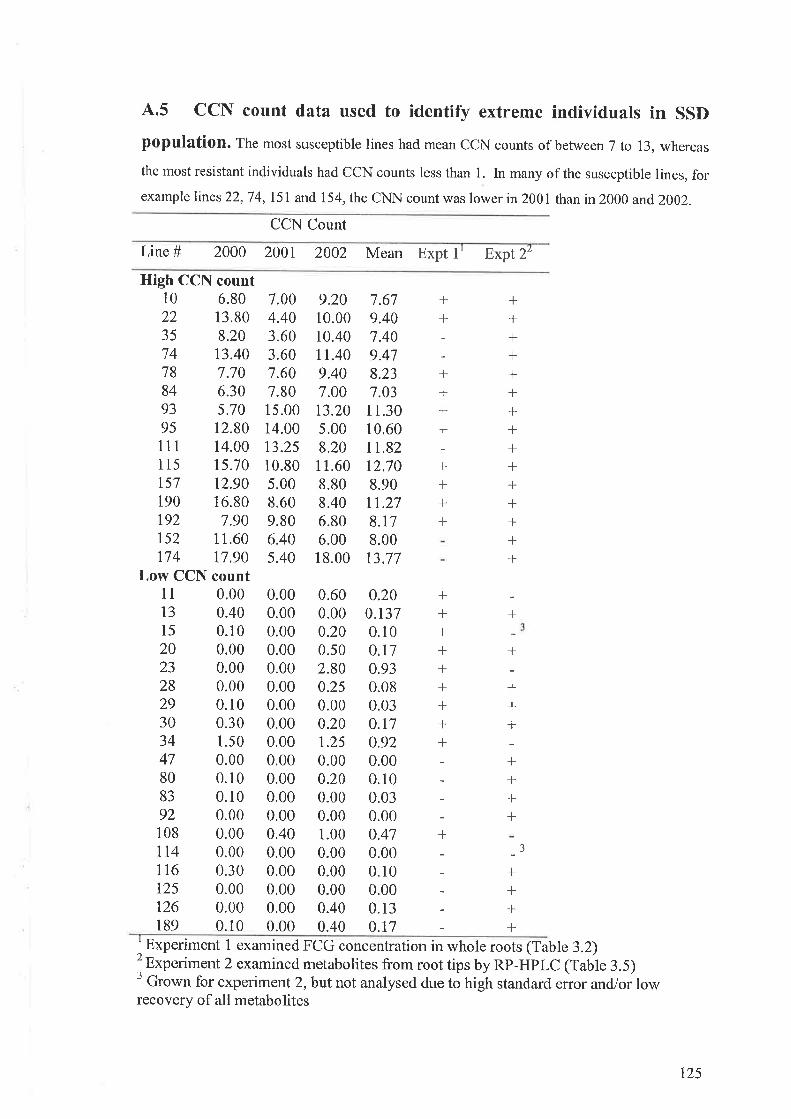
4.5 CCN count data used to identify extreme individuats in SSD
populatio[. The most susceptible lines had mean CCN counts of between 7 to 73, whereas
the most resistant individuals had CCN counts less than 1. In rnany of the susceptible lines, forexample hnes 22, 7 4, l5I and 154, the CNN count was lower in 200 I than in 2000 and, 2002.
CCN Count
Line # 2000 2001 2002 Mean Expt 1' ExpL2¿
High CCN count10 6.8022 13.8035 8.2074 t3.4078 7.7084 6.3093 5.7095 12.8011 1 14.00115 15.70Is7 1290190 16.80192 7.90t52 11.60r74 t7.90
Low CCN count1l 0.00t3 0.4015 0.1020 0.0023 0.0028 0.0029 0.1030 0.3034 1.5047 0.0080 0.1083 0.1092 0.00108 0.00lt4 0.00116 0.30t25 0.00126 0.00189 0.10
7.004.403.603.601.607.8015.0014.0013.2510.80s.008.609.806.405.40
9.2010.0010.4011.409.407.0013.20s.008.2011.608.808.406.806.0018.00
7.679.407.409.478.237.03
1 1.3010.60tt.82t2.708.9011.278.t78.0013.77
0.200.t370.10o.l70.930.080.03o.r7o.920.000.100.030.00o.4l0.000.100.000.130.77
++
;+++
++++
+++++++++++++++
+
;
+++
++++
0.000.000.000.000.000,000.000.000.000.000.000.000.000.400.000.000.000.000.00
0.600.000.200.502.800.250.000.201.250.000.200.000.001.000.000.000.000.400.40
+++++++++
;3
;+++
I
2
3
Experiment 1 examined FCG concentration in whole roots (Table 3.2)Experiment 2 examined metabolites from root tips by RP-HPLC (Table 3.5)Grown for experiment 2, but not analysed clue to high stanclard error and/or low
recovery of all metabolites
t25
References
Agrawal G K, Randeep R, Tamogami s, Yonekura M, Kubo a and saji H (2002)Chitosan activates defense/stress response(s) in the leaves of Oryza sativaseedlings. Plant Physiology and Biochemistry 40: 1061-1069
Agrios G N (2004) Plant Pathology, Ed. Fifth Elsevier Academic press
Akhtar M and Mahmood I (1994) Potentiality of phytochemicals in nematodecontrol: Areview. Bioresource Technologlt 48: I89-201
Alonso Amelot M E and Calcagno M P (2000) Modeling synergistic and antagonisticinteractions in xenobiotic cornpounds. Journal of Chemical Ecology 26: 513-531
Ambasht N K and Ambasht R S (2005) Plant responses to changing ozone and {fV-Bscenario: A review. Proceedíngs of the Indian National Science Academy partB Biological Sciences 75: 159-168
Amir J and Sinclair T R (1996) Cereal cyst nematode effects on wheat water use, andon root and shoot growth. Field Crops Research 47: 13-19
Ananieva K and Ananiev D (1997) Comparative study of the effects of methyljasmonate and abscisic acid on RNA and protein synthesis in excised cotyledonsof Cucurbita pepo L. (Zucchini). Bulgarian Journctl Plant Physiology 23: 80-90
Armah c N, Mackie A R, Roy c, Price K, osbourn A E, Bowyer p and Ladha s(1999) The membrane-peÍneabilizing effect of avenacin A-l involves theteor ganization o f b ilayer cholest er ol. B i op hy s i c al Jo ur n a t 7 6 : 28 I -29 0
Baldwin I T (1998) Jasmonate-induced responses are costly but benefit plants underattack in native populations. Proceedíngs of the National Academy of Sciencesof the United States of America 95: 81 13-81 18
Barr A R, chalmers K J, Karakousis A, Kretschmer J M, Manning s, Lance R cM, Lewis J, Jeffries s P and Langridge p (199s) RFLP mapping of a newcereal cyst nematode resistance locus in barley. Plant Breeding 117: 185-187
Barr A R, Jefferies s P, ward P, Tasker s D, Hoppo T M, Dube A and Lewis J(1994) Registration of Australian winter cereal cultivars. Avena sativa (oat) cv.Potoroo. Australian Journal of Experimental Agriculture 342 706-707
Begley M J, Crombie L, Crombie lV M L and Whiting D A (1986) The ilsolation ofavenacins A-I A-2 B-1 and B-2 chernical defenses against cereal take-alldisease structure of their aglycones the avenestergenins and their anhydrodirners. Journal of the Chemical Society Perkin Transactions I 17: 1905-1916
r26
Beltrano J, Ronco iVI G, Montaldi E R and Carbone A (1998) Senescence of flagleaves and ears of wheat hastenecl by methyl jasmonate. Journal o/ PlantGrowth Reg,ilation l7z 53-57
Berenbaum M and Neal J J (1985) Synergism between myristicin and xanthotoxin anaturally cooccurring plant toxicant. Journal of Chemical Ecology ll: 7349-1 358
Bertini L, Leonardi L, Caporale C, Tucci M, Cascone N, Berardino I D,Buonocore V and Caruso C (2003) Pathogen-responsive wheat PR4 genes areinduced by activators of systemic acquired resistance and wounding. PlantScience 164z 1067-1078
Binns S E, Inparajah r, Baum B R and Arnason J T (2001) Methyl jasrnonateincreases reported alkamides and ketoalkene/ynes in Echinacea pallida(Asteraceae). Phytochemistry 51 : 477 -420
Biondi s, Scararnagli S, Capitani F, Altamura M M and Torrigiani p (2001)Methyl jasmonate upregulates biosynthetic gene expression, oxidation andconjugation of polyamines, and inhibits shoot formation in tobacco thin layers.Journal of Experimental Botany 522 23I-242
Bleddyn Hughes H, Morrissey J P and Osbourn A E (2004) Characterization of thesaponin hydrolysing enzylne avenacoside-a-1-rhamnosidase from the fungalpathogen of cereals, Stagonospora avenae. European Journul of PlantPathology 110: 421-427
Bleecker A B, Estelle M A, Somerville C and Kende H (1988) Insensitivity toethylene conferred by a dorninant mutation in Arabidopsis thaliana. Science,USA 24l: 1086-1089
Bower N I, Casu R E, Maclean I) J, Reverter A, Chapman S C and Manners J M(2005) Transcriptional response of sugarcane roots to methyl jasmonate, PlantScience 168z 761-772
Bowyer P, Clarke B R, Lunness P, Daniels M J and Osbourn A E (1995) Hostrange of a plant pathogenic fungus deterrnined by a saponin detoxifyingenzyme. Science 267 z 37 I -37 4
Bravo J M, Campo S, Murillo I, Coca M and San Segundo B (2003) Fungus- andwound-induced accumulation of mRNA containing a class II chitinase of thepathogenesis-related protein 4 (PR-4) family of maize. Plant Molecular Biology522 745-759
Brennan J P and iVlurray G M (1988) Australian wheat diseases - assessing theireconomic importance. Agricultural Science lz 26-35
Broeckling C D, Huhman D V, Farag M A, Smith J T, May G D, Mendes P, DixonR A and Sumner L W (2005) Metabolic profiling of Medicago truncatula ceTl
I27
cultures reveals the effects of biotic and abiotic elicitors on metabolism. Journalof Experimental Botany 56: 323-336
Burkhardt H J, Maizel J Y and Mitchell H K (1964) Avenacin, an antimicrobialsubstance isolated from Avena sativa.II. Structure. Biochemistry 3: 424-426
Campbell M M and Sederoff R R (1996) Variation in lignin content and composition.Mechanisms of control and irnplications for the genetic improvement olplants.Plant Physiology 110: 3-13
Carter J P, Spink J, Cannon P F, Daniels M J and Osbourn A E (1999) Isolation,charactenzation, and avenacin sensitivity of a diverse collection of cereal-root-colonizing'fungi. Apptied and Environmental Microbíologt 65: 3364-3372
Caruso C, Chilosi G, caporale C, Leonardi L, Bertini L, Magro P and BuonocoreY (1999) Induction of pathogenesis-related proteins in germinating wheat seedsinfected with Fusarium culmorum. Plant Science Limerick l40z 87 -97
Cavaliere C, Foglia P, Pastorini E, Sarnperi R and Lagana A (2005) Identificationand mass spectrornetric characterization of glycosylated flavonoids in Triticumdurum plants by high-performance liquid chromatography with tandem massspectrometry . Rapid Communicøtions in Mass Spectrometry 19: 3 1 43-3 1 5 8
Chen Y F, Etheridge N and Schaller G E (2005) Ethylene signal transcluction. Annalsof Botany 95:901-915
Cheong J, 'Wallwork H and lYilliams K J (2004) Identification of a major QTL foryellow leaf spot resistance in the wheat varieties Brookton ancl Cranbrook.Australian Journal of Agricultural Research 55:315-319
Chitwood D J (2002) Phlochernical based strategies for nematode control. AnnualReview of Phytopathology 4Oz 221-249
Christensen A B, Gregersen P L, Olsen C E and Collinge D B (1998) A flavonoid 7-o-methyltransferase is expressed in barley leaves in response to pathogen attack.Plant Molecular Biology 362 219-227
Cowan M M (1999) Plant products as antimicrobial agents. Clinical MicrobiologyReviews l2z 564-582
Creelman R A and Mullet J E (1995) Jasmonic acid distribution and action in plants:regulation during development and response to biotic and abiotic stress.Proceedings of the National Academy of Sciences of the \Jnited States ofAmerica 922 4114-4719
Crombie L, Crombie W M L and Whiting D A (1986) Structures of the oat rootresistance factors to take-all disease avenacins A-1, A-2, B-1 and B-2 and. theircompanion substances. Journal of the Chemical Society Perkin Transactions Illz I9l1-1922
128
Crombie L, Crornbie lV IVI L and Whiting D A (1987) The chemical defences of oatroots against 'take-all' disease. In: Biologically uctive natural proclucts,Hostettmann K, Lea PJ (eds). oxford university press, oxford. pp 245-259
Crombie W M L and Crombie L (1986) Distribution of avenacins A-1, A-2, B-l andB-2 in oat Avena sativa roots their fungicidal activity towards take-all fungusGaeumannomyces graminis. Phytochemistry 25: 2069-207 4
Crombie \M M L, Crombie L, Green J B and Lucas J A (1986) pathogenicity oftake-all fungus to oat: its relationship to the concentration and detoxif,rcation ofthe four avenacins. P hytochemis t ry 25: 207 5 -2083
Cunha F R, Oliveira D F and Campos Y P (2003) Nematocidal plant extracts andpurification of active ingredients of Leucaena leucocephala extract.Fitopatologia Brasileira 28:- 438-441
Curl C L, Price K R and Fenwick G R (1935) The quantitative estimation of saponinin pea (Pisum satiwtm L.) and soya(Glycine max). Food Chemistry l8z 241-250
Das N P and Pereira T A (1990) Effects of flavonoids on therrnal autoxidation ofpalm oil: structure activity relationships. Journal of American Oil chemistsSociety 67:255-258
Datta K, Velazhahan R, oliva N, ona r, Mew T, Khush G S, Muthukrishnan Sand Datta S K (1999) Over-expression of the cloned rice thaumatin-like protein(PR-J) gene in transgenic rice plants enhances environmental friendly resistanceto Rhizoctonia solani causing sheath blight disease. Theoretical and ApptieclGenetics 98: 1138-1 145
Deacon J W and Mitchell R T (1985) Toxicity of oat root extracts ancl saponins tozoospores of Pythium spp and other Fungi. Transactions of the BritishMycological Society 84: 479-488
Deepak M, Dipankar G, Prashanth D, Asha M K Amit A and venkataraman B v(2002) Tribulosin and beta-sitosterol-D-glucoside, the anthelmintic principles ofTribulus terres tris. Phytomedicine 9 z 7 53 -7 5 6
Dillon v M, overton J, Grayer R J and Harborne J B (1997) Differences inphytoalexin response among rice cultivars of different resistance to blast.Phytochemistry 44: 599-603
Dixon R A (2001) Natural products and plant disease resistance. Natrtre London 4llz843-847
Dixon R A, Achnine L, Kota P, Liu c J, Reddy M s S and wang L J (2002) Thephenylpropanoicl pathway and plant defence - a genomics perspective.Molecular Plant Pathology 3z 371-390
Dixon R A and Paiva N L (1995) Stress-induced phenylpropanoid metabolism, PlantCell Tz 1085-1097
129
Dixon R A and Steele C L (1999) Flavonoids and isoflavonoids - a gold mine formetabolic engineering. Trends in Plant Science 4:394-400
Dreyer D L and Jones K C (1931) Feeding deterrency of flavonoids and relatedphenolics towards Schizaphis graminum and Mynts persicae: Aphid feedingcleterrents in wheat. Phytochemistry 202 2489-2493
Elliger c A, chan B G,'waiss A c, Lundin R E and Haddon w F (19s0) c-glycosylflavones from Zeø müys that inhibit insect developments.P hyto ch em is try 19 z 293 -297
Elliger C A and Halloin J M (1994) Phenolics induced in Beta vulgaris byRhizo ctonia s olani infection. P hyto chemis try 37 z 69 I -693
Ernmons C L and Peterson D M (2001) Antioxidant activity and phenolic content ofoat as affected by cultivar and location. crop science 4lz 1676-1681
Estiarte M, Penuelas J, Kimball B A, Hendrix D L, Pinter p J, Wall G W,LaMorte R L and Hunsaker D J (1999) Free-air COz enriclrnent of wheat:Leaf flavonoid concentration throughout the growth cycle. PhysiologiaPlantarum 105:423-433
Farmer E E, Johnson R R, and Ryan C ^
(1992) Regulation of expression ofproteinase inhibitor genes by methyl jasmonate and jasmonic acid. PlantPhysiology 98: 995-1 002
Farmer E E and Ryan C A (1990) Interplant communication: airborne methyljasmonate induces synthesis of proteinase inhibitors in plant leaves.Proceedings of the National Academy of Sciences of the United States ofAmerica 872 7713-7716
Federer W T' Reynolds M and Crossa J (2001) Combining results from augrnenteddesigns over sites. Agronomy Journal g3: 389-395
Finckh U, Lingenfelter P A and Myerson D (1991) Producing single-stranded DNAprobes with the Taq DNA polymerase a high yielct protocol. Biotechniques l0z35-36
Forslund K, Pettersson J, Bryngelsson T and Jonsson L (2000) Aphicl infestationinduces PR-proteins differently in barley susceptible or resistant to thebirdcheny-oat aphid (Rhopalosiphum padi). Physíologia Plantarum ll0z 496-502
Giebel J (1979) Biochemical mechanisms of plant resistance to nematodes. PraceNattkowe Instytutu Ochrony Roslin2lz 189-212
Glazebrook J (2001) Genes controlling expression of defense responses in Arabidopsis-200I status. Current Opinion in Plant Biology 4: 301-308
130
Goodwin R H and Pollock B M (1954) Studies on roots. I. Properties and distributionof fluorescent constituents in Avena sativa. Amerícan Journal of Botany 4lz516-520
Grainger J (1956) The control of Dìtylenchus dipsaci on oat. Nematologica 7:277-282
Grayer R J and Harborne J B (1994) A survey of antifungal compounds from higherplants, 1982-1993. Phytochemistry 312 19-42
Grayer R J, Harborne J B, Kimmins F M, stevenson p c and wijayagunasekeraH N P (1994) Phenolics in rice phloem sap as sucking deterrents to the brownplanthopper, Nilaparvata lugens. Acta Horticulturae 39lz 691-694
Grayer R J, Kimmins F M, Padgharn D E, Harborne J B and Rao D v R (lggz)Condensed tannin levels and resistance of groundnuts (Arachis hypogaea)against Aphis cruccivora. Phytochemistry 3lz 3795-3800
Grunweller S and Kesselmeier J (1985) Charactenzation of a memberane bound B-glucosidase responsible the activation of oat leaf saponins. Phytochemistry 24:794t-t943
Gus-Mayer s, Brunner H, schneider Poetsch H A \ü and Rudiger w (rgg4)Avenacosidase from oat: purification, seqllence analysis and biochemicalcharacterization of a new member of the BGA family of beta-glucosidases.Plant Molecular B iology 26: 909 -92I
Guyot s, noco T, souquet J M, Moutounet M and Drilleau J F (1997)Charactenzation of highly polymerized procyanidins in cider apple (Malussylvestris var. kermerrien) skin and pulp. Phytochemistry 44:35r-357
Haralarnpidis K, Bryan G, Qi X, Papadopoulou K, Bakht s, Melton R andOsbourn A (2001) A new class of oxidosqualene cyclases directs synthesis ofantimicrobial phytoprotectants in monocots. Proceedings of the NationalAcademy of sciences of the united states of America 98: 13431-13436
Harborne J B and \üilliams C A (2000) Advances in flavonoid research since 1992.Phytochemistry 552 48 I -504
Hayashi H, Iluang P and Inoue K (2003) Up-regulation of soyasaponin biosynthesisby methyl jasmonate in cultured cells of Glycyrrhiza glabra. Plant and CellPhysiology 44l.404-4ll
Heijari J, Nerg A M, Kainulainen P, viiri H, vuorinen M and Holopainen J K(2005) Application of methyl jasmonate reduces growth but increases chemicaldefence and resistance against Hylobius abietis in Scots pine seedlings.Entomologia Experimentalis et Applicata 115: I 17-124
Heil M (2002) Ecological costs o1 induced resistance. Current Opiníon in PlantBiology 5: 345-350
131
Ifeim K E, Tagliaferro A I{ and Bobilya D J (2002) Flavonoid antioxidants:chemistry, metabolism and structure-activity relationships. Journal ofNutritional Bio chemistry 13 : 572-584
Iloffmann-Somrnergruber K (2002) Pathogenesis-relatecl (PR) proteins identifi ed asallergens. Biochemical Society Transactiozs 30: 930-935
Hollaway G J (2002) Effect of oat (Avena sativa) on the population density ofPratylenchus thorneí in the field. Australasian Plant Pathology 3lz 147-149
Hostettmann K A and Nlarston A (1995) Saponins. Chemistry and pharmacology ofnatural products. cambridge, New York : cambridge, university press.
Hu X, Bidney D L, Yalpani N, Duvick J P, crasta o, Folkerts o and Lu G H(2003) Overexpression of a gene encoding hydrogen peroxide-generatingoxalate oxidase evokes defense responses in sunflower. Plant Physiology 133:170-1 8 1
Huang J S and Barker K R (1991) Glyceollin I in soybean-cyst nematode interactionsspatial and temporal distribution in roots of resistant and susceptible soybeans.Plant Physiology 962 1302-1307
Ishihara A, Ogura Y, Tebayashi S and Iwamura H (2002) Jasmonate-inducedchanges in flavonoid metabolisrn in barley (Hordeum vulgare) leaves.B io s ci ence, B i ot e c hnol o gy a nd B ioch em is try 66 : 2I7 6 -2I 82
Jenner H, Townsend'B and Osbourn A (2005) Unravelling triterpene glycosidesynthesis in plants: phytochemistry and functional genomics join forces . Planta220:503-506
Kesselmeier J and Strack D (1981) High pert'onnance liquid chrornatographicanalysis of steroidal saponins from Avena sativa L. Verlag cler Zeitschrift JiirNaturfo rs chun g 3 6c z 107 2 - I 07 4
Kesselmeier J and Urban B (1983) Sub cellular localization of saponins in green andetiolated leaves and green protoplasts of oat Avena-sativa. Protoplasma ll4z133-140
Koda Y, Kikuta Y, Kitahara T, Nishi T and Mori K (1992) Comparisons of variousbiological activities of stereoisorners of methyl jasrnonate. Phytochemistry 3l:1111-1114
Kohli R K' Singh II P and Batish D R (2001) Allelopathy in agroecosystems. FoodProclucts Press
Konagai K, sakamoto K, usami r, Amemiya y and shishido M (2005) Effect ofwild oat green manure on soil rnicroflora and diseases of tomato. JapaneseJournal of Phytopathology 71: 101-110
132
Kretschmer J M, Chalmers K J, Manning S, Karakousis A, Barr A R, Islarn A KM R, Logue S J, Choe Y W, Barker S J, Lance R C M and Langridge p(1997) RFLP mapping of the Ha2 cercal cyst nematode resistance gene inbarley. Theoretical and Applied Genetics 94: 1060-1064
Laudenbach U and Kesselmeier J (1982) Some observations on the saponinacumulation in oat seedlings and on the transformation of the avenacosides tothe antibiotic 26-desgluco-avenacosides. Verlag der Zeitschri/t _fürNaturfors chung 37 cz 1 095 - 1 099
Lee E A, Byrne P F, McNlullen M I), Snook M E, Wiseman B R, Widstrom N Wand Coe E H (1998) Genetic mechanisms underlying apimaysin and maysinsynthesis and corn earworTn antibiosis ín maize (Zea mays L.). Genetics 149¿1997-2006
Lewis J G, Mckal A C, Matic M and Debicki A (1999) A rapid method to screen forresistance to cereal cyst nernatode. In 12th Australasian plant pathology.Austalasian Plant Pathology Society, Canberra, Conference proceedings, p 155
Li L' Li C Y' and Howe G A (2001) Genetic analysis of wound signaling in tomato.Evidence for a dual role ofjasmonic acid in defense and female fertility. PlantPhysiology 127 z 1414-1417
Liljeroth E, Santen K and Bryngelsson T (2001) PR protein accumulation in seminalroots of barley and wheat in response to fungal infection - the importance ofcortex senescence. Journal of Phytopathology 1492 447-456
Lin K C, Bushnell W R, Szabo L J and Smith A G (1996) Isolation and expressionof a host response gene family encoding thaumatin-like proteins in incornpatibleoat-stem rust fungus interactions. Molecular Plønt Mícrobe Interactiony 9: 5l 1-522
Lozovaya v v, Lygin A v, zernova o v, Li s, Hartman G L and widholm J M(2004) Isoflavonoid accumulation in soybean hairy roots upon treatment withFusarium solani. Plant Physiology and Biochemistry 422 671-679
Luning H U (1975) Saponins in Avena sativa and their importance in the mechanisrnof resistance to pathogenic ftrngi. Dissertation, Bonn University
Luning H U and Schlosser E (1976) Role of saponins in antifungal resistance VI.Interactions Avena sativct - Drechslera avenacea. Zeitschrift furPfl anz e n kr øn k h ei t e n un d Pfl anz e n s chu tz 83 z 3 I 7 -3 27
Luning H U, Waiyaki B G and Schlosser E (1978) Role of saponins in antifungalresistance VIII. Interactions Avena sativa - Fusarium avenaceLtm.P hytopatho logis che Z eits chrift 922 338-3 45
Macel M, Bruinsma M, Dijkstra s M, ooijendÍjk r, Niemeyer Ir NI andKlinkhamer P G L (2005) Differences in effects of pyrrolizidine alkaloids onfive generalist insect herbivore species. Journal of Chemical Ecology 3lz 1493-1508
133
Maizel J V, Burkhardt H J and Mitchell H K (1964) Avenacin, an antimicrobialsubstance isolated ftom Avena sativa. I. Isoiation ancl antimicrobial activity.Biochemistry 3 : 424-426
IVlarkham K R, Tanner G J, Caasi Lit M,'Whitecross M I, Murali N and MitchellK A (1998) Possible protective role for 3',4'-dihydroxyflavones induced byenhanced UV-B in a UV-tolerant rice cultivar. Phytochemistry 49: 1913-1919
Martens S, Knott J, Seitz c A, Janvari L, Yu s N and Forkmann G (2003) Impactof biochemical pre-studies on specific metabolic engineering strategies offlavonoid biosynthesis in plant tissues. Biochemical Engíneering Jottrnal 14:227-235
Martin E M, Eastwood R F and ogbonnaya F c (2004) Identification ofmicrosatellite markers associated with the cereal cyst nematode resistance geneCre3 in wheat. Australian Journal of Agricultural Research 55: 1205-I2II
Martin R S and Magunacelaya J C (2005) Control of plant-parasitic nematodes withextracts of Quillaja saponaria, Nemøtology 7: 571-585
Mayama s, Tani T, Matsuura Y, ueno T and Fukami H (1981) The production ofphytoalexins by oat in response to crown rust, Puccinia coronafa f. sp. avenae.Physiological Plant Pathology 19 z 217 -226
Miksch M and Boland \ry (1996) Airbome methyl jasmonate stimulates thebiosynthesis of furanocoumarins in the leaves of celery plants (Apiumgraveolens). Experientia 522 7 39 -1 43
Miyagawa H, rshihara A, Kuwahara Y, ueno T and Mayama s (1996) A stresscompound in oat induced by victorin, a host-specific toxin frornHe lmin thos p ori um v ict o ri ae. P hy t o ch emís t ry 47 z I 47 3 -l 47 5
Mor M, cohn E and Spiegel Y (1992) Phenology, pathogenicity and pathotypes ofcereal cyst nematodes, Heterodera ayenae and, Heterodera latipons (Nematoda:Heteroderidae) in Israel. Nematologica 382 494-501
Moriguchi r, Kita M, Tomono Y, Endo rnagaki r and omura M (2001) Geneexpression in flavonoid biospthesis: correlation with flavonoid accumulation indeveloping citrus fruit. Physiologia Plantarum lll:66-74
Morrissey J P' Wubben J P and Osbourn A E (2000) Stagonospora avenae secretesmnltiple enzymes that hydrolyze oat leaf saponins. Molectilar Plant MicrobeInteractions 13: 1041-1052
Nisius A (1988) The stromacentre inAvena plastids: an aggregation ofbeta glucosidaseresponsible for the activation of oat-leaf saponins. Planta 173: 414-481
134
ogbonnaya F c, seah s, Delibes A, Jahier J,Lopez Brana r, Eastwood R F andLagudah E S (2001) Molecular-genetic characterisation of a new nematoderesistance gene in wheat. Theoretical and Appliecl Genetics 102 623-629
Oka Y (2001) Nernaticidal activity of essential oil components against the root-knotnematode Meloidogyne javanica. Nematology 3: 159-164
Oka Y' Chet I and Spiegel Y (1997) An irnmunoreactive protein to wheat-germagglutinin antibody is induced in oat roots following invasion of the cereal cystnematode Heterodera avenae, and by jasmonate. Molecular Plant MicrobeInteractions 10: 961-969
okazaki Yr rsobe T, rwata Y, Matsukawa T, Matsuda F, Miyagawa H, rshihara A,Nishioka T and Iwamura H (2004) Metabolism of avenanthramidephytoalexins in oat. Plant Journal3gz 560-572
Onning G and Asp N G (1996) Analysis, heat stability and physiological effects ofsaponins from oat. Advanced Experimental Medical Biologt 405z 365-375
Onning G, Asp N G and Sivik B (1993) Saponin content in different oat varieties andin different fractions of oat grain. Food Chemistry 48: Z5l-254
Osbourn A (1996) Saponins and plant defence - a soap story. Trends in Plant Sciencet| 4-9
Osbourn A E (199ó) Preforrned antimicrobial compounds and plant defense againstfungal attack. Plant Cell 8: 1821-1831
Osbourn A E (2001) Plant mechanisms that give defence against soilborne diseases.Australasian Plant Pathology 302 99-102
Osbourn A E (2003) Molecules of interest: saponins in cereals. Phytochemistry 622 l-4
Osbourn A E, Clarke B R, Dow J M and Daniels M J (1991) Partial characterizationof avenacinase from Gaeumannomyces graminis var. avenae. Physiological anclMolecular Plant Pathology 38: 301-312
osbourn A E, clarke B R, Lunness P, scott P R and Daniels M J (1994) An oatspecies lacking avenacin is susceptible to infection by Gaeumannlmycesgraminis var. tritici. Physiological and Moleailar Plant Pathology 45:457-461
Osbourn A E, Qi X Q, Townsend B and Qin B (2003) Dissecting plant secondaryrnetabolism - constitutive chemical delences in cereals. New Phytologist l59z101 -108
Padmavati M and Reddy A R (1999) Flavonoid biosynthetic pathway and cerealclefence response: An emerging trend in crop biotechnoloy. Journut oJ PtantBiochemistry and Biotechnology 8z 15-20
135
Padmavati M, sakthivel N, Thara K Y and Reddy A R (1997) Diff,erentialsensitivity of rice pathogens to growth inhibition by flavonoids. Phytochemistry46:499-502
Pannala A S, Chan T S, OrBrien P J and Rice Evans C A (2001) Flavonoid B-ringchemistry and antioxidant activity: Fast reaction kinetics. Biochemical anclB iophysi cal Res e arch Communicati ons 282t 71 6 1 - 1 1 68
Papadopoulou K, Melton R E, Leggett M, Daniels M J and osbourn A E (1999)Comprornised disease resistance in saponin-deficient plants. Proceedings of theNational Academy of Sciences of the United States of America 96: 12923-12928
Peterson D M (2001) Oat antioxidants. Journal of Cereal Science 332 Il5-129
Peterson M, Brodersen P, Naested H, Andreasson E, Lindhart U, Johansen B,Nielsen H B, Lacy M, J. A M, Parker J E, Sharma S B, Klessig I) F,Martienssen R, Mattsson o, Jenesen A B and Mundy J (2000) ArabidopsisMAP Kinase 4 negatively regulates systemic acquired resistance. Celt l03z1111-1120
Plowright R A, Grayer R J, Gilt J R, Rahman M L and Harborne J B (1996) Theinduction of phenolic compounds in rice after infection by the stem nematodeDitylenchus angustus. Nematologica 422 564-578
Potter M J, Yanstone v A, Davies K A, Kirkegaard J A and Rathjen A J (1999)Reduced susceptibility of Brassica napus to Prøtylenchus neglectus in plantswith elevated root levels of 2-phenylethyl glucosinolate. Journal of Nematology3l:291-298
Punyasiri P A N, Abeysinghe I S B, Kumar V, Treutter D, Duy D, Gosch C,Martens S, Forkmann G and Fischer T C (2004) Flavonoid biospthesis inthe tea plant Camellia sinensis: properties of enzymes of the prorninentepicatechin and catechin pathways. Archives of Biochemistry and Biophysics43lz 22-30
Qi X, Bakht S, Leggett M, Maxwell C, Melton R and Osbourn A (2004) A genecluster for secondary metabolisrn in oat: Implications for the evolution ofmetabolic diversity in plants. Proceedings of the National Academy of Sciencesof the United States of America 101: 8233-8238
Quidde T, Buttner P and Tudzynski P (1999) Evidence for three different specificsaponin-detoxifying activities in Botrytis cinerea and cloning and functionalanalysis of a gene coding for a putative avenacinase. European Journal of PlantPathology l05z 273-283
Rao M s, Reddy P P, Mittal A, chandravadana M v and Nagesh M (1996) Effectof sorne secondary plant metabolites as seed treatment agents againstMeloidogyne incognita on tomato. Nematologia Mediterranea 242 49-5I
t36
Rathjen A J, Eastwood R F, Lewis J G and Dube A J (1998) Breecling wheat forresistance to Heterodera avenae in southeastem Australia. Euphyticct l00: 55-62
Rich J R, Keen K T and Thomason I I (1977) Association of coumestans with thehypersensitivity of Lirna bean roots to Pratylenchus scribneri. PhysiologicalPlant Pathology 10: 105-116
Ryals J, Uknes S and Ward E (1994) Systemic acquired resistance. Plant Physiology104:1109-1112
Ryan c A and Moura D s (2002) systemic wound signaling in plants: A newperception. Proceedings of the National Acødemy of Sciences of the UnitedStates of America 992 6519-6520
Ryan K G, Swinny E E, Markham K R and winefield c (2002) Flavonoid geneexpression and [fV photoprotection in transgenic and mutant Petunia leaves.Phytochemistry 592 23 -32
Safari E, Gororo N N, Eastwood R F, Lewis J, Eagles rr A and Ogbonnaya F c(2005) Impact of Crel, CreS and Cre3 genes on cereal cyst nematode resistancein wheat. Theoretical and Applied Genetics 7702 567-572
Sakanaka S, Kim M, Taniguchi M and Yamamoto T (1989) Antibacterialsubstances in Japanese green tea extract against Streptococcus mutans acariogenic bacterium. Agricultural and B iologi cal Chemistry 53 : 23Ol -23 72
SARDI (2000) Variety: 'Quoll'. Application no: 98/185. Plant Varieties Journal l3zr4-t5
Sasaki Y, Asamizy E, Shibata D, Nakamura Y, Kaneko T, Awai K, Amagai M,Kuwata C, Tsugane T, Masuda T, Shimada H, Takamiya K, Ohta H andTabata S (2001) Monitoring of methyl jasmonate-responsive genes inArabidopsrs by cDNA macroarray:Self-activation ofjasmonic acid biosynthesisand crosstalk with other phytohormone signaling pathways. DNA Reseqrch 8z153- 161
schijlen E G w M, Vos C H R d, Tunen A JY and Bovy A G (2004) Modifrcationof flavonoid biosynthesis in crop plants. Phytochemistry 6s:263r-2648
Schweizer P, Buchala A, Dudler R and Metraux J P (1998) Induced systemicresistance in wounded rice plants. Plant Journal l4z 475-48I
Schweizer P, Buchala A, Silverman P, Seskar lVt, Raskin I and Metraux J P (1992)Jasmonate-inducible genes are activated in rice by pathogen attack without aconcomitant increase in endogenous jasmonic acid levels. Plant Physiologyll4:79-88
Seah S, Miller C, Sivasithamparam K and Lagudah E S (2000) Root responses tocereal cyst nernatode (Heterodera avenae) in hosts \ilith different resistancegenes. New Phytologist 146z 521-533
137
sebesta J, zwntz B, Roderick H w, corazza L, starryk M H, Reitan L andLoskutov I (2001) Incidence of Pyrenophora ctvencte Ito et Kurib. in Europebetween 1994-1998, and the varietal reaction of oat to it. Plant ProtectionScience 31:91-95
Shimada N, Akashi T, Aoki T and Ayabe S (2000) Induction of isoflavonoidpathway in the model legume Lotus japonictts: molecular charactenzation ofenzymes involvecl in phytoalexin biosynthesis. Plant Science 160:37-47
shimada N, Aoki r, sato s, Nakamura y, Tabata s and Ayabe s (2003) A clusterof genes encodes the two types of chalcone isomerase involved in thebiosynthesis of general flavonoids and legume-specific 5-deoxy(iso)flavonoidsin Lotus japonicus. Plant Physiology l3l: 941-951
Shoji T, Yamada Y and HashÍmoto T (2000) Jasmonate induction of putrescine N-methyltransferase genes in the root of Nicotiona sylvestris. Plant and CellPhysiology 41:831-839
Simmonds M S J (2001) Importance of flavonoicls in insect-plant interactions: leedingand oviposition. Phytochemistry 562 245-252
Song F M and Goodman R M (2002) Molecular cloning and characterization of a ricephosphoinositide-specific phospholipase C gene, OsPI-PLCl, that is activatedin systernic acquired resistance. Physiological and Moleculer Plant Pathology6l:31-40
Soriano I R, Asenstorfer R E, Schmidt O and Riley lT (200a$ Inducible flavone inoat (Avena sativa) is a novel defense against plant-parasitic nematodes.Phytopathology 942 1207 -1214
Soriano I R, Riley I T, Potter M J and Bowers W S (2004b) Phytoecclysteroids: anovel defense against plant-parasitic nemato des. Journøl of Chemical Ecology30: 1885-1899
southey J F (1956) National sllrvey work for cereal root eelworm. Nematology lz 64-7I
Stanton J M and Fisher J M (1985) Growth of wheat after damage by and effects ofethylene dibromide on a field population of Heterodera avenae. AustralianJournal ofAgricultural Research 36¡ 559-568
Staswick P E, Yuen G Y and Lehman C C (1998) Jasrnonate signaling mutants ofArabidops¿s are susceptible to the soil fungus Pythium irregulare. Plant Journall5z 747-754
Strange R N and Scott P R (2005) Plant disease: a threat to global food security.Annual Review of Phytopathology 43:83-ll6
Stuiver M H and Custers J H H Y (2001) Engineering d.isease resistance in plants.Nuture London 411: 865-868
138
suzuki H, Achnine L, Xu R, Matsuda S P T and Dixon R A (2002) A genomicsapproach to the early stages of triterpene saponin biosynthesis in Medicagotruncatula. Plant Journal 32: 1 033-1048
Swiderski A, Muras P and Koloczek H (2004) Flavonoid composition in frost-resistant Rhododendron cultivars grown in Poland. Scientia Horticulturae 100:139-151
Tate iVI E (1981) Determination of ionization constants by paper electrophoresisB iochemical Journal 195 : 419-426
Thaler J S (1999) lnduced resistance in agricultural crops: effects ofjasmonic acid onherbivory and yield in tomato plants. Environmental Entomology 28 30-37
Townsend B, Jenner [I and Osbourn A (20C6) Saponin glycosylation in cereals.Phytochemístry Reviews 5: 109-114
Trivedi P C (1998) Nematode diseases in plants. CBS publishers and Distributors,New Delhi, India
Trojanowska M R, osbourn a E, Daniels M J and rhrelfail D R (2000)Biosynthesis of avenacins and phytosterols in roots of Avena sativa cv. Image.P hyt ochemís try 54 : I 53 -I 64
Tschesche R, Tauscher M, Fehlhaber H W and Wulff G (1969) Avenacoside A, einbisdesmosidisches steroid-saponin aus Avena sativct. Chemische Berichtel\2z2072-2082
Turk f M (2005) Avenacin A-1 content of sorne local oat genotypes and the in vitroeffect of avenacins on several soil-bome fungal pathogens of cereals. TurkishJournal of Agriculture and Forestry 29: 157-164
van Loon L C, Geraats B P J and Linthorst H J M (2006) Ethylene as a modulatorof clisease resistance in plants. Trends in Plant Science 11: 184-181
Vernooij B, Friedrich L, Morse A, Reist R, Kolditz J R, Ward E, Uknes S,Kessmann H and Ryals J (1994) Salicylic acid is not the translocated signalresponsible for inducing systemic acquired resistance but is required in signaltransduction. Plant Cell 6z 959-965
vijayan P, shockey J, Levesque c A, cook R J and Browse J (1998) A role forjasmonate in pathogen defense of Arabidopsis. Proceedings of the NutionalAcademy of Sciences of the United States of America 952 7209-72\4
Walhvork H (2003) Cereal variety disease guicle 2003. SARDI, Adelaide, SouthAstralia, P3
Wang X and Huang B (1999) Synergism of tea saponin rnixed with rotenone andTorque in the control of Panonychus citri. Plant Protection 25:7-9
r39
Weidenborner M and Jha H C (1997) Antifungal spectrum of flavone and flavanonetestecl against 34 different fungi. Mycological Resectrch l0l:733-736
Woldemichael G M and Wink M (2001) Identification and biological activities oftriterpenoid saponins from Chenopodium quinoa. Journal of Agricultural anclFood Chemistry 49 : 2327 -2332
Wubben J P, Price K R, Daniels M J and Osbourn A E (1996) Detoxification of oatleaf saponins by Septoria ayencte. Phytopathology g6z 9g6-992
Xu Y, chang P F L, Liu D, Narasimhan lVr L, Raghothama K G, Hasegawa p Mand Bressan R A (1994) Plant defense genes are synergistically induced byethylene and methyl jasmonate. plant Cetl6z 1077-10g5
Zasada I A and Ferris H (2003) Sensitivity of futeloidogyne javanica and, Tylenchulsssemipenetrans to isothiocyanates in laboratory assays. Phytopathology 93: 747-750
Zasada I A and Ferris H (2004) Nematode suppression with brassicaceousamendrnents: application based upon glucosinolate profiles. Soil Biology andB iochemistry 36: I0Il -1024
Zhao B (1999) Nematicidal activity of quinolizidine alkaloids and the functional grouppairs in their molecular structurc. Journal of Chemical Ecology 252 2205-2214
Zinovteva S V, Vasyukova N I, and Ozeretskovskaya O L (2004) Biochemicalaspects of plant interactions with phytoparasitic nematodes: A Review. AppliectBiochemistry and Microbiology 40: I I 1- 1 19
zwer P, Hoppo s, Mccormack P, Schaefer n, Emmery J and'williams M (2004)Oat variety sowing guide 2005. Grain Business, pp 56-59
zwer P, rroppo s, Mccormack P, schaefer D, Emmery J, williams M, cash G,Syndenham J, Cure T and llalt M (2005) Oat breeding newsletter harvestedition.http://www.sardi.sa.gov.au/pdfserve/f,reldcrops/csra/breeding/oats/newsletter harvO5.pdf
140