oat outlook - poga.ca · oat outlook oatinformation.com ... 10,021 8,829 12,277 9,822 10,243 10,238...
TRANSCRIPT
Oat Outlook OATINFORMATION.COM
OATINFORMATION.COM
Key Factors Driving Oat Markets•Canadian rail car supply•Fund/Specs•CBOT oat carry•High price of oats in US horse markets•Tighter 2014/15 oat end stocks
OATINFORMATION.COM
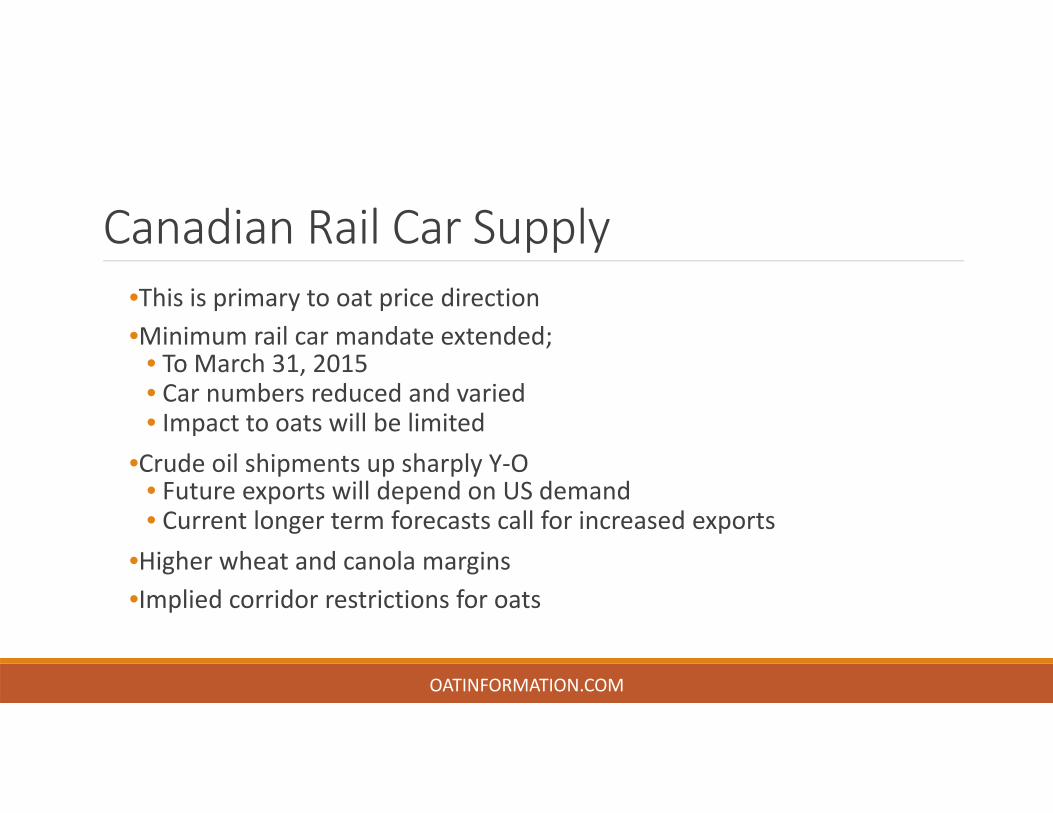
Canadian Rail Car Supply•This is primary to oat price direction•Minimum rail car mandate extended;
• To March 31, 2015• Car numbers reduced and varied• Impact to oats will be limited
•Crude oil shipments up sharply Y‐O• Future exports will depend on US demand• Current longer term forecasts call for increased exports
•Higher wheat and canola margins•Implied corridor restrictions for oats
OATINFORMATION.COM
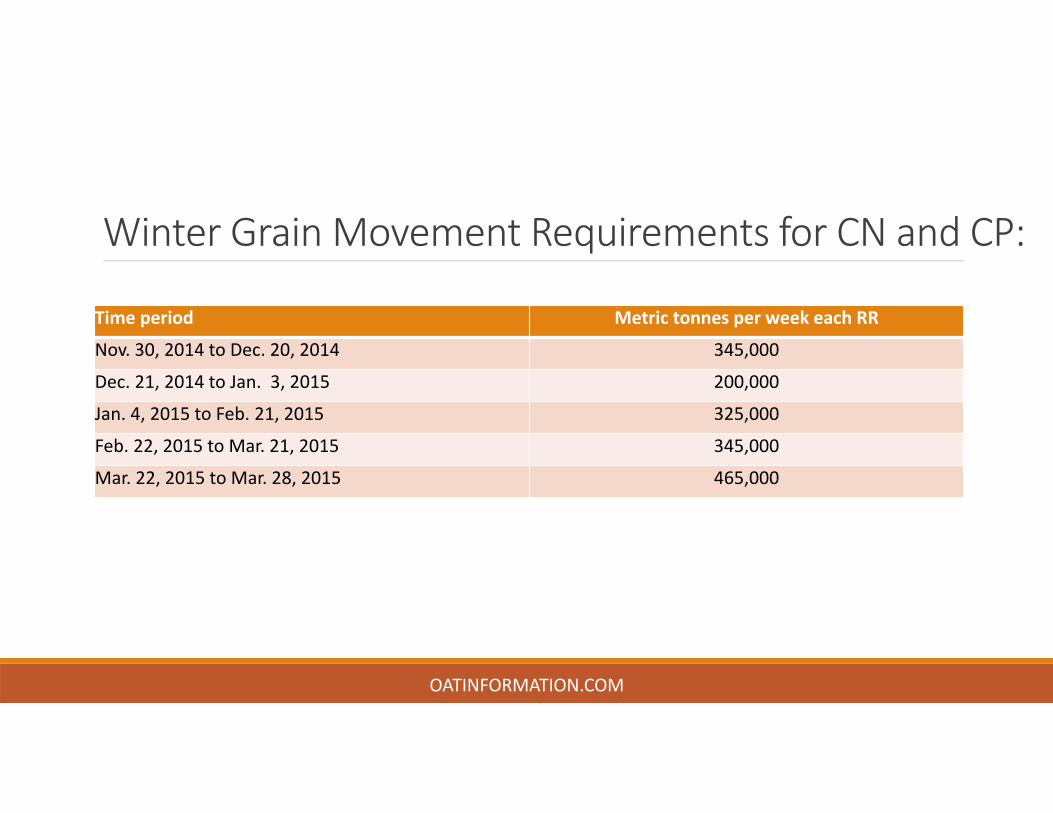
Winter Grain Movement Requirements for CN and CP:
OATINFORMATION.COM
Time period Metric tonnes per week each RR
Nov. 30, 2014 to Dec. 20, 2014 345,000
Dec. 21, 2014 to Jan. 3, 2015 200,000
Jan. 4, 2015 to Feb. 21, 2015 325,000
Feb. 22, 2015 to Mar. 21, 2015 345,000
Mar. 22, 2015 to Mar. 28, 2015 465,000
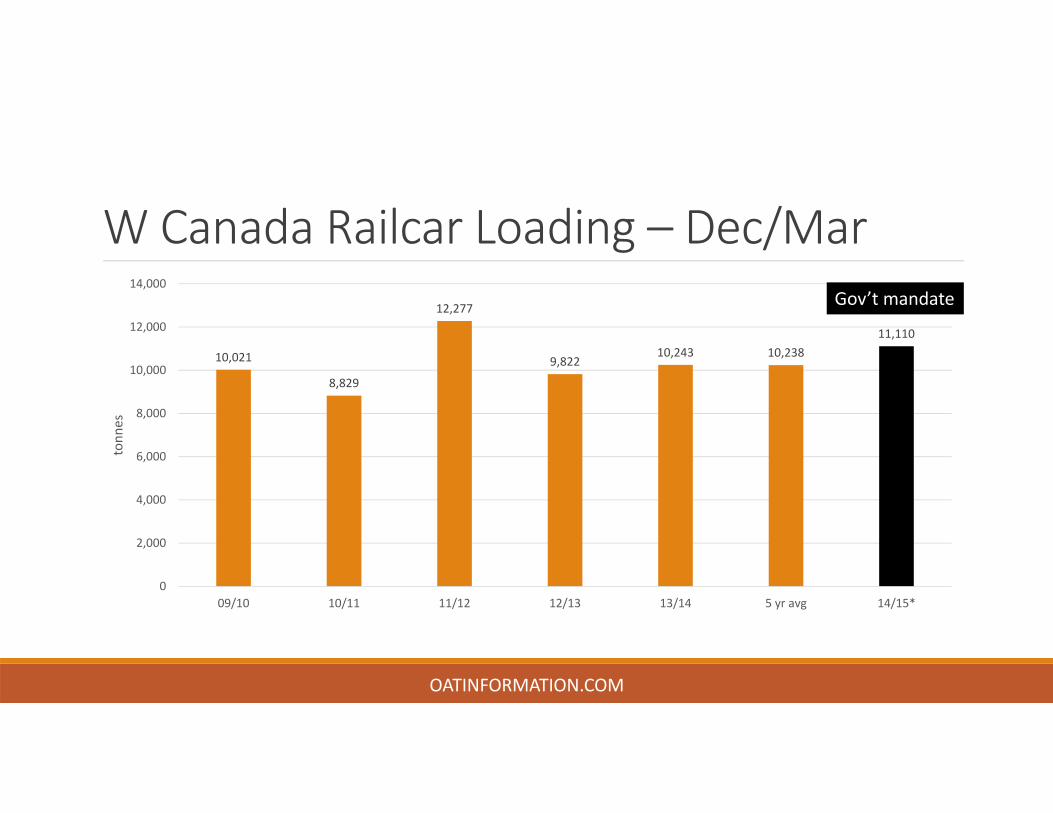
W Canada Railcar Loading – Dec/Mar
10,021
8,829
12,277
9,82210,243 10,238
11,110
0
2,000
4,000
6,000
8,000
10,000
12,000
14,000
09/10 10/11 11/12 12/13 13/14 5 yr avg 14/15*
tonn
es
OATINFORMATION.COM
Gov’t mandate
Canada Rail Car Loading YTD (Aug‐Sep)
45%
21%
30%
44%
‐30% ‐20% ‐10% 0% 10% 20% 30% 40% 50% 60%
Fuel oils and crude petroleum
Wheat
Colza seeds (canola)
Other cereal grains
Milled grain production and preparations, bakery products
Animal or vegetable fats, oils and flours
Coal
Animal feed and products
Cement
Fertilizers (excluding potash)
Potash
OATINFORMATION.COM
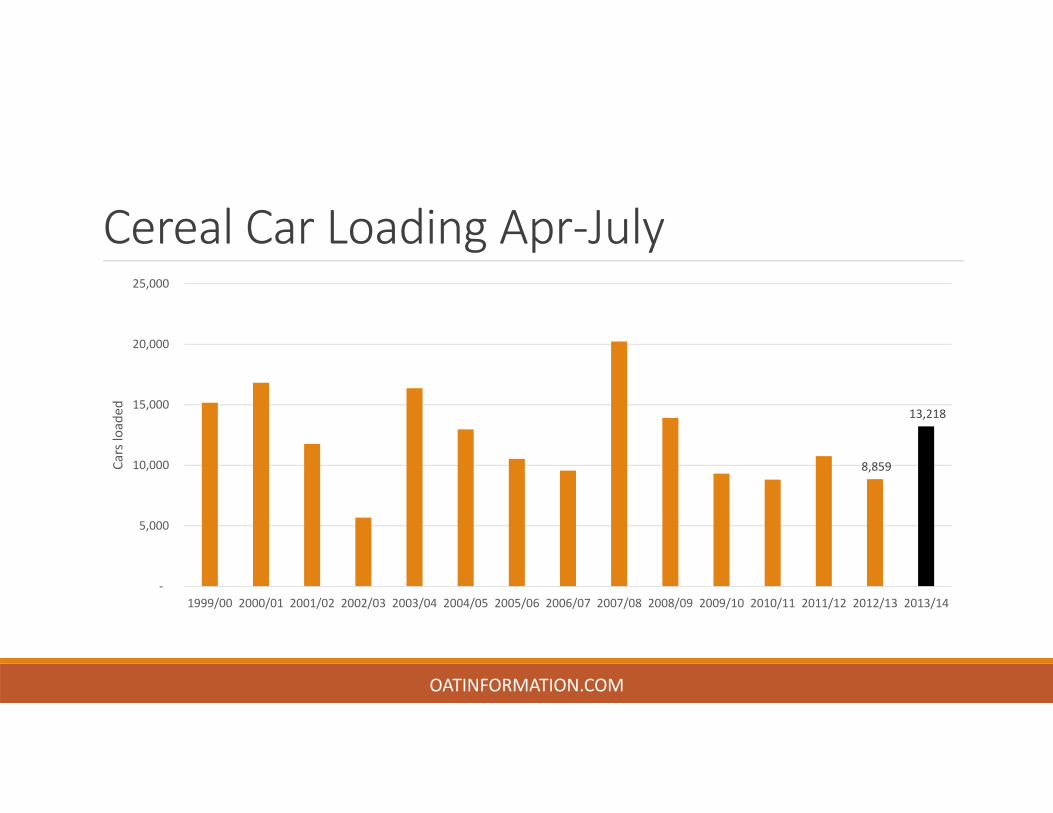
Cereal Car Loading Apr‐July
8,859
13,218
‐
5,000
10,000
15,000
20,000
25,000
1999/00 2000/01 2001/02 2002/03 2003/04 2004/05 2005/06 2006/07 2007/08 2008/09 2009/10 2010/11 2011/12 2012/13 2013/14
Cars loaded
OATINFORMATION.COM
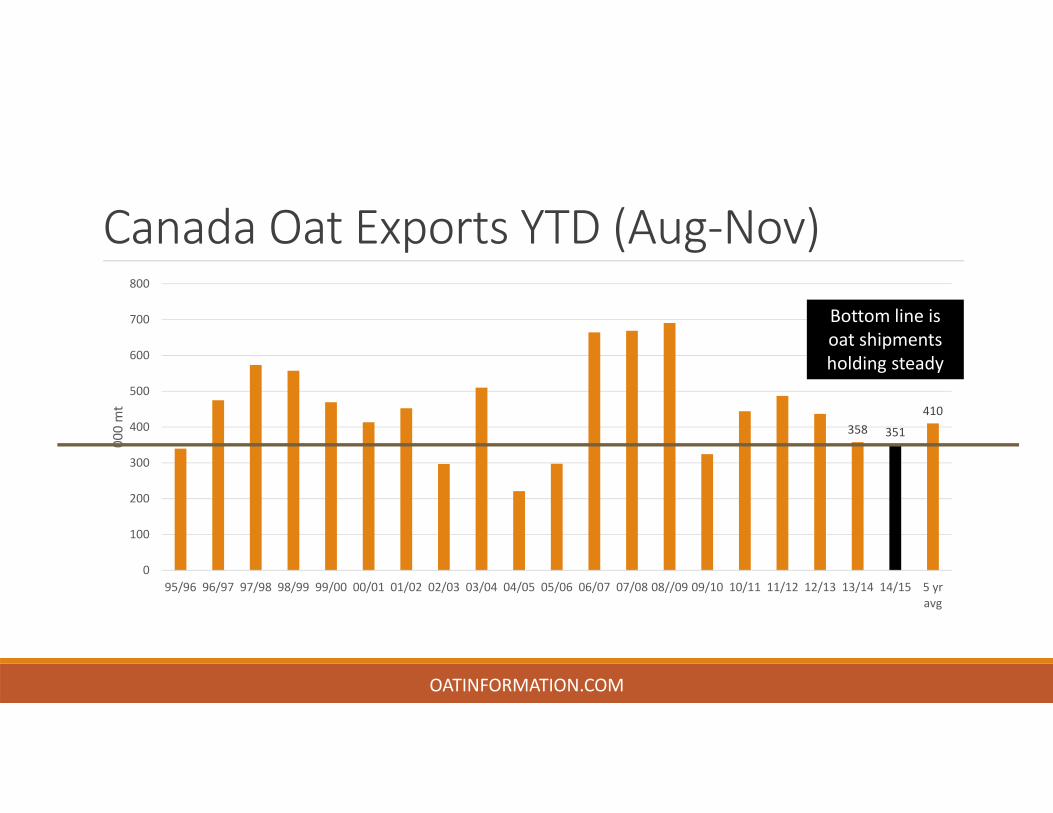
Canada Oat Exports YTD (Aug‐Nov)
358 351
410
0
100
200
300
400
500
600
700
800
95/96 96/97 97/98 98/99 99/00 00/01 01/02 02/03 03/04 04/05 05/06 06/07 07/08 08//09 09/10 10/11 11/12 12/13 13/14 14/15 5 yravg
000 mt
OATINFORMATION.COM
Bottom line is oat shipments holding steady
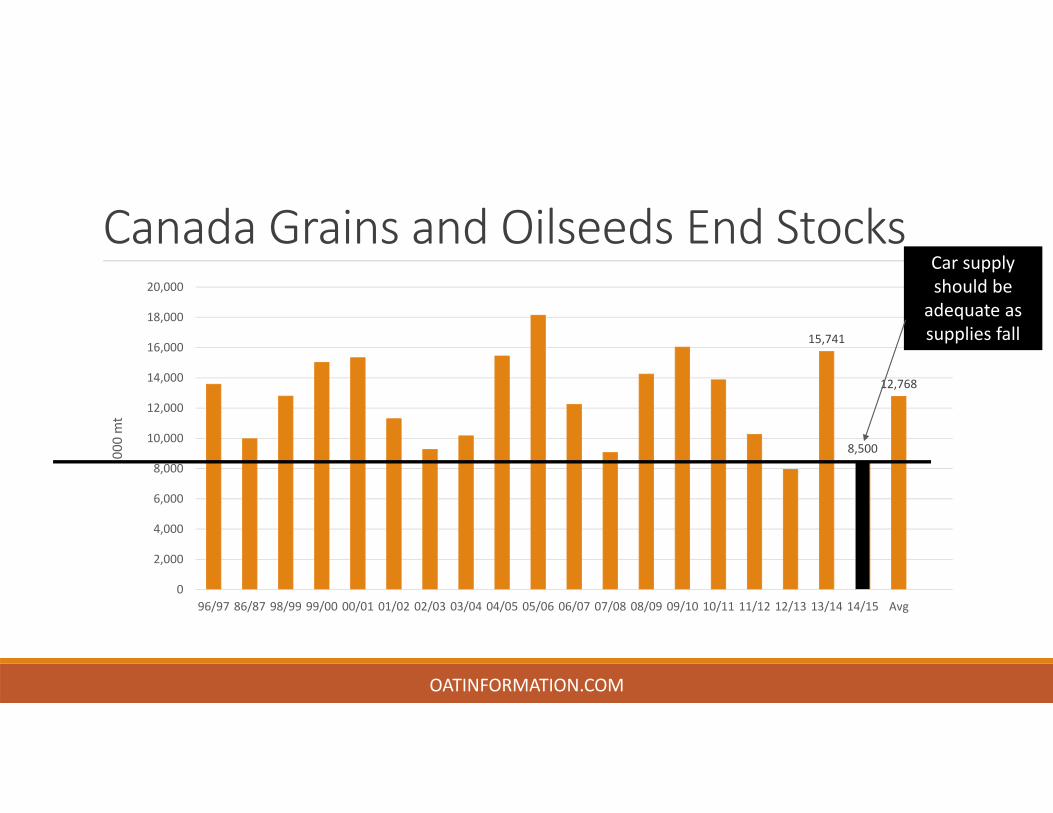
Canada Grains and Oilseeds End Stocks
15,741
8,500
12,768
0
2,000
4,000
6,000
8,000
10,000
12,000
14,000
16,000
18,000
20,000
96/97 86/87 98/99 99/00 00/01 01/02 02/03 03/04 04/05 05/06 06/07 07/08 08/09 09/10 10/11 11/12 12/13 13/14 14/15 Avg
000 mt
OATINFORMATION.COM
Car supply should be adequate as supplies fall
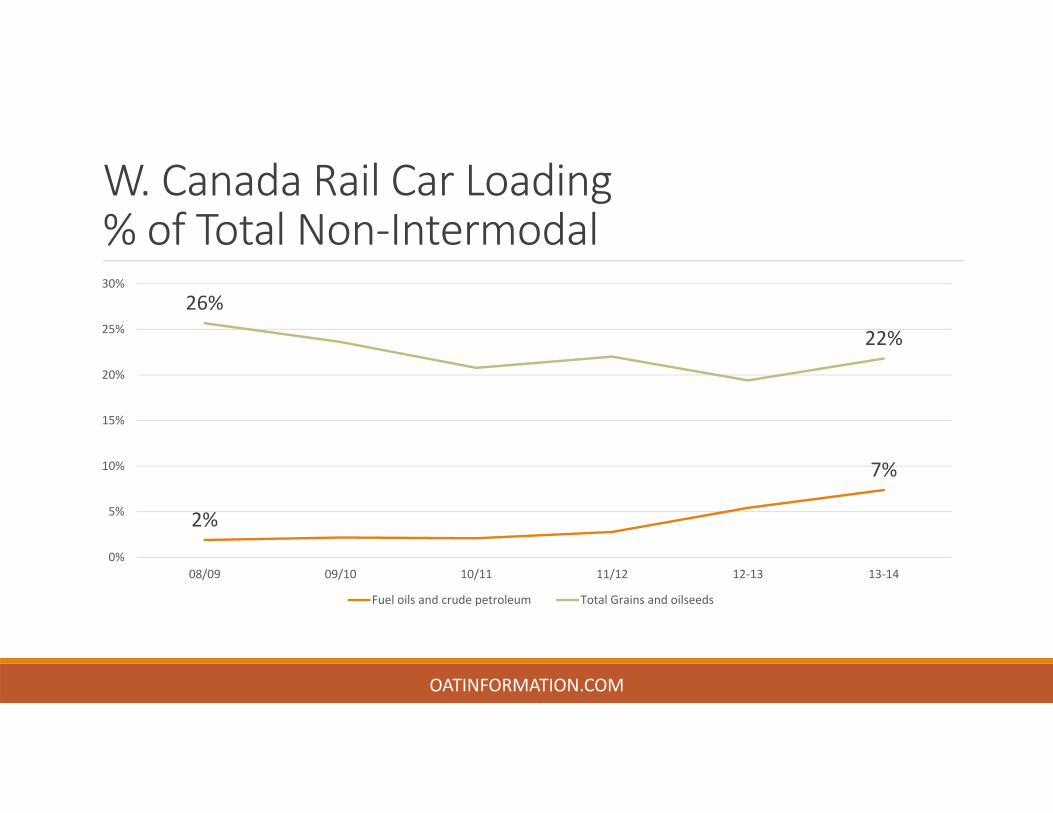
W. Canada Rail Car Loading % of Total Non‐Intermodal
2%
7%
26%
22%
0%
5%
10%
15%
20%
25%
30%
08/09 09/10 10/11 11/12 12‐13 13‐14
Fuel oils and crude petroleum Total Grains and oilseeds
OATINFORMATION.COM
Crude oil by railUS Railroads’ oil‐by‐rail business is dependent on shale plays in North America. Shale plays are unsustainable with oil below $73 per barrel, some say lower. US Railroads haul 8% of U.S. crude.19% of CNR revenues came from shipment of petroleum and chemicals in third quarter 2014. For the first nine months of the year, about 19.3% of revenues came from shipment of petroleum and chemicals, the company reported.If Union Pacific, BNSF Railway, CSX, Norfolk Southern and Canadian National have similar crude‐by‐rail numbers as CNR, these railroads may lose 5% to 10% of their revenues if oil stays below $70 per barrel.
OATINFORMATION.COM
Crude oil by railThe overall revenue exposure in 2014 for both CN and CP stands at roughly 9%.
Several oil experts believe risk to 2015 volume is relatively minimal considering that low prices likely need to stick around for 6‐12 months before there is any major change in production.
OATINFORMATION.COM
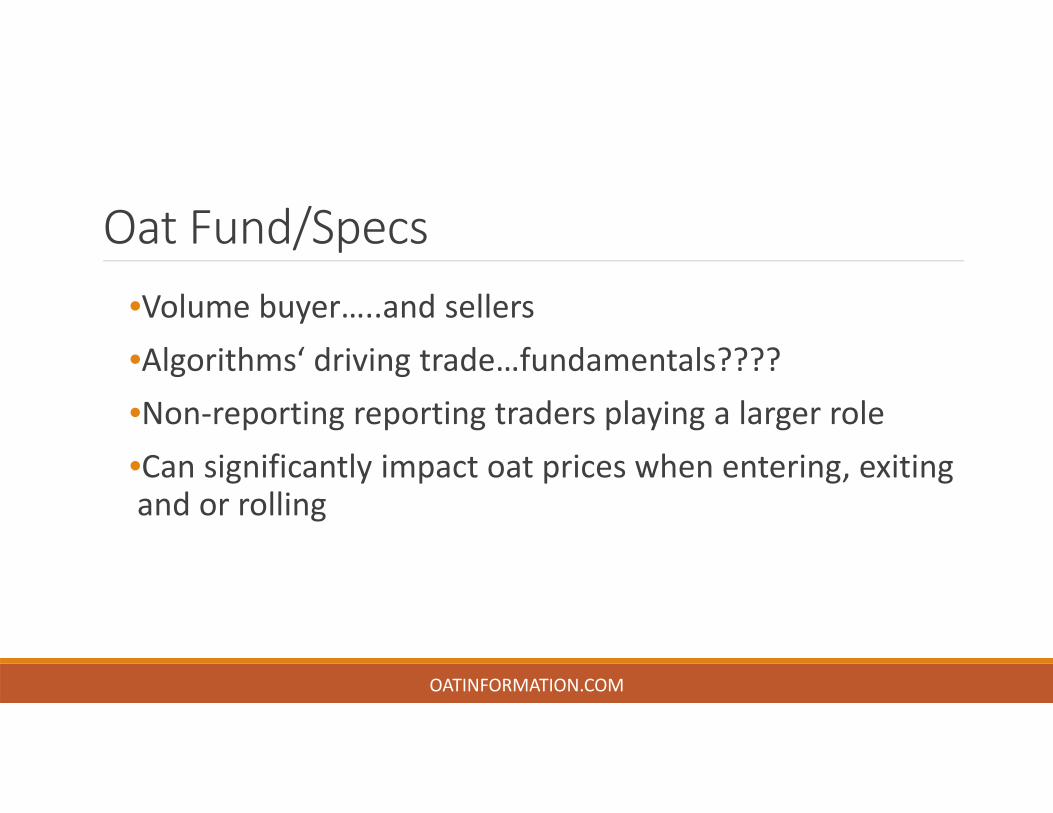
Oat Fund/Specs •Volume buyer…..and sellers•Algorithms‘ driving trade…fundamentals????•Non‐reporting reporting traders playing a larger role•Can significantly impact oat prices when entering, exiting and or rolling
OATINFORMATION.COM
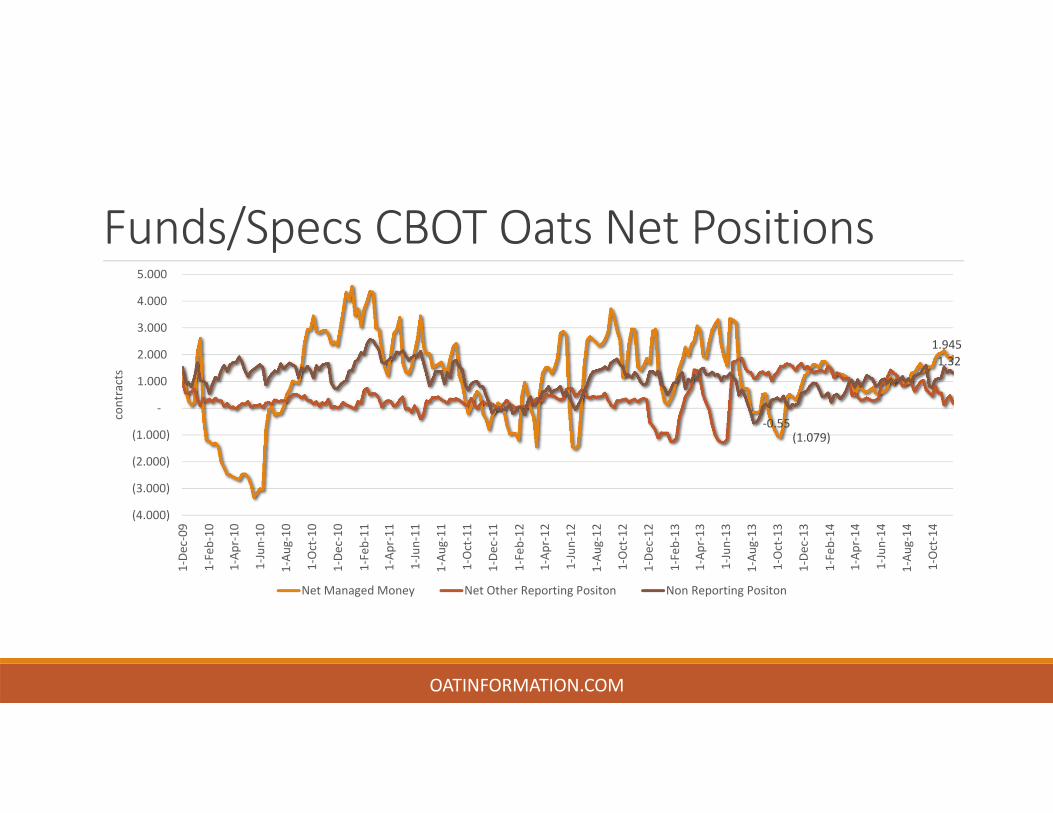
Funds/Specs CBOT Oats Net Positions
(1.079)
1.945
‐0.55
1.32
(4.000)
(3.000)
(2.000)
(1.000)
‐
1.000
2.000
3.000
4.000
5.000
1‐De
c‐09
1‐Feb‐10
1‐Ap
r‐10
1‐Jun‐10
1‐Au
g‐10
1‐Oct‐10
1‐De
c‐10
1‐Feb‐11
1‐Ap
r‐11
1‐Jun‐11
1‐Au
g‐11
1‐Oct‐11
1‐De
c‐11
1‐Feb‐12
1‐Ap
r‐12
1‐Jun‐12
1‐Au
g‐12
1‐Oct‐12
1‐De
c‐12
1‐Feb‐13
1 ‐Ap
r‐13
1‐Jun‐13
1‐Au
g‐13
1‐Oct‐13
1‐De
c‐13
1‐Feb‐14
1‐Ap
r‐14
1‐Jun‐14
1‐Au
g‐14
1‐Oct‐14
contracts
Net Managed Money Net Other Reporting Positon Non Reporting Positon
OATINFORMATION.COM
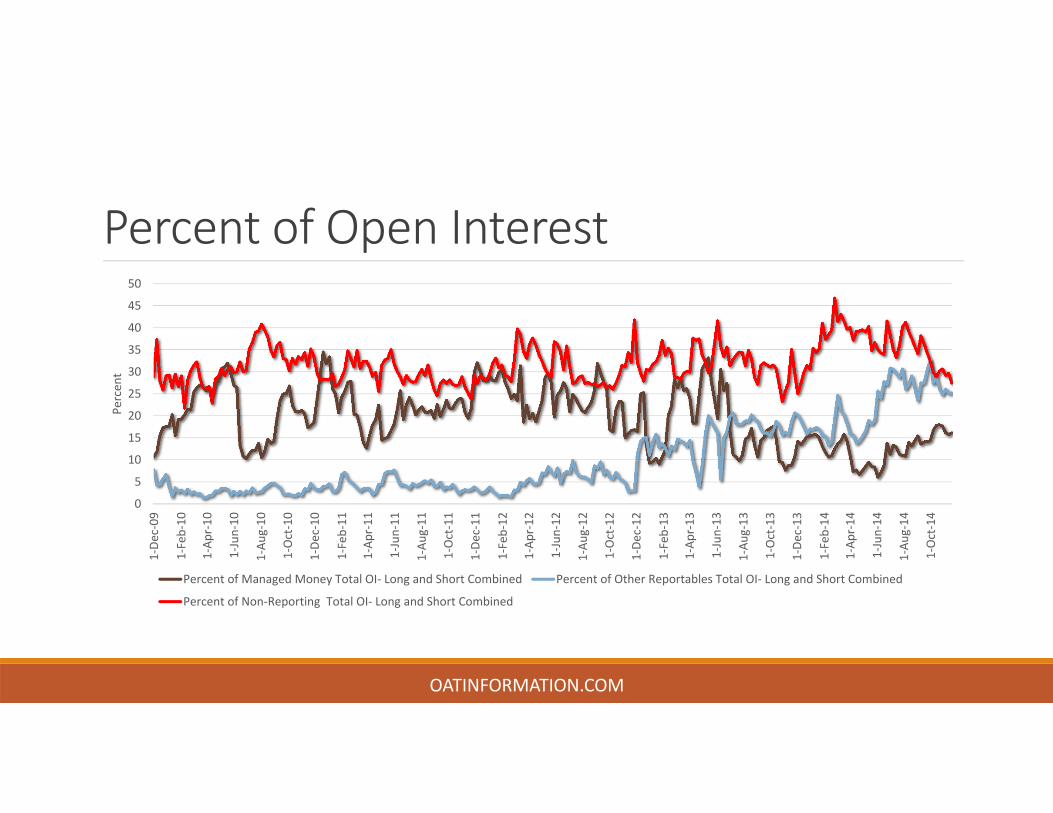
Percent of Open Interest
0
5
10
15
20
25
30
35
40
45
50
1‐De
c‐09
1‐Feb‐10
1‐Ap
r‐10
1‐Jun‐10
1‐Au
g‐10
1‐Oct‐10
1‐De
c‐10
1‐Feb‐11
1‐Ap
r‐11
1‐Jun‐11
1‐Au
g‐11
1‐Oct‐11
1‐De
c‐11
1‐Feb‐12
1‐Ap
r‐12
1‐Jun‐12
1‐Au
g‐12
1‐Oct‐12
1‐De
c‐12
1‐Feb‐13
1‐Ap
r‐13
1‐Jun‐13
1‐Au
g‐13
1‐Oct‐13
1‐De
c‐13
1‐Feb‐14
1‐Ap
r‐14
1‐Jun‐14
1‐Au
g‐14
1‐Oct‐14
Percen
t
Percent of Managed Money Total OI‐ Long and Short Combined Percent of Other Reportables Total OI‐ Long and Short Combined
Percent of Non‐Reporting Total OI‐ Long and Short Combined
OATINFORMATION.COM
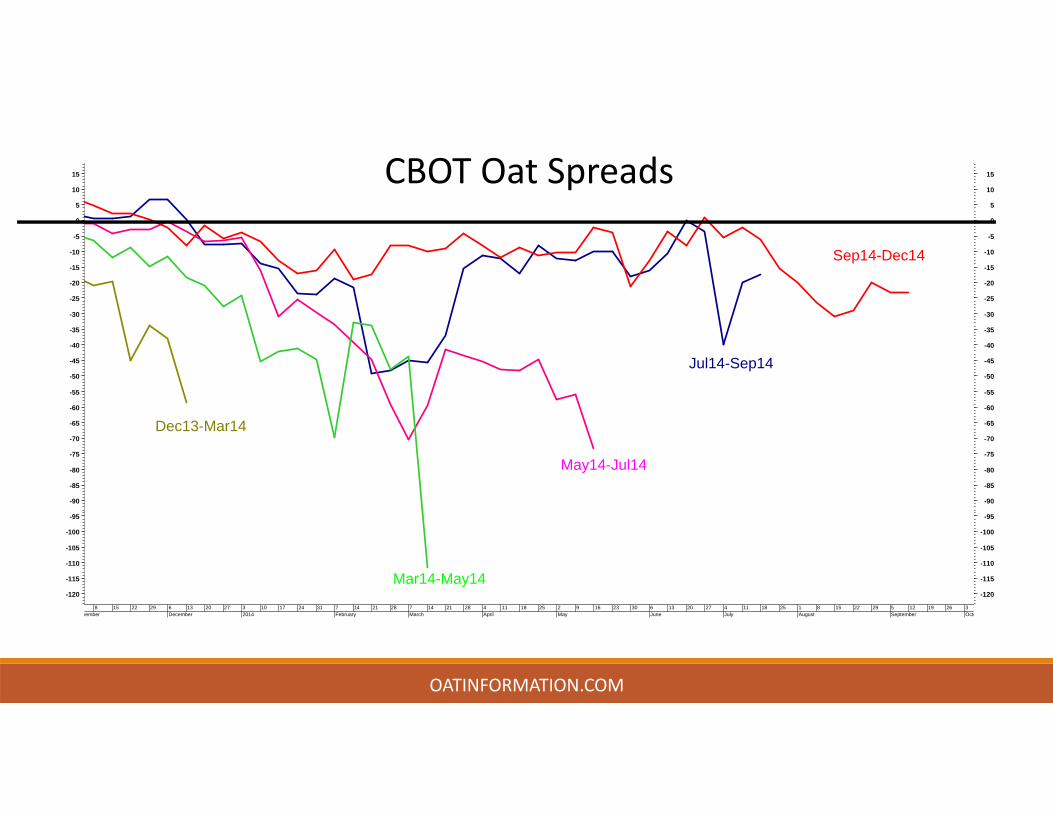
CBOT Oat Carry•Oat markets struggle without it•Carry brings increased:•Commercial cash oat trade•Forward grower selling•Predictability of oat supply, particularly for commercial’s
OATINFORMATION.COM
OATINFORMATION.COM
8vember
15 22 29 6 13December
20 27 32014
10 17 24 31 7 14February
21 28 7March
14 21 28 4April
11 18 25 2May
9 16 23 30 6June
13 20 27 4July
11 18 25 1August
8 15 22 29 5 12September
19 26 3Octo
-120
-115
-110
-105
-100
-95
-90
-85
-80
-75
-70
-65
-60
-55
-50
-45
-40
-35
-30
-25
-20
-15
-10
-5
0
5
10
15
-120
-115
-110
-105
-100
-95
-90
-85
-80
-75
-70
-65
-60
-55
-50
-45
-40
-35
-30
-25
-20
-15
-10
-5
0
5
10
15
Jul14-Sep14
May14-Jul14
Mar14-May14
Sep14-Dec14
Dec13-Mar14
CBOT Oat Spreads
OATINFORMATION.COM
32014
10 17 24 31 7 14February
21 28 7March
14 21 28 4April
11 17 25 2May
9 16 23 30 6June
13 20 27 3July
11 18 25 1 8August
15 22 29 5 12September
19 26 3 10October
17 24 31 7 14November
21 28 5 12December
19
-23
-22
-21
-20
-19
-18
-17
-16
-15
-14
-13
-12
-11
-10
-9
-8
-7
-6
-5
-4
-3
-2
-1
0
1
2
3
4
5
6
7
8
9
10
11
12
13
14
15
16
-23
-22
-21
-20
-19
-18
-17
-16
-15
-14
-13
-12
-11
-10
-9
-8
-7
-6
-5
-4
-3
-2
-1
0
1
2
3
4
5
6
7
8
9
10
11
12
13
14
15
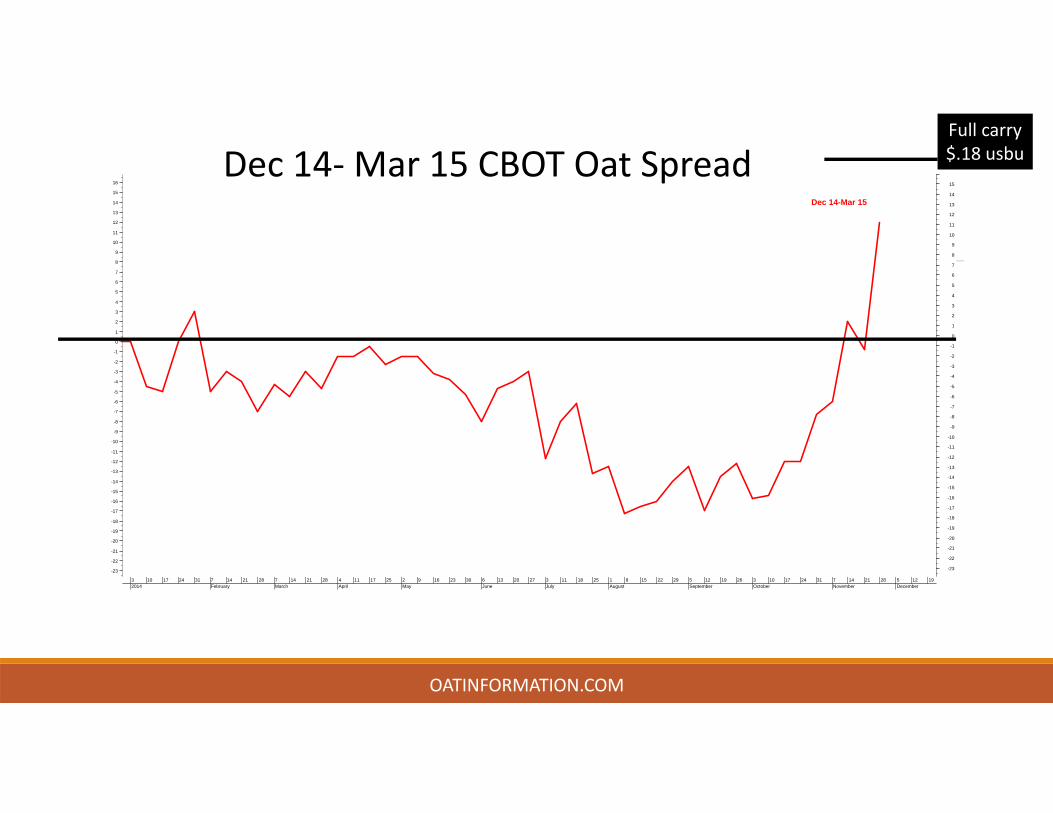
Dec 14-Mar 15
Dec 14‐Mar 15 CBOT Oat SpreadFull carry$.18 usbu
Spread Outlook•Dec/Mar should maintain decent to good carry if Canadian oat exports hold current pace•Back end months could tighten if Canadian oat plantings are lower than expected….or exports slow•Oats are expected lose further ground to corn and wheat if;
• Canadian oat export pace holds steady • 2015 Canadian oat plantings are up 10% or more
OATINFORMATION.COM
High Price of Oats Relative to other Ingredients
•Killing feed demand in US horse markets•Without feed demand, oat become “contracted” crop•Rail issues are impacting horse demand and price relationships
OATINFORMATION.COM
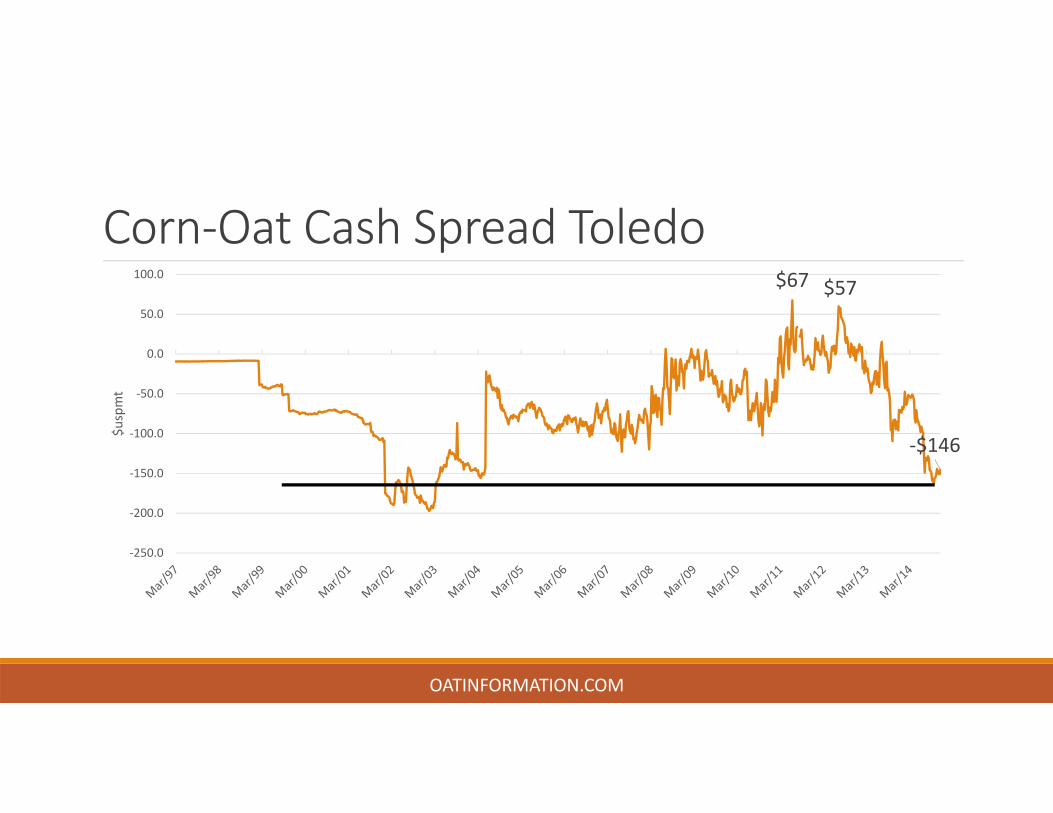
Corn‐Oat Cash Spread Toledo$67 $57
‐$146
‐250.0
‐200.0
‐150.0
‐100.0
‐50.0
0.0
50.0
100.0
$uspmt
OATINFORMATION.COM
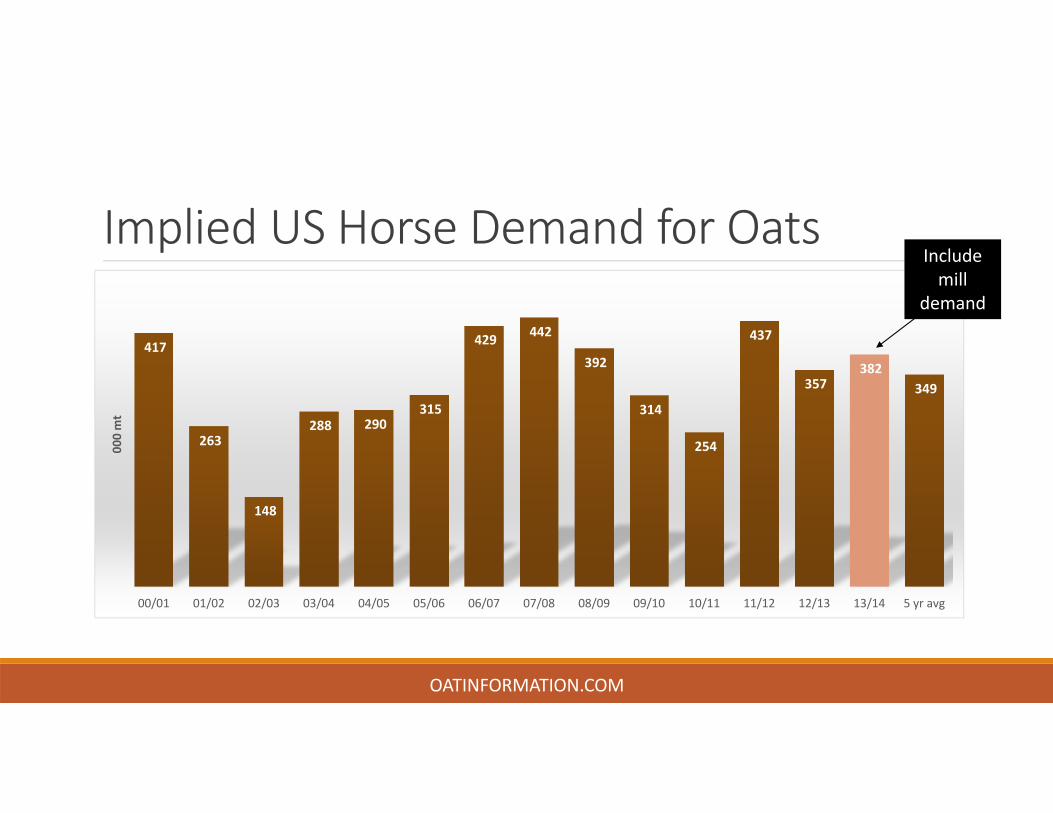
Implied US Horse Demand for Oats
417
263
148
288 290 315
429 442
392
314
254
437
357 382
349
00/01 01/02 02/03 03/04 04/05 05/06 06/07 07/08 08/09 09/10 10/11 11/12 12/13 13/14 5 yr avg
000 mt
OATINFORMATION.COM
Include mill
demand
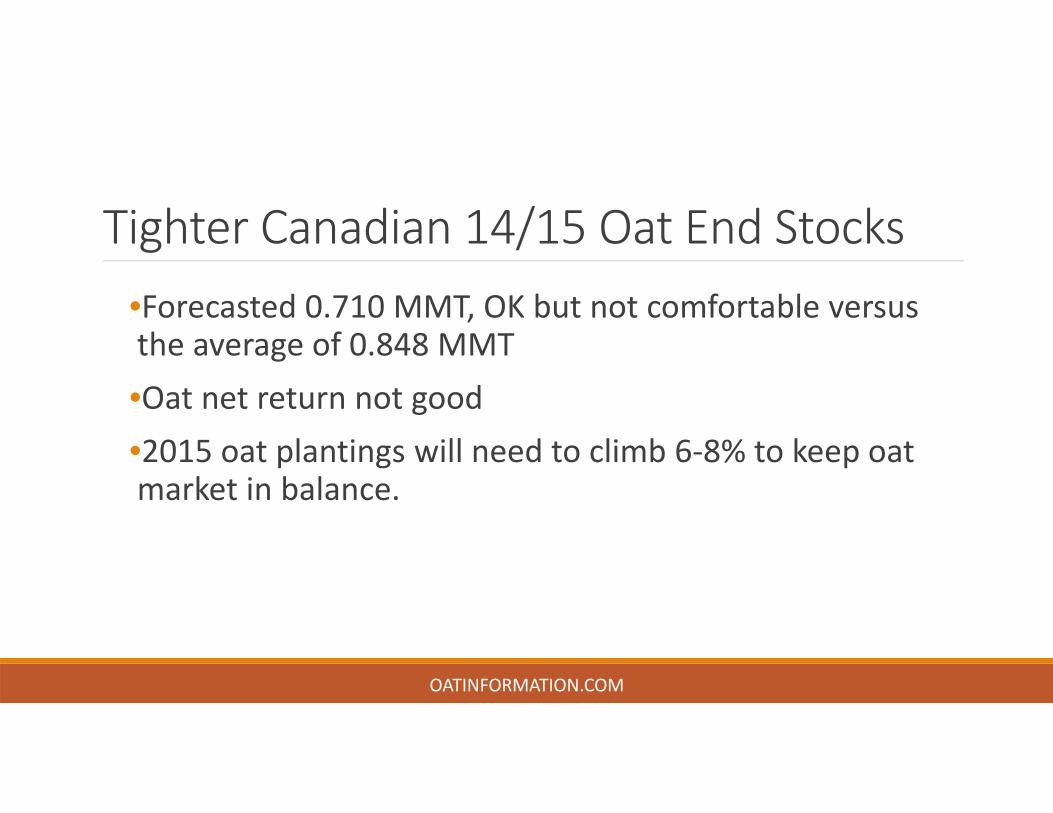
Tighter Canadian 14/15 Oat End Stocks•Forecasted 0.710 MMT, OK but not comfortable versus the average of 0.848 MMT•Oat net return not good•2015 oat plantings will need to climb 6‐8% to keep oat market in balance.
OATINFORMATION.COM
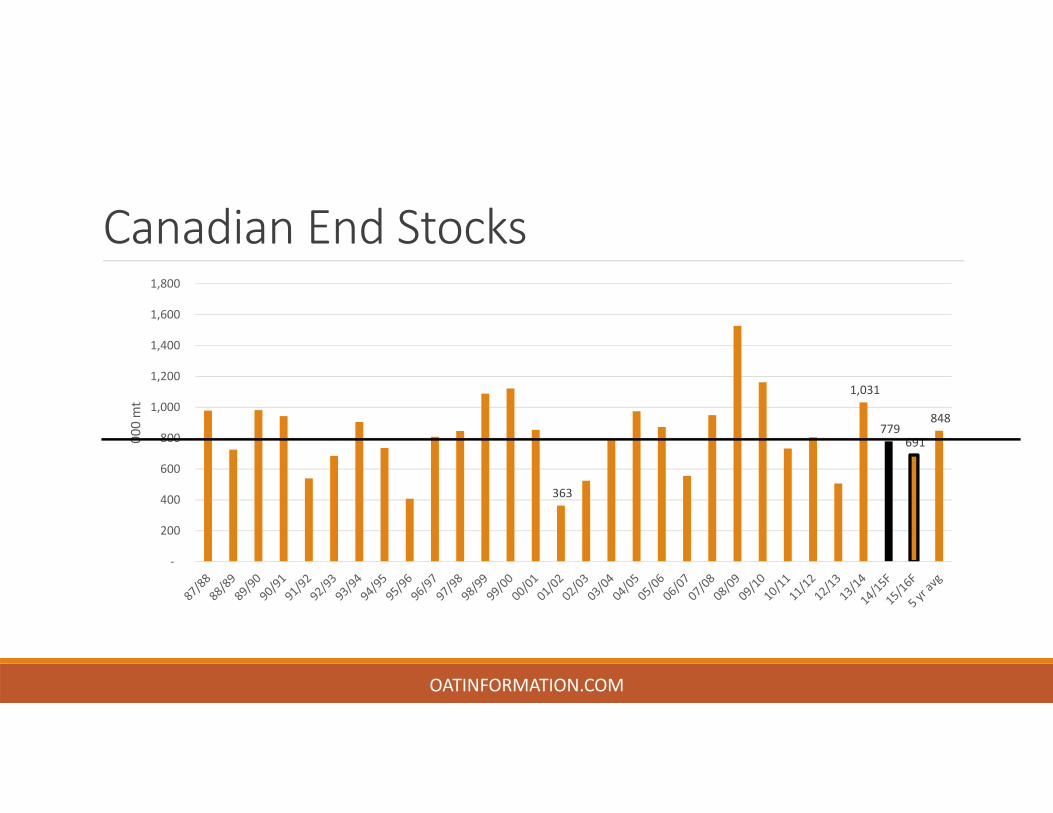
Canadian End Stocks
363
1,031
779 691
848
‐
200
400
600
800
1,000
1,200
1,400
1,600
1,800
000 mt
OATINFORMATION.COM
Oat Metrics
OATINFORMATION.COM
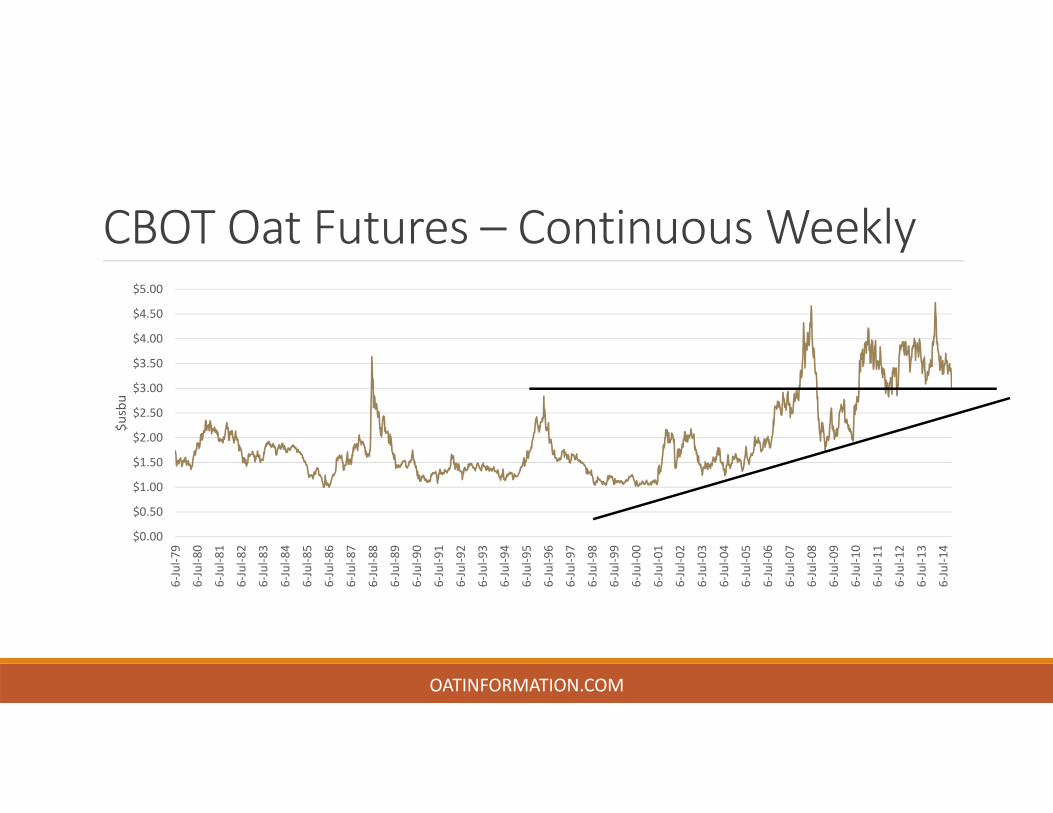
CBOT Oat Futures – Continuous Weekly
$0.00
$0.50
$1.00
$1.50
$2.00
$2.50
$3.00
$3.50
$4.00
$4.50
$5.00
6‐Jul‐7
9
6‐Jul‐8
0
6‐Jul‐8
1
6‐Jul‐8
2
6‐Jul‐8
3
6‐Jul‐8
4
6‐Jul‐8
5
6‐Jul‐8
6
6‐Jul‐8
7
6‐Jul‐8
8
6‐Jul‐8
9
6‐Jul‐9
0
6‐Jul‐9
1
6‐Jul‐9
2
6‐Jul‐9
3
6‐Jul‐9
4
6‐Jul‐9
5
6‐Jul‐9
6
6‐Jul‐9
7
6‐Jul‐9
8
6‐Jul‐9
9
6‐Jul‐0
0
6‐Jul‐0
1
6‐Jul‐0
2
6‐Jul‐0
3
6‐Jul‐0
4
6‐Jul‐0
5
6‐Jul‐0
6
6‐Jul‐0
7
6‐Jul‐0
8
6‐Jul‐0
9
6‐Jul‐1
0
6‐Jul‐1
1
6‐Jul‐1
2
6‐Jul‐1
3
6‐Jul‐1
4
$usbu
OATINFORMATION.COM
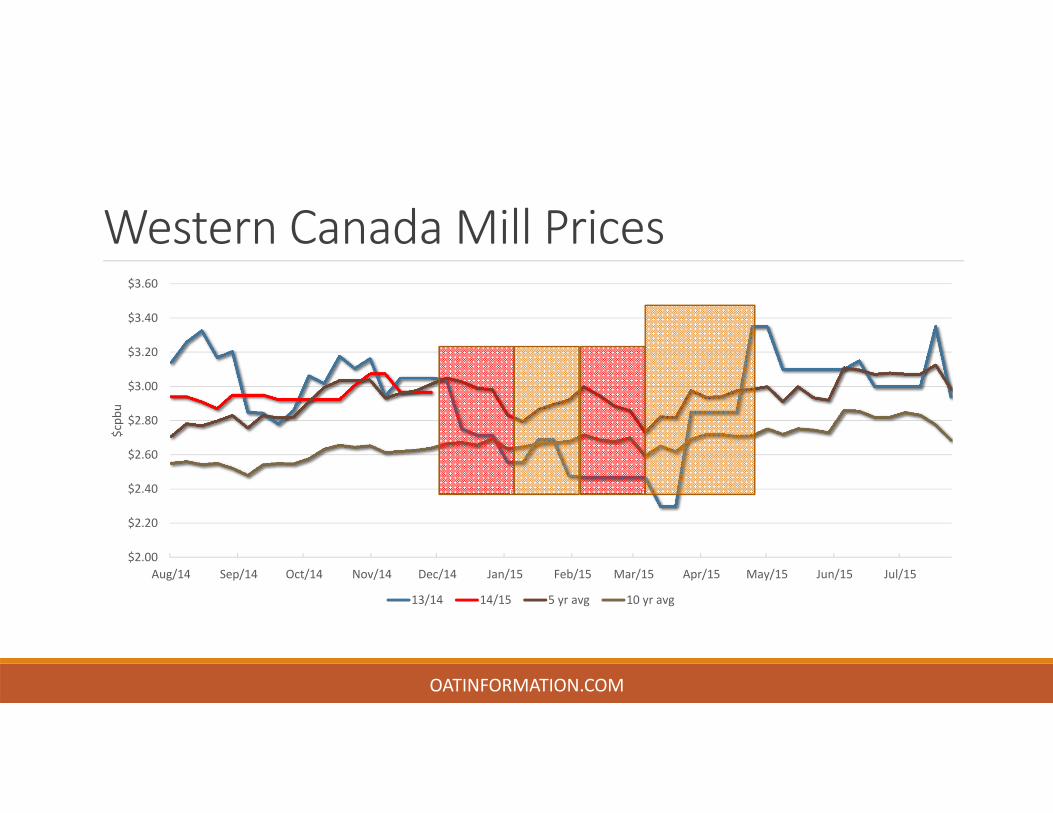
Western Canada Mill Prices
$2.00
$2.20
$2.40
$2.60
$2.80
$3.00
$3.20
$3.40
$3.60
Aug/14 Sep/14 Oct/14 Nov/14 Dec/14 Jan/15 Feb/15 Mar/15 Apr/15 May/15 Jun/15 Jul/15
$cpb
u
13/14 14/15 5 yr avg 10 yr avg
OATINFORMATION.COM
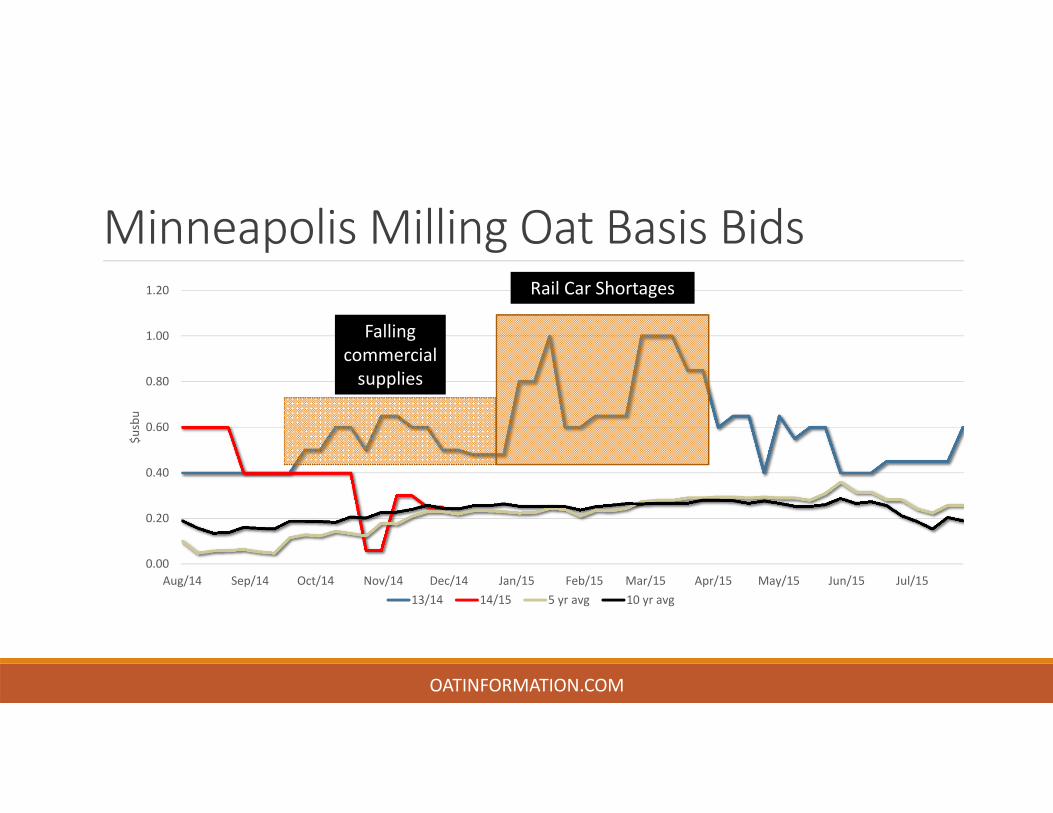
Minneapolis Milling Oat Basis Bids
0.00
0.20
0.40
0.60
0.80
1.00
1.20
Aug/14 Sep/14 Oct/14 Nov/14 Dec/14 Jan/15 Feb/15 Mar/15 Apr/15 May/15 Jun/15 Jul/15
$usbu
13/14 14/15 5 yr avg 10 yr avg
OATINFORMATION.COM
Falling commercial supplies
Rail Car Shortages
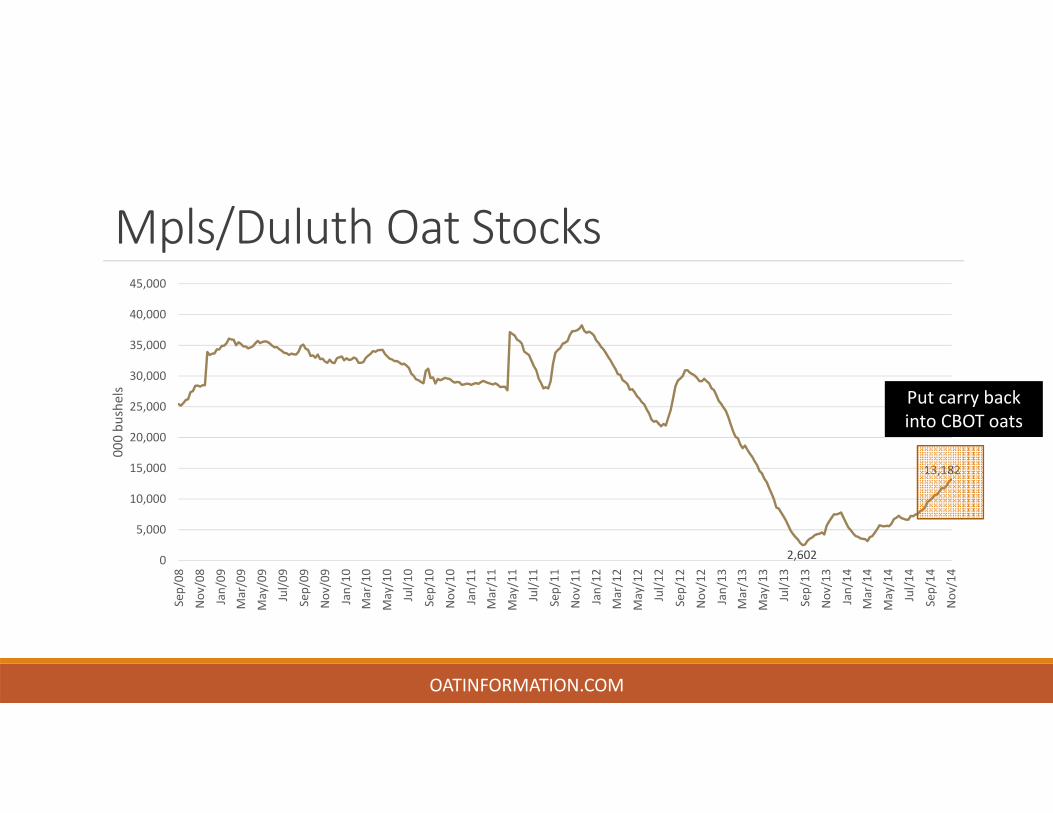
Mpls/Duluth Oat Stocks
2,602
13,182
0
5,000
10,000
15,000
20,000
25,000
30,000
35,000
40,000
45,000
Sep/08
Nov/08
Jan/09
Mar/09
May/09
Jul/0
9
Sep/09
Nov/09
Jan/10
Mar/10
May/10
Jul/1
0
Sep/10
Nov/10
Jan/11
Mar/11
May/11
Jul/1
1
Sep/11
Nov/11
Jan/12
Mar/12
May/12
Jul/1
2
Sep/12
Nov/12
Jan/13
Mar/13
May/13
Jul/1
3
Sep/13
Nov/13
Jan/14
Mar/14
May/14
Jul/1
4
Sep/14
Nov/14
000 bu
shels
OATINFORMATION.COM
Put carry back into CBOT oats
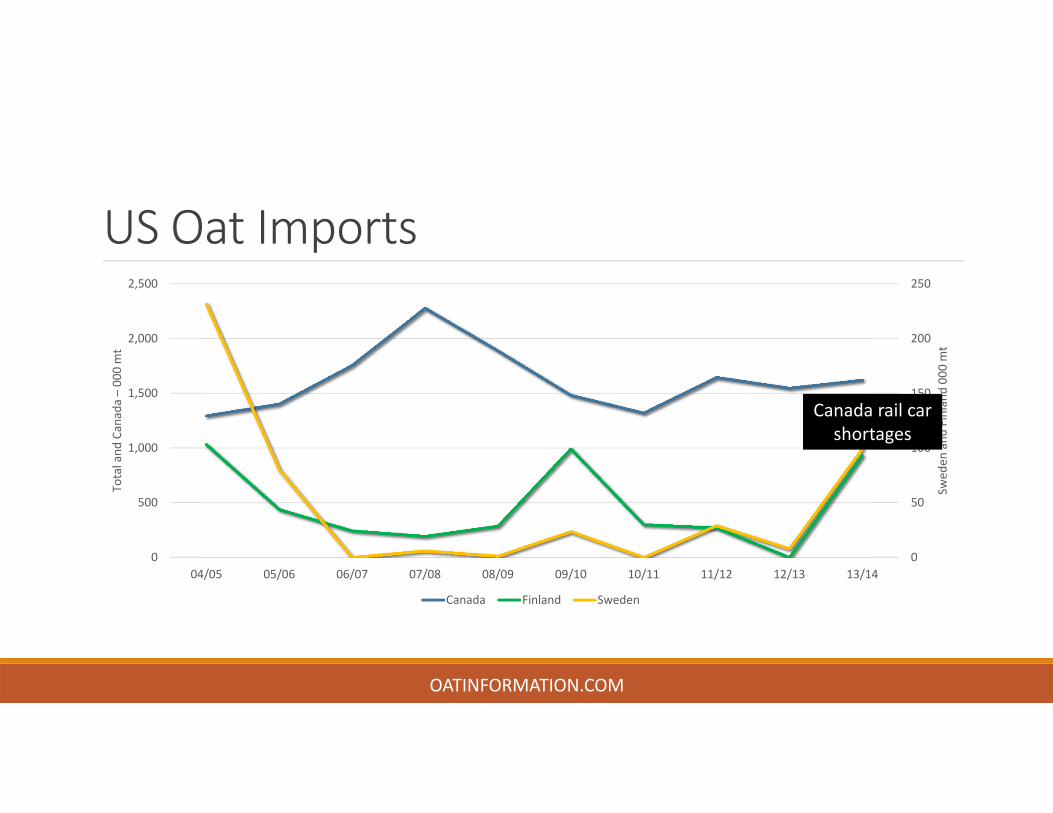
US Oat Imports
0
50
100
150
200
250
0
500
1,000
1,500
2,000
2,500
04/05 05/06 06/07 07/08 08/09 09/10 10/11 11/12 12/13 13/14
Swed
en and
Finland
000
mt
Total and
Canada –00
0 mt
Canada Finland Sweden
OATINFORMATION.COM
Canada rail car shortages
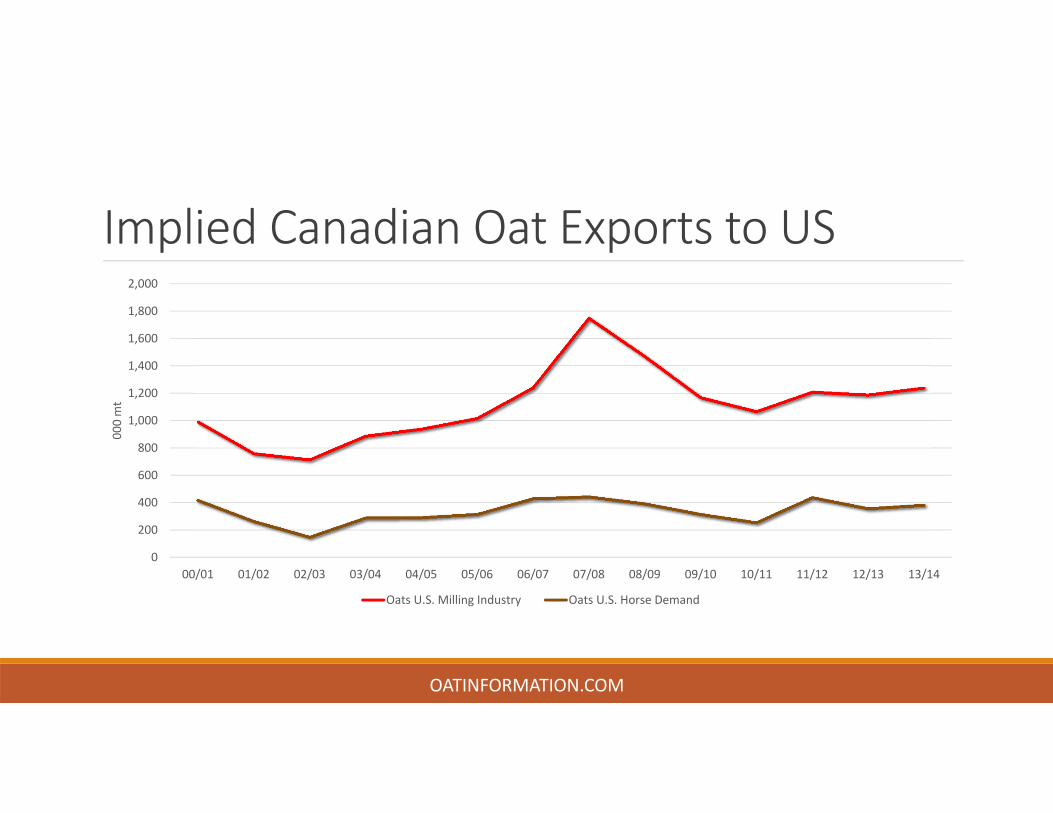
Implied Canadian Oat Exports to US
0
200
400
600
800
1,000
1,200
1,400
1,600
1,800
2,000
00/01 01/02 02/03 03/04 04/05 05/06 06/07 07/08 08/09 09/10 10/11 11/12 12/13 13/14
000 mt
Oats U.S. Milling Industry Oats U.S. Horse Demand
OATINFORMATION.COM
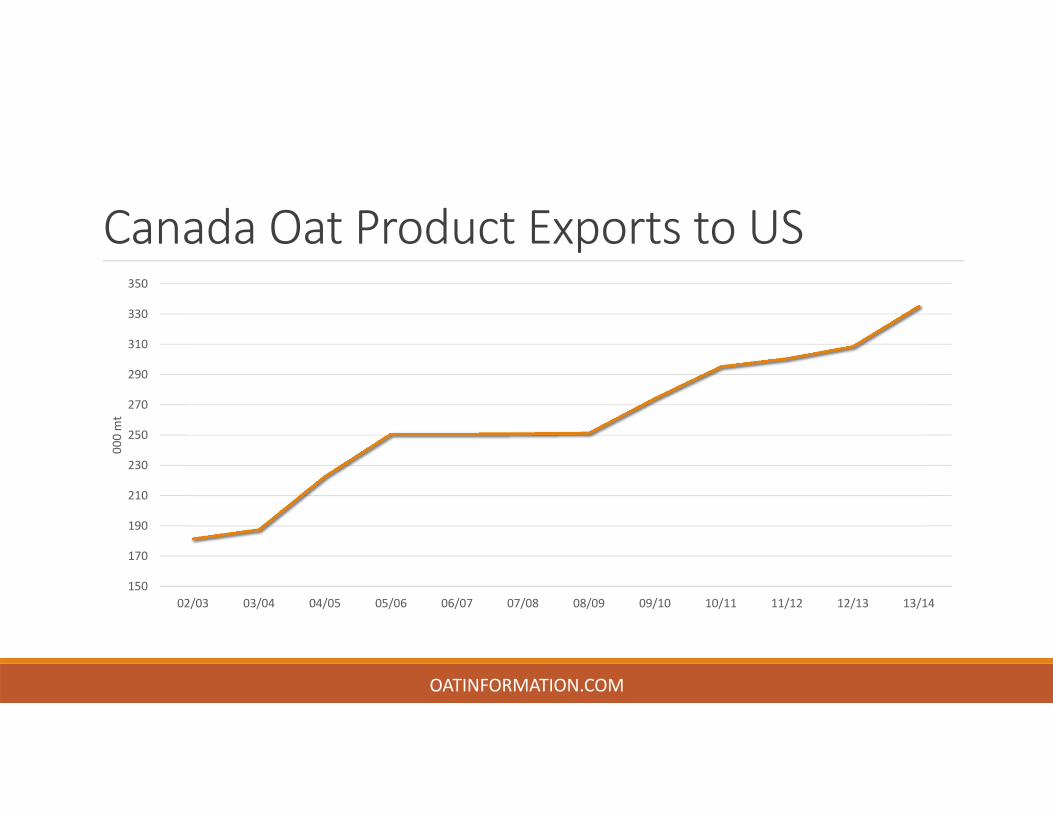
Canada Oat Product Exports to US
150
170
190
210
230
250
270
290
310
330
350
02/03 03/04 04/05 05/06 06/07 07/08 08/09 09/10 10/11 11/12 12/13 13/14
000 mt
OATINFORMATION.COM
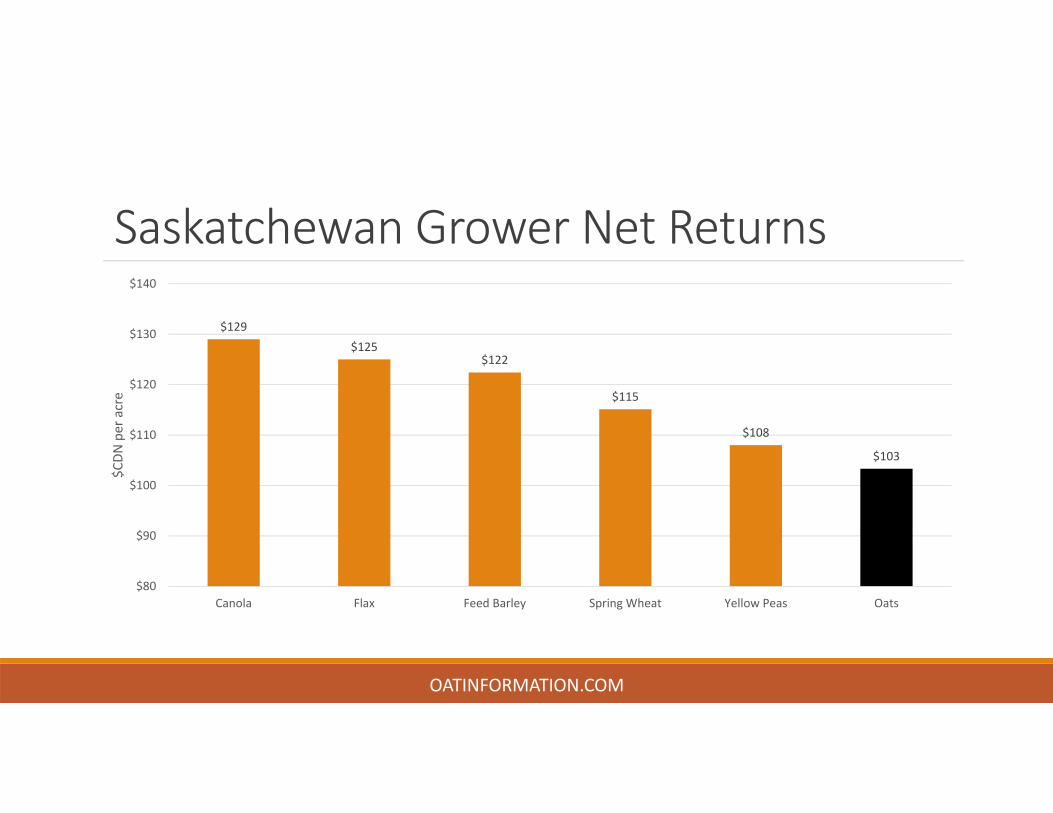
Saskatchewan Grower Net Returns
$129$125
$122
$115
$108
$103
$80
$90
$100
$110
$120
$130
$140
Canola Flax Feed Barley Spring Wheat Yellow Peas Oats
$CDN
per acre
OATINFORMATION.COM
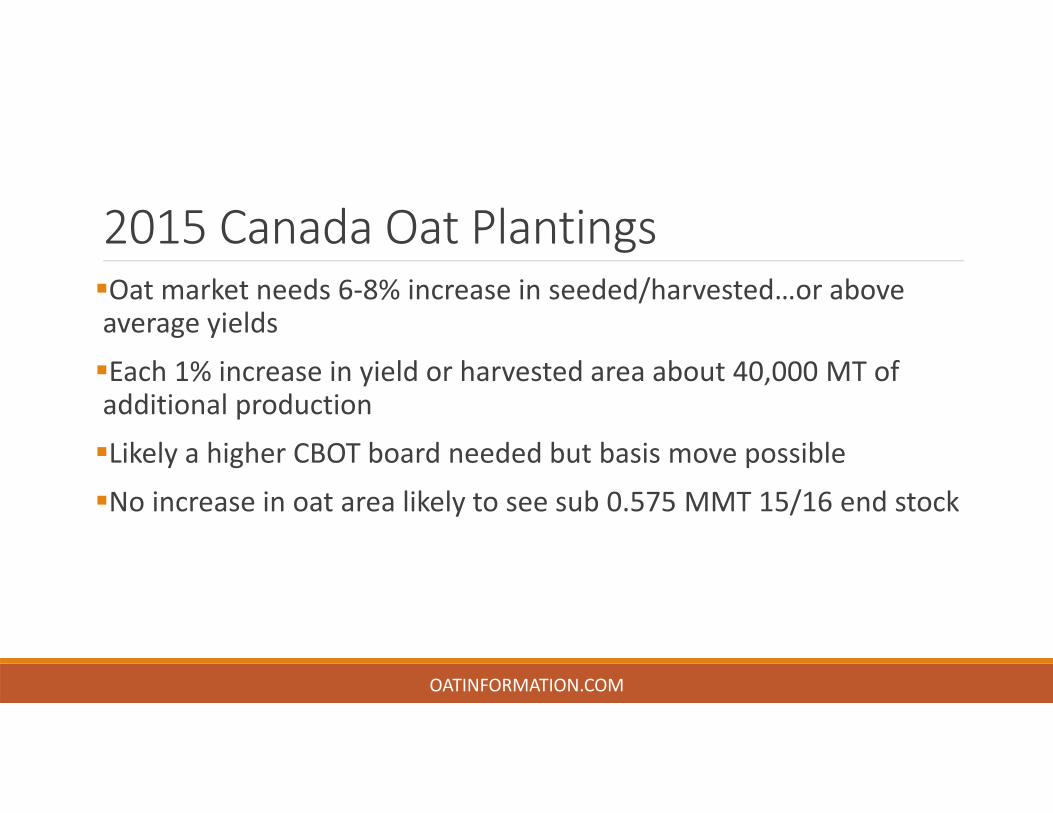
2015 Canada Oat PlantingsOat market needs 6‐8% increase in seeded/harvested…or above average yields
Each 1% increase in yield or harvested area about 40,000 MT of additional production
Likely a higher CBOT board needed but basis move possible
No increase in oat area likely to see sub 0.575 MMT 15/16 end stock
OATINFORMATION.COM
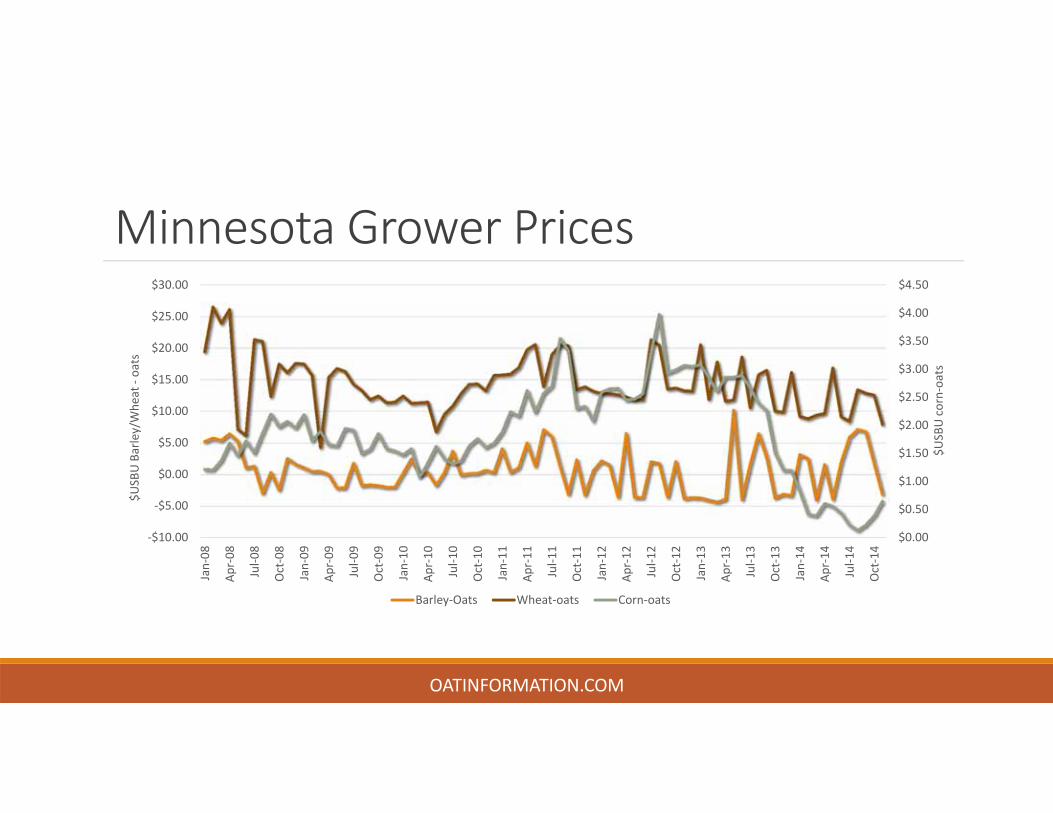
Minnesota Grower Prices
$0.00
$0.50
$1.00
$1.50
$2.00
$2.50
$3.00
$3.50
$4.00
$4.50
‐$10.00
‐$5.00
$0.00
$5.00
$10.00
$15.00
$20.00
$25.00
$30.00
Jan‐08
Apr‐08
Jul‐0
8
Oct‐08
Jan‐09
Apr‐09
Jul‐0
9
Oct‐09
Jan‐10
Apr‐10
Jul‐1
0
Oct‐10
Jan‐11
Apr‐11
Jul‐1
1
Oct‐11
Jan‐12
Apr‐12
Jul‐1
2
Oct‐12
Jan‐13
Apr‐13
Jul‐1
3
Oct‐13
Jan‐14
Apr‐14
Jul‐1
4
Oct‐14
$USBU corn‐oats
$USBU Barley/Whe
at ‐oats
Barley‐Oats Wheat‐oats Corn‐oats
OATINFORMATION.COM
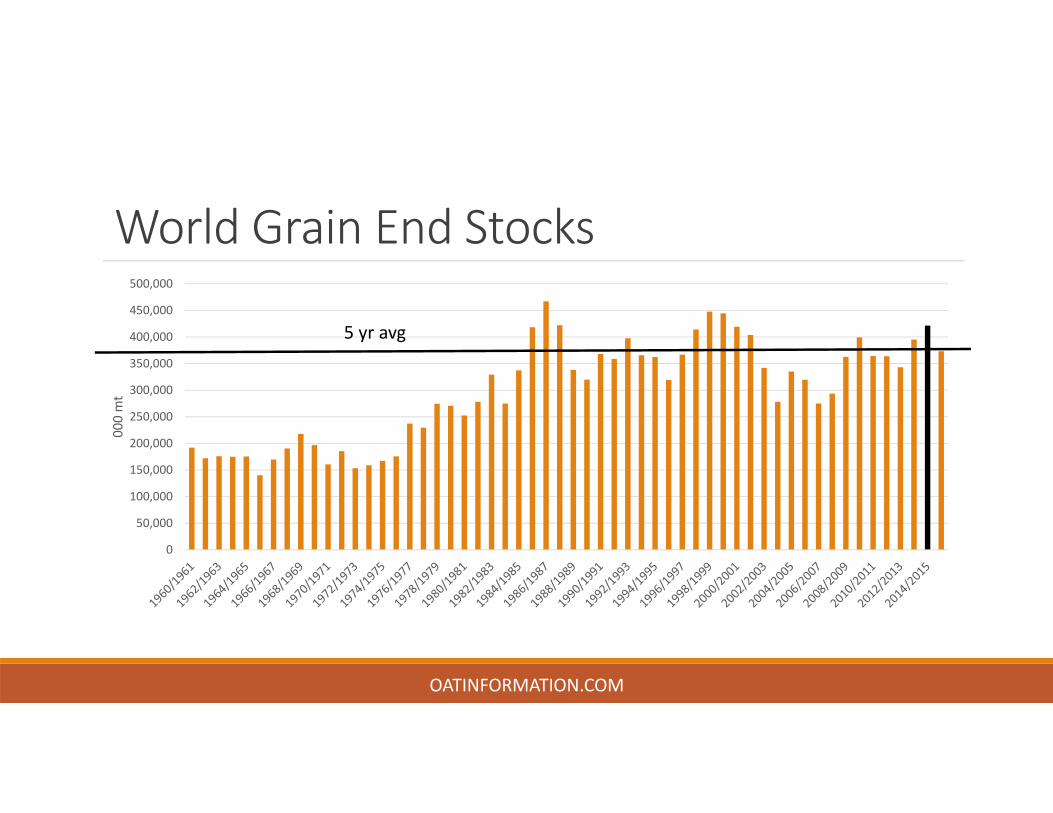
World Grain End Stocks
0
50,000
100,000
150,000
200,000
250,000
300,000
350,000
400,000
450,000
500,000
000 mt
OATINFORMATION.COM
5 yr avg
OATINFORMATION.COM
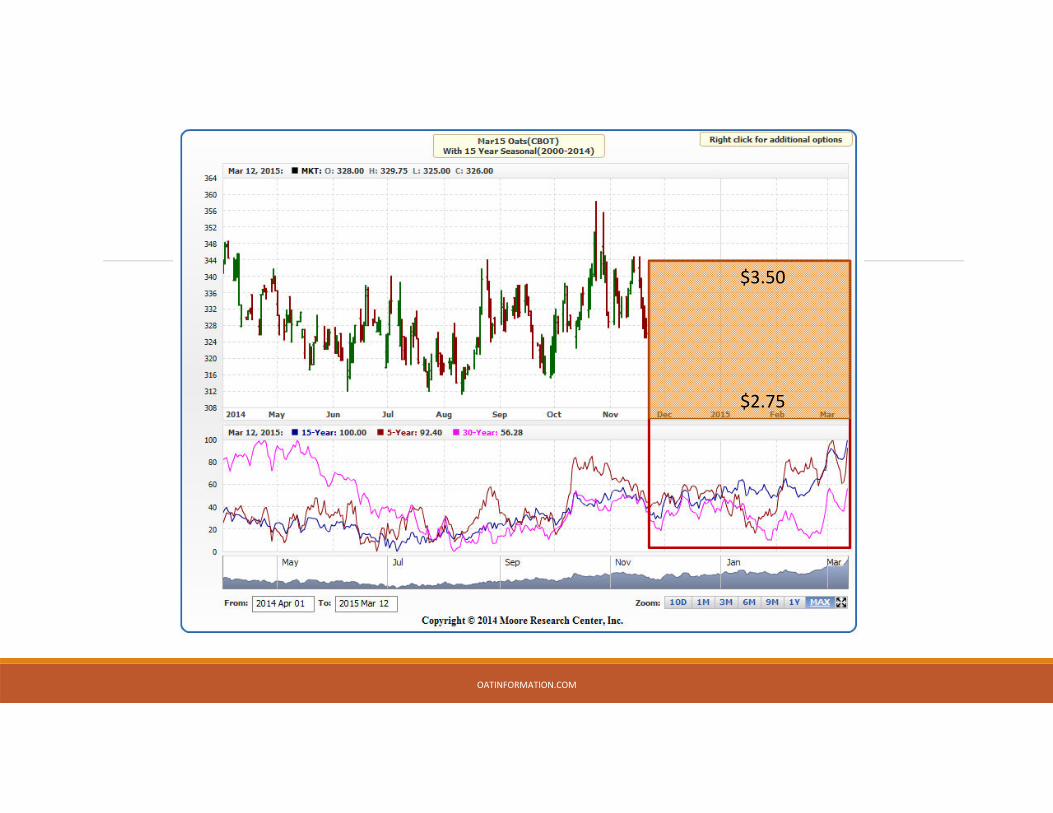
$2.75
$3.50
Oatinformation.com
OATINFORMATION.COM
The Source for Oat Information