obd at hope hiring exercise
DESCRIPTION
Hiring exercise for OBD housed at Hope HS.TRANSCRIPT

JORGE O. ELORZA
Mayor
SUSAN F. LUSI, PH.D
Superintendent
Providence Public School District Office of Innovation Zone
797 Westminster Street Providence, RI 02903-4045
tel. 401.278.2099 fax 401.456.9252
Opportunity by Design (OBD) High School housed at Hope HS
Hiring Exercise
APPLICATION REQUIREMENTS The first step in our process is to submit a completed application, along with your PATS profile. A completed
application contains the following components:
Resume
Cover letter that includes acknowledgment of the candidate’s commitment to the conditions of the position
and a detailed description of how the candidate meets the job qualifications
Completed Hiring Exercise (see below)
(To create a profile on PATS to apply, go to:
http://www.providenceschools.org/pages/ProvidenceSchools/Teachers/ApplyForJobs)
HIRING EXERCISE We feel that hiring exercises give candidates an opportunity to make a meaningful assessment of how a role will fit
them and allow us to review a candidate’s skills in an in-depth manner. Please read the context below and
complete the numbered tasks and submit your response along with your resume and cover letter.
At the Opportunity by Design High School housed at Hope HS, students will move at their own pace through whole
group teaching, computer-based exercises, 1:1 tutorials and small groups for targeted support. This asynchronous
approach within each classroom means that students are doing different things at different times every day, based
on their own personalized education plans. The digital content programs used at our school will be largely self-
paced and include assessments to regulate students’ understanding and readiness to progress. Teachers will use
these tools to identify knowledge gaps among students and tailor support to the students’ ability levels. The online
software can supplement understanding, allow advanced students to push ahead, and identify students that need
additional help.
1. Review the following pages of data related to climate, culture and academic achievement and the 10
Carnegie School Design Principles.
2. Please submit a written response (no more than 500 words) that outlines your plan for how you would
design your classroom to meet the different social, emotional and academic needs of your students based
on the data and design principles. Please state rationale for the priorities and components included in your
plan. This exercise presents an opportunity to introduce new, out-of-the-box designs. We encourage you
to propose your most creative options.
3. Save your file with your last name and upload into the PATS system as: “[last name]_Hiring Exercise”.
Thank you for participating in our process!

An effective secondary school design incorporates 10 integrated principles to meet the demands of the Common Core.
A h i g h-p e r f o r m i n g s e c o n d A r y s c h o o l :
continuously improves its operations & model
Use of performance data and analytics to improve curriculum and instruction
Regular review and revision of school operations and model to increase effectiveness
Has a clear mission & coherent culture
Clearly defined purpose, goals, and school culture
Mission and culture embodied in all aspects of school design
Manages school operations efficiently & effectively
Purposeful use of time, people, and technology to optimize teachers’ ability to support student learning
All elements of school design organized to maximize efficient use of resources
Flexible, customizable scheduling
Clear operational performance goals and accountability mechanisms
Automation of basic tasks whenever possible
Develops & deploys collective strengths
Teacher teaming that strengthens instructional design and delivery and enables professional growth
Mechanisms that promote innovation and initiative among teachers and staff
Differentiated roles for adults (e.g., multiple “teacher” roles) that enable effective implementation of the school model
empowers & supports students through key transitions into & beyond high school
Explicit linkages between future academic and career pathways and current learning and activities
Transparency regarding student status and progress toward graduation for students and parents/guardians
Prioritizes mastery of rigorous standards aligned to college & career readiness
Curriculum that enables all students to meet rigorous standards
Multiple opportunities for students to show mastery through performance-based assessments
Student advancement based on demonstration of mastery of knowledge and skills
Maintains an effective human capital strategy aligned with school model & priorities
Consistent, high-quality systems for sourcing and selecting teachers and staff
Individualized professional development that cultivates teachers’ strengths and meets school needs and priorities, including use of blended learning
Fair and equitable teacher evaluation
Leadership development opportunities and a leadership pipeline
personalizes student learning to meet student needs
Instruction in a variety of learning modalities, linked to students’ strengths and learning goals
Data-driven, real-time feedback for students and teachers
Embedded, performance-based formative assessments
Effective use of technology for anytime, anywhere learning
Integrates positive youth development to optimize student engagement & effort
Caring, consistent student-adult relationships that communicate high expectations for student learning and behavior
Clear expectations for student competencies and standards of performance
Opportunities for students to contribute to the school environment and have a voice in decisions
Encouragement of student responsibility for meeting learning and personal goals
Openness to and encouragement of family participation
Integration of community participation, assets, and culture
These were developed through a scan of design principles used by New York City Department of Education, New Visions for Public
Schools, and other high-performing school networks, and refined with the feedback and contributions of experienced educators.
Remains porous & connected
Effective partnerships with organizations that enrich student learning and increase access to community resources and supports
Participation in a network of schools that share knowledge and assets

© 2014 Providence Public School District 1
Incoming Student Data
Opportunity by Design Schools

© 2014 Providence Public School District 2
Domains and Indicators of Success
• Student attendance
• Behavior
• Reading achievement
• Math achievement
• Graduation rates (HS)
• Course grades (MS and HS)
Domain #1: Culture and Climate
Domain #2: Academic Achievement

© 2014 Providence Public School District 3
• Domain #1: Culture and Climate
• Domain #2: Academic Achievement

© 2014 Providence Public School District 4
2012-13 and 2013-14 Yearly Student Attendance Averages
65%
70%
75%
80%
85%
90%
95%
100%2012-13 2013-14 YTD
90
80
70
60
50
40
30 MS 1 MS 2 MS 6 MS 3 MS 4 MS 5

© 2014 Providence Public School District 5
% of Students by Absenteeism Level 2010/2011 and 2011/2012
38.3%
47.0%
33.5% 36.6%
27.3% 34.7% 31.9%
39.5%
27.5%
21.5%
29.2% 25.5%
30.2%
23.9% 29.3%
23.5%
27.5% 21.9%
20.8% 23.5% 25.3% 20.1%
24.1% 21.6%
6.7% 9.6% 16.5% 14.4% 17.1%
21.2% 14.7% 15.5%
0%
10%
20%
30%
40%
50%
60%
70%
80%
90%
100%
Gr. 610/11
Gr. 611/12
Gr. 710/11
Gr. 711/12
Gr. 810/11
Gr. 811/12
All10/11
All11/12
Low(< 5%)
Moderate (5 - < 10%)
Chronic(10 - < 20%)
Excessive (≥ 20%)

© 2014 Providence Public School District 6
Average Student Attendance by Month
80%
82%
84%
86%
88%
90%
92%
94%
96%
98%
100%
Sept. Oct. Nov. Dec.
80%
82%
84%
86%
88%
90%
92%
94%
96%
98%
100%
Sept. Oct. Nov. Dec.Feb. Mar. Apr. May Jun. Jan.

© 2014 Providence Public School District 7
Student Chronic Absenteeism (Absent > 10%)
28% 25%
35%
10%
29%
53%
82%
11%
18%
32%
16%
7%
21%
2%
10%
32%
23%
92%
4% 2%
0%
20%
40%
60%
80%
100%
Curiale Dunbar Milner DiLoreto HSC Cross** Briggs Stanton Walsh* Crosby* Windham
2012-13 2013-14 YTD
MS 1 MS 2 MS 3 MS 4 MS 5 MS 6
2012-13 state average: 11.5%

© 2014 Providence Public School District 8
Average Daily Staff Attendance Rate YTD
85%
90%
95%
100%
Curiale Dunbar Milner* DiLoreto HSC* Cross* Briggs Stanton Walsh Crosby Windham
90%
80%
70%
MS 1 MS 2 MS 3 MS 4 MS 5 MS 6

© 2014 Providence Public School District 9
Discipline Rate
0%
25%
50%
75%
Curiale Dunbar Milner DiLoreto HSC Cross* Briggs Stanton Walsh Crosby Windham
2012-13
2013-14 YTD
Students With 1+ Incident of ISS, OSS, or Expulsion as Percent of Enrolled Students
MS 1 MS 2 MS 3 MS 4 MS 5 MS 6

© 2014 Providence Public School District 10
• Domain #1: Culture and Climate
• Domain #2: Academic Achievement

© 2014 Providence Public School District 11
NECAP Reading: Overall % Proficient and Above
68% 70% 71% 71% 65%
74% 73% 72% 78%
0%
20%
40%
60%
80%
100%
Grade 6 Grade 7 Grade 8
State
2009
2010
2011
2010-11
2011-12
2012-13
42% 44% 47% 45%
32%
45% 49% 49%
56%
0%
20%
40%
60%
80%
100%
Grade 6 Grade 7 Grade 8
2009
2010
2011
2010-11
2011-12
2012-13
© 2014 Providence Public School District 12
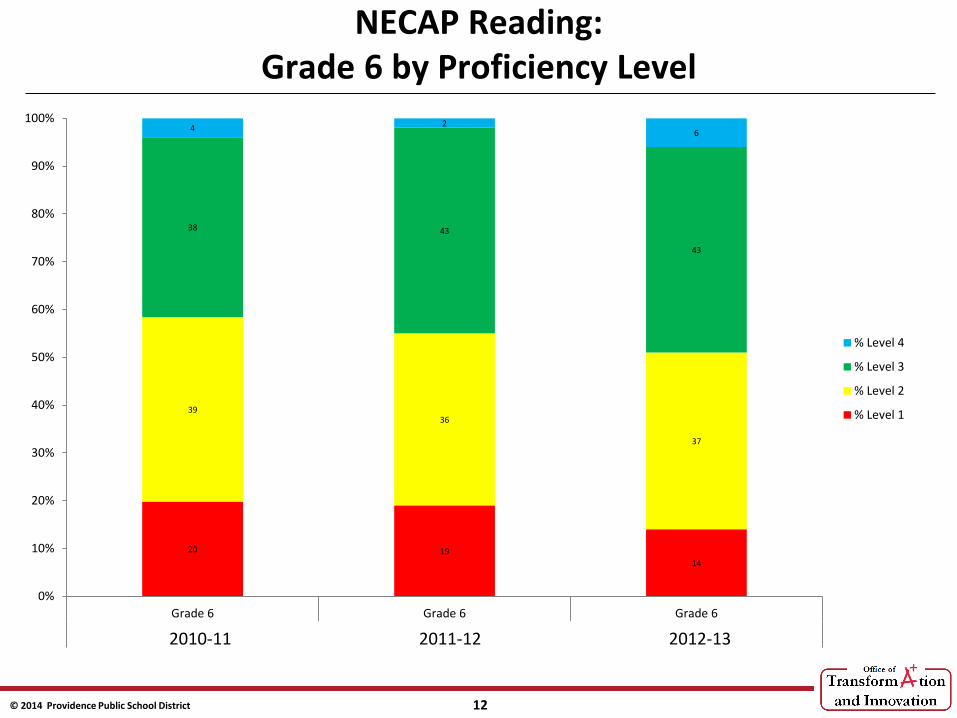
NECAP Reading: Grade 6 by Proficiency Level
20 19
14
39 36
37
38 43
43
4 2
6
0%
10%
20%
30%
40%
50%
60%
70%
80%
90%
100%
Grade 6 Grade 6 Grade 6
2009 2010 2011
% Level 4
% Level 3
% Level 2
% Level 1
2010-11 2011-12 2012-13

© 2014 Providence Public School District 13
NECAP Reading: Grade 7 by Proficiency Level
24 23
16
33
46
36
43
31
49
0%
10%
20%
30%
40%
50%
60%
70%
80%
90%
100%
Grade 7 Grade 7 Grade 7
2009 2010 2011
% Level 4
% Level 3
% Level 2
% Level 1
2010-11 2011-12 2012-13

© 2014 Providence Public School District 14
NECAP Reading: Grade 8 by Proficiency Level
19
14 18
34 41
27
39
41
49
8 4
7
0%
10%
20%
30%
40%
50%
60%
70%
80%
90%
100%
Grade 8 Grade 8 Grade 8
2009 2010 2011
% Level 4
% Level 3
% Level 2
% Level 1
2010-11 2011-12 2012-13

© 2014 Providence Public School District 15
NECAP Reading: Sub-group Proficiency
(147) (423) (40) (82) (140) (132)(476 (161) (116)
50%
39%
44%
39% 39%
51% 52%
46%
57%
9% 9% 8%
13%
0%
10%
20%
30%
40%
50%
60%
70%
80%
90%
100%
2009 2010 2011
African American
Hispanic
White
LEP
IEP
2010-11 2011-12 2012-13

© 2014 Providence Public School District 16
Percent of Students with Failing Grades (2013-14)
0%
10%
20%
30%
40%
50%
60%
70%
80%
90%
100%
ELEC ENG FLNG MATH PHED SCI SOC Overall
% of Students with Failing GradeQuarter 1
% of Students with Failing GradeQuarter 2
% of Students with Failing GradeQuarter 3
% of Students with Failing GradeQuarter 4
MS 1 MS 2 MS 3 MS 4 MS 5 MS 6

© 2014 Providence Public School District 17
NECAP Math: Overall % Proficient and Above
68% 70% 71% 71% 65%
74% 73% 72% 78%
0%
20%
40%
60%
80%
100%
Grade 6 Grade 7 Grade 8
State
2009
2010
2011
2010-11
2011-12
2012-13
25%
17%
26% 32%
22% 20%
29%
49%
22%
0%
20%
40%
60%
80%
100%
Grade 6 Grade 7 Grade 8
2009
2010
2011
2010-11
2011-12
2012-13

© 2014 Providence Public School District 18
NECAP Math: Grade 6 by Proficiency Level
47
39
45
28
28
27
24
29 26
1 3 3
0%
10%
20%
30%
40%
50%
60%
70%
80%
90%
100%
Grade 6 Grade 6 Grade 6
2009 2010 2011
% Level 4
% Level 3
% Level 2
% Level 1
2010-11 2011-12 2012-13

© 2014 Providence Public School District 19
NECAP Math: Grade 7 by Proficiency Level
52 55
16
31 23
36
16
21
49
1 1
0%
10%
20%
30%
40%
50%
60%
70%
80%
90%
100%
Grade 7 Grade 7 Grade 7
2009 2010 2011
% Level 4
% Level 3
% Level 2
% Level 1
2010-11 2011-12 2012-13

© 2014 Providence Public School District 20
NECAP Math: Grade 8 by Proficiency Level
49
56 54
25
24 23
24
19 21
2 1 1
0%
10%
20%
30%
40%
50%
60%
70%
80%
90%
100%
Grade 8 Grade 8 Grade 8
2009 2010 2011
% Level 4
% Level 3
% Level 2
% Level 1
2010-11 2011-12 2012-13

© 2014 Providence Public School District 21
NECAP Math: Sub-group Proficiency
0%
10%
20%
30%
40%
50%
60%
70%
80%
90%
100%
2009 2010 2011
AfricanAmerican
Hispanic
White
LEP
IEP
2010-11 2011-12 2012-13