obesity: a metabolic perspective. obesity trends* among u.s. adults brfss, 1985 (*bmi ≥30, or ~ 30...
TRANSCRIPT

Obesity: A Metabolic Perspective

Obesity Trends* Among U.S. AdultsBRFSS, 1985
(*BMI ≥30, or ~ 30 lbs overweight for 5’ 4” person)
No Data <10% 10%–14%
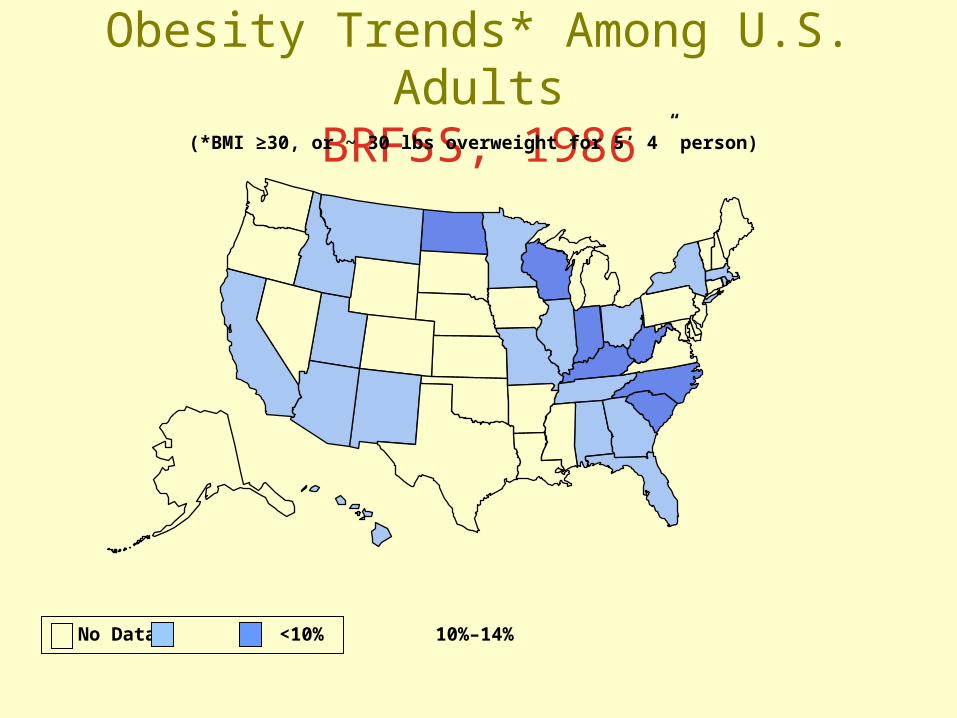
Obesity Trends* Among U.S. AdultsBRFSS, 1986
(*BMI ≥30, or ~ 30 lbs overweight for 5’ 4” person)
No Data <10% 10%–14%

Obesity Trends* Among U.S. AdultsBRFSS, 1987
(*BMI ≥30, or ~ 30 lbs overweight for 5’ 4” person)
No Data <10% 10%–14%

Obesity Trends* Among U.S. AdultsBRFSS, 1988
(*BMI ≥30, or ~ 30 lbs overweight for 5’ 4” person)
No Data <10% 10%–14%

Obesity Trends* Among U.S. AdultsBRFSS, 1989
(*BMI ≥30, or ~ 30 lbs overweight for 5’ 4” person)
No Data <10% 10%–14%

Obesity Trends* Among U.S. AdultsBRFSS, 1990
(*BMI ≥30, or ~ 30 lbs overweight for 5’ 4” person)
No Data <10% 10%–14%

Obesity Trends* Among U.S. AdultsBRFSS, 1991
(*BMI ≥30, or ~ 30 lbs overweight for 5’ 4” person)
No Data <10% 10%–14% 15%–19%

Obesity Trends* Among U.S. AdultsBRFSS, 1992
(*BMI ≥30, or ~ 30 lbs overweight for 5’ 4” person)
No Data <10% 10%–14% 15%–19%

Obesity Trends* Among U.S. AdultsBRFSS, 1993
(*BMI ≥30, or ~ 30 lbs overweight for 5’ 4” person)
No Data <10% 10%–14% 15%–19%

Obesity Trends* Among U.S. AdultsBRFSS, 1994
(*BMI ≥30, or ~ 30 lbs overweight for 5’ 4” person)
No Data <10% 10%–14% 15%–19%

Obesity Trends* Among U.S. AdultsBRFSS, 1995
(*BMI ≥30, or ~ 30 lbs overweight for 5’ 4” person)
No Data <10% 10%–14% 15%–19%
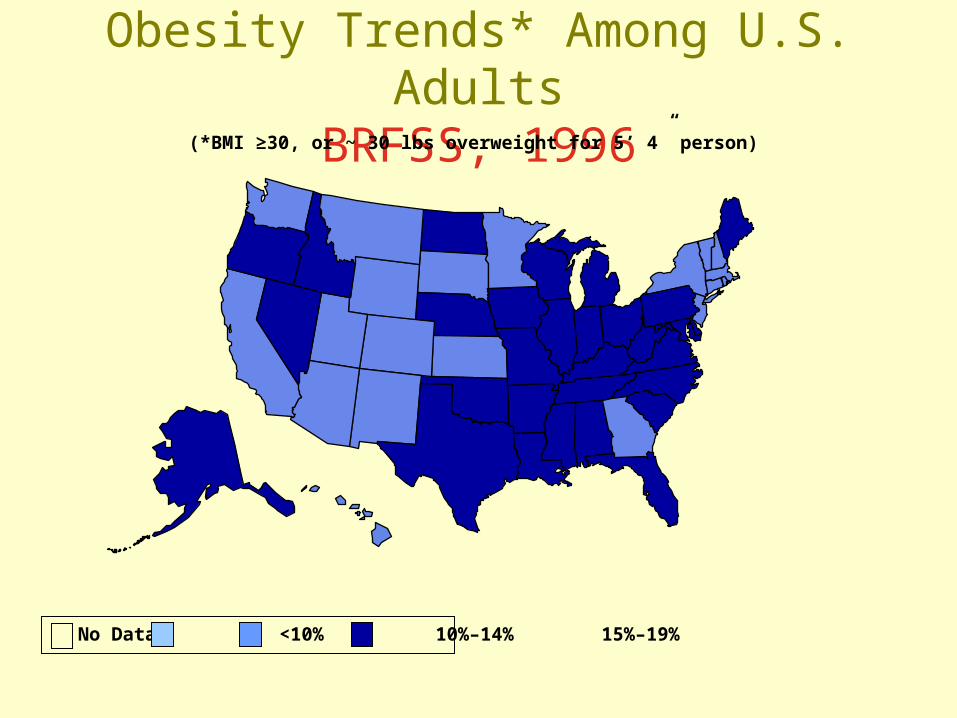
Obesity Trends* Among U.S. AdultsBRFSS, 1996
(*BMI ≥30, or ~ 30 lbs overweight for 5’ 4” person)
No Data <10% 10%–14% 15%–19%

Obesity Trends* Among U.S. AdultsBRFSS, 1997
(*BMI ≥30, or ~ 30 lbs overweight for 5’ 4” person)
No Data <10% 10%–14% 15%–19% ≥20%

Obesity Trends* Among U.S. AdultsBRFSS, 1998
(*BMI ≥30, or ~ 30 lbs overweight for 5’ 4” person)
No Data <10% 10%–14% 15%–19% ≥20%

Obesity Trends* Among U.S. AdultsBRFSS, 1999
(*BMI ≥30, or ~ 30 lbs overweight for 5’ 4” person)
No Data <10% 10%–14% 15%–19% ≥20%

Obesity Trends* Among U.S. AdultsBRFSS, 2000
(*BMI ≥30, or ~ 30 lbs overweight for 5’ 4” person)
No Data <10% 10%–14% 15%–19% ≥20%
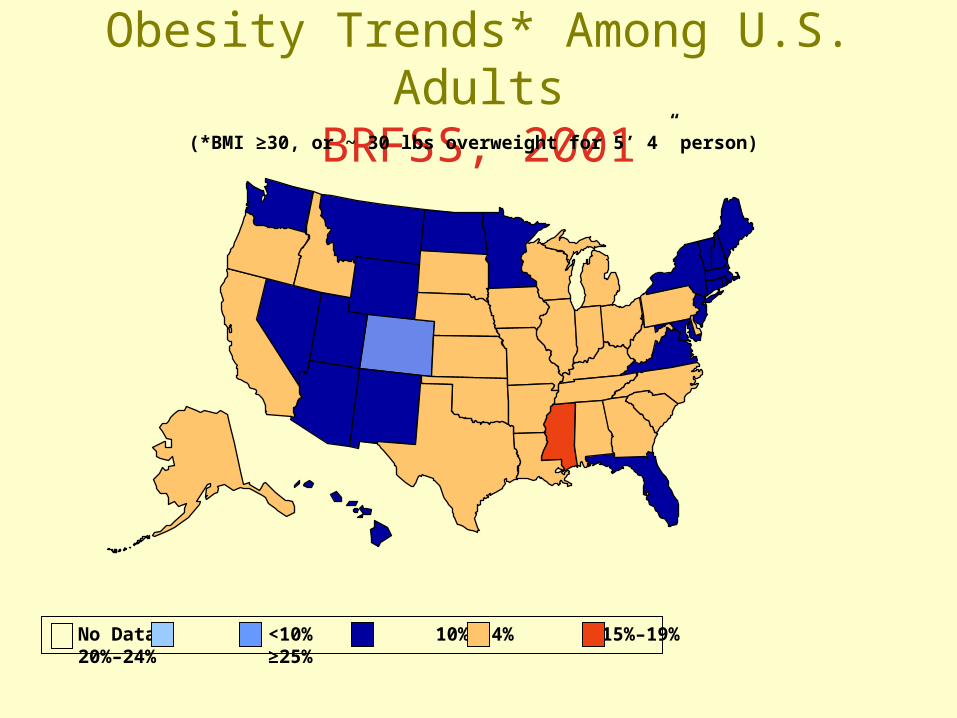
Obesity Trends* Among U.S. AdultsBRFSS, 2001
(*BMI ≥30, or ~ 30 lbs overweight for 5’ 4” person)
No Data <10% 10%–14% 15%–19% 20%–24% ≥25%

(*BMI ≥30, or ~ 30 lbs overweight for 5’ 4” person)
Obesity Trends* Among U.S. AdultsBRFSS, 2002
No Data <10% 10%–14% 15%–19% 20%–24% ≥25%

Obesity Trends* Among U.S. AdultsBRFSS, 2003
(*BMI ≥30, or ~ 30 lbs overweight for 5’ 4” person)
No Data <10% 10%–14% 15%–19% 20%–24% ≥25%

Obesity Trends* Among U.S. AdultsBRFSS, 2004
(*BMI ≥30, or ~ 30 lbs overweight for 5’ 4” person)
No Data <10% 10%–14% 15%–19% 20%–24% ≥25%

Obesity Trends* Among U.S. AdultsBRFSS, 2005
(*BMI ≥30, or ~ 30 lbs overweight for 5’ 4” person)
No Data <10% 10%–14% 15%–19% 20%–24% 25%–29% ≥30%

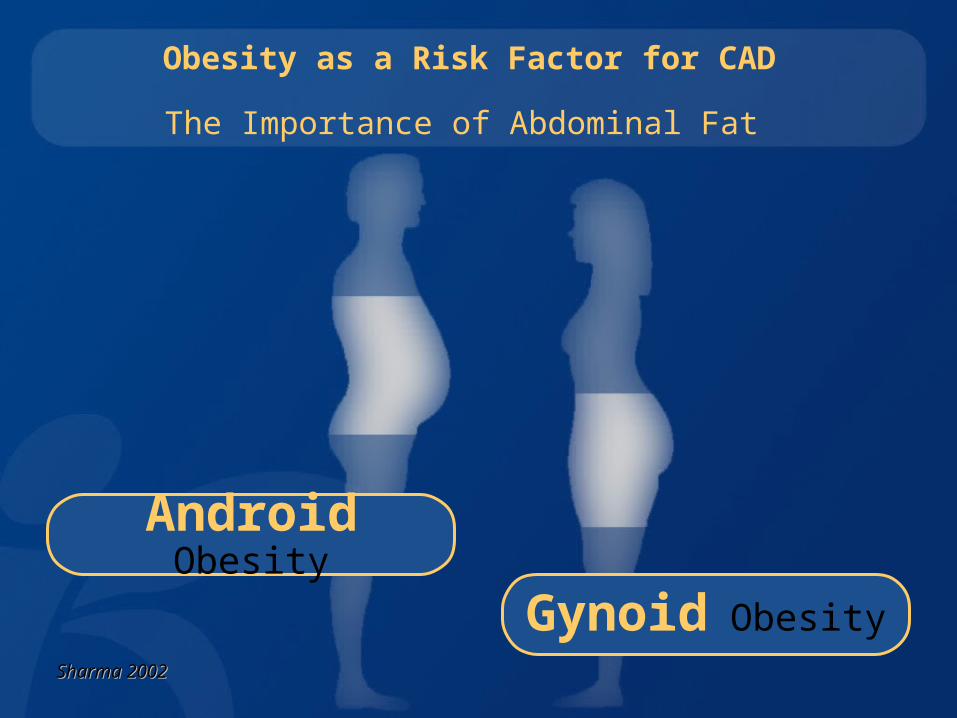
Obesity as a Risk Factor for CAD
The Importance of Abdominal Fat
Gynoid Obesity
Android Obesity
Sharma 2002Sharma 2002

Android Obesity
Obesity and Metabolic Risk
Abdominal vs. Peripheral Obesity
Small Insulin-SensitiveSmall Insulin-SensitiveAdipocytesAdipocytes
Gynoid Obesity
Large Insulin-ResistantLarge Insulin-ResistantAdipocytes Adipocytes
Sharma 2002Sharma 2002


Obesity and Cardiovascular Risk
HypertensionHypertensionLeft ventricular Left ventricular
hypertrophyhypertrophyCongestive heart Congestive heart
failurefailure
ProthrombosisProthrombosisFibrinogen Fibrinogen
PAI-1 PAI-1
Insulin resistance Insulin resistance Glucose intoleranceGlucose intolerance
HyperglycaemiaHyperglycaemiaType 2 diabetesType 2 diabetes
EndothelialEndothelialdysfunctiondysfunction
DyslipidaemiaDyslipidaemiaTotal-C Total-C • • LDL-C LDL-C
Triglycerides Triglycerides Apo-B Apo-B •• HDL-C HDL-C
RenalRenalHyperfiltrationHyperfiltrationAlbuminuriaAlbuminuria
InflammatoryInflammatoryResponse Response
VisceralVisceralObesityObesity
“Corpulence is not only a disease itself, but the harbinger of others”
Hippocrates

10 March 2004

Common Morbidities linked with Obesity
Cardiovascular risk factors
Sleep Apnoea
Heart disease
Gall bladder disease
Hormonal abnormalities
Hyperuricaemiaand gout
Stroke
Diabetes
Osteoarthritis
Cancer
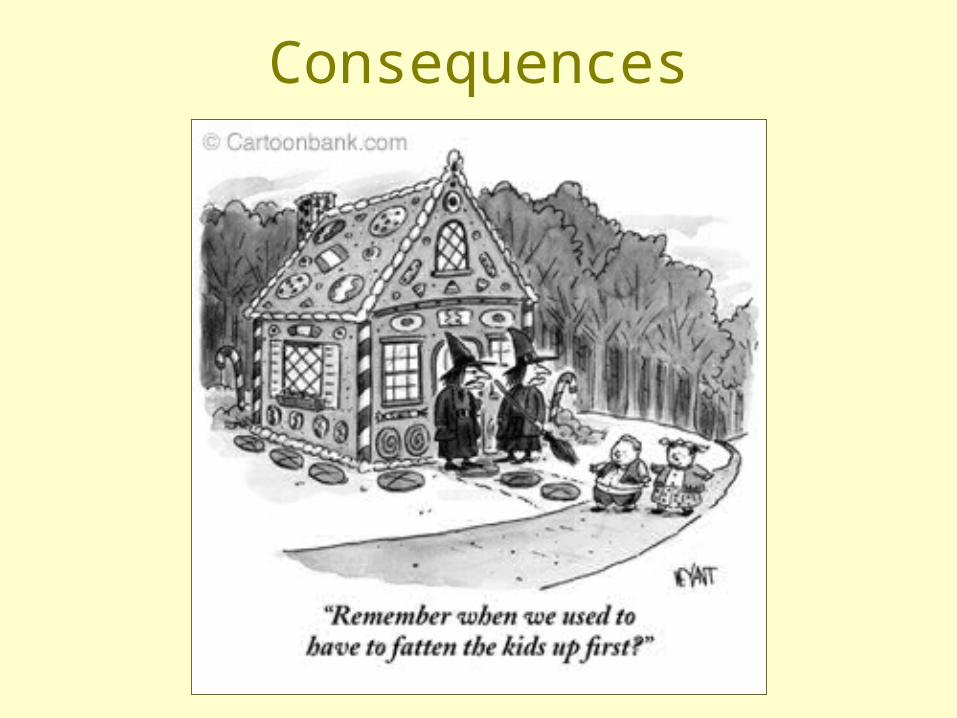
Consequences


PortugalPortugal
1.5%1.5%
LuxembouLuxembourgrg
3.3%3.3%
Prevalence of Obesity in 15-24 Year Old Europeans (BMI>30)
IrelandIreland
8.0%8.0%
BelgiumBelgium
4.1%4.1%
Spain Spain
1.4%1.4%Italy Italy
1.0%1.0%Greece Greece
11.0%11.0%
Austria Austria
5.2%5.2%
DenmarkDenmark
2.5%2.5%
FinlandFinland
1.2%1.2%
SwedenSweden
2.0%2.0%
NetherlandNetherlandss
4.8%4.8%
UKUK
3.5%3.5%GermanyGermany
3.0%3.0%
FranceFrance
1.8%1.8%Martinez JA, Public Health Nutr 1999;2(1A):125-33Martinez JA, Public Health Nutr 1999;2(1A):125-33

Case
s of
Type 2
Dia
bete
s/100,0
00
Case
s of
Type 2
Dia
bete
s/100,0
00
ADA - Consensus statement reported in Diabetes Care 2000;22(12):381ADA - Consensus statement reported in Diabetes Care 2000;22(12):381
Incidence of Type 2 Diabetes inJunior High School Japanese Children
1414
1212
1010
88
66
441976-801976-80 1981-851981-85 1991-951991-95


“Most of these persons
will not stay in treatment for obesity.
Of those who stay in treatment
most will not lose weight.
Of those who do lose weight,
most will regain it”.
Stunkard 1972

Treating obesity: how and why

Treatment efficacy?
• There is no community intervention programme worldwide that has successfully allowed long term weight loss (maintenance)
• Overall failure rate after 4 years is 96%• Minnesota ‘Pound of Prevention’ study
indicated the mean weight gain prevented was <1kg

Treatment efficacy?
• Long term studies indicate only a small proportion of people lose and then maintain lost weight
• Predictors of success: – Continuous consumption of low-energy, low-fat
food, <25%– Food diary– Breakfast

Management GoalsModerate weight loss of 5 to 10 kg willhave a major effect on obesity co-morbidities -
• impaired glucose metabolism• hypertension• dyslipidaemia• sleep apnea• polycystic ovary syndrome
The weight loss needs to be sustained

Treatment benefits?Diabetes Prevention Program (USA) N=3234 (67% female); IGT50.6 years, Weight 94.8kgBMI 34 kg/m2
2.8 yearsLifestyle interventionMetforminPlacebo

Treatment benefits?
Diabetes Prevention Program Research Group 346 (6): 393, Figure 2 February 7, 2002

Treatment benefits?
Diabetes Prevention Program Research Group 346 (6): 393, Figure 1 February 7, 2002
Goal weight loss: 7% (6.6kg)

Treatment benefits?
Diabetes Care 28:888-894, 2005

Treatment benefits?
Diabetes Care 28:888-894, 2005
Obesity management strategies
• Diet
• Physical activity
• Pharmacotherapy
• Surgery
Obesity management strategies
• Diet – Best achieved by a combination of
hypocaloric/low fat diet– Aim to reduce intake by 2000-2500 kJ/day– 32000 kJ = 1kg– 0.5kg / week

Obesity management strategies
• Diet
• Physical activity– 30 mins 3 times a week is not sufficient to
allow weight loss or to maintain lost weight– Current recommendations: 60-80 mins
moderate intensity exercise daily
Obesity management strategies
• Diet• Physical activity• Pharmacotherapy
– Duromine– Fluoxetine– Sibutramine– Xenical– Optifast

Sibutramine: mechanism of action
• Serotonin (5-HT) and noradrenaline reuptake inhibitor.
• Dual mode of action: – reduces food intake by enhancing satiety– increases energy expenditure by enhancing
resting metabolic rate• Side effects
– Hypertension, tachycardia– Serotonin syndrome (SSRI’s, anti-psychotics)
McNeely and Goa. Drugs 1998.

Xenical :
mechanism of action
• Inhibits gastrointestinal lipases which are required for the systemic absorption of dietary fat
• Prevents the absorption of 30% of dietary fat
• Safe with minimal systemic absorption and no accumulation
• Significant GI side effects

Xenical
(n=8)
Sibutramine (n=8)
Kg -1kg -4kg
HbA1c -0.7% 0%
SCGH prescriptions for Xenical and Sibutramine
6 months therapy
10% lose >10 kg at 6-12 months

Management of Obesity: Objectives
• Prevention of weight gain• Encourage sustainable weight loss over longer
term
• Promotion of weight loss• 0.5 to 1.0kg per month is reasonable
• Up to a 10% reduction in body weight over a 12 month period
• Improvement of co-morbidities• Attainable with a weight loss as low as 5%
• Encouragement of active lifestyle• Broaden concepts of activity
• Improvement in quality of life• Enhance feelings of “well-being”
* NHLBI Clinical Guidelines 1998