obesity and its association with maternal and child health
TRANSCRIPT
1
Obesity and its association with maternal and child health outcomes
among women in India
Background: Globally, Obesity has reached epidemic portion and one of the new
emerging health problems, which increased risk of pregnancy complication and
premature death due to serious chronic health condition. This study explore association
between obesity and maternal and child health outcomes among women in India.
Data: Using data from National Family Health Survey (NFHS) conducted in India
during 2005-06 successively, was used to estimate obesity and its impact on maternal
and child health outcomes using logistic regression and cox proportional hazard model.
Results: The prevalence of obesity was 15.3% among women in India; rate of increase
in the level of obesity has much higher than developed countries. However, obesity
statistically significantly associated with maternal and child health outcomes. Obese
women were high risk of pregnancy complication such as cesarean, prolonged labor,
swelling, vaginal bleeding, and have a high risk of fetal death and deliver macrosomic
infant.
Conclusion: The findings from this study suggest that obesity and its associated chronic
morbidities is more severe problem in India. There is strong need to some national plan
of action to address obesity before to reach emergency level.
Keywords: Obesity, Maternal complication, Child health outcomes, Cesarean and
Macrosomia etc.
2
Introduction
Globally, obesity has reached epidemic proportions, with more than 1.4 billion adult
people overweight and at least 200 million men and 300 million women, among them
are obese (WHO, 2008). In India, about 20 percent of male and 18 percent of female
adult are overweight/obese and 5 percent population of the country suffering from this
chronic epidemic. According to National Family Health Survey (NFHS) II, 10.5 and
NFHS III, 15.3 percent of female in reproductive age are overweight/obese
respectively. It is an important emerging public health challenge, because it is foremost
risk factor, which contributes to the main diseases leading to global burden of diseases,
disability and premature mortality. In addition it has harmful effect on health,
especially women’s reproductive health. Obese women are more likely to face serious
health problems during pregnancy which may lead to complication resulting into
cesarean delivery, gestational diabetes, postpartum anemia, menstrual disorder,
infertility, miscarriage, poor pregnancy outcomes (Clark et al., 1988).
The causes of increase in prevalence of obesity could be attributed to changes in
nutritional transition. This has eventually led to significant increase in body mass index,
which hikes the prevalence of obesity over time in developed as well as developing
countries. The magnitude of the problem varies between different counties as well as
with respect to different socioeconomic conditions within the country (Aekplakorn et
al., 2004 and Yoon et al., 2006). The higher prevalence of obesity is seen in urban area
and is associated with the changing pattern of life style causing decreased level of
physical activity and increased intake of energy dense diet. The level and risk factors of
obesity and overweight significantly differ for women and men as is evident from
number of studies that have shown that prevalence of obesity is higher among women
as compared to men (James et al., 2001). However, it is also associated with higher
socioeconomic status (SES) (Ramchandran, 2008; A l - Sendi et al., 2003; Kelishadi et
al., 2008 and Vijayalakshmi, 2002). The prevalence of non-communicable diseases, such
as cardiovascular diseases, diabetes, certain cancers and also some adverse pregnancy
complication are higher among obese mothers (Ramchanderan, 2010; Moura & Claro,
2012). Obesity is associated with comorbidities like menstrual dysfunction, reproductive
disorder including infertility, increased rate of abortion and pregnancy complication
and adverse pregnancy outcomes (Seidell et al., 1993; Douchi et al., 2002 and lake et al.,
1997). It is more likely to have a higher rate of induction of labor infection, internal
3
bleeding and hence requires assisted delivery (Denison et al., 2008; Ryan, 2007; and
Ramchanderan et al., 2008). The evidence from different studies emphasizes that
maternal obesity has been associated with increased risk of cesareans delivery and is
more common among pregnant women who are obese (Lynch, 2008; Sarkar et al., 2007;
Ryan, 2007; Baura et al., 2007; and Jain et al., 2007). Similarly, another pregnancy
complication factors like miscarriage, pre-eclampsia, gestational diabetes, bleeding,
labor, obstetric complication and fetal macrosomia; has greater chance of having a
cesarean delivery ( Ryan, 2007; and Kasha & Kenny, 2009). Finally, maternal obesity
and excessive weight gain increases the chance of fetal death or infant mortality; and
high risk of prenatal death associated with pregnant women is more likely to be twice
among obese women (Seligman, 2006).
After doing extensive review of literature, it is found that there is least literature
available on obesity and its association with maternal and child health outcomes in
India. This study tries to fill this gap by explaining how obesity is associated with
maternal and child health outcomes and its variation across the country by
understanding the impact of socioeconomic changes that have taken place in Indian
society since beginning of this century with the help of objectives mentioned below.
First we examine the level and pattern of prevalence of obesity across different states
and socio economic strata of the country; secondly, we have tried to explore effect of
obesity on selected socioeconomic and demographic characteristics; thirdly, it examine
impact of obesity on maternal outcomes such as cesarean delivery, pregnancy
complication like vaginal bleeding, labor and swelling; lastly, we explore the impact of
obesity on health outcomes of newly born infant such as infant mortality and
macrosomia.
Data source:
Data is derived from National Family Health Surveys second and third round (NFHS-II
& III), which were conducted in India during 1998-99 and 2005-06 respectively. It is a
large scale household survey carried out periodically, which facilitates cross national
comparison and representative at regional level. The survey provides information on
demographic, socio-economic and health profile of ever married women. This data
provide an opportunity to examine the covariates of overweight/obesity and its
association with adverse pregnancy and child health outcomes in India, which is
undergoing rapid changes in lifestyle, physical activity and diets. So, we have used this
4
data sources for analysis of prevalence of obesity and its association with maternal and
child health outcomes among women and children in India.
Response variables used in analysis
Body mass index (BMI) is a key variable measured at the time of the survey, which is
used as outcome and an explanatory variable. The procedure used for calculation of
BMI in National Family Health Survey, each ever married women with age 15-49 was
weighted using a solar powered scale with an accuracy of ± 100 g. their height was
measured using an adjustable wooden measuring board, specifically designed to
provide accurate measurements (to the nearest ± 0.1cm) in a developing country field
situation (Agrawal and Mishra, 2004). The weight and height data used to calculate the
body mass index (BMI). Women who were pregnant at the time of survey or women
who had given birth during the two months preceding the survey are excluded from the
analysis, as the real BMI is affected due to the pregnancy and pregnancy outcomes.
Although, this study is more interested on pre-pregnancy BMI, it is fair to assume that
post pregnancy BMI will be strongly associated with pre-pregnancy BMI. The obese
women are more likely to gain more weight during pregnancy. The weight gain during
pregnancy and pre-pregnancy weight are positively associated with adverse pregnancy
outcomes (Jain et al., 2007 and Cedergren, 2006). The BMI is used to estimate the
prevalence of underweight, as well as overweight and obesity.
Definition of obesity used for analysis:
As per the definition given by World Health Organization (WHO, 2003), the BMI is
calculated by weight (in kilogram) divided by the square of height (in centimeter). As
per this definition BMI is divided into four categories; a BMI of less than 18.5 kg/m2 is
defined as underweight, indicating chronic energy deficiency. A BMI in the range of
18.5 and 24.9 kg/m2 is defined normal; 25.0 and 29.9 kg/m2 as overweight; and more
than 30 kg/m2 as obese. Based on these cut-offs, we created three category variable of
nutritional status of women, indicating thin, normal and women with above 25.0 kg/m2
as obese (Agrawal and Mishra, 2004).
In addition, the second outcome variable asks women if the last birth was cesarean or
else normal delivery. The third outcome variable is labor and delivery complication,
measured by the women reporting prolonged labor, excessive bleeding and body
swelling during past year of birth. The fourth outcome variable is infant mortality,
which is measured using the total number of women who have reported that her last
5
birth ended in death of baby in first year of birth. Finally, fourth outcomes variable is
fetal Macrosomia, which is measured in term of a newborn with an excessive birth
weight.
Definition of macrosomia:
Fetal macrosomia has been defined in several different ways, including birth weight of
4000-4500 g (8 lb 13 oz to 9 lb 15 oz) or greater than (Jazayeri et al., 1999). The study
on the macrosomia has found that the macrosomia varies with ethnicity and reportedly
associated with neonatal morbidity, neonatal injury, maternal injury, cesarean delivery
and maternal BMI level (Spellacy et al., 1999).
Methodology:
The Descriptive analysis is used to estimate prevalence of obesity across country and
also inter-state differential in India. Further, bi-variate and tri-variate analysis are used
to understand the socioeconomic and demographic differential in the prevalence of
obesity in India. The binary logistic regression analysis is used to examine association
of selected background characteristics on the prevalence of obesity and its
consequences during adverse pregnancy complications such as Vaginal Bleeding,
swelling and labor and outcome like Cesarean, Infant Mortality and Macrosomia in
India. Further, the cox proportional hazard model has been used for analysis of effect of
obesity on child health outcome as infant mortality. The STATA statistical software
package is used to perform overall analysis. The result has been presented in the form
of odd's ratios (OR), with 95% percent confidence interval (95 % CI). The estimation of
confidence intervals takes into account design effects due to clustering at the level of
the primary sampling unit.
Results
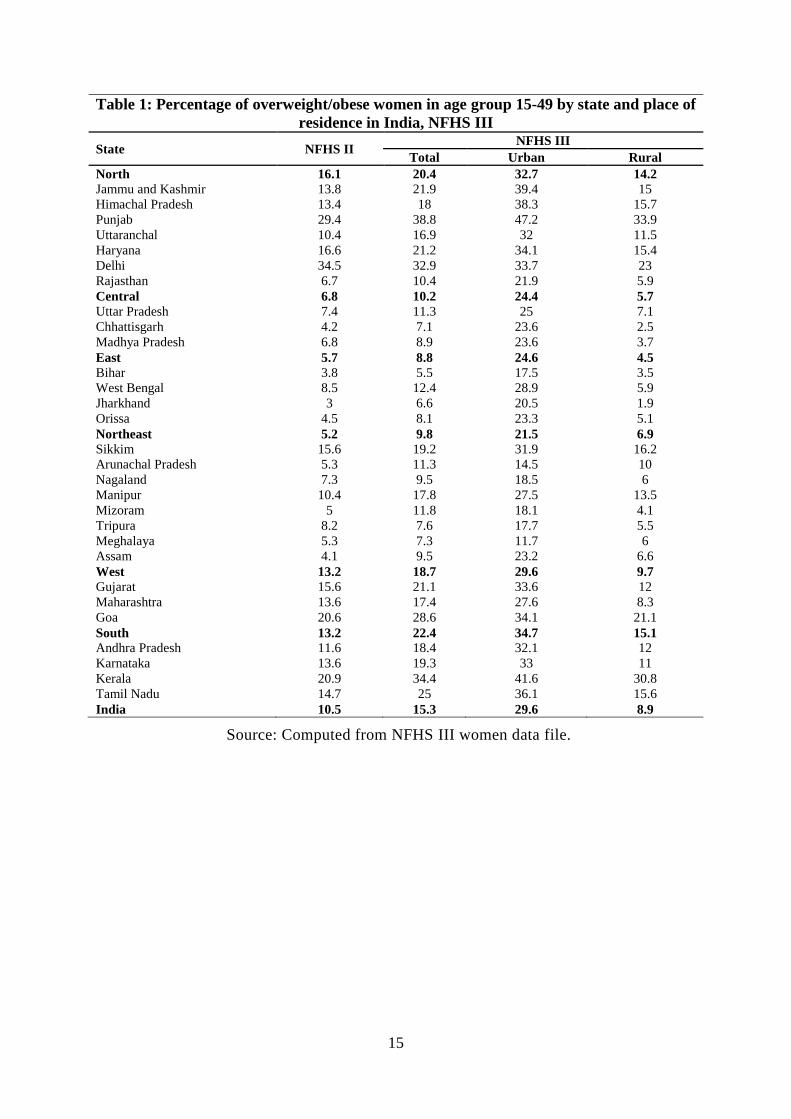
Table 1, shows prevalence of obesity across India, according to NFHS III, the
prevalence of obesity was 15.3% and NHFS II, 10.5%; in just last seven years, nearly
fifty percent increase in level of obesity among Indian women. Comparing regions, the
highest increases in obesity were observed in northeast about 88.5%, followed by south
57.7%, East 54%, Central 50%, West 41.7% and North 26%. However, comparing
states in India over time, it was observed that more than double increase in obesity
among women from the northeastern state like Mizoram, Nagaland and Assam and all
another state has shown more than half increase in level of obesity. The prevalence of
obesity varies by place of residence, urban area 29%, and rural area 9% among women.
6
Further analysis in this study has been restricted to the only NFHS III data in India.
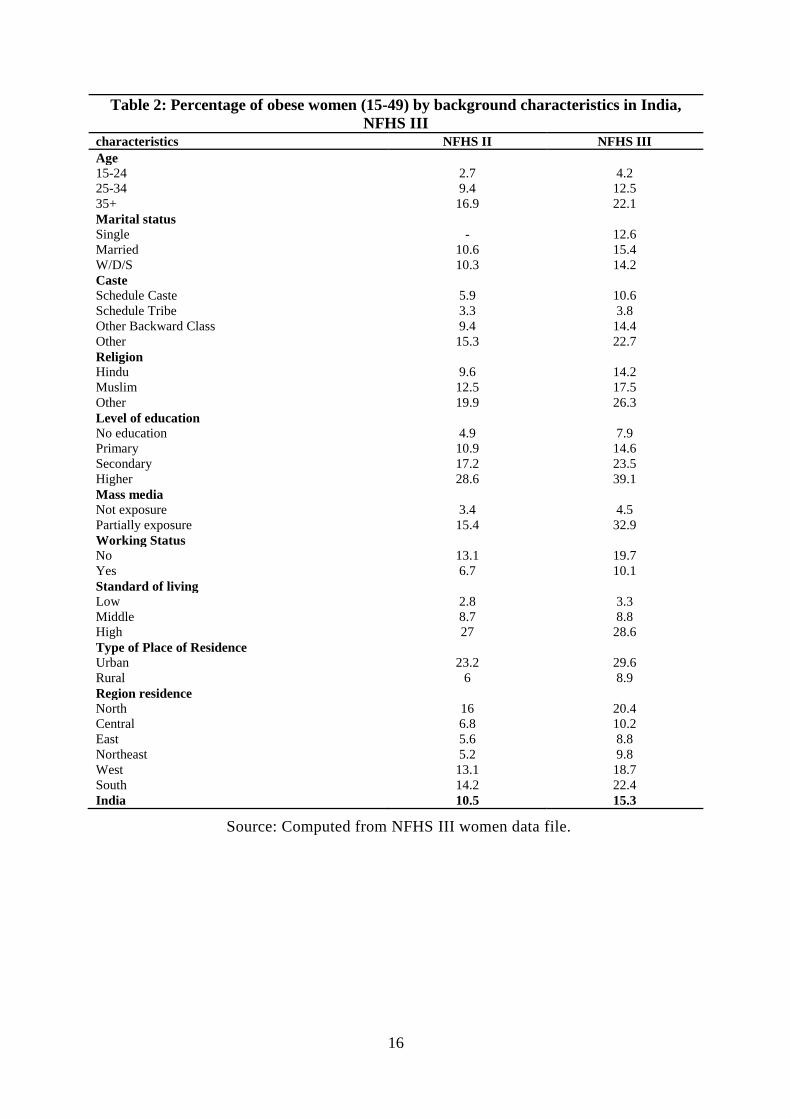
Table 2, shows prevalence of obesity by socio-economic and demographic
characteristics; the women form different age group across place of residence, the
higher age groups (35+), has high proportion of obesity than younger age group of 15-
24 years. Women who were married, from upper caste, and highly educated have a high
prevalence of obesity than their corresponding categories. While, women who have any
mass media exposure are found to be more prone to become obese. Mass media
exposure and currently not working status of women is associated with physical
inactivity level, which is frequently more responsible for increase in level of obesity.
Although, obesity is associated with sendarty life style, which is practices more by
women from wealthy families and this explains high prevalence of obesity among
richest section among society. However, prevalence of obesity differs by socioeconomic
status and spatial distribution of population. Women from urban area are more likely to
be obese than women from rural area due to socioeconomic differential. Similarly,
women from south, north and west region were found to be more likely to become
obese than the women from their counterpart regions.
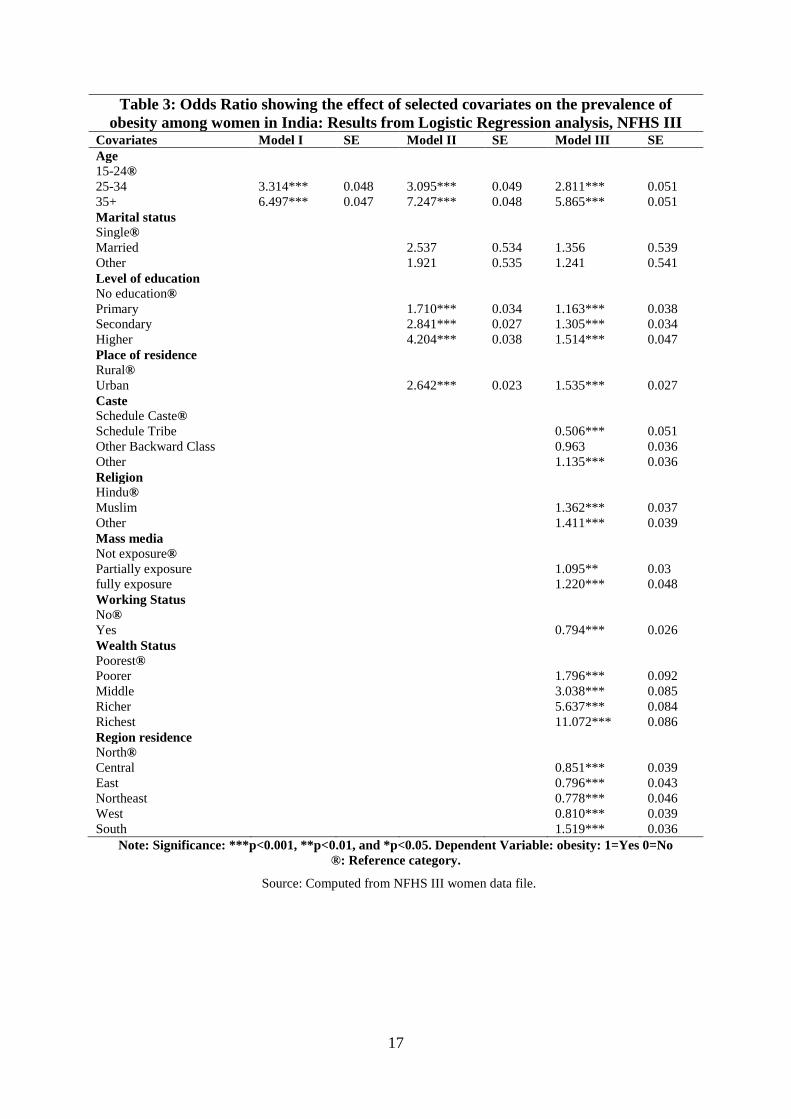
Table 3: The adjusted logistics regression analysis describes many of the same trends
as in the bivariate analysis performed above. All the covariates were found to be
positively and statistically significantly associated with obesity, except marital status of
women. The women of older age group from upper caste and other religion with high
wealth status are more likely to be obese than their respective counterpart. However,
women belonging to the south region have been found to be at very high risk of obesity
than respective reference category women in India.
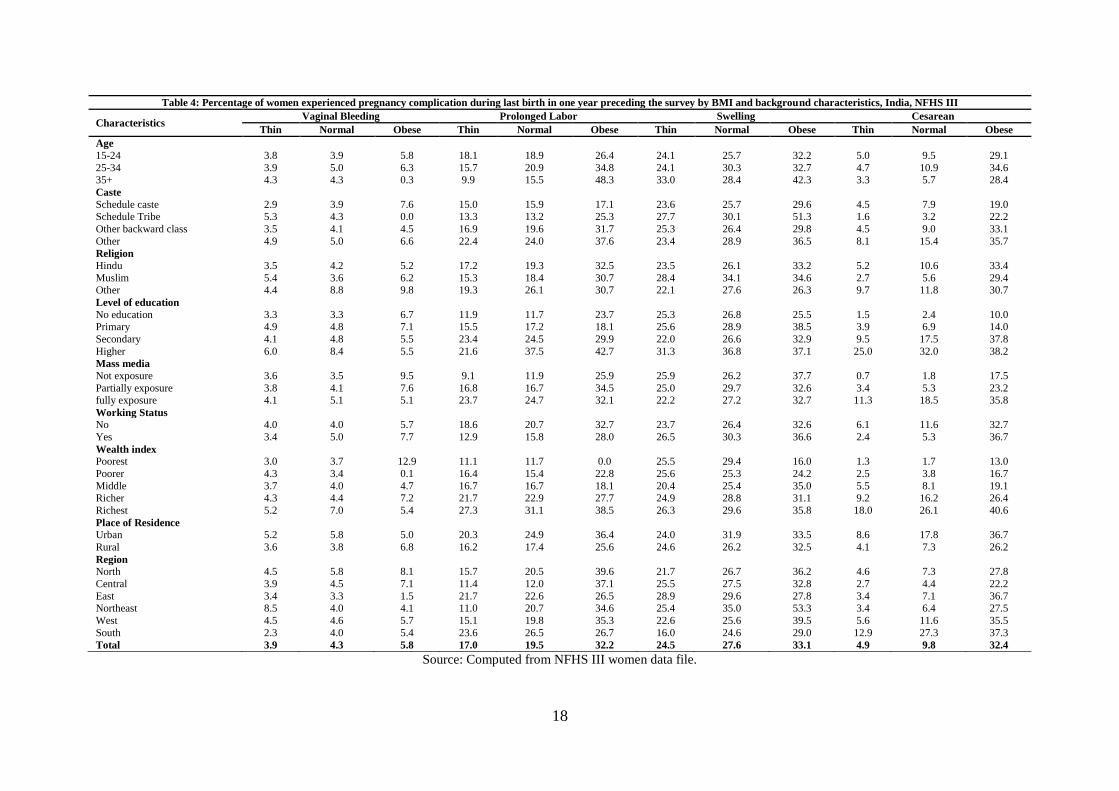
Table 4: Shows that prevalence of pregnancy complication and outcome during last
birth by BMI level and socio-economic and demographic characteristic of women.
Obese women are found to be at all time high risk of any type of pregnancy
complication than thin and normal women. The obese women from high socioeconomic
status with any mass media exposure are found to be more prone to pregnancy
complication experienced bleeding such as excessive vaginal, prolonged labor,
swelling, and cesarean delivery than women from their corresponding categories.
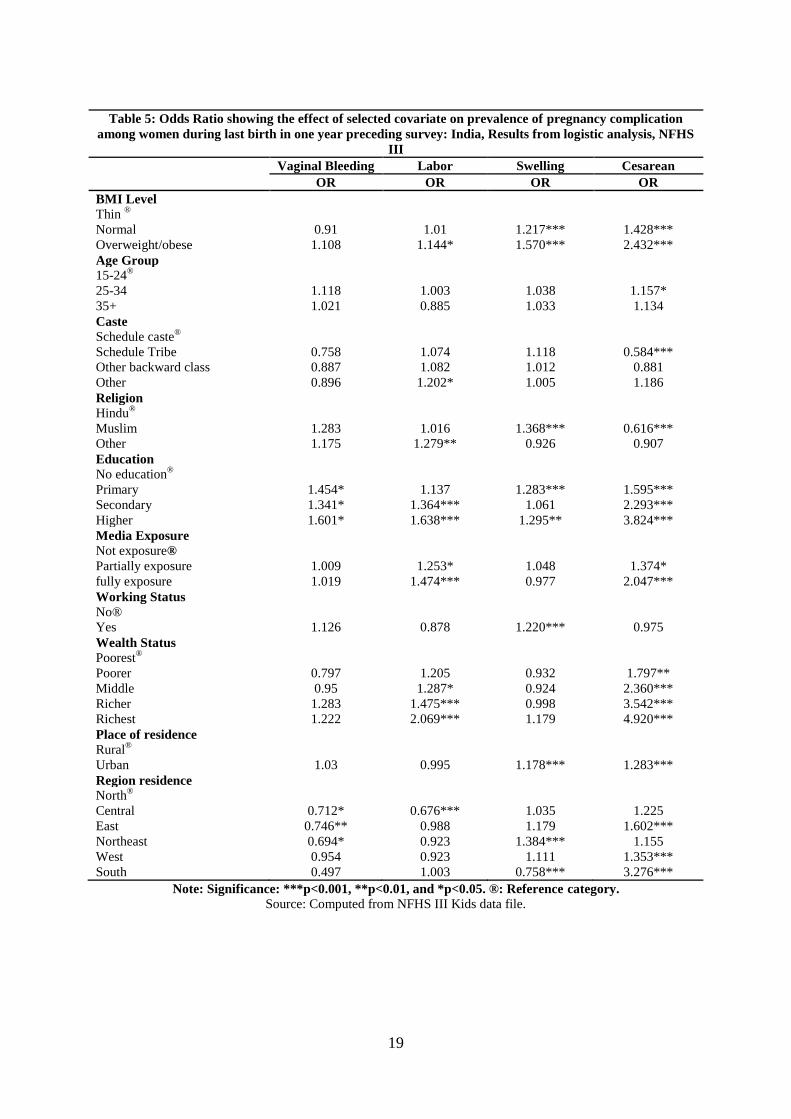
Table 5: The regression analysis results for the pregnancy complication, shows that
obesity leads to an increased risk of complication. The covariate such as obesity in
terms of BMI, age, education and wealth status are positively associated with various
7
pregnancy related problems; while, only one covariate education, is positive for
excessive vaginal bleeding. However, the obesity, caste, religion, education, and wealth
status is statistically significant and is associated with prolonged labor. In case of
swelling, the obese women with higher education from Muslim religion and belonging
to urban residence as well as women from northeastern states have high risk of swelling
than their counterpart.
The results for cesarean delivery during last birth show that obesity is positively
associated with cesarean delivery. It is also statistically significant when measured by
high risk of cesarean among obese women. The other covariate such as age, caste,
religion, education, working status, mass media exposure and wealth status of women
were positively related to the cesarean delivery. The women with 25-34 ages, higher
educated, having full mass media exposure, urban residence, belong to affluent family
and from South region were more likely to have gone for cesarean delivery than
corresponding reference category women.
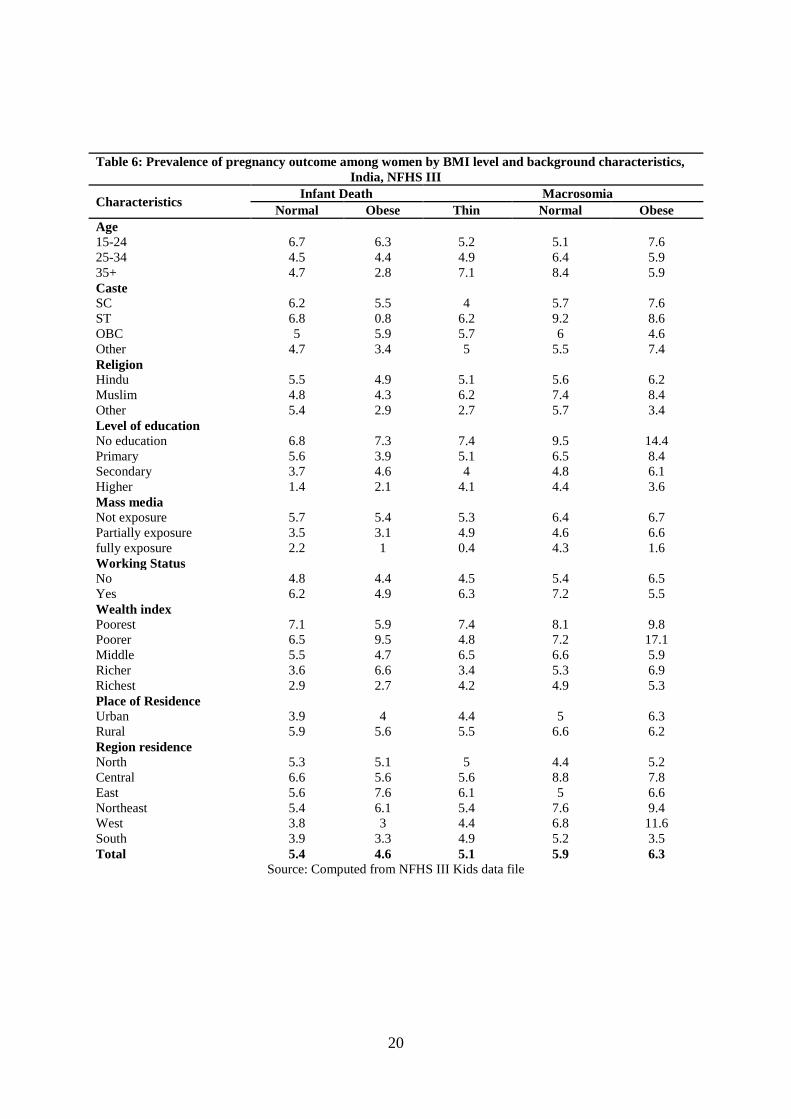
Table 6: shows that results for prevalence of Macrosomia by selected characteristics of
women, In India, prevalence of macrosomia increases with level of BMI; while, obese
women nearly (6.3%) have a high proportion than lower BMI level. the diabetic women
are more likely to deliver macrosomic fetus than non-diabetic. However, obese women
from 15-24 age group with characteristics such as, schedule caste, Muslim religion,
non-educated, no mass media exposure, currently not working, poorer wealth status and
belonging to Northeastern region have high proportion in delivering macrosomic infant
than their counter part women across the level of BMI.
Table 6: also shows results for infant mortality; unfortunately, the descriptive statistics
does not give clear picture about obese women with high proportion infant death. It
could be because of different countries use different age distribution and definition for
infant mortality. The prevalence of infant death by all covariates across level of BMI
has not shown any clear picture, that is why this study tires to go for further multi-
varties analysis using cox proportional hazard model, which will enable us to see in-
depth effect of covariates on outcome variable.
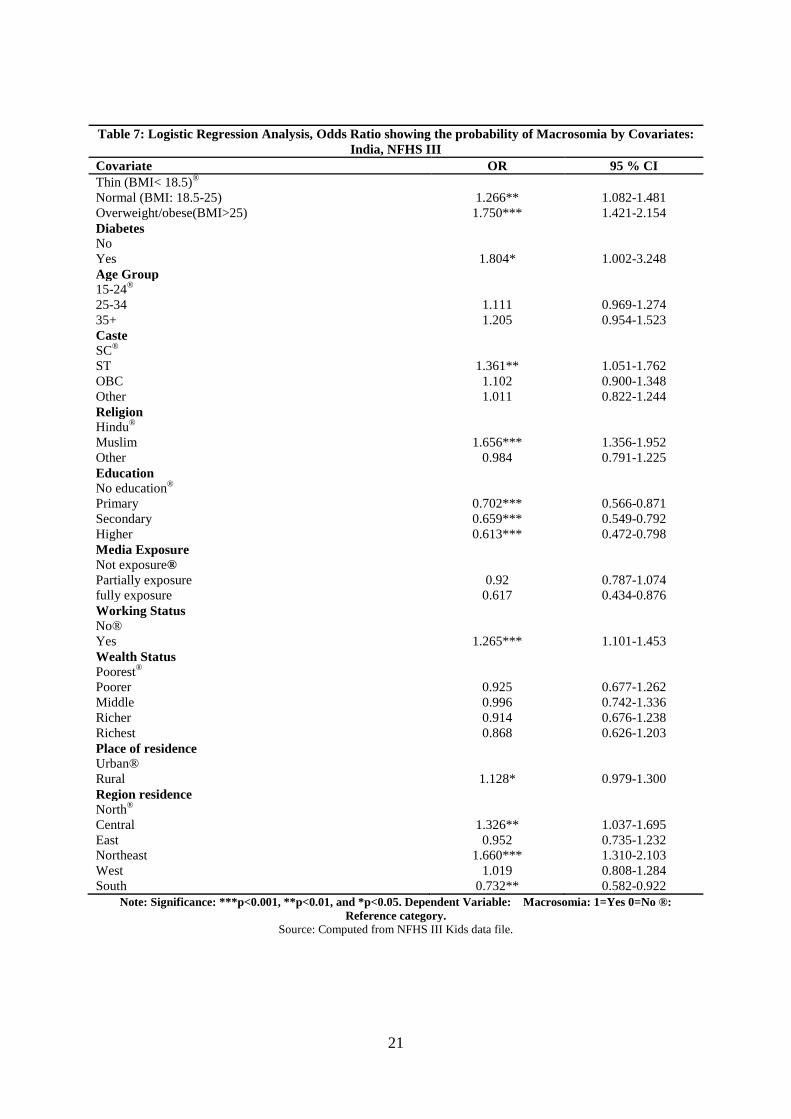
Table 7: shows that results for macrosomia; obesity has statistically significant
relationship with fetal macrosomia. The obese women were more likely to deliver
macrosomic infant than lean women. The diabetic women were much more likely to
have macrosomic infant as compared to others. The literature from developed countries

8
found that macrosomia varies with ethnicity (Jazayeri et al., 1999), this study also found
the same results in case of India; the schedule tribe women were 1.36 times more likely
to deliver macrosomic infant, and also women from Muslim religion have very high
risk of delivering macrosmic infant than counterpart women. However, level of
education is negatively associated with macrosomia. The women with higher education
were less likely to deliver macrosomic infant than non-educated women. The working
women from rural residence, and belonging to North and Northeastern region were
more likely to deliver marcosomic infant with high level of statistical significance.
Table 8: shows results for Cox Proportional hazard Model, A number of findings for
determinant of infant mortality have been expected. The result expected for obese
women were to show that infants are more likely to die when born to obese women than
other category women; we found higher magnitude of odds for infant death, but does
not found statistically significant effect on infant mortality. The reason of the
insignificant result for obese women may be because of age distribution of infant
mortality and their different definition across countries. The majority of study from
developed country found the positive relationship between infant mortality and obesity.
The education and wealth status of women has significant effect on infant mortality.
The increase in wealth status and level of education is negatively related to infant
mortality; which means women with higher education and belonging to affluent
families are less likely to have infant mortality.
Discussion:
Obesity has been increasing in India over the last decade and is now at higher level.
The rate of increase in the level of obesity in India is much higher as compared to
developed world. The study found that considerable proportions of women from many
states of India are already overweigh/obese. The problem is more severe in some
southern and northern states like Kerala, Punjab and Delhi. The India is a developing
country, which is in degenerative phase of the nutritional transition because of the
increase in additional burden of under nutrition and related health problem. The
increase in prevalence of obesity are double burden of nutritional health problem and its
associated non-communicable disease (NCD); and the same time we have to deal with
the problem associated with increasing obesity (Prakash S, 2002, Monterio & Popkin,
2004). However, it is found that there is wide variation in the relationship between
socioeconomic status and obesity. The changes in socioeconomic inequality and
regional variation have been associated with prevalence of obesity. In India, older age
9
(35 and above) and urban women clearly display the relationship, whereby the rich and
highly educated are more likely to be overweigh/obese controlling all other
characteristics, while it is contradictory to the research conducted in the developed
world, shows that poor is more likely to be obese (Popkin et al, 2002). But, in case of
low income country; it is positively related to socioeconomic status (McLaren, 2007). It
could be because of lower level of development, the poor are more likely to food
scarcity and increased energy expenditure, and that may be the reason of lower
prevalence of obesity among group with lower (SES) socio-economic status (Moneterio
et al., 2004).
As expected, the place of residence, mass media exposure, age and ethnicity is
positively associated with obesity. Previous studies (Moneterio et al., 2004) found that age
is an important determinant of obesity; the study also found that increase in prevalence
of obesity among older age and urban women. Unfortunately, it is going be the future
challenging issue in India. The married are more likely to be obese; it may be because
of married women play different role in society and some study also found that gender
roles are positively associated with obesity. The sedentary life style in terms of
composite physical activity level is the main reason for greater increase in prevalence
of obesity among urban women (Vaz et al., 2005). Changes in physical activity and life
style are positively associated with an increase in obesity rate in both developed and
developing country (James, 2007). The specific role, gender and age defined role may
directly impact on activity level; this study found that working women are significantly
less likely to be obese, due to their greater likelihood of activity level than that of not
working. The full mass media (Daily watch TV/listen Radio/reading Newspaper)
exposure are also significantly associated with obesity and also lower level activity.
The many studies found that causes behind the prevalence of obesity and its related
consequence for both developing and developed world. However, the many factor
influencing body weight gain as genes (Small effect), urbanization, rise in the economy,
rapid nutrition transition, standard of leaving, prenatal/postnatal influence, life style
change, unhealthy diets, too much television watching, and lower level of physical
activity. The consequences like heart disease, depression, blood pressure, diabetes,
asthma, sleep apnea, gallstone, kidney stone, infertility, stroke and including 11 types
of cancer, including leukemia, breast, and colon cancer and also social and emotional
effect including discrimination (Popkin et al., 2002; Kim et al., 2006; Ngoc et al., 2006; and
Mishra et al., 2005).
10
This study highlights how the maternal and child health outcome has been associated
with obesity; As expected, cesarean section is significantly associated with both
maternal and SES of women than their counterpart women and the prevalence of
cesarean increases over time. Nevertheless, (Ramchandern et al., 2008) demonstrate
maternal obesity is also significantly associated with adverse pregnancy complication,
showing that obese mothers are more likely to suffer pregnancy complication. This
study also demonstrates that maternal obesity is significantly associated with the
pregnancy complication. However, some important problem not analyzed in this study
but exiting literature shows that still the obesity is major risk factor in gestational
hypertensive disorder, gestational diabetes mellitus and gestational thromboembolic
disorder. The obese women are more likely to progress beyond the term (more than 42
week of gestation) as compared to normal BMI and lean women (Castro and Avina, 2002).
In this study, the result for infant mortality partially supported finding of the existing
literature. The existing literature shows a clear relationship and causal association
between maternal obesity and poor infant outcomes; that relationship is associated with
preterm delivery due to preeclampsia, difficult delivery due to macrosomia and
increased congenital malformation (Andraesen et al., 2004).The lack of relationship
between obesity with infant mortality may be due to the large number of studies
between obesity and infant health are from developed world where age distribution of
infant or definition of infant mortality is different that of from India. In addition, the
number of studies from developed world found that the macrosomia is strongly
associated with maternal obesity, even after controlling maternal diabetes. Diabetes has
an independent and additive effect with maternal obesity and increase in the likelihood
of macrosomia (Maouzoni et al., 2006). The association between obesity, diabetes and
macrosomia has increased chance that the fetus born to obese women are diabetic one
and will suffer shoulder dystocia a dangerous obstetrics condition (Kiran at el., 2005).
Nevertheless, this study evidently found a positive association between maternal
obesity, diabetes and macrosmia. The obese women with diabetes are more likely to
born macrosomic infant.
Conclusions:
This study addresses many questions related to obesity in India, with relatively high
obesity and its relationship with maternal and child outcomes. Presently, developing
countries are experiencing much faster transition of obesity than developed countries, at
much earlier stage of demographic and epidemiological transition. It is Important to
11
understand why Indian women suffer such high prevalence of obesity. Similarly, it is
vital to quantify what extent of obesity is associated with poor health outcomes and also
identify what group is more likely to suffer poor health outcomes. In India, number of
flagship program has addressed reproductive problem and inequality in nutritional
status among women but till now, there is no single program to address this growing
epidemic in India. The maternal health problems associated with obesity are acute with
no time lag to allow health care service to prepare themselves. Now, it time to address
this sever epidemic with giving equal importance with other health related issues.
Timely intervention of health care services may reduce the chronic co-morbidities
related to obesity. A wise is saying, “An ounce of prevention is worth a pound of cure.”
12
References:
Aekplakorn, W., M.C. Hogan, V.associted Chongsuvivatwong, P. Tatsanavivat, S.
Chariyalertsak, A. Boonthum, S. Tiptaradol, and S.S. Lim. 2007. Trends in obesity
and associations with education and urban or rural residence in Thailand. Obesity
Silver Spring, Md 15(12):3113-3121.
Agrawal, P., & Mishra, V. K. (2004). Covariates of overweight and obesity among women
in North India.
Al-Sendi, A. M., Shetty, P., & Musaiger, A. O. (2003). Prevalence of overweight and
obesity among Bahraini adolescents: a comparison between three different sets of
criteria. European journal of clinical nutrition, 57(3), 471-474.
Andreasen, R.K., M.L. Andersen and A.L. Scantz. 2004. Obesity and pregnancy. Acta
Obstetrica et Gynaecologica Scandinavica 83:1022-1029
Barau, G., P.Y. Robillard, T.C. Hulsey, F. Dedecker, A. Laffite, P. Gerardin, and E.
Kauffmann. 2006. Linear association between maternal pre-pregnancy body mass
index and risk of Caesarean section in term deliveries. British Journal of Obstetrics
and Gynaecology113 (10):1173-1177.
Castro, L. C., & Avina, R. L. (2002). Maternal obesity and pregnancy outcomes. Current
Opinion in Obstetrics and Gynecology, 14(6), 601-606.
Cedergren, M.I. 2004. Maternal Morbid Obesity and the Risk of Adverse Pregnancy
Outcomes. Obstetrics and Gynecology 103(2):219-224.
Clark, A.M., B. Thornley, L. Tomlinson, C. Galletley, and R.J. Norman. 1998. Weight loss
obese infertile women results in improvement, in reproductive outcome for all forms
of fertility treatment. Human Reproduction 13 (6):1502–1505.
Denison, F.C., J. Price, C. Graham, S. Wild, and W.A. Liston. 2008. Maternal obesity,
length of gestation, risk of postdates pregnancy and spontaneous onset of labour at
term. British Journal of Obstetrics and Gynaecology 115(6):720-725.
Douchi, T., Kuwahata, R., Yamamoto, S., Oki, T., Yamasaki, H., & Nagata, Y.
(2002). Relationship of upper body obesity to menstrual disorders. Acta Obstetricia
et Gynecologica Scandinavica 81 (2), 147–150.
Jain, N.J., C.E. Denk, L.K. Kruse, and V. Dandolu. 2007. Maternal obesity: can pregnancy
weight gain modify risk of selected adverse pregnancy outcomes? American
Journal of Perinatology 24(5):291-299.
James, W.P.T. 2007. The fundamental drivers of the obesity epidemic. Obesity Reviews 9
(suppl. 1):6-13.
Jazayeri A, Heffron JA, Phillips R, Spellacy WN. Macrosomia prediction using ultrasound
fetal abdominal circumference of 35 centimeters or more. Obstet Gynecol.Apr 1999;
93(4):523-6.
Kasha, A. S., & Kenny, L. C. (2009). The effects of maternal body mass index on
pregnancy outcome. European journal of epidemiology, 24(11), 697-705.
Kelishadi, R., Ardalan, G., Gheiratmand, R., Majdzadeh, R., Hosseini, M., Gouya, M. M.
Lock, K. (2008). Thinness, overweight and obesity in a national sample of Iranian
children and adolescents: CASPIAN Study. Child: Care, Health and Development,
34(1), 44-54.
13
Kim, S.A., K.M. Yount, U. Ramakrishnan, and R. Martorell. 2007. The relationship
between parity and overweight varies with household wealth and national
development. International Journal of Epidemiology. 36(1):93-101.
Kiran, T.S.U., S. Hemmadi, J. Bethel, and J. Evans. 2005. Outcome of pregnancy in a
woman with an increased body mass index. British Journal of Obstetrics and
Gynaecology 112:768-772.
Lake, J. K., Power, C., & Cole, T. J. (1997). Women's reproductive health: the role of body
mass index in early and adult life. International Journal of Obesity & Related
Metabolic Disorders, 21(6).
Lynch, C.M., S.J. Sexton, M. Hession, J.J. Morrison. 2008. Obesity and mode of delivery in
primigravid and multigravid women. American Journal of Perinatology 25:163-
167.
Mazouni, C., G. Porcu, E. Cohen-Solal, H. Heckenroth, B. Guidicelli, P. Bonnier, and
M.Gamerre. 2006. Maternal and anthropomorphic risk factors for shoulder dystocia.
ActaObstetrica et Gynaecologica 85:567-570.
McLaren, L. (2007). Socioeconomic status and obesity. Epidemiologic reviews, 29(1), 29-
48.
Misra, D.P., N. Astone, and C. D. Lynch. 2005. Maternal smoking and birth weight:
interaction with parity and mother‘s own in utero exposure to smoking.
Epidemiology 16(3): 288- 293.
Monteiro, C.A., E.C. Moura, W.L. Conde, and B.M. Popkin. 2004. Socioeconomic status
and obesity in adult populations of developing countries: a review. Bulletin of the
World Health Organization 82(12):940-946.
Monteiro, C.A., W.L. Conde, B. Lu, and B.M. Popkin. 2004. Obesity and inequities in
health in the developing world. International Journal of Obesity and Related
Metabolic Disorders 28(9):1181-1186.
Moura, E. C., & Claro, R. M. (2012). Estimates of obesity trends in Brazil, 2006 2009.
International journal of public health, 57(1), 127-133.
Ngoc, N.T.N., M. Merialdi, H. Abdel-Aleem, G. Carroli, M. Purwar, N. Zavaleta, L.
Campódonico, M. M. Ali, G. J. Hofmeyr, M. Mathai, O. Lincetto, J. Villar. 2006.
Causes of stillbirths and early neonatal deaths: data from 7993 pregnancies in six
developing countries. Bulletin of the World Health Organization 84(9):699-705.
Popkin, B.M. 2002. The Shift in Stages of the Nutrition Transition in the Developing World
Differs from Past Experiences. Malaysian Journal of Nutrition 8(1):109-124.
Ramachandran, P. (2010). Nutrition and child survival in India. The Indian Journal of
Pediatrics, 77(3), 301-305.
Ramachenderan, J., J. Bradford and M. McLean. 2008. Maternal obesity and pregnancy
complications: A review. Australia and New Zealand Journal of Obstetrics and
Gynaecology 48:228-235.
Ryan, D. 2007. Obesity in women: a life cycle of medical risk. International Journal of
Obesity 31:S3-S7.
Sarkar, R.K., S.M. Cooley, J.C. Donnelly, T. Walsh, C. Collins, and M.P. Geary. 2007. The
incidence and impact of increased body mass index on maternal and fetal morbidity
in the low-risk primigravid population. Journal of Maternal-Fetal and Neonatal
14
Medicine 20(12):879-883.
Seidell, J.C. (1997). Time trends in obesity: an epidemiological perspective. Hormone and
Metabolic Research 29 (4), 155–158.
Seligman, L.C., B.B. Duncan, L. Branchtein, D.S.M. Gaio, S.S. Mengue, and M.I. Schmidt.
2006. Obesity and gestation weight gain: cesarean delivery and labor complications.
Rev Sauda Publica 40(3):457-463.
Spellacy WN, Miller S, Winegar A, Peterson PQ. Macrosomia--maternal characteristics and
infant complications. Obstet Gynecol. Aug 1985; 66(2):158-61.
Vaz, M., Yusuf, S., Bharathi, A. V., Kurpad, A. V., & Swaminathan, S. (2005). The
nutrition transition in India. South African Journal of Clinical Nutrition, 18(2), p-
198.
Vijayalakshmi, K., Reddy, GA., Krishna, TP. & Krishnaswamy K. (2002) Obesity in
adolescents of different socio-economic groups: prevalence in Andhra Pradesh,
India. Asia Pacific Journal of Clinical Nutrition 11 (supplement), S740–S743.
World Health Organization (2008) Global Burden of Disease 2004 Update Geneva.
Yoon, K. H., Lee, J. H., Kim, J. W., Cho, J. H., Choi, Y. H., Ko, S. H., ... & Son, H. Y.
(2006). Epidemic obesity and type 2 diabetes in Asia. The Lancet, 368(9548), 1681-
1688.
15
Table 1: Percentage of overweight/obese women in age group 15-49 by state and place of
residence in India, NFHS III
State NFHS II NFHS III
Total Urban Rural
North 16.1 20.4 32.7 14.2
Jammu and Kashmir 13.8 21.9 39.4 15
Himachal Pradesh 13.4 18 38.3 15.7
Punjab 29.4 38.8 47.2 33.9
Uttaranchal 10.4 16.9 32 11.5
Haryana 16.6 21.2 34.1 15.4
Delhi 34.5 32.9 33.7 23
Rajasthan 6.7 10.4 21.9 5.9
Central 6.8 10.2 24.4 5.7
Uttar Pradesh 7.4 11.3 25 7.1
Chhattisgarh 4.2 7.1 23.6 2.5
Madhya Pradesh 6.8 8.9 23.6 3.7
East 5.7 8.8 24.6 4.5
Bihar 3.8 5.5 17.5 3.5
West Bengal 8.5 12.4 28.9 5.9
Jharkhand 3 6.6 20.5 1.9
Orissa 4.5 8.1 23.3 5.1
Northeast 5.2 9.8 21.5 6.9
Sikkim 15.6 19.2 31.9 16.2
Arunachal Pradesh 5.3 11.3 14.5 10
Nagaland 7.3 9.5 18.5 6
Manipur 10.4 17.8 27.5 13.5
Mizoram 5 11.8 18.1 4.1
Tripura 8.2 7.6 17.7 5.5
Meghalaya 5.3 7.3 11.7 6
Assam 4.1 9.5 23.2 6.6
West 13.2 18.7 29.6 9.7
Gujarat 15.6 21.1 33.6 12
Maharashtra 13.6 17.4 27.6 8.3
Goa 20.6 28.6 34.1 21.1
South 13.2 22.4 34.7 15.1
Andhra Pradesh 11.6 18.4 32.1 12
Karnataka 13.6 19.3 33 11
Kerala 20.9 34.4 41.6 30.8
Tamil Nadu 14.7 25 36.1 15.6
India 10.5 15.3 29.6 8.9
Source: Computed from NFHS III women data file.
16
Table 2: Percentage of obese women (15-49) by background characteristics in India,
NFHS III
characteristics NFHS II NFHS III
Age
15-24 2.7 4.2
25-34 9.4 12.5
35+ 16.9 22.1
Marital status
Single - 12.6
Married 10.6 15.4
W/D/S 10.3 14.2
Caste
Schedule Caste 5.9 10.6
Schedule Tribe 3.3 3.8
Other Backward Class 9.4 14.4
Other 15.3 22.7
Religion
Hindu 9.6 14.2
Muslim 12.5 17.5
Other 19.9 26.3
Level of education
No education 4.9 7.9
Primary 10.9 14.6
Secondary 17.2 23.5
Higher 28.6 39.1
Mass media
Not exposure 3.4 4.5
Partially exposure 15.4 32.9
Working Status
No 13.1 19.7
Yes 6.7 10.1
Standard of living
Low 2.8 3.3
Middle 8.7 8.8
High 27 28.6
Type of Place of Residence
Urban 23.2 29.6
Rural 6 8.9
Region residence
North 16 20.4
Central 6.8 10.2
East 5.6 8.8
Northeast 5.2 9.8
West 13.1 18.7
South 14.2 22.4
India 10.5 15.3
Source: Computed from NFHS III women data file.
17
Table 3: Odds Ratio showing the effect of selected covariates on the prevalence of
obesity among women in India: Results from Logistic Regression analysis, NFHS III
Covariates Model I SE Model II SE Model III SE
Age
15-24®
25-34 3.314*** 0.048 3.095*** 0.049 2.811*** 0.051
35+ 6.497*** 0.047 7.247*** 0.048 5.865*** 0.051
Marital status
Single®
Married
2.537 0.534 1.356 0.539
Other
1.921 0.535 1.241 0.541
Level of education
No education®
Primary
1.710*** 0.034 1.163*** 0.038
Secondary
2.841*** 0.027 1.305*** 0.034
Higher
4.204*** 0.038 1.514*** 0.047
Place of residence
Rural®
Urban
2.642*** 0.023 1.535*** 0.027
Caste
Schedule Caste®
Schedule Tribe
0.506*** 0.051
Other Backward Class
0.963 0.036
Other
1.135*** 0.036
Religion
Hindu®
Muslim
1.362*** 0.037
Other
1.411*** 0.039
Mass media
Not exposure®
Partially exposure
1.095** 0.03
fully exposure
1.220*** 0.048
Working Status
No®
Yes
0.794*** 0.026
Wealth Status
Poorest®
Poorer
1.796*** 0.092
Middle
3.038*** 0.085
Richer
5.637*** 0.084
Richest
11.072*** 0.086
Region residence
North®
Central
0.851*** 0.039
East
0.796*** 0.043
Northeast
0.778*** 0.046
West
0.810*** 0.039
South
1.519*** 0.036
Note: Significance: ***p<0.001, **p<0.01, and *p<0.05. Dependent Variable: obesity: 1=Yes 0=No
®: Reference category.
Source: Computed from NFHS III women data file.
18
Table 4: Percentage of women experienced pregnancy complication during last birth in one year preceding the survey by BMI and background characteristics, India, NFHS III
Characteristics Vaginal Bleeding Prolonged Labor Swelling Cesarean
Thin Normal Obese Thin Normal Obese Thin Normal Obese Thin Normal Obese
Age
15-24 3.8 3.9 5.8 18.1 18.9 26.4 24.1 25.7 32.2 5.0 9.5 29.1
25-34 3.9 5.0 6.3 15.7 20.9 34.8 24.1 30.3 32.7 4.7 10.9 34.6 35+ 4.3 4.3 0.3 9.9 15.5 48.3 33.0 28.4 42.3 3.3 5.7 28.4
Caste
Schedule caste 2.9 3.9 7.6 15.0 15.9 17.1 23.6 25.7 29.6 4.5 7.9 19.0 Schedule Tribe 5.3 4.3 0.0 13.3 13.2 25.3 27.7 30.1 51.3 1.6 3.2 22.2
Other backward class 3.5 4.1 4.5 16.9 19.6 31.7 25.3 26.4 29.8 4.5 9.0 33.1
Other 4.9 5.0 6.6 22.4 24.0 37.6 23.4 28.9 36.5 8.1 15.4 35.7
Religion
Hindu 3.5 4.2 5.2 17.2 19.3 32.5 23.5 26.1 33.2 5.2 10.6 33.4
Muslim 5.4 3.6 6.2 15.3 18.4 30.7 28.4 34.1 34.6 2.7 5.6 29.4 Other 4.4 8.8 9.8 19.3 26.1 30.7 22.1 27.6 26.3 9.7 11.8 30.7
Level of education
No education 3.3 3.3 6.7 11.9 11.7 23.7 25.3 26.8 25.5 1.5 2.4 10.0 Primary 4.9 4.8 7.1 15.5 17.2 18.1 25.6 28.9 38.5 3.9 6.9 14.0
Secondary 4.1 4.8 5.5 23.4 24.5 29.9 22.0 26.6 32.9 9.5 17.5 37.8
Higher 6.0 8.4 5.5 21.6 37.5 42.7 31.3 36.8 37.1 25.0 32.0 38.2
Mass media
Not exposure 3.6 3.5 9.5 9.1 11.9 25.9 25.9 26.2 37.7 0.7 1.8 17.5
Partially exposure 3.8 4.1 7.6 16.8 16.7 34.5 25.0 29.7 32.6 3.4 5.3 23.2 fully exposure 4.1 5.1 5.1 23.7 24.7 32.1 22.2 27.2 32.7 11.3 18.5 35.8
Working Status
No 4.0 4.0 5.7 18.6 20.7 32.7 23.7 26.4 32.6 6.1 11.6 32.7
Yes 3.4 5.0 7.7 12.9 15.8 28.0 26.5 30.3 36.6 2.4 5.3 36.7
Wealth index
Poorest 3.0 3.7 12.9 11.1 11.7 0.0 25.5 29.4 16.0 1.3 1.7 13.0
Poorer 4.3 3.4 0.1 16.4 15.4 22.8 25.6 25.3 24.2 2.5 3.8 16.7
Middle 3.7 4.0 4.7 16.7 16.7 18.1 20.4 25.4 35.0 5.5 8.1 19.1 Richer 4.3 4.4 7.2 21.7 22.9 27.7 24.9 28.8 31.1 9.2 16.2 26.4
Richest 5.2 7.0 5.4 27.3 31.1 38.5 26.3 29.6 35.8 18.0 26.1 40.6
Place of Residence
Urban 5.2 5.8 5.0 20.3 24.9 36.4 24.0 31.9 33.5 8.6 17.8 36.7
Rural 3.6 3.8 6.8 16.2 17.4 25.6 24.6 26.2 32.5 4.1 7.3 26.2
Region
North 4.5 5.8 8.1 15.7 20.5 39.6 21.7 26.7 36.2 4.6 7.3 27.8
Central 3.9 4.5 7.1 11.4 12.0 37.1 25.5 27.5 32.8 2.7 4.4 22.2
East 3.4 3.3 1.5 21.7 22.6 26.5 28.9 29.6 27.8 3.4 7.1 36.7 Northeast 8.5 4.0 4.1 11.0 20.7 34.6 25.4 35.0 53.3 3.4 6.4 27.5
West 4.5 4.6 5.7 15.1 19.8 35.3 22.6 25.6 39.5 5.6 11.6 35.5
South 2.3 4.0 5.4 23.6 26.5 26.7 16.0 24.6 29.0 12.9 27.3 37.3
Total 3.9 4.3 5.8 17.0 19.5 32.2 24.5 27.6 33.1 4.9 9.8 32.4
Source: Computed from NFHS III women data file.
19
Table 5: Odds Ratio showing the effect of selected covariate on prevalence of pregnancy complication
among women during last birth in one year preceding survey: India, Results from logistic analysis, NFHS
III
Vaginal Bleeding Labor Swelling Cesarean
OR OR OR OR
BMI Level
Thin ®
Normal 0.91 1.01 1.217*** 1.428***
Overweight/obese 1.108 1.144* 1.570*** 2.432***
Age Group
15-24®
25-34 1.118 1.003 1.038 1.157*
35+ 1.021 0.885 1.033 1.134
Caste
Schedule caste®
Schedule Tribe 0.758 1.074 1.118 0.584***
Other backward class 0.887 1.082 1.012 0.881
Other 0.896 1.202* 1.005 1.186
Religion
Hindu®
Muslim 1.283 1.016 1.368*** 0.616***
Other 1.175 1.279** 0.926 0.907
Education
No education®
Primary 1.454* 1.137 1.283*** 1.595***
Secondary 1.341* 1.364*** 1.061 2.293***
Higher 1.601* 1.638*** 1.295** 3.824***
Media Exposure
Not exposure®
Partially exposure 1.009 1.253* 1.048 1.374*
fully exposure 1.019 1.474*** 0.977 2.047***
Working Status
No®
Yes 1.126 0.878 1.220*** 0.975
Wealth Status
Poorest®
Poorer 0.797 1.205 0.932 1.797**
Middle 0.95 1.287* 0.924 2.360***
Richer 1.283 1.475*** 0.998 3.542***
Richest 1.222 2.069*** 1.179 4.920***
Place of residence
Rural®
Urban 1.03 0.995 1.178*** 1.283***
Region residence
North®
Central 0.712* 0.676*** 1.035 1.225
East 0.746** 0.988 1.179 1.602***
Northeast 0.694* 0.923 1.384*** 1.155
West 0.954 0.923 1.111 1.353***
South 0.497 1.003 0.758*** 3.276***
Note: Significance: ***p<0.001, **p<0.01, and *p<0.05. ®: Reference category.
Source: Computed from NFHS III Kids data file.
20
Table 6: Prevalence of pregnancy outcome among women by BMI level and background characteristics,
India, NFHS III
Characteristics Infant Death Macrosomia
Normal Obese Thin Normal Obese
Age
15-24 6.7 6.3 5.2 5.1 7.6
25-34 4.5 4.4 4.9 6.4 5.9
35+ 4.7 2.8 7.1 8.4 5.9
Caste
SC 6.2 5.5 4 5.7 7.6
ST 6.8 0.8 6.2 9.2 8.6
OBC 5 5.9 5.7 6 4.6
Other 4.7 3.4 5 5.5 7.4
Religion
Hindu 5.5 4.9 5.1 5.6 6.2
Muslim 4.8 4.3 6.2 7.4 8.4
Other 5.4 2.9 2.7 5.7 3.4
Level of education
No education 6.8 7.3 7.4 9.5 14.4
Primary 5.6 3.9 5.1 6.5 8.4
Secondary 3.7 4.6 4 4.8 6.1
Higher 1.4 2.1 4.1 4.4 3.6
Mass media
Not exposure 5.7 5.4 5.3 6.4 6.7
Partially exposure 3.5 3.1 4.9 4.6 6.6
fully exposure 2.2 1 0.4 4.3 1.6
Working Status
No 4.8 4.4 4.5 5.4 6.5
Yes 6.2 4.9 6.3 7.2 5.5
Wealth index
Poorest 7.1 5.9 7.4 8.1 9.8
Poorer 6.5 9.5 4.8 7.2 17.1
Middle 5.5 4.7 6.5 6.6 5.9
Richer 3.6 6.6 3.4 5.3 6.9
Richest 2.9 2.7 4.2 4.9 5.3
Place of Residence
Urban 3.9 4 4.4 5 6.3
Rural 5.9 5.6 5.5 6.6 6.2
Region residence
North 5.3 5.1 5 4.4 5.2
Central 6.6 5.6 5.6 8.8 7.8
East 5.6 7.6 6.1 5 6.6
Northeast 5.4 6.1 5.4 7.6 9.4
West 3.8 3 4.4 6.8 11.6
South 3.9 3.3 4.9 5.2 3.5
Total 5.4 4.6 5.1 5.9 6.3
Source: Computed from NFHS III Kids data file
21
Table 7: Logistic Regression Analysis, Odds Ratio showing the probability of Macrosomia by Covariates:
India, NFHS III
Covariate OR 95 % CI
Thin (BMI< 18.5)®
Normal (BMI: 18.5-25) 1.266** 1.082-1.481
Overweight/obese(BMI>25) 1.750*** 1.421-2.154
Diabetes
No
Yes 1.804* 1.002-3.248
Age Group
15-24®
25-34 1.111 0.969-1.274
35+ 1.205 0.954-1.523
Caste
SC®
ST 1.361** 1.051-1.762
OBC 1.102 0.900-1.348
Other 1.011 0.822-1.244
Religion
Hindu®
Muslim 1.656*** 1.356-1.952
Other 0.984 0.791-1.225
Education
No education®
Primary 0.702*** 0.566-0.871
Secondary 0.659*** 0.549-0.792
Higher 0.613*** 0.472-0.798
Media Exposure
Not exposure®
Partially exposure 0.92 0.787-1.074
fully exposure 0.617 0.434-0.876
Working Status
No®
Yes 1.265*** 1.101-1.453
Wealth Status
Poorest®
Poorer 0.925 0.677-1.262
Middle 0.996 0.742-1.336
Richer 0.914 0.676-1.238
Richest 0.868 0.626-1.203
Place of residence
Urban®
Rural 1.128* 0.979-1.300
Region residence
North®
Central 1.326** 1.037-1.695
East 0.952 0.735-1.232
Northeast 1.660*** 1.310-2.103
West 1.019 0.808-1.284
South 0.732** 0.582-0.922
Note: Significance: ***p<0.001, **p<0.01, and *p<0.05. Dependent Variable: Macrosomia: 1=Yes 0=No ®:
Reference category.
Source: Computed from NFHS III Kids data file.

22
Table 7: Cox proportional hazard model showing effect of covariates on the prevalence of pregnancy
outcomes in India, NFHS III
Covariates Infant Death
OR 95 % CI
BMI Level
Thin®
Normal 0.906* 0.822-1.000
Obese 1.044 0.861-1.266
Age Group
15-24®
25-34 0.537*** 0.487-0.593
35+ 0.502*** 0.427-0.591
Caste
SC®
ST 0.962 0.815-1.134
OBC 0.946 0.834-1.072
Other 1.032 0.893-1.191
Religion
Hindu®
Muslim 0.842* 0.729-0.973
Other 1.066 0.880-1.290
Education
No education®
Primary 0.902* 0.789-1.032
Secondary 0.747*** 0.652-0.856
Higher 0.533*** 0.382-0.743
Media Exposure
Not exposure®
Partially exposure 0.948 0.801-1.121
fully exposure 1.084 0.731-1.607
Working Status
No®
Yes 0.906* 0.820-1.002
Wealth Status
Poorest®
Poorer 1.061 0.929-1.213
Middle 0.873* 0.751-1.014
Richer 0.731*** 0.614-0.870
Richest 0.607*** 0.484-0.760
Place of residence
Urban®
Rural 0.922 0.820-1.037
Region residence
North®
Central 1.373*** 1.187-1.589
East 1.058 0.900-1.244
Northeast 0.939 0.777-1.134
West 0.892 0.732-1.087
South 0.733 0.605-0.887
Note: Significance: ***p<0.001, **p<0.01, and *p<0.05. ®: Reference category.
Source: Computed from NFHS III Kids data file.