obesity in california - california department of public health do… · the weight of the state,...
TRANSCRIPT

2016
California Department of Public Health in collaboration with
Nutrition Policy Institute, UCANR Nutrition Education and Obesity Prevention Branch
Obesity in California: The Weight of the State, 2000-2014

| 1
Executive Summary
Introduction The United States continues to confront an obesity epidemic that is detrimental to the health of individuals, limits worker productivity, and is associated with excess disease burden and contributes to high medical and social costs. While California’s obesity rate is lower than that of most other states, as one of the most populous states, the number of individuals affected by obesity and obesity-related health conditions is high.1,2 The costs of obesity and its consequences continue to burden the physical and economic health of the State. The Healthy People 2020 report created targets for reducing the national prevalence of
obesity among adults to ≤ 30.5 percent and among children and adolescents ages 2-19
to ≤ 14.5 percent.3 In order to help reach those targets, California developed The
California Obesity Prevention Plan, which focuses on establishing policies and environments throughout the State to improve population diet and physical activity.4 The policy and environmental change approaches highlighted in the Plan aim to increase breastfeeding; decrease consumption of sugar-sweetened beverages; decrease consumption of energy dense, nutrient poor foods; increase fruit and vegetable consumption; increase physical activity; and reduce television viewing time. There is still much work to be done in encouraging these behaviors in the California population, as survey data found that a substantial proportion of Californians did not meet the recommendations.5-7
Measuring Obesity in California In order to understand whether the State is making progress towards meeting the Healthy People 2020 and Obesity Prevention Plan goals ,this report focuses on obesity prevalence rates, drawing upon three different data sets that provide a snapshot of rates of obesity among various subpopulations of California. The data sets include:
1. The California Health Interview Survey (CHIS), which provides estimates of adult and adolescent obesity obtained by self-report during telephone interviews.6,8,9 This survey is designed to provide representative estimates of population obesity each year; however, the sample is not adequate to allow for subgroup estimates annually. CHIS also provides estimates of overweight-for-age for children ages 2-11. This measure uses only weight and age, without adjusting for height.
2. FitnessGram, which is an annual physical fitness assessment administered to all 5th, 7th, and 9th grade students in public schools in California, provides estimates of obesity among California’s children and adolescents.10 Part of the FitnessGram assessment involves measuring all students’ height and weight in order to calculate body mass index (BMI) for each student. FitnessGram provides solid population measures, but is limited in that it only captures students at three grade levels.
3. The Champions for Healthy Change (C4HC) study, which is conducted by the California Department of Public Health to evaluate its Supplemental Nutrition Assistance Program education (SNAP-Ed) program, provides estimates of

| 2
obesity for the subpopulations participating in the study. Part of the study involves collecting self-reported height and weight from the participating low-income mothers and their children. The BMI values that can be calculated from this sample also are based on self-reports, but provide an estimate of obesity among this very specific population group of SNAP eligible mothers and children from 17 counties in California.
Estimates of Adult Obesity in California According to the CHIS Survey, 27.0 percent of adults in California were obese in 2014, an increase in obesity prevalence of nearly 40 percent since 2001, but a prevalence below the Healthy People 2020 national target of ≤ 30.5 percent.3,11
Prevalence of Obesity Among California Adults, CHIS, 2001-2014
However, rates of adult obesity varied substantially by subgroup, with some groups falling well below the Healthy People 2020 targets and others far exceeding them:
Geographically, some counties had obesity rates as low as 11.8 percent (San Francisco) while others had rates as high as 43.5 percent (Imperial).6
While the obesity rate among young adults (ages 18-24) was 13.1 percent, the rate of obesity among Californians ages 51-64 was 34.1 percent.6
Obesity rates among African Americans and Latinos were higher than the Healthy People 2020 target while those for non-Latino White and Asian Californians fell below the target. Obesity rates were slightly higher among adult men than women for Latinos (35.4 percent vs. 33.3 percent, respectively) as well as non-Latino Whites (25.2 percent vs. 22.9 percent) and Asians (15.9 percent vs. 9.8 percent). Obesity rates among African American women (49.8 percent) were substantially higher than among African American men (31.5 percent).6
Obesity rates among African American women (49.8 percent) were 5 times higher than those among non-Latino Asian women (9.8 percent) and more than double the rate of White women (22.9 percent). Obesity rates among Latina women (33.3 percent) were more than three times as high as among

| 3
Asian women and were nearly 50 percent higher than among non-Latina White women.6
Obesity rates declined with increasing household income. The most impoverished Californians (those with household incomes below 100 percent of the federal poverty level) had an obesity rate of 31.4 percent, while the group at or above 500 percent of the FPL level had an obesity rate of 22.5 percent.6
Estimates of Adolescent Obesity in California Two sources of data provide estimates of obesity among California adolescents, FitnessGram and CHIS. According to the FitnessGram measures:
17.2 percent of 9th graders and 19.1 percent of 7th graders in California were obese during the 2014-2015 school year.10
Obesity rates varied among students according to the ethnic group with which they identify. Hispanic/Latino students were by far the largest subgroup in California, and have obesity rates that were higher than the average: 21.8 percent among 9th graders and 24.8 percent among 7th graders. However, the highest obesity rates were found among the small population of Native Hawaiian/Pacific Islander students, in which 28.8 percent of 9th graders and 30.4 percent of 7th graders were obese. Asian students had the lowest rates of obesity (7.6 percent among 9th graders, 8.1 percent among 7th graders), followed by non-Latino White students (11.1 percent among 9th graders, 11.7 percent among 7th graders).10
A wide divide in obesity rates was seen among students based upon economic disadvantage. Most of California’s 7th and 9th grade public school students (58.7 percent and 56.2 percent, respectively) were considered economically disadvantaged. They had an obesity rate that was more than double the rate of students who were from households that were not economically disadvantaged (23.9 percent vs. 11.9 percent, respectively).10
According to the CHIS study:
The prevalence of obesity among California adolescents ages 12-17 has declined from 2011 (15.3 percent) to 2014 (14.6 percent).12
The data from 2011-2014 suggests that obesity rates were slightly lower among older adolescents (15-17) than among younger adolescents (14.4 percent vs. 15.5 percent).12
Adolescent obesity rates were highest among non-Latino African American (22.5 percent) and Latino (20.2 percent) adolescents, and lowest among non-Latino Asian (5.2 percent) and White (9.2 percent) adolescents.12
Adolescents from the most impoverished households (below 100 percent FPL) had higher rates of obesity than those from the highest income households (>300 percent FPL) (20.4 percent vs. 12.7 percent).12

| 4
Estimates of Child Obesity in California Obesity rates among children in California are available for 5th grade students from the FitnessGram assessments. The CHIS study only provides information about overweight-for-age, because parental reports of children’s height are known to be unreliable. Thus, understanding the prevalence of obesity among children younger than 12 in California is challenging. According to FitnessGram measures:
20.9 percent of California 5th grade students were obese in the 2014-2015 school year.10
Obesity was higher among male 5th grade students (23.8 percent) than among female 5th grade students (18.1 percent).10
Latinos comprised the largest group of 5th graders and had an obesity rate of 27.4 percent. Non-Latino white students were the next largest population and had an obesity rate of 12.0 percent. The highest rate of obesity was found among the small group of Native Hawaiian/Pacific Islander 5th grade students (34.2 percent). The lowest rate of obesity was found among Asian 5th grader students (10.1 percent).10
Most 5th grade students were considered economically disadvantaged. This group had an obesity rate that was more than double the rate for 5th grade students who were not economically disadvantaged (26.4 percent vs. 12.6 percent).10
According to CHIS:
Fifteen percent of California children (ages 2-11) were overweight for their age in 2014.6 This includes children who would be considered obese.
The rate of overweight-for-age among California children was 14.4 percent in 2011, declined in 2012 and 2013, but then rose again in 2014.12
Males had higher rates of overweight-for-age than females (14.9 percent vs. 11.6 percent)12
African American and Latino children had higher rates of obesity than Non-Latino White children (19.7 percent vs. 16.2 percent vs. 8.5 percent, respectively).12
Children from the most impoverished households (household income <100 percent FPL) had much higher rates of obesity (19.0 percent) than children from higher income families (household income >300 percent FPL) (10.8 percent, 7.4 percent, and 7.8 percent among children with household incomes of 300-399 percent FPL, 400-499 percent FPL, and ≥500 percent FPL, respectively).12
Conclusion While California’s obesity rates, overall, meet the Healthy People 2020 national goal, there is more work to do to reduce the prevalence of obesity. Disparities persist in obesity rates, with substantially higher rates among Californians with the lowest household incomes, as well as among some ethnic groups in California. If California is to ensure that all of its residents achieve their life’s full potential, it is imperative to address the structural inequalities that produce disparate obesity rates

| 5
among various population subgroups. Obesity has tremendous personal and public costs. Some estimates suggest that the state is paying billions in obesity-related hospital expenses annually, and that a reduction in just 5 percent of the adult obesity rate could save the State $81.7 billion in obesity-related healthcare costs by 2030.2
Efforts to improve population diet and activity in order to reduce obesity and chronic disease will improve the physical health of individual Californians as well as the productivity, health, well-being, and fiscal strength of the State.
Executive Summary References 1. RWJF. State of Obesity: 2016. 2. Trust for America’s Health, Foundation RWJ. F as in Fat: How Obesity threatens America's Future. Washingtion, DC, 2012. 3. United States Department of Health and Human Services. Healthy People 2020, Topics and Objectives. http://www.healthypeople.gov/2020/topicsobjectives2020/default.aspx. Accessed October 24, 2016. 4. California Department of Public Health Obesity Prevention Program. California Obesity Prevention Plan: A Vision for Tomorrow, Strategic Actions for Today. 2010. 5. Nutrition, Physical Activity and Obesity Data, Trends and Maps web site. U.S. Department of Health and Human Services, Centers for Disease Control and Prevention (CDC), National Center for Chronic Disease Prevention and Health Promotion, Division of Nutrition, Physical Activity and Obesity, Atlanta, GA, 2015. Available at http://www.cdc.gov/nccdphp/DNPAO/index.html. 6. University of California Los Angeles, Center for Health Policy Research. California Health Interview Survey 2014. 2014. http://ask.chis.ucla.edu/main/default.asp. Accessed October 24, 2016. 7. California Department of Public Health, Nutrition Education and Obesity Prevention Branch. Behavior Risk Factor Surveillance System 2013. 8. UCLA Center for Health Policy Research. CHIS Making and Impact - 2015. http://healthpolicy.ucla.edu/chis/about/Documents/CHISImpactFS2015.pdf. Accessed October 10, 2016. 9. UCLA Center for Health Policy Research. CHIS 2013-2014 Sample Design. http://healthpolicy.ucla.edu/chis/design/Documents/sample_desc_2013.pdf. Accessed October 10, 2016. 10. California Department of Education. Physical Fitness Test Results. http://data1.cde.ca.gov/dataquest/PhysFitness/PFTDN/Summary2011.aspx?r=0&t=4&y=2014-15&c=00000000000000&n=0000. Accessed October 25, 2016. 11. University of California Los Angeles, Center for Health Policy Research. California Health Interview Survey 2001-2014. 2001-2014. 12. University of California Los Angeles, Center for Health Policy Research. California Health Interview Survey 2011-2014. 2011-2014.

| 6
Table of Contents
Table of Contents
Executive Summary ............................................................................................ 1
Introduction ..................................................................................................................... 1
Measuring Obesity in California ...................................................................................... 1
Estimates of Adult Obesity in California .......................................................................... 2
Estimates of Adolescent Obesity in California ................................................................. 3
Estimates of Child Obesity in California .......................................................................... 4
Conclusion ...................................................................................................................... 4
Executive Summary References ..................................................................................... 5
Table of Contents ................................................................................................ 6
Introduction ....................................................................................................... 11
Obesity in the United States .......................................................................................... 11
National Targets for Obesity Reduction.......................................................... 12
Healthy People 2020 ..................................................................................................... 12
Indicators of Overweight and Obesity Prevalence ......................................................... 12
The California Obesity Prevention Plan .......................................................... 13
California Obesity Prevention Plan ................................................................................ 13
Rationale for California Prevention Plan Objectives ...................................................... 13
State Obesity and Risk Factor Surveillance - Data Sources ......................... 14
CHIS .............................................................................................................................. 14
FitnessGram .................................................................................................................. 15
Data Limitations ............................................................................................................ 15
Additional data sources ................................................................................................. 15
National Immunization Survey ............................................................................................15
Behavioral Risk Factor Surveillance System (BRFSS) .......................................................15
Champions for Healthy Change .................................................................................... 16
California Prevalence of Selected Risk Factors for Obesity ......................... 16
Breastfeeding ................................................................................................................ 16
Table 1. Prevalence of Breastfeeding Among Infants Born in California in 2012, National Immunization Survey ...................................................................................................................... 17
Dietary Behaviors .......................................................................................................... 17

| 7
Sugar-Sweetened Beverages ............................................................................................17
Fast Food...........................................................................................................................17
Consumption of Fruits and Vegetables ..............................................................................18
Table 2a. Prevalence of Key Dietary Factors Influencing Risk of Obesity among California Children and Adolescents, CHIS, 2014 ......................................................................................... 18
Table 2b. Prevalence of Key Dietary Factors Influencing Risk of Obesity among California Adults, CHIS, 2014 ..................................................................................................................................... 18
Physical Activity ............................................................................................................ 19
Table 3. Percent of Californians Meeting the Physical Activity Guidelines, CHIS 2014a and BRFSS 2013b. ................................................................................................................................ 19
Time Spent in Sedentary Activities ................................................................................ 19
Table 4a. Percent of California Young Children Meeting the Screen Time Guidelines, CHIS, 2014 ....................................................................................................................................................... 20
Table 4b. Percent of California Older Children and Adolescents Meeting the Screen Time Guidelines, CHIS, 2014.................................................................................................................. 20
Availability and affordability of healthful foods ............................................................... 20
Table 5. Reported Availability and Affordability of Fresh Fruits and Vegetables in Neighborhoods Among California Adults, CHIS, 2014. ........................................................................................... 21
Perceived safety of nearby parks and playgrounds ....................................................... 21
Table 6. Reported perception of Safety of Nearby Parks and Playgrounds Among California Adolescents,a CHIS, 2014. ............................................................................................................. 21
Adult Obesity Prevalence and Trends............................................................ 21
Adult Obesity Prevalence from CHIS ............................................................................ 22
Figure 1. Prevalence of Obesity Among California Adults, CHIS, 2001-2014 ............................... 22
Table 7. Prevalence of Obesity Among California Adults, CHIS, 2001-2014 ................................ 23
Obesity Prevalence among California Adults by County .....................................................23
Figure 2. Prevalence of Obesity Among California Adults, by County, CHIS, 2013-2014 (pooled) ....................................................................................................................................................... 24
Table 8. Prevalence of Obesity Among California Adults, by County, CHIS, 2001 and 2013-2014 pooled............................................................................................................................................. 25
Obesity Prevalence among California Adults by Age Group ...............................................26
Figure 3. Prevalence of Obesity Among California Adults, by Age, CHIS, 2014 ........................... 26
Table 9. Prevalence of Overweight and Obesity Among California Adults, by Age, CHIS, 2014 .. 27
Obesity Prevalence among California Adults by Sex and Race/Ethnicity ...........................27
Figure 4. Prevalence of Obesity Among California Adults, by Sex and Race/Ethnicity, CHIS, 2014 ....................................................................................................................................................... 28
Table 10. Prevalence of Obesity Among California Adults, by Sex and Race/Ethnicity, CHIS, 2014 ....................................................................................................................................................... 28
Obesity Prevalence among California Adults by Socioeconomic Status .............................28

| 8
Figure 5. Prevalence of Obesity Among California Adults, by Household Poverty Level, CHIS, 2014 ............................................................................................................................................... 29
Table 11. Prevalence of Obesity Among California Adults, by Household Poverty Level, CHIS, 2014 ............................................................................................................................................... 29
Adolescent Obesity Prevalence and Trends ................................................. 29
Adolescent Obesity Prevalence from FitnessGram ....................................................... 30
Obesity Prevalence among California 9th graders, Overall and by Sex ...............................30
Figure 6. Prevalence of obesity among California 9th graders in public schools, overall and by sex, FitnessGram, 2014-2015 school year. ........................................................................................... 30
Table 12. Prevalence of obesity among California 9th graders in public schools, overall and by sex, FitnessGram, 2014-2015 school year. ................................................................................... 31
Obesity Prevalence among California 9th graders by Race/Ethnicity ..................................31
Figure 7. Prevalence of obesity among California 9th graders in public schools, by race/ethnicity, FitnessGram, 2014-2015 school year. ........................................................................................... 32
Table 13. Prevalence of obesity among California 9th graders in public schools, by race/ethnicity, FitnessGram, 2014-2015 school year. ........................................................................................... 32
Obesity Prevalence among California 9th graders by Socioeconomic Status ......................33
Figure 8. Prevalence of obesity among California 9th graders in public schools, by socioeconomic status, FitnessGram, 2014-2015 school year. ............................................................................... 33
Table 14. Prevalence of obesity among California 9th graders in public schools, by socioeconomic status, FitnessGram, 2014-2015 school year ................................................................................ 33
Obesity Prevalence among California 7th graders, Overall and by Sex ...............................33
Figure 9. Prevalence of obesity among California 7th graders in public schools, overall and by sex, FitnessGram, 2014-2015 school year. ........................................................................................... 34
Table 15. Prevalence of obesity among California 7th graders in public schools, overall and by sex, FitnessGram, 2014-2015 school year. ................................................................................... 34
Obesity Prevalence among California 7th graders by Race/Ethnicity ..................................34
Figure 10. Prevalence of obesity among California 7th graders in public schools, by race/ethnicity, FitnessGram, 2014-2015 school year. ........................................................................................... 35
Table 16. Prevalence of obesity among California 7th graders in public schools, by race/ethnicity, FitnessGram, 2014-2015 school year. ........................................................................................... 35
Obesity Prevalence among California 7th graders by Socioeconomic Status ................................ 36
Figure 11. Prevalence of obesity among California 7th graders in public schools, by socioeconomic status, FitnessGram, 2014-2015 school year. ...................................................... 36
Table 17. Prevalence of obesity among California 7th graders in public schools, by socioeconomic status, FitnessGram, 2014-2015 school year. ...................................................... 36
Adolescent Obesity Prevalence from CHIS ................................................................... 36
Figure 12. Prevalence of Obesity Among California Adolescents, CHIS, 2011-2014 ................... 37
Table 18. Prevalence of Obesity Among California Adolescents, CHIS, 2011-2014 .................... 37
Obesity Prevalence among California Adolescents by Age Group .....................................38
Figure 13. Prevalence of Obesity Among Adolescents in California, by Age, CHIS, 2011-2014 (pooled) .......................................................................................................................................... 38

| 9
Table 19. Prevalence of Obesity Among California Adolescents, by Age, CHIS, 2011-2014 (pooled) .......................................................................................................................................... 38
Obesity Prevalence among California Adolescents by Sex ................................................38
Figure 14. Prevalence of Obesity Among California Adolescents, by Sex, CHIS, 2011-2014 (pooled) .......................................................................................................................................... 39
Table 20. Prevalence of Obesity Among California Adolescents, by Sex, CHIS, 2011-2014 (pooled) .......................................................................................................................................... 39
Figure 15. Prevalence of Obesity Among California Adolescents, by Race/Ethnicity, CHIS, 2011-2014 (pooled) ................................................................................................................................. 40
Table 21. Prevalence of Obesity Among California Adolescents, by Race/Ethnicity, CHIS, 2011-2014 (pooled) ................................................................................................................................. 40
Figure 16. Prevalence of Obesity Among California Adolescents, by Household Poverty Level, CHIS, 2011-2014 (pooled) ............................................................................................................. 41
Table 22. Prevalence of Obesity Among California Adolescents, by Household Poverty Level, CHIS, 2011-2014 (pooled) ............................................................................................................. 41
Child Obesity Prevalence and Trends ............................................................ 41
Child Obesity Prevalence from FitnessGram ................................................................ 42
Obesity Prevalence among California 5th graders, Overall and by Sex ...............................42
Figure 17. Prevalence of obesity among California 5th graders in public schools, overall and by sex, FitnessGram, 2014-2015 school year. ................................................................................... 42
Table 23. Prevalence of obesity among California 5th graders in public schools, overall and by sex, FitnessGram, 2014-2015 school year. ................................................................................... 43
Obesity Prevalence among California 5th graders by Race/Ethnicity ..................................43
Figure 18. Prevalence of obesity among California 5th graders in public schools, by race/ethnicity, FitnessGram, 2014-2015 school year. ........................................................................................... 43
Table 24. Prevalence of obesity among California 5th graders in public schools, by race/ethnicity, FitnessGram, 2014-2015 school year. ........................................................................................... 44
Obesity Prevalence among California 5th graders by Socioeconomic Status ......................44
Figure 19. Prevalence of obesity among California 5th graders in public schools, by socioeconomic status, FitnessGram, 2014-2015 school year. ...................................................... 44
Table 25. Prevalence of obesity among California 5th graders in public schools, by socioeconomic status, FitnessGram, 2014-2015 school year. ............................................................................... 45
Child Overweight-for-Age Prevalence from CHIS ......................................................... 45
Figure 20. Prevalence of Overweight-for-age Among California Children, CHIS, 2011-2014 ....... 45
Table 26. Prevalence of Overweight-for-age Among California Children, CHIS, 2011-2014 ........ 46
Overweight-for-Age Prevalence among California Children by Age Group .........................46
Figure 21. Prevalence of Overweight-for-age Among Children in California, by Age, CHIS, 2011-2014 (pooled) ................................................................................................................................. 46
Table 27. Prevalence of Overweight-for-age Among California Children, by Age, CHIS, 2011-2014 (pooled) ................................................................................................................................. 47
Overweight-for-age Prevalence among California Children by Sex ....................................47

| 10
Figure 22. Prevalence of Overweight-for-age Among Children in California, by Sex, CHIS, 2011-2014 (pooled) ................................................................................................................................. 47
Table 28. Prevalence of Overweight-for-age Among California Children, by Sex, CHIS, 2011-2014 (pooled) ................................................................................................................................. 47
Overweight-for-Age Prevalence among California Children by Race/Ethnicity ...................48
Figure 23. Prevalence of Overweight-for-age Among California Children, by Race/Ethnicity, CHIS, 2011-2014 (pooled) ........................................................................................................................ 48
Table 29. Prevalence of Overweight-for-age Among California Children, by Race/Ethnicity, CHIS, 2011-2014 (pooled) ........................................................................................................................ 48
Overweight-for-age Prevalence among California Children by Socioeconomic Status .......48
Figure 24. Prevalence of Overweight-for-age Among California Children, by Household Poverty Level, CHIS, 2011-2014 (pooled) .................................................................................................. 49
Table 30. Prevalence of Overweight-for-Age Among California Children, by Household Poverty Level, CHIS, 2011-2014 (pooled) .................................................................................................. 49
Champions for Healthy Change (C4HC) - a recent snapshot of obesity prevalence in a SNAP-Eligible population in California ................................ 49
Obesity Prevalence among Low-Income Mothers in C4HC .......................................... 50
Figure 25. Prevalence of Obesity Among Low-income Mothers in 17 Counties in CA, by Race/Ethnicity, C4HC, 2014 .......................................................................................................... 50
Table 31. Prevalence of Obesity Among Low-Income Mothers in 17 Counties in CA, by Race/Ethnicity, C4HC, 2014 .......................................................................................................... 50
Obesity Prevalence among Low-Income Adolescents in C4HC .................................... 51
Figure 26. Prevalence of Obesity Among Low-income Adolescents in 17 Counties in CA, by Race/Ethnicity, C4HC, 2014 .......................................................................................................... 51
Table 32. Prevalence of Obesity Among Low-Income Adolescents in 17 Counties in CA, by Race/Ethnicity, C4HC, 2014 .......................................................................................................... 51
Obesity Prevalence among Low-Income Children in C4HC .......................................... 51
Figure 27. Prevalence of Obesity Among Low-income Older Children in 17 Counties in CA, by Race/Ethnicity, C4HC, 2014 .......................................................................................................... 52
Table 33. Prevalence of Obesity Among Low-Income Older Children in 17 Counties in CA, by Race/Ethnicity, C4HC, 2014 .......................................................................................................... 52
Health Consequences and Costs of Obesity .................................................. 52 Table 34. Obesity-Related Health Conditions ................................................................................ 53
Figure 28. Obesity-Related Inpatient Hospital Charges in California, Totala, and by Condition, OSHPD, 2005-2014 ....................................................................................................................... 54
Table 35. Obesity-Related Inpatient Hospital Charges in California, Totala, and by Condition, OSHPD, 2014b ............................................................................................................................... 54
Table 36. Medi-Cal Obesity-Related Inpatient Hospital Charges in California, by Condition and Percent of All Payers, OSHPD, 2014a ........................................................................................... 54
Conclusion ......................................................................................................... 55
References ......................................................................................................... 56
Appendix A. Supplementary Information........................................................ 61 Appendix Table 1. List of the 17 Counties in California Included in the C4HC Sample, 2014 ...... 61

| 11
Appendix Table 2. Sample Sizes of Included Data Sources. ........................................................ 61
Introduction
Obesity in the United States Since the late 1970s, obesity rates have risen dramatically in the United States (US), among both adults and children. The most recent data from the 2013-2014 US National Nutrition Examination Survey (NHANES) found obesity prevalence of 37.7 percent for adults aged 20 years and over, with somewhat higher figures among adult women (40.4 percent) than adult men (35.0 percent).1 These prevalence estimates reflect a significant increase in obesity over the last decade for women, but not for men. For children and youth (ages 2-19), NHANES data from 2013-14 show obesity prevalence at 17.0 percent, about half that for adults.2 Obesity prevalence increased with age among children; estimates for children aged 2-5 years, 6-11 years, and 12-19 years were 9.4 percent, 17.4 percent, and 20.6 percent, respectively. The analysis of trends among children include data that extend back to the 1980s, and while the prevalence for all child age groups were higher in 2013-14 than in the 1980s, some differences between age groups can be seen. For example, among 2-5 year olds, obesity rates increased until 2007-08, and then decreased. For 6-11 year olds, obesity increased until 2007-08, and then remained stable. And for adolescents, obesity increased steadily from the 1980s to 2013-14. Significant disparities in obesity prevalence persist between different sub groups of the US population. In 2013-14, obesity was most prevalent among African American and Hispanic populations, and lower among Asian adults, compared with Non-Hispanic whites. African American and Hispanic women had the highest rates at 56.9 percent and 45.7 percent, respectively.3 There are also disparities in obesity prevalence by socioeconomic status, with obesity being less prevalent among adults with higher levels of education.4 Regional disparities in obesity prevalence also exist in the US. Among adults, the West has the lowest prevalence of obesity at 25.2 percent, followed by the Northwest (26.4 percent), the Midwest (30.7 percent) and the South (31.2 percent). Among children ages 10-17, the Northwest has the lowest prevalence of overweight and obesity (14.6 percent) followed by the West (21.5 percent), Midwest (22.2 percent), and South (41.8 percent).5
The high prevalence of obesity is associated with increasing rates of chronic diseases including type 2 diabetes,6 cardiovascular disease,7 and cancer,8 as well as premature mortality.9 The obesity epidemic is also associated with substantial costs to society associated with elevated health care expenditures10 and reduced worker productivity.11,12 The California Department of Public Health has been monitoring obesity rates in the population utilizing available data sources to track the percentage of the population and sub-groups affected by overweight and obesity and select risk factors. This report presents a compilation of those data to describe the prevalence of

| 12
obesity and overweight in California, as well as to present population estimates for some of the key risk factors associated with the development of excess weight.
National Targets for Obesity Reduction
Healthy People 2020 Healthy People 2020 provides national goals and targets for improving the health of Americans.13 This report compares current estimates of obesity prevalence among Californians with the corresponding Healthy People 2020 targets. The Healthy People 2020 weight-status objectives include specific targets for reducing obesity, with the goal of achieving a 10 percent improvement over the 2010 prevalence estimates. The Healthy People 2020 targets for obesity among adults, adolescents, and children are as follows:
Reduce the proportion of adults who are obese to ≤ 30.5 percent.
Reduce the proportion of children and adolescents aged 2 to 19 years who are considered obese to ≤ 14.5 percent.
Reduce the proportion of adolescents aged 12 to 19 years who are considered obese to ≤ 16.1 percent.
Reduce the proportion of children aged 6 to 11 years who are considered obese to ≤ 15.7 percent.
Reduce the proportion of children aged 2 to 5 years who are considered obese to ≤ 9.4 percent.
Indicators of Overweight and Obesity Prevalence Body mass index (BMI), calculated by dividing an individual’s weight (in kg) by their height (in m2), is widely used as an indicator of overweight and obesity. Although the measure has limitations in assessing whether an individual has excessive body fat, this measure generally is considered useful at the population level. Overweight and obesity generally are defined as follows:
Overweight: o Adults with a BMI between 25.0 and 29.9 kg/m2 o Children and adolescents whose BMI falls between the 85th and 95th
percentiles (according to growth charts developed in 2000 by the U.S. Centers for Disease Control and Prevention14)
Overweight-for-age: o Children with a weight-for-age above the 85th percentile according to
growth charts developed in 2000 by the U.S. Centers for Disease Control and Prevention14 (sometimes used when accurate measures of height are not available)
Obese: o Adults with a BMI of 30 kg/m2 or higher

| 13
o Children and adolescents with a BMI at or above the 95th percentile according to growth charts developed in 2000 by the U.S. Centers for Disease Control and Prevention14
The California Obesity Prevention Plan The state of California has developed an Obesity Prevention Plan that outlines six nutrition and physical activity behaviors the state will work to improve in order to support population weight and health goals. The plan and the supporting evidence for the behaviors it targets are described below.
California Obesity Prevention Plan The California Obesity Prevention Plan focuses on policy and environmental change, based on emerging evidence indicating that environmental factors play a critical role in efforts to address the obesity epidemic.15 The Plan incorporates strategies that address the Center for Disease Control and Prevention’s (CDCs) evidence-based target areas, and encourages California to improve population diet and fitness by implementing efforts to:
Increase breastfeeding initiation, duration, and exclusivity.
Decrease consumption of sugar-sweetened beverages.
Decrease consumption of low nutrient, energy-dense foods (foods that are high in calories but have little nutritional value).
Increase consumption of fruits and vegetables.
Increase physical activity.
Decrease television viewing time.
Rationale for California Prevention Plan Objectives The state objectives are underpinned by evidence of the associations between dietary and physical activity behavior and weight status. Dietary behaviors for which at least moderate evidence indicates a relationship with obesity include consumption of sugar sweetened beverages,16 fast food,17 and other energy dense foods of minimal nutritional value.18 There is also at least moderate evidence that breastfeeding in the first year of life is protective against obesity;19 and, there is some evidence suggesting that consumption of fruits and vegetables is inversely associated with weight change as well.20 As such, it may be that consumption of fruits and vegetables is a protective factor against obesity. Increases in physical activity frequency, intensity, and duration,21,22 and decreases in time spent in sedentary activity are also inversely related to obesity.23,24 Environmental factors can either detract from, or promote, healthy eating and active living, in places where people live, study, work, and play.25 A lack of access and

| 14
resources to purchase healthy, affordable foods including fresh fruits and vegetables and easy access to fast food and family restaurants with unhealthy options and oversized portions contribute to obesity risk.26-30 Lack of access to safe places to exercise in neighborhoods,31,32 busy work schedules,33 and social norms related to television (TV) and computer use are notable barriers to physical activity.34,35
State Obesity and Risk Factor Surveillance - Data Sources Population surveillance of obesity, and its associated risk factors, requires ongoing collection and analysis of accurately measured heights, weights, and related health behaviors from a representative sample of the population. Assessment of population subgroups, such as children and adolescents, low-income individuals and families, and particular racial and ethnic groups requires additional sampling efforts. Measured heights and weights are known to be more accurate than those collected by self-report. Yet, because collecting measures of heights and weights on large samples of the population is expensive, many surveys rely on self-reported height and weight measures. Where possible, this report utilizes the strongest sources of population health and behavioral data, in order to present a snapshot of the weight status, dietary, and physical activity behaviors of California’s population. This report presents obesity prevalence data from two different representative samples of the California population: the California Health Interview Survey (CHIS) and the Physical Fitness Test (FitnessGram) measured in schools. Each of these data sources, described below, has strengths and weaknesses.
CHIS The nation’s largest state health survey, CHIS, includes more than 20,000 households and is conducted by the University of California, Los Angeles Center for Health Policy Research.36 It is a statewide, random-digit-dial telephone survey, with results that are representative of the population of California.37 Since 2011, CHIS has been conducted on a continuous basis, providing annual estimates; prior to 2010, CHIS was conducted biennially. CHIS provides estimates of statewide obesity prevalence for adults (18 years and older) and adolescents (12-17 years) based on BMI calculations using self-reported heights and weights obtained from telephone interviews. CHIS also provides prevalence estimates of overweight-for-age among children (2-11 years) obtained from parent reports of children’s weights. Self-reported measures of height and weight tend to be inaccurate, particularly among children.38 In CHIS, weight-for-age is used for children, because studies have shown that parents are unable to report accurate height measurements for their children.

| 15
CHIS also provides self-reported estimates of consumption of fruits and vegetables, soda and other sugary beverages, fast food, as well as physical activity and sedentary behavior. In this report, where feasible, obesity prevalence rates are derived from 2014 CHIS, to provide the most recent estimates for weight and health indicators. However, for some subpopulations, inadequate annual sample sizes required pooling the data from multiple years in order to obtain a statistically stable prevalence estimate.
FitnessGram FitnessGram is a health-related, physical fitness test administered to all 5th (n=455,897), 7th (n=439,476), and 9th (n=441,730) grade public school students in California. It was developed by The Cooper Institute and includes measured aerobic capacity, strength, and flexibility, in addition to the measured heights and weights that are used to calculate BMI. FitnessGram data allow for the stratification of results by sex, race/ethnicity, and socioeconomic status. Socioeconomic status was defined as either economically disadvantaged or not economically disadvantaged based on the student’s parent/guardian’s highest educational attainment and the student’s eligibility for free or reduced price meals in the National School Lunch Program. The FitnessGram data for obesity prevalence presented in this report were collected during the 2014-2015 school year.39
Data Limitations The estimates from CHIS data presented here rely on self-reports and don’t provide a large enough sample size for most subgroups to allow for annual point estimates and statewide tracking of obesity progress. While the FitnessGram estimates presented in this report are measured, they are only available for students in three grades. For adolescents, there are differences between the measured FitnessGram obesity rates for adolescents and the CHIS self-reported estimates.
Additional data sources Two other surveys were used to obtain prevalence estimates of selected nutrition-related and physical activity behavior.
National Immunization Survey Breastfeeding prevalence estimates for California were derived from the National Immunization Survey, a telephone survey conducted by the CDC’s National Center for Immunization and Respiratory Diseases. This report includes data for children born in 2012.40
Behavioral Risk Factor Surveillance System (BRFSS) Data on physical activity among California adults in 2013 were obtained from the BRFSS, a telephone survey of more than 400,000 adults conducted each year on health-related risk behaviors, chronic health conditions, and use of preventive services.41

| 16
Champions for Healthy Change This report also includes data from a special study of a select population of low-income Californians, Champions for Healthy Change (C4HC). Conducted by the California Department of Public Health, C4HC is a telephone survey of a random sample of mothers/female caregivers (n=6,281 women) and their children (n=1,693 adolescents and 2,735 children) who are enrolled in the Supplemental Nutrition Assistance Program (SNAP). The sample represents the 17 counties that have the largest SNAP-eligible populations in California (Appendix Table 1). BMI is calculated from self-reported heights and weights. C4HC data are not generalizable to the state of California, but provide insights about the SNAP-eligible population within the 17-county C4HC sample.
California Prevalence of Selected Risk Factors for Obesity The following sections summarize recent prevalence estimates for behavioral factors identified in the California Obesity Prevention Plan and selected environmental factors affecting dietary and physical activity behavior. Data from California are compared against recommendations from the American Academy of Pediatrics,42,43 the 2015-2020 Dietary Guidelines for Americans,44 the Healthy People 2020 objectives,13 and the 2008 Physical Activity Guidelines for Americans.45
Breastfeeding The American Academy of Pediatrics recommends exclusively breastfeeding (no other fluids or solid foods) babies for six months, and continuing to breastfeed, in conjunction with solid foods, for at least a year.42
In California 88.3 percent of infants born in 2012 were breastfed at least once (ever breastfed), and 65.9 percent were breast fed for at least 6 months, though only 32.5 percent were exclusively breastfed for those 6 months.40 The prevalence of breastfeeding through at least the first year was 43.2 percent.
In this report, the following definitions are used for categorizing individuals as adults, adolescents, and children:
Adults: 18 years or older
Adolescents: 12 to 17 years
Children: 2 to 11 years o Younger children: 2 to 5 years o Older children: 6 to 11 years

| 17
Table 1. Prevalence of Breastfeeding Among Infants Born in California in 2012, National Immunization Survey
Breastfeeding Status
Percent (95% CI)a
Ever Breastfed 88.3% (80.9, 93.0)
Breastfed for at least 6 months 65.9% (58.0, 73.1)
Exclusively Breastfed for at least 6 months 32.5% (25.6, 40.2)
Breastfed through the first year 43.2% (35.8, 51.1)
Notes: a95% CI = 95% Confidence Interval
Dietary Behaviors
Sugar-Sweetened Beverages The 2015 Dietary Guidelines for Americans recommend that added sugars be limited to less than 10 percent of daily calories.44 Recommended behavior changes to achieve this goal include reducing the portion size and frequency of sugar-sweetened beverage consumption; selecting beverages low in added sugars; and consuming more beverages with no added sugars, such as water. While the available data do not include estimates of intake of added sugar as a percent of daily calories, this report presents data about the intake of sugar-sweetened beverages and other sugary beverages.
The most recent CHIS survey indicated that consumption of sugar-sweetened soda (those that report drinking one or more sodas on the previous day) was higher for adolescents (30.5 percent) than for older children (16.8 percent), or young children (10.8 percent).46 Adults were asked to report the frequency with which they consumed soda over the past month. For an average week, consumption was lower among adults than children or adolescents, with 10.1 percent of adults reporting drinking, on average, one or more sodas per day. A higher proportion of adolescents also consumed other sugary beverages, such as sweetened fruit drinks, sports and energy drinks, sweetened coffee and tea drinks, etc.46 A higher proportion of adolescents (36.6 percent) reported consuming other sugary beverages on the previous day, as compared to older children (21.7 percent) and younger children (14.1 percent).
Fast Food Although there are no guidelines specifically relating to fast food, the Dietary Guidelines advise consumers to limit daily intakes to less than: 10 percent of calories from added sugars; 10 percent of calories from saturated fats; 2,300 milligrams of sodium; and to limit overall caloric intake to maintain a healthy weight.44 These guidelines imply limiting fast food intake, because of their high content of sugar, saturated fat, sodium, and calories.
Approximately two-thirds of Californian adults (62.7 percent) and young children (65.1 percent) reported eating fast food at least once during the week prior to being surveyed.46 Older children and adolescents were more likely to report

| 18
having eaten fast food in the past week (73.5 percent and 75.9 percent, respectively).
Consumption of Fruits and Vegetables The Dietary Guidelines for Americans recommend consuming 1 to 1.5 cup equivalents of vegetables per day for young children, and 2-3 cup equivalents per day for older children, adolescents and adults.44 For fruits, the recommendations are 1 to 1.5 cup equivalents for younger children, and 1.5 to 2 cup equivalents per day for older children, adolescents and adults.
A greater proportion of young children in California ate at least two servings of fruit per day (76.1 percent) compared to the percentage of older children (64.2 percent) and adolescents (54.3 percent) who did so.46 Only 20.9 percent of adolescents met the recommendations to consume at least five servings of fruits and vegetables per day.
Table 2a. Prevalence of Key Dietary Factors Influencing Risk of Obesity among California Children and Adolescents, CHIS, 2014 Age (yrs)
Percent that Drank One or
More Soda with Sugar in the Past
Day (95% CI)a
Percent that Drank One or More Sugary
Beverages Other than Soda in the
Past Day (95% CI)
Percent that Ate Fast Food in the
Past Week (95% CI)
Percent that Ate At Least Two
Servings of Fruit in the Past Day
(95% CI)
Percent that Ate Five or More Servings of Fruits and
Vegetables per Day
(95% CI)
2-5 10.8% (4.6, 17.0)
14.1%b 65.1%b 76.1% (69.6, 82.7)
N/Ac
6-11 16.8% (13.1, 20.4)
21.7%b 73.5%b 64.2% (59.0, 69.3)
N/Ac
12-17 30.5% (25.1, 36.0)
36.6% (31.5, 41.7)
75.9% (72.1, 79.7)
54.3% (49.4, 59.3)
20.9% (16.9, 24.8)
Notes: a95% CI = 95% confidence interval b95% CI not available cData not available
Table 2b. Prevalence of Key Dietary Factors Influencing Risk of Obesity among California Adults, CHIS, 2014 Age (yrs)
Percent that Drank One or
More Soda with Sugar per Day
(95% CI)a
Percent that Drank One or More Sugary
Beverages Other than Soda in the
Past Day (95% CI)
Percent that Ate Fast Food in the
Past Week (95% CI)
Percent that Ate At Least Two
Servings of Fruit in the Past Day
(95% CI)
Percent that Ate Five or More Servings of Fruits and
Vegetables per Day
(95% CI)
18+ 10.1%
(9.1, 11.1)
N/Ab 62.7% (61.3, 64.2)
N/Ab N/Ab
Notes: a95% CI = 95% confidence interval bData not available

| 19
Physical Activity The 2008 Physical Activity Guidelines for Americans recommend that children and adolescents engage in at least 60 minutes of physical activity every day of the week, and that adults aim for 150 minutes of moderate intensity, or 75 minutes of vigorous activity, plus strengthening exercises each week.45
The percentage of California children and youth meeting the physical activity recommendation progressively declined with age: 41.8 percent of younger children, 31.4 percent of older children, and 12.2 percent of adolescents engaged in at least 60 minutes of physical activity every day of the week.46 Among adults, nearly one-quarter (24.4 percent) reported meeting the adult physical activity guidelines.47
Table 3. Percent of Californians Meeting the Physical Activity Guidelines, CHIS 2014a and BRFSS 2013b. Age (yrs) Physical Activity Guideline Percent that Met
Physical Activity Guideline (95% CI)c,d
2-5a 60+ minutes per day 41.8% (27.7, 55.8)
6-11a 60+ minutes per day 31.4% (25.2, 37.5)
12-17a 60+ minutes per day 12.2% (9.4, 14.9)
18+b 150+ minutes of moderate-intensity or 75+ minutes of vigorous-intensity aerobic activity (or an equivalent combination)c per week, along with muscle strengthening exercise 2+ times per week
24.4% (23.2, 25.6)
Notes: aCHIS 2014 bBehavioral Risk Factor Surveillance System Survey 2013 cFor adults, one minute of vigorous-intensity physical activity counts as two minutes of moderate-intensity physical activity toward meeting the guideline.
d95% CI = 95% Confidence Interval
Time Spent in Sedentary Activities The American Academy of Pediatrics recommends limiting children’s screen time to no more than 2 hours per day, and limiting young children’s (2-5 years) digital media use to no more than 1 hour per day .43,48 CHIS does not specifically ask about screen time, but asks about sedentary time spent in various activities, including watching television, playing computer games, talking with friends, and engaging in other sitting activities.
Only 16.6 percent of young children limited sedentary activity time to less than 1 hour.46
Just over half (53.7 percent) of older children limited sedentary activity time to less than 2 hours, while 40.2 percent of adolescents did so.46

| 20
Table 4a. Percent of California Young Children Meeting the Screen Time Guidelines, CHIS, 2014 Age (yrs) Screen Time Recommendationa Percent that had less than 1 hour
of sedentary activity, including screen time
(95% CI)b
2-5 No more than 1 hour a day 16.6% (11.5, 21.8)
Notes: Child data is for weekdays after school only. aCHIS collects data on all sedentary activities, not specifically on screen time.
b95% CI = 95% Confidence interval
Table 4b. Percent of California Older Children and Adolescents Meeting the Screen Time Guidelines, CHIS, 2014 Age (yrs) Screen Time Recommendationa Percent that had no more than 2
hours of sedentary activity, including screen time
(95% CI)b
6-11 No more than 2 hours a day 53.7%c
12-17 No more than 2 hours a day 40.2% (35.9, 44.5)
Notes: Child and adolescent data are for weekdays after school only. aCHIS collects data on all sedentary activities, not specifically on screen time.
b95% CI = 95% Confidence interval c95% CI not available
Availability and affordability of healthful foods While availability and affordability of healthful foods enable individuals to consume a healthy diet, no standard metrics for food access are available against which to compare currently available data about food access.
While most (76.1 percent) California adults said that fresh fruits and vegetables were always available in their neighborhoods, almost 1 in 4 reported that they were usually (10.6 percent), sometimes (9.3 percent), or never (2.9 percent) available.46
When asked how often fresh fruits and vegetables were affordable in their neighborhoods, 47.0 percent said always affordable, 31.1 percent said usually affordable, 20.9 percent said sometimes affordable, and 1.1 percent said never affordable.46

| 21
Table 5. Reported Availability and Affordability of Fresh Fruits and Vegetables in Neighborhoods Among California Adults, CHIS, 2014.
Frequency Percent reporting how often Fresh Fruits and
Vegetables are Available in Neighborhood
(95% CI)a
Percent reporting how often Fresh Fruits and
Vegetables are Affordable in
Neighborhood (95% CI)
Always 76.1% (74.8, 77.3)
47.0% (45.5, 48.4)
Usually 10.6% (9.7, 11.4)
31.1% (29.6, 32.5)
Sometimes 9.3% (8.2, 10.3)
20.9% (19.5, 22.2)
Never 2.9% (2.4, 3.4)
1.1% (0.8, 1.3)
Notes: a95% CI = 95% Confidence Interval
Perceived safety of nearby parks and playgrounds Perception of neighborhoods being unsafe has been associated with obesity among adults and children, even after adjustment for socioeconomic characteristics.49
Among California adolescents, 9.5 percent regarded nearby parks or playgrounds as unsafe during the day.46
Table 6. Reported perception of Safety of Nearby Parks and Playgrounds Among California Adolescents,a CHIS, 2014.
Level of agreement Nearby park or playground safe during the day
(% (95% CI)b)
Strongly agree 44.2% (39.3, 49.1)
Agree 46.3% (41.9, 50.7)
Disagree 7.5% (4.9, 10.0)
Strongly Disagree 2.0% (1.0, 3.1)
Notes: aQuestion was only asked to adolescents b95% CI = 95% Confidence Interval
Adult Obesity Prevalence and Trends
The next section describes adult obesity prevalence rates for the state of California. First, obesity rates among all adults are presented, followed by rates for those in

| 22
particular population subgroups as indicated by their geographic region of residence, age group, sex, race/ethnicity, and socioeconomic status.
Adult Obesity Prevalence from CHIS In 2014, 27.0 percent of California adults, numbering approximately 7,700,000 individuals, were obese.46 Although, this rate was lower than the Healthy People 2020 target of ≤ 30.5 percent,13 the prevalence of obesity has increased in California by nearly 40 percent since 2001.50
Figure 1. Prevalence of Obesity Among California Adults, CHIS, 2001-2014
0.0
5.0
10.0
15.0
20.0
25.0
30.0
35.0
2001 2003 2005 2007 2009 2011 2012 2013 2014
Per
cen
t O
bes
e
Year
Healthy People 2020 Target
Performing better than
target

| 23
Table 7. Prevalence of Obesity Among California Adults, CHIS, 2001-2014
Year Percent Obese (95% CI)a
2001 19.3% (18.9, 19.8)
2003 20.4% (19.9, 20.9)
2005 21.2% (20.6, 21.8)
2007 22.6% (22.0, 23.2)
2009 22.7% (21.9, 23.6)
2011 25.1% (24.2, 26.1)
2012 24.2% (23.2, 25.2)
2013 24.7% (23.5, 25.9)
2014 27.0% (25.5, 28.6)
Notes: a95% CI = 95% Confidence Interval.
Obesity Prevalence among California Adults by County
Data from CHIS in 2013 and 2014 were pooled to calculate adult obesity prevalence estimates for each county in California. During this period, 13 counties had higher prevalence rates of obesity than the Healthy People 2020 target of ≤ 30.5 percent.13,51 In comparison, no counties surpassed the target in 2001.52 San Francisco County had the lowest obesity prevalence in 2013-14, 11.5 percent, which had remained stable over the period 2001 to 2013-14. Imperial County had the highest prevalence of obesity in 2013-2014 (43.5 percent), nearly a 50 percent increase from the 2001 estimate of 29.0 percent. For most counties, prevalence rates for obesity increased from 2001 to 2013-14. The exceptions were Contra Costa and Nevada counties, which had lower obesity prevalence rates in 2013-2014 compared to 2001.51,52

| 24
Figure 2. Prevalence of Obesity Among California Adults, by County, CHIS, 2013-2014 (pooled)
< 20.0%
20.0-29.0%
≥ 30.0%

| 25
Table 8. Prevalence of Obesity Among California Adults, by County, CHIS, 2001 and 2013-2014 pooled
County
2001 2013-2014 Percent Change in % Obese
2001-2013/14 % Obese Rank* % Obese Rank*
Alameda 17.4 13 21.7 9 24.7
Butte 18.9 19 29.8 28 57.7
Contra Costa 20.4 21 20.3 7 -0.5
Del Norte, Siskiyou, Lassen, Trinity, Modoc, Plumas, Sierra
22.7 28 24.2 15 6.6
El Dorado 18.3 17 22.4 10 22.4
Fresno 26.3 40 39.3 41 49.4
Humboldt 22 26 27.3 24 24.1
Imperial 29 42 43.5 44 50.0
Kern 25.6 36 40.5 42 58.2
Kings 27.1 41 41.2 43 52.0
Lake 26.1 38 28 25 7.3
Los Angeles 20.1 20 26 22 29.4
Madera 25.4 35 33.9 36 33.5
Marin 11.8 2 12.2 2 3.4
Mendocino 21.7 24 22.9 11 5.5
Merced 29.6 43 30.3 31 2.4
Monterey 25.3 33 30.8 32 21.7
Napa 17.7 16 23.5 12 32.8
Nevada 15.6 7 14.5 3 -7.1
Orange 14.8 4 19.5 5 31.8
Placer 15.7 8 23.5 13 49.7
Riverside 20.9 23 26.9 23 28.7
Sacramento 21.8 25 29.1 27 33.5
San Benito - - 25.4 21 -
San Bernardino 24.9 32 35 37 40.6
San Diego 16.5 10 24.2 16 46.7
San Francisco 11.5 1 11.8 1 2.6
San Joaquin 25.6 37 32.2 34 25.8
San Luis Obispo 16.3 9 20.4 8 25.2
San Mateo 17.4 13 18.5 4 6.3
Santa Barbara 17.2 12 28.6 26 66.3
Santa Clara 15.5 6 20 6 29.0
Santa Cruz 15.2 5 23.7 14 55.9

| 26
Shasta 20.8 22 29.8 29 43.3
Solano 22.5 27 24.3 17 8.0
Sonoma 14.1 3 29.9 30 112.1
Stanislaus 24.8 31 35.9 40 44.8
Sutter 25.3 34 31.2 33 23.3
Tehama, Glenn, Colusa 24.3 30 33.1 35 36.2
Tulare 23.9 29 35.6 39 49.0
Tuolumne, Calaveras, Amador, Inyo, Mariposa, Mono, Alpine
16.7 11 24.8 19 48.5
Ventura 17.5 15 25.2 20 44.0
Yolo 18.6 18 24.5 18 31.7
Yuba 26.1 39 35.5 38 36.0
*Counties are ranked from lowest to highest obesity prevalence; 1=the county with the lowest obesity prevalence rate in 2013-2014
Obesity Prevalence among California Adults by Age Group The prevalence estimates of obesity among California adults were at or below the Healthy People 2020 target of ≤ 30.5 percent for all age groups, except for adults aged 51-64 years, who exceeded the target with an obesity rate of 34.1 percent.13,46 Obesity rates among younger and older adults (18-34 years, and 65 and older), were below the 2020 target of ≤ 30.5 percent (13 percent and 25 percent obese, respectively), while the rates for 35-50 year-olds were at the target of ≤ 30.5 percent.
Figure 3. Prevalence of Obesity Among California Adults, by Age, CHIS, 2014
13.1
25.8
30.5
34.1
24.4
0.0
5.0
10.0
15.0
20.0
25.0
30.0
35.0
40.0
18-24 25-34 35-50 51-64 65+
Per
cen
t O
bes
e
Age (Years)
Healthy People 2020 Target
Performing better than
target

| 27
Table 9. Prevalence of Overweight and Obesity Among California Adults, by Age, CHIS, 2014
Notes: a95% CI = 95% Confidence Interval.
Obesity Prevalence among California Adults by Sex and Race/Ethnicity The prevalence of obesity in California in 2014 varied substantially among subgroups according to sex and race/ethnicity.46 While obesity rates for non-Latino White and non-Latino Asian Californians met the Healthy People 2020 targets, the rates for non-Latino African American and Latino adults exceeded 30.5 percent.13,46 Obesity rates were lowest among non-Latino Asian women (9.8 percent) and men (15.9 percent) and highest among non-Latino African American women (49.8 percent) and Latino men (35.4 percent). While the obesity rates for men varied substantially by race/ethnicity, with Latino men having more than double the rate of obesity of non-Latino Asian men, the disparities among women were even more dramatic. Among women, the prevalence of obesity among non-Latino African American women was five times the rate of non-Latino Asian women, and more than double the rate among non-Latino White women.
Age (years)
Percent Obese (95% CI)a
18-24 13.1% (9.9, 16.3)
25-34 25.8% (21.9, 29.7)
35-50 30.5% (27.8, 33.2)
51-64 34.1% (30.9, 37.3)
65+ 24.4% (21.7, 27.1)

| 28
Figure 4. Prevalence of Obesity Among California Adults, by Sex and Race/Ethnicity, CHIS, 2014
Table 10. Prevalence of Obesity Among California Adults, by Sex and Race/Ethnicity, CHIS, 2014
Race/Ethnicity
Male Female
Percent Obese (95% CI)a
Percent Obese (95% CI)
Non-Latino White 25.2% (22.0, 28.3)
22.9% (20.6, 25.3)
Non-Latino African American
31.5% (22.0, 41.0)
49.8% (39.2, 60.5)
Non-Latino Asian 15.9% (10.5, 21.2)
9.8% (5.7, 13.9)
Latino 35.4% (32.0, 38.8)
33.3% (29.8, 36.8)
Notes: a95% CI = 95% Confidence Interval.
Obesity Prevalence among California Adults by Socioeconomic Status The prevalence of obesity in 2014 was higher among low-income California adults compared to those with higher incomes.46 In fact, an inverse relationship between income and obesity existed: as household income increased in California, adult obesity rates decreased. Adults with the lowest income (0-99 percent FPL) had the highest obesity prevalence (31.4 percent), which exceeded the Healthy People 2020 target of ≤ 30.5 percent.13,46 Adults in the highest income group (500 percent FPL or more) had the lowest obesity prevalence (22.5 percent).
25.2 22.9
31.5
49.8
15.9
9.8
35.433.3
0.0
10.0
20.0
30.0
40.0
50.0
60.0
Male Female
Per
cen
t O
bes
e
Sex
Non-Latino White Non-Latino African American Non-Latino Asian Latino
Healthy People 2020 Target
Performing better than
target

| 29
Figure 5. Prevalence of Obesity Among California Adults, by Household Poverty Level, CHIS, 2014
Table 11. Prevalence of Obesity Among California Adults, by Household Poverty Level, CHIS, 2014
Notes: a95% CI = 95% Confidence Interval.
Adolescent Obesity Prevalence and Trends
This section presents obesity prevalence rates among California adolescents. First, obesity rates are presented from the FitnessGram assessment conducted with 9th and 7th grade students in California public schools. Following the FitnessGram results, obesity rates from CHIS are presented. The strength of the FitnessGram data is that it
31.430.2 29.5
26.7
23.0 22.5
0.0
5.0
10.0
15.0
20.0
25.0
30.0
35.0
0-99 100-199 200-299 300-399 400-499 500+
Per
cen
t O
bes
e
Household Percent Federal Poverty Level
Household Percent Federal Poverty Level
Percent Obese (95% CI)a
0-99 31.4%
(27.2, 35.5)
100-199 30.2%
(26.6, 33.8)
200-299 29.5%
(25.1, 33.9)
300-399 26.7%
(22.8, 30.6)
400-499 23.0%
(18.6, 27.4)
500+ 22.5%
(20.2, 24.8)
Healthy People 2020 Target
Performing better than
target

| 30
provides measured heights and weights for the population of California students; however, it is limited in that it only measures students in select grades. CHIS is limited in that it provides self-reported data, but its strength is that it provides estimates for a representative sample of adolescents across the 12-17 age range. While the findings from the two different methodologies cannot be compared to each other, given the differences in sampling, measurement, and time periods, each is useful for exploring trends over time. For this report, only the overall CHIS adolescent data can be viewed across time, due to small sample sizes for subgroups annually. FitnessGram only recently began to publicly report obesity and overweight data in accordance with the CDC growth chart definitions; thus, for this report, only the most recent data (school year 2014-2015) are presented.
Adolescent Obesity Prevalence from FitnessGram Obesity rates differed for adolescents among different subgroups of sex, race/ethnicity, and socioeconomic status.
Obesity Prevalence among California 9th graders, Overall and by Sex
In the 2014-2015 school year, 17.2 percent of 9th graders in California were obese.39
Obesity rates were higher for males than females (19.3 percent vs 14.8 percent).
Figure 6. Prevalence of obesity among California 9th graders in public schools, overall and by sex, FitnessGram, 2014-2015 school year.
17.2
14.8
19.3
0.0
5.0
10.0
15.0
20.0
25.0
All Female Male
Per
cen
t O
bes
e
Healthy People 2020 Target
Performing better than
target

| 31
Table 12. Prevalence of obesity among California 9th graders in public schools, overall and by sex, FitnessGram, 2014-2015 school year.
Obesity Prevalence among California 9th graders by Race/Ethnicity The majority (52.2 percent) of 9th graders measured by FitnessGram in 2014-2015 identified as Hispanic/Latino. This group has a high rate of obesity (21.8 percent). The lowest rates of obesity were found among Non-Latino Asian and White 9th graders (7.6 percent and 11.1 percent, respectively), while the relatively small group of Native Hawaiian/Pacific Islanders had the highest obesity rates (28.8 percent).39
Total in FitnessGram Obese
n % n %
All 441,730 100.0 75,978 17.2
Female 215,044 48.7 31,827 14.8
Male 226,686 51.3 43,750 19.3

| 32
Figure 7. Prevalence of obesity among California 9th graders in public schools, by race/ethnicity, FitnessGram, 2014-2015 school year.
Table 13. Prevalence of obesity among California 9th graders in public schools, by race/ethnicity, FitnessGram, 2014-2015 school year.
Race/Ethnicity Total in FitnessGram Obese
n % n %
White 109,372 24.8 12,140 11.1
African American 25,763 5.8 4,766 18.5
American Indian/Alaska Native
4,425 1.0 956 21.6
Asian 41,332 9.4 3,141 7.6
Filipino 12,767 2.9 1,660 13.0
Native Hawaiian/Pacific Islander
2,261 0.5 651 28.8
Multiracial 2,261 0.5 2,037 13.5
Hispanic/Latino 230,720 52.2 50,297 21.8
11.1
18.5
21.6
7.6
13.0
28.8
13.5
21.8
0.0
5.0
10.0
15.0
20.0
25.0
30.0
35.0
Per
cen
t O
bes
e
Race/Ethnicity
Performing better than
target
Healthy People 2020 Target

| 33
Obesity Prevalence among California 9th graders by Socioeconomic Status Most (56.2 percent) 9th grade students in California public schools in 2014-15 were considered economically disadvantaged. Ninth graders from economically disadvantaged households had almost double the rate of obesity (21.4 percent) compared to students from more advantaged households (11.1 percent).39
Figure 8. Prevalence of obesity among California 9th graders in public schools, by socioeconomic status, FitnessGram, 2014-2015 school year.
Table 14. Prevalence of obesity among California 9th graders in public schools, by socioeconomic status, FitnessGram, 2014-2015 school year
Socioeconomic Status Total in FitnessGram Obese
n % n %
Economically disadvantaged
248,049 56.2 53,082 21.4
Not economically disadvantaged
156,706 35.5 17,394 11.1
No economic information 36,973 8.4 5,176 14.0
Obesity Prevalence among California 7th graders, Overall and by Sex In the 2014-2015 school year, FitnessGram results showed that 19.1 percent of 7th graders in California were obese.39 As with 9th grade students, males had a higher obesity prevalence (20.9 percent) than females (17.3 percent).
21.4
11.1
14.0
0.0
5.0
10.0
15.0
20.0
25.0
Economicallydisadvantaged
Not economicallydisadvantaged
No economicinformation
Per
cen
t O
bes
e
Socioeconomic Status
Healthy People 2020 Target
Performing better than
target

| 34
Figure 9. Prevalence of obesity among California 7th graders in public schools, overall and by sex, FitnessGram, 2014-2015 school year.
Table 15. Prevalence of obesity among California 7th graders in public schools, overall and by sex, FitnessGram, 2014-2015 school year.
Total in FitnessGram Obese
n % n %
All 439,476 100.0 83,940 19.1
Female 214,778 48.9 37,157 17.3
Male 224,698 51.1 46,962 20.9
Obesity Prevalence among California 7th graders by Race/Ethnicity Most (52.4 percent) 7th grade students in California public schools in 2014-15 identified as Hispanic/Latino. Obesity rates were high among this group (24.8 percent). Asian and White 7th graders had the lowest rates of obesity (8.1 percent and 11.7 percent, respectively), while the relatively small group of Native Hawaiian/Pacific Islanders had the highest (30.4 percent).39
19.1
17.3
20.9
0.0
5.0
10.0
15.0
20.0
25.0
All Female Male
Per
cen
t O
bes
e Healthy People 2020 Target
Performing better than
target

| 35
Figure 10. Prevalence of obesity among California 7th graders in public schools, by race/ethnicity, FitnessGram, 2014-2015 school year.
Table 16. Prevalence of obesity among California 7th graders in public schools, by race/ethnicity, FitnessGram, 2014-2015 school year.
11.7
20.2
25.8
8.1
14.3
30.4
14.6
24.8
0.0
5.0
10.0
15.0
20.0
25.0
30.0
35.0
Per
cen
t O
bes
e
Race/Ethnicity
Race/Ethnicity Total in FitnessGram Obese
n % n %
White 107,185 24.4 12,541 11.7
African American 26,064 5.9 5,265 20.2
American Indian/Alaska Native
5,225 1.2 1,348 25.8
Asian 40,298 9.2 3,264 8.1
Filipino 11,980 2.7 1,713 14.3
Native Hawaiian/Pacific Islander
2,254 0.5 685 30.4
Multiracial 16,148 3.7 2,358 14.6
Hispanic/Latino 230,322 52.4 57,120 24.8
Healthy People 2020 Target
Performing better than
target

| 36
Obesity Prevalence among California 7th graders by Socioeconomic Status
Most (58.7 percent) 7th grade students in California’s public schools in 2014-2015 were economically disadvantaged. The prevalence of obesity among economically disadvantaged 7th grade students (23.9 percent) was more than double the rate among students from more advantaged households (11.9 percent).39
Figure 11. Prevalence of obesity among California 7th graders in public schools, by socioeconomic status, FitnessGram, 2014-2015 school year.
Table 17. Prevalence of obesity among California 7th graders in public schools, by socioeconomic status, FitnessGram, 2014-2015 school year.
Adolescent Obesity Prevalence from CHIS In 2014, CHIS found the overall prevalence of obesity among California adolescents ages 12-17 to be 14.6 percent (representing approximately 445,000 obese adolescents), below the Healthy People 2020 target for adolescents (≤ 16.1 percent).13,46 Since 2011, obesity among California adolescents has decreased slightly (from 15.3 percent to 14.6 percent).53
23.9
11.9
14.4
0.0
5.0
10.0
15.0
20.0
25.0
30.0
Economicallydisadvantaged
Not economicallydisadvantaged
No economicinformation
Per
cen
t O
bes
e
Socioeconomic Status
Socioeconomic Status Total in FitnessGram Obese
n % n %
Economically disadvantaged
258,165 58.7 61,701 23.9
Not economically disadvantaged
146,088 33.2 17,384 11.9
No economic information 35,223 8.0 5,072 14.4
Healthy People 2020 Target
Performing better than
target

| 37
Note: the measured obesity rates from FitnessGram appear to suggest a slightly higher obesity rate for California adolescents than the reported obesity rates from CHIS, although the FitnessGram result falls within the 95 percent confidence interval of the CHIS estimate. The estimates from the different datasets cannot be compared to one another, so must be considered separately.
Figure 12. Prevalence of Obesity Among California Adolescents, CHIS, 2011-2014
Table 18. Prevalence of Obesity Among California Adolescents, CHIS, 2011-2014
Year Percent Obese (95% CI)a
2011 15.3% (12.7, 17.9)
2012 15.3% (12.3, 18.4)
2013 14.4% (11.1, 17.8)
2014 14.6% (11.7, 17.6)
Notes: a95% CI = 95% Confidence Interval.
CHIS Adolescent obesity rates by age, sex, race/ethnicity, and socioeconomic status Due to small sample sizes in each year, CHIS data from 2011 through 2014 were pooled to obtain stable estimates for the adolescent obesity prevalence rates by age, sex, race/ethnicity, and socioeconomic status, as presented below.
0.0
4.0
8.0
12.0
16.0
20.0
2011 2012 2013 2014
Per
cen
t O
bes
e
Year
Healthy People 2020 Target
Performing better than
target

| 38
Obesity Prevalence among California Adolescents by Age Group
In 2011-2014, CHIS found prevalence rates of obesity among both adolescents 12 to 14 years old (15.5 percent) and those 15 to 17 years (14.4 percent) to be lower than the Healthy People 2020 target of ≤ 16.1 percent.13,53
Figure 13. Prevalence of Obesity Among Adolescents in California, by Age, CHIS, 2011-2014 (pooled)
Table 19. Prevalence of Obesity Among California Adolescents, by Age, CHIS, 2011-2014 (pooled)
Age (years)
Percent Obese (95% CI)a
12-14 15.5% (13.4, 17.6)
15-17 14.4% (12.4, 16.5)
Notes: a95% CI = 95% Confidence Interval.
Obesity Prevalence among California Adolescents by Sex
According to the CHIS data from 2011-2014, there was a wide disparity in adolescent obesity rates among males and females, with the rate for males being more than 50 percent higher than the rate for females.53 The prevalence of obesity among adolescent females in California (11.5 percent) was below the Healthy People 2020 obesity target, but the rate of obesity among adolescent males (18.2 percent) exceeded the target.13,53
15.514.4
0.0
5.0
10.0
15.0
20.0
12-14 15-17
Per
cen
t O
bes
e
Age (Years)
Healthy People 2020 Target
Performing better than
target

| 39
Figure 14. Prevalence of Obesity Among California Adolescents, by Sex, CHIS, 2011-2014 (pooled)
Table 20. Prevalence of Obesity Among California Adolescents, by Sex, CHIS, 2011-2014 (pooled)
Notes: a95% CI = 95% Confidence Interval. Obesity Prevalence among California Adolescents by Race/Ethnicity
CHIS found large disparities in adolescent obesity rates among adolescents from different ethnic groups. The prevalence of obesity among African American (22.5 percent) and Latino (20.2 percent) adolescents in 2011-2014 was more than 388 percent the rate for non-Latino Asian students (5.2 percent) and more than double the rate of non-Latino White students (9.2 percent).53 While the rates for African American and Latino adolescents did not meet the Healthy People 2020 targets, the rates for Whites and Asians fell well below the target.
18.2
11.5
0.0
5.0
10.0
15.0
20.0
Male Female
Per
cen
t O
bes
e
Sex
Sex Percent Obese (95% CI)a
Male 18.2% (15.9, 20.5)
Female 11.5% (9.6, 13.4)
Healthy People 2020 Target
Performing better than
target
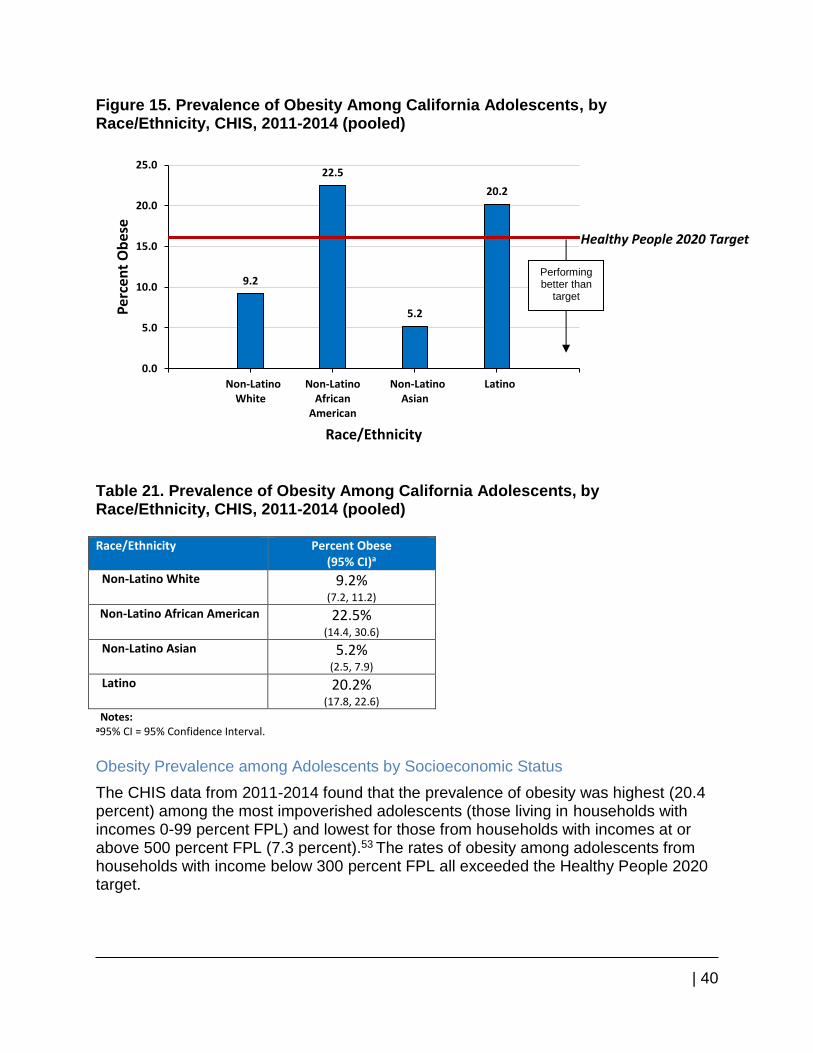
| 40
Figure 15. Prevalence of Obesity Among California Adolescents, by Race/Ethnicity, CHIS, 2011-2014 (pooled)
Table 21. Prevalence of Obesity Among California Adolescents, by Race/Ethnicity, CHIS, 2011-2014 (pooled) Race/Ethnicity Percent Obese
(95% CI)a
Non-Latino White 9.2% (7.2, 11.2)
Non-Latino African American 22.5% (14.4, 30.6)
Non-Latino Asian 5.2% (2.5, 7.9)
Latino 20.2% (17.8, 22.6)
Notes: a95% CI = 95% Confidence Interval.
Obesity Prevalence among Adolescents by Socioeconomic Status
The CHIS data from 2011-2014 found that the prevalence of obesity was highest (20.4 percent) among the most impoverished adolescents (those living in households with incomes 0-99 percent FPL) and lowest for those from households with incomes at or above 500 percent FPL (7.3 percent).53 The rates of obesity among adolescents from households with income below 300 percent FPL all exceeded the Healthy People 2020 target.
9.2
22.5
5.2
20.2
0.0
5.0
10.0
15.0
20.0
25.0
Non-LatinoWhite
Non-LatinoAfrican
American
Non-LatinoAsian
Latino
Per
cen
t O
bes
e
Race/Ethnicity
Healthy People 2020 Target
Performing better than
target

| 41
Figure 16. Prevalence of Obesity Among California Adolescents, by Household Poverty Level, CHIS, 2011-2014 (pooled)
Table 22. Prevalence of Obesity Among California Adolescents, by Household Poverty Level, CHIS, 2011-2014 (pooled)
Notes: a95% CI = 95% Confidence Interval.
Child Obesity Prevalence and Trends
The next section presents obesity prevalence rates among California children. First, obesity rates are presented from the FitnessGram assessment, conducted among 5th
20.4
17.3
19.6
12.7
9.8
7.3
0.0
5.0
10.0
15.0
20.0
25.0
0-99 100-199 200-299 300-399 400-499 500+
Per
cen
t O
bes
e
Household Percent Federal Poverty Level
Household Percent Federal Poverty Level
Percent Obese (95% CI)a
0-99 20.4% (17.2, 23.7)
100-199 17.3% (14.0, 20.5)
200-299 19.6% (13.7, 25.4)
300-399 12.7% (8.8 ,16.6)
400-499 9.8% (6.2, 13.3)
500+ 7.3% (5.4, 9.3)
Healthy People 2020 Target
Performing better than
target

| 42
grade students in California public schools. Following the FitnessGram results, overweight-for-age prevalence rates from CHIS are presented. The strength of the FitnessGram data is that it provides measured heights and weights for the population of 5th grade California students; however, it is limited in that it only measures students in one grade. CHIS is limited in that it provides only self-reported weight data for a sample of children, and does not include height data; thus, BMI cannot be computed and only weight-for-age is available. While the weight status measure provided by CHIS is quite limited, the strength of CHIS is that it provides estimates for a representative sample of children across the entire 2-11 year age range. While the findings from the two different methodologies cannot be compared to each other, given the differences in sampling, measurement, and time periods, each is useful for exploring trends over time. For this report, only the overall CHIS child overweight-for-age data can be viewed across time, due to small sample sizes for subgroups annually. FitnessGram only recently began to publicly report obesity and overweight data in accordance with the CDC growth chart definitions; thus, for this report only the most recent data (school year 2014-2015) is presented.
Child Obesity Prevalence from FitnessGram
Obesity Prevalence among California 5th graders, Overall and by Sex
In the 2014-2015 school year, 20.9 percent of 5th graders in California were obese.39 Boys had a higher obesity prevalence than girls (23.8 percent and 18.1 percent, respectively).
Figure 17. Prevalence of obesity among California 5th graders in public schools, overall and by sex, FitnessGram, 2014-2015 school year.
20.9
18.1
23.8
0.0
5.0
10.0
15.0
20.0
25.0
All Female Male
Pe
rce
nt
Ob
ese Healthy People 2020 Target
Performing better than
target

| 43
Table 23. Prevalence of obesity among California 5th graders in public schools, overall and by sex, FitnessGram, 2014-2015 school year.
Total in FitnessGram Obese
n % n %
All 455,897 100.0 95,282 20.9
Female 222,627 48.8 40,295 18.1
Male 233,270 51.2 55,518 23.8
Obesity Prevalence among California 5th graders by Race/Ethnicity Most California 5th grade students in 2014-15 identified as Hispanic/Latino. This group had high rates of obesity (27.4 percent). Asian and White 5th graders had the lowest rates of obesity (10.1 percent and 12.0 percent, respectively); while the relatively small group of Native Hawaiian/Pacific Islanders had the highest rates (34.2 percent).39
Figure 18. Prevalence of obesity among California 5th graders in public schools, by race/ethnicity, FitnessGram, 2014-2015 school year.
12.0
21.5
25.7
10.1
16.8
34.2
15.1
27.4
0.0
5.0
10.0
15.0
20.0
25.0
30.0
35.0
40.0
Per
cen
t O
bes
e
Race/Ethnicity
Healthy People 2020 Target
Performing better than
target

| 44
Table 24. Prevalence of obesity among California 5th graders in public schools, by race/ethnicity, FitnessGram, 2014-2015 school year.
Obesity Prevalence among California 5th graders by Socioeconomic Status Most (59.6 percent) 5th grade students in California public schools in 2014-15 were from economically disadvantaged households. The prevalence of obesity among 5th graders from economically disadvantaged households (26.4 percent) was more than double the rate of students from more advantaged households (12.6 percent).39
Figure 19. Prevalence of obesity among California 5th graders in public schools, by socioeconomic status, FitnessGram, 2014-2015 school year.
26.4
12.6
15.4
0.0
5.0
10.0
15.0
20.0
25.0
30.0
Economicallydisadvantaged
Not economicallydisadvantaged
No economicinformation
Per
cen
t O
bes
e
Socioeconomic Status
Race/Ethnicity Total in FitnessGram Obese
n % n %
White 111,346 24.4 13,362 12.0
African American 26,377 5.8 5,671 21.5
American Indian/Alaska Native
5,177 1.1 1,330 25.7
Asian 42,059 9.2 4,248 10.1
Filipino 11,206 2.5 1,883 16.8
Native Hawaiian/Pacific Islander
2,339 0.5 800 34.2
Multiracial 18,511 4.1 2,795 15.1
Hispanic/Latino 238,882 52.4 65,454 27.4
Healthy People 2020 Target
Performing better than
target

| 45
Table 25. Prevalence of obesity among California 5th graders in public schools, by socioeconomic status, FitnessGram, 2014-2015 school year.
Socioeconomic Status Total in FitnessGram Obese
n % n %
Economically disadvantaged
271,614 59.6 71,706 26.4
Not economically disadvantaged
149,724 32.8 18,865 12.6
No economic information 34,461 7.6 5,307 15.4
Child Overweight-for-Age Prevalence from CHIS The CHIS overweight-for-age measure is very limited, as it simply describes whether a child is heavy for his or her age, without taking the child’s height into consideration. However, these data are still useful for examining trends over time. In 2014, CHIS found that 15.0 percent of California children 2 to 11 years, numbering approximately 708,000 children, were overweight-for-age.46 Overweight-for-age decreased slightly from 2011 to 2013, but increased from 2013 to 2014.53 Overweight-for-age estimates cannot be compared to Healthy People 2020 targets, because those targets are based upon BMI measures, which consider weight in relation to height.
Figure 20. Prevalence of Overweight-for-age Among California Children, CHIS, 2011-2014
0.0
4.0
8.0
12.0
16.0
20.0
2011 2012 2013 2014
Per
cen
t O
verw
eigh
t-fo
r-ag
e
Year

| 46
Table 26. Prevalence of Overweight-for-age Among California Children, CHIS, 2011-2014
Year Percent Overweight-for-age (95% CI)a
2011 14.4% (12.0, 16.8)
2012 11.6% (9.5, 13.7)
2013 12.2% (9.6, 14.8)
2014 15.0% (11.7, 18.3)
Notes: a95% CI = 95% Confidence Interval.
CHIS Adolescent obesity rates by age, sex, race/ethnicity, and socioeconomic status Due to small sample sizes in each year, CHIS data from 2011 through 2014 were pooled to obtain stable estimates for the child overweight-for-age prevalence rates by age, sex, race/ethnicity, and socioeconomic status, as presented below.
Overweight-for-Age Prevalence among California Children by Age Group
In 2011-2014, the prevalence of overweight-for-age among children was similar for young children 2-5 years and older children 6-11 years; 12.4 and 13.9 percent respectively.53
Figure 21. Prevalence of Overweight-for-age Among Children in California, by Age, CHIS, 2011-2014 (pooled)
12.4
13.9
0.0
5.0
10.0
15.0
20.0
2-5 6-11
Per
cen
t O
verw
eigh
t-fo
r-A
ge
Age (Years)

| 47
Table 27. Prevalence of Overweight-for-age Among California Children, by Age, CHIS, 2011-2014 (pooled) Age (Years)
Percent Overweight-for-age (95% CI)a
2-5 12.4% (10.3, 14.6)
6-11 13.9% (12.2, 15.6)
Notes: a95% CI = 95% Confidence Interval.
Overweight-for-age Prevalence among California Children by Sex
In 2011-2014, the prevalence of overweight-for-age was 14.9 percent of boys and 11.6 percent for girls.53
Figure 22. Prevalence of Overweight-for-age Among Children in California, by Sex, CHIS, 2011-2014 (pooled)
Table 28. Prevalence of Overweight-for-age Among California Children, by Sex, CHIS, 2011-2014 (pooled) Sex Percent Overweight-for-age
(95% CI)a
Male 14.9% (13.0, 16.9)
Female 11.6% (9.7, 13.5)
Notes: a95% CI = 95% Confidence Interval.
14.9
11.6
0.0
5.0
10.0
15.0
20.0
Male Female
Per
cen
t O
verw
eigh
t-fo
r-A
ge
Sex

| 48
Overweight-for-Age Prevalence among California Children by Race/Ethnicity
In 2011-2014, the prevalence of overweight-for-age among California children was higher among African Americans (19.7 percent) and Latinos (16.2 percent) than among Whites (8.5 percent).53 Estimates are not reported for Non-Latino Asian children as sample sizes were too small to calculate a statistically stable estimate for this group.
Figure 23. Prevalence of Overweight-for-age Among California Children, by Race/Ethnicity, CHIS, 2011-2014 (pooled)
Table 29. Prevalence of Overweight-for-age Among California Children, by Race/Ethnicity, CHIS, 2011-2014 (pooled) Race/Ethnicity
Percent Overweight-for-age
(95% CI)a
Non-Latino White 8.5% (6.8, 10.3)
Non-Latino African American
19.7% (13.0, 26.4)
Non-Latino Asian N/Ab
Latino 16.2% (14.2, 18.2)
Notes: a95% CI = 95% Confidence Interval. bStatistically unstable
Overweight-for-age Prevalence among California Children by Socioeconomic Status
For the period 2011-2014, the prevalence rates of obesity for children aged 2-11 years increased as household income decreased. Obesity prevalence was 19.0 percent among children from the lowest income households compared with 7.8 percent among those from highest income households.53
8.5
19.7
16.2
0.0
5.0
10.0
15.0
20.0
25.0
Non-Latino White Non-Latino AfricanAmerican
Latino
Per
cen
t O
verw
eigh
t-fo
r-A
ge
Race/Ethnicity

| 49
Figure 24. Prevalence of Overweight-for-age Among California Children, by Household Poverty Level, CHIS, 2011-2014 (pooled)
Table 30. Prevalence of Overweight-for-Age Among California Children, by Household Poverty Level, CHIS, 2011-2014 (pooled)
Notes: a95% CI = 95% Confidence Interval.
Champions for Healthy Change (C4HC) - a recent snapshot of obesity prevalence in a SNAP-Eligible population in California
Champions for Healthy Change (C4HC) is an on-going study of the impact of SNAP-Ed in California. While this dataset does not provide data that is generalizable statewide, it
19.0
15.8
10.3 10.8
7.4 7.8
0.0
5.0
10.0
15.0
20.0
0-99 100-199 200-299 300-399 400-499 500+
Per
cen
t O
verw
eigh
t-fo
r-A
ge
Household Percent Federal Poverty Level
Household Percent Federal Poverty Level
Percent Overweight-for-age (95% CI)a
0-99 19.0% (15.7, 22.4)
100-199 15.8% (13.0, 18.7)
200-299 10.3% (7.6, 13.1)
300-399 10.8% (6.5, 15.2)
400-499 7.4% (5.1, 9.7)
500+ 7.8% (6.0 ,9.5)

| 50
does provide a unique opportunity to assess obesity prevalence in a select population of low-income, SNAP-eligible mothers, adolescents, and children sampled from 17 counties in California (Appendix Table 1). Estimates are not intended for use as population prevalence rates, as the C4HC sample was not constructed to be representative of the state of California.
Obesity Prevalence among Low-Income Mothers in C4HC In 2014, the prevalence of obesity among low-income mothers in the C4HC sample was 48.0 percent. Within the C4HC sample of low-income women, no ethnic group met the Healthy People 2020 target, and all groups had very high obesity rates, though the rates were moderately higher among African American and Latina mothers compared to non-Latina White mothers.
Figure 25. Prevalence of Obesity Among Low-income Mothers in 17 Counties in CA, by Race/Ethnicity, C4HC, 2014
Table 31. Prevalence of Obesity Among Low-Income Mothers in 17 Counties in CA, by Race/Ethnicity, C4HC, 2014
Race/Ethnicity Obese (%)
All Race/Ethnicities 48.0%
Non-Latina White 44.8%
Non-Latina African American 52.7%
Latina 49.4%
48.044.8
52.749.4
0.0
10.0
20.0
30.0
40.0
50.0
60.0
Per
cen
t O
bes
e
Race/Ethnicity

| 51
Obesity Prevalence among Low-Income Adolescents in C4HC
The prevalence of obesity among low-income adolescents in the C4HC sample in 2014 (21.3 percent) exceeded the Healthy People 2020 target. Non-Latino African American adolescents had the highest obesity prevalence (23.2 percent), but the obesity rates for Non-Latino White and Latino adolescents (18.2 percent and 21.9 percent, respectively) also were above the target.
Figure 26. Prevalence of Obesity Among Low-income Adolescents in 17 Counties in CA, by Race/Ethnicity, C4HC, 2014
Table 32. Prevalence of Obesity Among Low-Income Adolescents in 17 Counties in CA, by Race/Ethnicity, C4HC, 2014
Race/Ethnicity Obese (%)
All Race/Ethnicities 21.3%
Non-Latino White 18.2%
Non-Latino African American 23.2%
Latino 21.9%
Obesity Prevalence among Low-Income Children in C4HC
In 2014, the prevalence of obesity among children 6-11 years in the C4HC sample was 31.9 percent, far exceeding the Healthy People 2020 target of ≤ 15.7 percent. Although obesity was highest among Latino children in this sample (35.3 percent), the rates for African American children (32.0 percent) and for White children (25.2 percent) also were higher than the target for this age group.
21.3
18.2
23.221.9
0.0
5.0
10.0
15.0
20.0
25.0
AllRace/Ethnicities
Non-LatinoWhite
Non-LatinoAfrican
American
Latino
Per
cen
t O
bes
e
Race/Ethnicity
Healthy People 2020 Target
Performing better than
target

| 52
Figure 27. Prevalence of Obesity Among Low-income Older Children in 17 Counties in CA, by Race/Ethnicity, C4HC, 2014
Table 33. Prevalence of Obesity Among Low-Income Older Children in 17 Counties in CA, by Race/Ethnicity, C4HC, 2014
Race/Ethnicity Obese (%)
All Race/Ethnicities 31.9%
Non-Latino White 25.2%
Non-Latino African American 32.0%
Latino 35.3%
Health Consequences and Costs of Obesity Obesity poses a major public health challenge; it increases the risk for many health conditions (Table 34) and contributes to some of the leading causes of preventable death.54,55 The cost of obesity is substantial and is likely to increase significantly over time as the rates of obesity and related health conditions rise (Figure 28).46, 54 These health conditions, among adults, represent 20 percent of the total annual medical expenses in the United States, or about $190.2 billion annually.56 Each year, the
31.9
25.2
32.0
35.3
0.0
5.0
10.0
15.0
20.0
25.0
30.0
35.0
40.0
Per
cen
t O
bes
e
Race/Ethnicity
Healthy People 2020 Target
Performing better than
target

| 53
medical expenses per person among obese adults are estimated to be $1,429 higher than the medical expenses of normal weight adults.57
Table 34. Obesity-Related Health Conditions Obesity-Related Health Conditions54
Coronary heart disease, stroke, and high blood pressure
Type 2 diabetes
Cancers, such as endometrial, breast, and colon cancer
High total cholesterol or high levels of triglycerides
Liver and gallbladder disease
Sleep apnea and respiratory problems
Degeneration of cartilage and underlying bone within a joint
Reproductive health complications such as infertility
Mental health conditions
According to data from the California Office of Statewide Health Planning and Development (OSHPD), hospital charges for obesity-related conditions, and other consequences of obesity, have increased by 39.7 percent between 2005 and 2014 (Figure 28).58 In 2014, obesity-related cardiovascular disease (CVD) costs accounted for the largest proportion of total obesity-related hospital charges, at $12.8 billion (Figure 28). In comparison, the hospital charges for obesity-related diabetes and obesity-related cancer were $3.0 billion and $2.7 billion, respectively. In 2014, there were nearly half a million hospital admissions due to obesity-related conditions in California, costing $36.2 billion in hospital charges (Table 35). Furthermore, $7.8 billion (21.6 percent) of those charges were paid by California’s Medi-Cal system. (Table 36).

| 54
Figure 28. Obesity-Related Inpatient Hospital Charges in California, Totala, and by Condition, OSHPD, 2005-2014 DO NOT USE THIS FIGURE- THE ONE YOU HAVE ALREADY IS BETTER DO NOT REPLACE IT
Notes: aTotal obesity-related inpatient hospital charges
Table 35. Obesity-Related Inpatient Hospital Charges in California, Totala, and by Condition, OSHPD, 2014b
Obesity-Related Condition
Number of Admissions
Hospital Charges, Billions
Cardiovascular disease 138,937 $12.8
Diabetes 54,251 $3.0
Cancer 28,160 $2.7
Totala 426,529 $36.2 Notes: aTotal obesity-related inpatient hospital charges bThis table was generated using a list of obesity-related ICD codes published elsewhere.59
Table 36. Medi-Cal Obesity-Related Inpatient Hospital Charges in California, by Condition and Percent of All Payers, OSHPD, 2014a
Obesity Associated Conditions
Number of Admissions
(n (%))
Hospital Charges, Billions
Cardiovascular disease 26,855 (19.3%) $2.7 (21.1%)
Diabetes 21,213 (39.1%) $1.0 (36.7%)
Cancer 4,912 (17.4%) $0.5 (17.0%)
Totalb 90,018 (21.1%) $7.8(21.6%) Notes: aThis table was generated using a list of obesity-related ICD codes published elsewhere.59
0.0
5.0
10.0
15.0
20.0
25.0
30.0
35.0
40.0
2005 2010 2012 2014
Ho
spit
al C
har
ges
(Bill
ion
Do
llar
s)
Year Total CVD Diabetes Cancer
| 55
bTotal Medi-Cal obesity-related inpatient hospital charges
Conclusion California continues to face disparities in population obesity. While some subgroups appear to meet the Healthy People 2020 targets, others greatly exceed them. Generally, it is the poorest Californians who experience the highest rates of obesity, as well as groups of color, particularly Latino and African American adults and Latino, African American, Native Hawaiian/Pacific Islander, and American Indian/Alaska Native children. Obesity presents high costs to individuals. It also challenges the State’s finances due to lost productivity, as well as direct medical costs. Addressing the main drivers of obesity by making it easier for people to eat well and be physically active, could improve quality of life, enhance worker productivity, and save the State money. One model suggests that if adult BMI were reduced by as little as 5 percent, California could potentially save $81.7 billion in obesity-related health care costs by 2030.60

| 56
References 1. Flegal KM, Kruszon-Moran D, Carroll MD, Fryar CD, Ogden CL. Trends in
Obesity Among Adults in the United States, 2005 to 2014. Journal of the American Medical Association. Jun 7 2016;315(21):2284-2291.
2. Ogden CL, Carroll MD, Lawman HG, et al. Trends in Obesity Prevalence Among Children and Adolescents in the United States, 1988-1994 Through 2013-2014. Journal of the American Medical Association. Jun 7 2016;315(21):2292-2299.
3. Ogden CL, Carroll MD, Fryar CD, Flegal KM. Prevalence of obesity among adults and youth: United States, 2011–2014. NCHS data brief, no 219. Hyattsville, MD: National Center for Health Statistics. 2015.
4. Krueger PM, Reither EN. Mind the Gap: Race/Ethnic and Socioeconomic Disparities in Obesity. Current diabetes reports. 2015 Nov 1;15(11):1-9.
5. Trust for America’s Health, Foundation RWJ. State of Obesity: 2016. http://stateofobesity.org/files/stateofobesity2016.pdf. Accessed October 26, 2016.
6. Guh DP, Zhang W, Bansback N, Amarsi Z, Birmingham CL, Anis AH. The incidence of co-morbidities related to obesity and overweight: a systematic review and meta-analysis. BMC public health. 2009 Mar 25;9(1):1.
7. Emerging Risk Factors Collaboration. Separate and combined associations of body-mass index and abdominal adiposity with cardiovascular disease: collaborative analysis of 58 prospective studies. The Lancet. 2011 Apr 1;377(9771):1085-95.
8. Renehan AG, Tyson M, Egger M, Heller RF, Zwahlen M. Body-mass index and incidence of cancer: a systematic review and meta-analysis of prospective observational studies. The Lancet. 2008 Feb 22;371(9612):569-78.
9. Adams KF, Schatzkin A, Harris TB, Kipnis V, Mouw T, Ballard-Barbash R, Hollenbeck A, Leitzmann MF. Overweight, obesity, and mortality in a large prospective cohort of persons 50 to 71 years old. New England Journal of Medicine. 2006 Aug 24;355(8):763-78.
10. Tsai AG, Williamson DF, Glick HA. Direct medical cost of overweight and obesity in the USA: a quantitative systematic review. Obesity Reviews. 2011 Jan 1;12(1):50-61.
11. Andreyeva T, Luedicke J, Wang YC. State-level estimates of obesity-attributable costs of absenteeism. Journal of occupational and environmental medicine/American College of Occupational and Environmental Medicine. 2014 Nov;56(11):1120-7.
12. Hammond RA, Levine R. The economic impact of obesity in the United States. Journal of Diabetes, Metabolic Syndrome, and Obesity. 2010 Aug 30;3(1):285-95.
13. United States Department of Health and Human Services. Healthy People 2020, Topics and Objectives.

| 57
http://www.healthypeople.gov/2020/topicsobjectives2020/default.aspx. Accessed October 24, 2016.
14. Centers for Disease Control and Prevention, National Center for Health Statistics. Clincal Growth Charts. http://www.cdc.gov/growthcharts/clinical_charts.htm. Accessed July 13, 2016.
15. California Department of Public Health Obesity Prevention Program. California Obesity Prevention Plan: A Vision for Tomorrow, Strategic Actions for Today. 2010.
16. Malik VS, Pan A, Willett WC, Hu FB. Sugar-sweetened beverages and weight gain in children and adults: a systematic review and meta-analysis. The American Journal of Clinical Nutrition. 2013 Oct 1;98(4):1084-102.
17. Bahadoran Z, Mirmiran P, Azizi F. Fast Food Pattern and Cardiometabolic Disorders: A Review of Current Studies. Health Promotion Perspectives. 2015;5(4):231.
18. Duffey KJ, Steffen LM, Van Horn L, Jacobs DR, Popkin BM. Dietary patterns matter: diet beverages and cardiometabolic risks in the longitudinal Coronary Artery Risk Development in Young Adults (CARDIA) Study. The American Journal of Clinical Nutrition. 2012 Apr 1;95(4):909-15.
19. Mameli C, Mazzantini S, Zuccotti GV. Nutrition in the First 1000 Days: The Origin of Childhood Obesity. International Journal of Environmental Research and Public Health. 2016 Aug 23;13(9):838.
20. Bertoia ML, Mukamal KJ, Cahill LE, Hou T, Ludwig DS, Mozaffarian D, Willett WC, Hu FB, Rimm EB. Changes in intake of fruits and vegetables and weight change in United States men and women followed for up to 24 years: analysis from three prospective cohort studies. PLoS Medicine. 2015 Sep 22;12(9):e1001878.
21. Wareham NJ, van Sluijs EM, Ekelund U. Physical activity and obesity prevention: a review of the current evidence. Proceedings of the Nutrition Society. 2005 May 1;64(02):229-47.
22. Seo DC, Li K. Leisure-time physical activity dose response effects on obesity among US adults: results from the 1999–2006 National Health and Nutrition Examination Survey. Journal of Epidemiology and Community Health. 2010 May 1;64(5):426-31.
23. Azevedo LB, Ling J, Soos I, Robalino S, Ells L. The effectiveness of sedentary behaviour interventions for reducing body mass index in children and adolescents: systematic review and meta‐analysis. Obesity Reviews. 2016 Jul 1;17(7):623-35.
24. Blanck HM, McCullough ML, Patel AV, Gillespie C, Calle EE, Cokkinides VE, Galuska DA, Khan LK, Serdula MK. Sedentary Behavior, Recreational Physical Activity, and 7‐Year Weight Gain among Postmenopausal US Women. Obesity. 2007 Jun 1;15(6):1578-88.
25. Economos CD, Hatfield DP, King AC, Ayala GX, Pentz MA. Food and physical activity environments: An energy balance approach for research and practice. American Journal of Preventive Medicine. 2015 May 31;48(5):620-9.
26. Novak NL, Brownell KD. Obesity: a public health approach. Psychiatric Clinics of North America. 2011 Dec 31;34(4):895-909.

| 58
27. California Center for Public Health Advocacy, PolicyLink, UCLA Center for Health Policy Research. Designed for Disease: The Link Between Local Food Environments and Obesity and Diabetes. 2008. http://healthpolicy.ucla.edu/publications/Documents/PDF/Designed%20for%20Disease%20The%20Link%20Between%20Local%20Food%20Environments%20and%20Obesity%20and%20Diabetes.pdf. Accessed October 24, 2016.
28. Hawkes C, Smith TG, Jewell J, Wardle J, Hammond RA, Friel S, Thow AM, Kain J. Smart food policies for obesity prevention. The Lancet. 2015 Jun 19;385(9985):2410-21.
29. Ello-Martin JA, Ledikwe JH, Rolls BJ. The influence of food portion size and energy density on energy intake: implications for weight management. The American Journal of Clinical Nutrition. 2005 Jul 1;82(1):236S-41S.
30. Rolls, Barbara J., Liane S. Roe, and Jennifer S. Meengs. "The effect of large portion sizes on energy intake is sustained for 11 days." Obesity 15.6 (2007): 1535-1543.
31. Carver A, Timperio A, Crawford D. Playing it safe: The influence of neighbourhood safety on children's physical activity—A review. Health & Place. 2008 Jun 30;14(2):217-27.
32. Molnar BE, Gortmaker SL, Bull FC, Buka SL. Unsafe to play? Neighborhood disorder and lack of safety predict reduced physical activity among urban children and adolescents. American Journal of Health Promotion. 2004 May 1;18(5):378-86.
33. Mailey EL, Huberty J, Dinkel D, McAuley E. Physical activity barriers and facilitators among working mothers and fathers. BMC Public Health. 2014 Jun 27;14(1):1.
34. Parsons TJ, Manor O, Power C. Television viewing and obesity: a prospective study in the 1958 British birth cohort. European Journal of Clinical Nutrition. 2008 Dec 1;62(12):1355-63.
35. Landhuis CE, Poulton R, Welch D, Hancox RJ. Programming Obesity and Poor Fitness: The Long‐term Impact of Childhood Television. Obesity. 2008 Jun 1;16(6):1457-9.
36. UCLA Center for Health Policy Research. CHIS Making and Impact - 2015. http://healthpolicy.ucla.edu/chis/about/Documents/CHISImpactFS2015.pdf. Accessed October 10, 2016.
37. UCLA Center for Health Policy Research. CHIS 2013-2014 Sample Design. http://healthpolicy.ucla.edu/chis/design/Documents/sample_desc_2013.pdf. Accessed October 10, 2016.
38. Weden MM, Brownell PB, Rendall MS, Lau C, Fernandes M, Nazarov Z. Parent-reported height and weight as sources of bias in survey estimates of childhood obesity. American Journal of Epidemiology. 2013 Aug 1;178(3):461-73.
39. California Department of Education. Physical Fitness Test Results. http://data1.cde.ca.gov/dataquest/PhysFitness/PFTDN/Summary2011.aspx?r=0&t=4&y=2014-15&c=00000000000000&n=0000. Accessed October 25, 2016.
40. Nutrition, Physical Activity and Obesity Data, Trends and Maps web site. U.S. Department of Health and Human Services, Centers for Disease Control and Prevention (CDC), National Center for Chronic Disease Prevention and Health

| 59
Promotion, Division of Nutrition, Physical Activity and Obesity, Atlanta, GA, 2015. Available at http://www.cdc.gov/nccdphp/DNPAO/index.html.
41. Centers for Disease Control and Prevention: Behavioral Risk Factor Surveillance System. http://www.cdc.gov/brfss.
42. Eidelman AI, Schanler RJ, Johnston M, et al. Breastfeeding and the use of human milk. Pediatrics. 2012;129(3):e827-e841.
43. Council on Communications and Media. Children, Adolescents, and the Media. Pediatrics. 2013. http://pediatrics.aappublications.org/content/early/2013/10/24/peds.2013-2656.abstract. Accessed October 24, 2016.
44. U.S. Department of Agriculture and U.S. Department of Health and Human Services. Dietary Guidlines for Americans, 2015-2020. Washington, D.C.: U.S. Government Printing Office;2015.
45. United States Department of Health and Human Services. Physical Activity Guidelines for Americans, 2008. Washington D.C.: United States Department of Health and Human Services;2008.
46. University of California Los Angeles, Center for Health Policy Research. California Health Interview Survey 2014. 2014; http://ask.chis.ucla.edu/main/default.asp. Accessed October 24, 2016.
47. California Department of Public Health, Nutrition Education and Obesity Prevention Branch. Behavior Risk Factor Surveillance System 2013.
48. American Academy of Pediatrics. Media and Young Minds Council on Communications and Media. Pediatrics. 2016. http://pediatrics.aappublications.org/content/138/5/e20162591. Accessed November 29, 2016.
49. Suglia SF, Shelton RC, Hsiao A, Wang YC, Rundle A, Link BG. Why the Neighborhood Social Environment Is Critical in Obesity Prevention. Journal of Urban Health. 2016 Feb 1;93(1):206-12.
50. University of California Los Angeles, Center for Health Policy Research. California Health Interview Survey 2001-2014. 2001-2014; http://ask.chis.ucla.edu/main/default.asp. Accessed October 26, 2016.
51. University of California Los Angeles, Center for Health Policy Research. California Health Interview Survey 2013-2014. 2013-2014; http://ask.chis.ucla.edu/main/default.asp. Accessed October 26, 2016.
52. University of California Los Angeles, Center for Health Policy Research. California Health Interview Survey 2001. 2001; http://ask.chis.ucla.edu/main/default.asp. Accessed October 26, 2016.
53. University of California Los Angeles, Center for Health Policy Research. California Health Interview Survey 2011-2014. 2011-2014; http://ask.chis.ucla.edu/main/default.asp. Accessed October 26, 2016.
54. Centers for Disease Control and Prevention. Obesity: Halting the epidemic by making health easier. Atlanta, Georgia: Centers for Disease Control and Prevention;2011.
55. National Center for Health Statistics. Health, United States, 2012 (Table 20). Centers for Disease Control and Prevention; 2013: http://www.cdc.gov/nchs/data/hus/hus12.pdf. Accessed December 5, 2013.

| 60
56. Cawley J, Meyerhoefer C. The medical care costs of obesity: an instrumental variables approach. Journal of Health Economics. Jan 2012;31(1):219-230.
57. Finkelstein EA, Trogdon JG, Cohen JW, Dietz W. Annual medical spending attributable to obesity: payer-and service-specific estimates. Health Affairs (Project Hope). Sep-Oct 2009;28(5):w822-831.
58. California Department of Public Health, Nutrition Education and Obesity Prevention Branch. Office of Statewide Health Planning and Development 2005-2014.
59. Chenoweth D. The Economic Costs of Physical Inactivity, Obesity, and Overweight in California Adults During the Year 2000: A Technical Analysis (Table 3). Sacramento, CA: California Department of Health Services;2005.
60. Trust for America’s Health, Foundation RWJ. F as in Fat: How Obesity threatens America's Future. Washingtion, DC, 2012.

| 61
Appendix A. Supplementary Information
Appendix Table 1. List of the 17 Counties in California Included in the C4HC Sample, 2014
Appendix Table 2. Sample Sizes of Included Data Sources.
Data Source Year Population Sample Size
CHIS 2014 Adults 19,516
CHIS 2014 Adolescents 1,052
CHIS 2014 Children 2,592
FitnessGram 2013-2014 9th grade students 441,730
FitnessGram 2013-2014 7th grade students 439,476
FitnessGram 2013-2014 5th grade students 455,897
C4HC 2014 Low-income mothers
5,684
C4HC 2014 Low-income adolescents
1,613
C4HC 2014 Low-income children
1,319
National Immunization Survey
2012 births Infants 331-335
BRFSS 2013 Adults 10,004
County
Alameda
Contra Costa
Fresno
Kern
Los Angeles
Orange
Riverside
Sacramento
San Bernardino
San Diego
San Joaquin
Santa Clara
Shasta
Solano
Sonoma
Tulare
Ventura