object-oriented analysis and design prof. partha pratim ... · so if you look into the overall...
TRANSCRIPT
Object-Oriented Analysis and DesignProf. Partha Pratim Das
Department of Computer Science and EngineeringIndian Institute of Technology-Kharagpur
Lecture – 51Various UML Diagrams
Welcome to module 39 of object-oriented analysis and design. Over the several modules, past modules,
we have discussed in length about uml diagrams and we have discussed about variety of structures as
well as behavioral diagrams.
(Refer Slide Time: 00:49)
Now in this module we will quickly familiarize with you with a number of other uml diagrams which
has been left out, we do not have enough time to really go to each one of them at length. So I would
just briefly familiarize you and leave it to you to read about them later and that should complete the
discussion on uml diagrams.
(Refer Slide Time: 01:10)

So the five diagrams that you would like to talk of, one belongs to the behavioral type and four belong
to the structural type which will form the outline of this discussion.
(Refer Slide Time: 01:21)
So just to remind you the structural diagrams of the uml, so the structure of the system and parts of
different abstractions at a level and a behavioral diagrams show the dynamic behavior basically
showing you how does a system behave over a time.
(Refer Slide Time: 01:45)
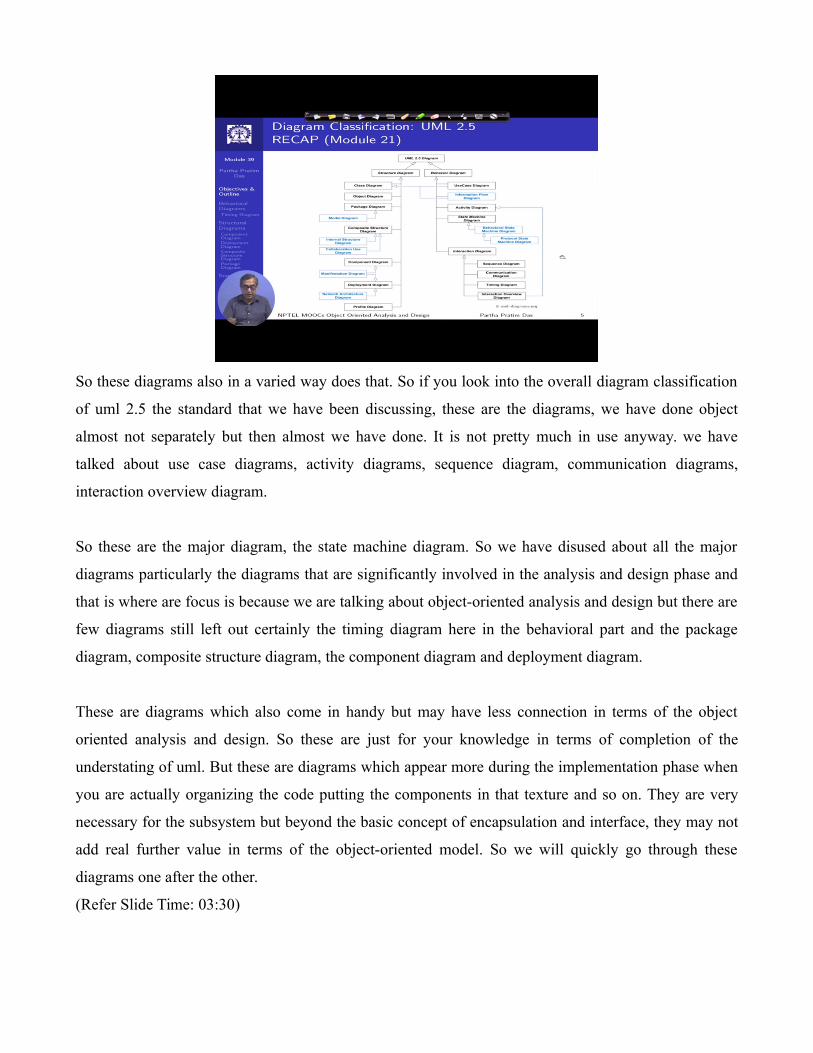
So these diagrams also in a varied way does that. So if you look into the overall diagram classification
of uml 2.5 the standard that we have been discussing, these are the diagrams, we have done object
almost not separately but then almost we have done. It is not pretty much in use anyway. we have
talked about use case diagrams, activity diagrams, sequence diagram, communication diagrams,
interaction overview diagram.
So these are the major diagram, the state machine diagram. So we have disused about all the major
diagrams particularly the diagrams that are significantly involved in the analysis and design phase and
that is where are focus is because we are talking about object-oriented analysis and design but there are
few diagrams still left out certainly the timing diagram here in the behavioral part and the package
diagram, composite structure diagram, the component diagram and deployment diagram.
These are diagrams which also come in handy but may have less connection in terms of the object
oriented analysis and design. So these are just for your knowledge in terms of completion of the
understating of uml. But these are diagrams which appear more during the implementation phase when
you are actually organizing the code putting the components in that texture and so on. They are very
necessary for the subsystem but beyond the basic concept of encapsulation and interface, they may not
add real further value in terms of the object-oriented model. So we will quickly go through these
diagrams one after the other.
(Refer Slide Time: 03:30)

The timing diagram as I said is a is a behavioral diagram and actually the timing diagram is a like you
saw in the state machine diagram you saw a state machine diagram is a generalization of the finance
state machine modules that we use in automata and switching theory and different other places. So
timing diagrams are also generalizations of the typical timing displays that we have seen for different
hardware descriptions?
The only difference is that the timing diagrams here is not necessarily meant only for the hardware
systems or only for the electronic systems. They are also meant for different software descriptions.
They primarily arise in the analysis phase and refine in the design phase and naturally you can
understand that since we are talking about time, lifeline would be major part of this diagram. Then you
have different kinds of durations and time constraint and so on.
(Refer Slide Time: 04:32)

So let me just take a take an example and quickly walk you through that. So this is kind of this is very
simple scenario being shown here which is in terms of trying to access a particular url. So you will see
that this is a web user, web browser, there is a DNS resolver, there is a web server and this is this
happens in 4 different streamlines. these are the concurrent timelines. so these are the lifelines this the
lifeline these are all different lifelines.
So these are all concurrent lifelines happening each one will go on having its own timing diagram and
they interact between themselves. So for example to start here, the web user as if am sitting here in
front of my browser and trying to access a url. So initially I am in idle and then I request for the url. So
as I request for a url, a synchronous message, there is a synchronous message sent to the web browser
and which was so these are the different states of the of the particular lifeline.
So this was in idle state and as soon as I send a synchronous message, this synchronous message in the
sense that once I send this, I will be in a hold state, so am in a waiting state. I cannot proceed that that
is what we all know that if you have requested for the url, you have to wait for that url to actually
come. So the synchronous message then it makes a state change from idle to processing as you see here
and then it sends so it does certain computation and sends another synchronous message to the DNS
server to resolve the IP address.
So I my original request was to www.googele.co.in now I have to get the IP address for that, so that IP
address will be requested here. So DNS server which was in idle will now change to processing state
change and this is the duration constraint which specifies how much time will it take to actually find

out the IP address, given the url of the page that I am looking for. So once it has it has find that out so
let us quickly so once this found that out it again reverse back to the idle state from the processing
state.
And corresponding to this synchronous message it sends the response back. So here in the web browser
I know I was waiting for that I state change my state, the web browser changes its state and goes into
processing state. so now it has got the IP, now it is to actually want to get the page. So who will get
page, the web server will get the page. So it now sends the request to the web server which was waiting
and as soon as it gets its synchronous message, changes state and comes into the processing state.
So it is trying to find out where to find locate the page in the whole internet and then it does that and
when it is ready to find, you have found out the page it will send the response which is the reply
message. It is not it is not only responding but it will also actually send that page back and there is a
duration constraint here which say that if it cannot respond to this message within this time then
beyond this time it will possibly actually get back with a cannot respond kind of feature.
So the page could not be found kind of. So the reply has come back to the web browser then the web
browser will show this page and this is the again the duration constant constraint to show the page and
when you show the page it sends back the response corresponding to this message and the I was
waiting for the page to come I was on a hold, I was on a blocking call and now I get the page now I get
the page so I again change my state and get into viewing.
So this is so you can see that a timing diagram can very nicely show the not only the sequence of
activities that happening which you would have seen you which you will see equivalently in the
sequence diagram as well the corresponding sequence diagram but here it actually shows you in terms
of the time period in terms of which this things will have happen and in terms of that time lifeline of
each as to in exact clock time when what is expected and how much delay is expected and so on.
What is the time bound of certain things to happen. So you have the timing diagrams is very very
critical for the behavior of, you can certainly neck out if you have a completely offline system it will
not have any significant timing diagram for that. But timing diagram is significant for any real time
system where there is an expectation of messages being responded to certain events being reacted on
based on a fixed time bound, there is a fixed target within which tasks will have to be achieved or the
events will have to be responded.
and for that certainly you need to express that because sequence diagram as we said if you can recall
we said that sequence diagram just gives you the sequence. It may not necessarily tell you the time
lapse between one message to the other or between one message who responds to another. Whereas
timing diagram very frequently you would like to say that and also keep track of the internal states of
the different lifelines so that the signal timing can be managed. So this is the last of the behavioral
diagrams that we wanted to discuss.
(Refer Slide Time: 10:36)
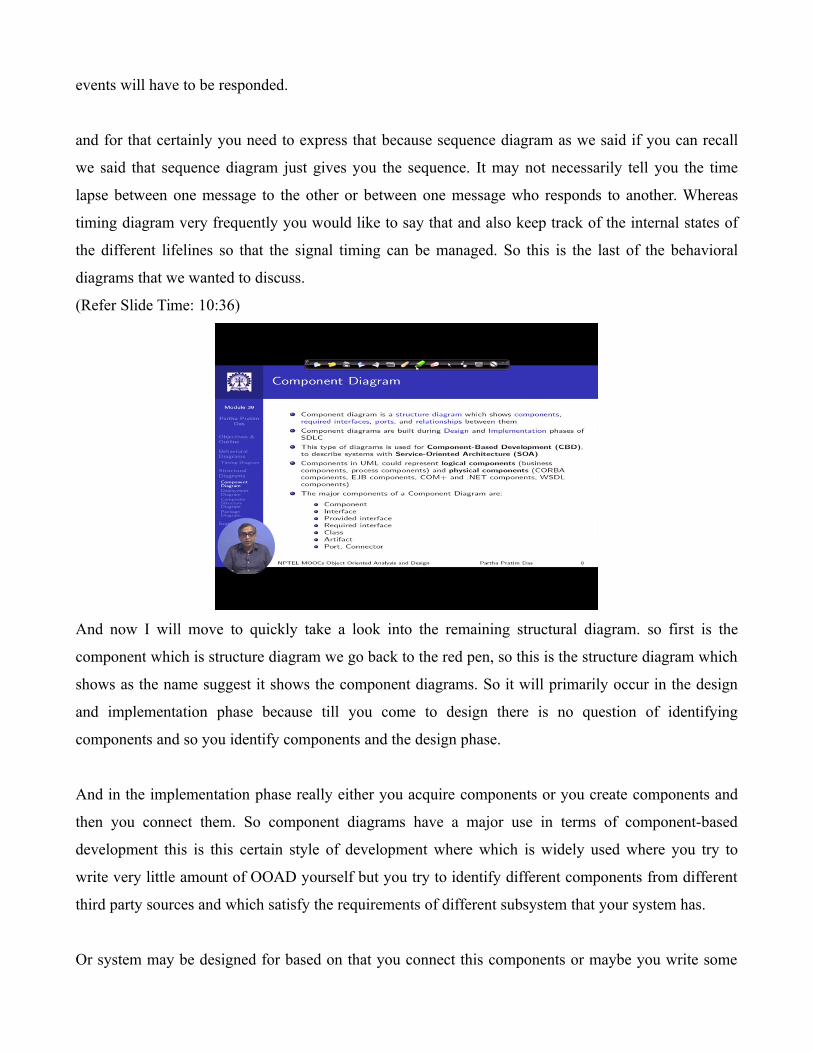
And now I will move to quickly take a look into the remaining structural diagram. so first is the
component which is structure diagram we go back to the red pen, so this is the structure diagram which
shows as the name suggest it shows the component diagrams. So it will primarily occur in the design
and implementation phase because till you come to design there is no question of identifying
components and so you identify components and the design phase.
And in the implementation phase really either you acquire components or you create components and
then you connect them. So component diagrams have a major use in terms of component-based
development this is this certain style of development where which is widely used where you try to
write very little amount of OOAD yourself but you try to identify different components from different
third party sources and which satisfy the requirements of different subsystem that your system has.
Or system may be designed for based on that you connect this components or maybe you write some
proxy, wrappers around this components to achieve the actual functionality and am sure many of you
are familiar with SOA which is service-oriented architecture where basically in state of actually just
looking into functional calls or object orientation you can actually request for certain bundle of services
to be provided and this is becoming very very common these days with very common infrastructure
getting to the cloud and so on.
So whenever you have this kind of a scenario component diagram would be really useful. It is
important to understand that the what is the basic notion of a component. a component is may be
logical or it may be physical. It may be logical in the sense we are, am saying that this is a business
component but that does not necessarily mean that this is you know physical hardware or there is a
single library or a collection of library which is a business component.
A business component could have a logical diagram that this is this is where the business is transacted.
this is where the process is transacted process component or it could be physical components like these
are the different I have listed primarily the software based components it could think of this as
hardware components also in many phases for example if you go to the domain of automobile you will
often find that you need a whole amount of component based development but if there in all the
physical components may not be software blocks it would also be hardware blocks the embedded
systems are coming in.
(Refer Slide Time: 13:42)
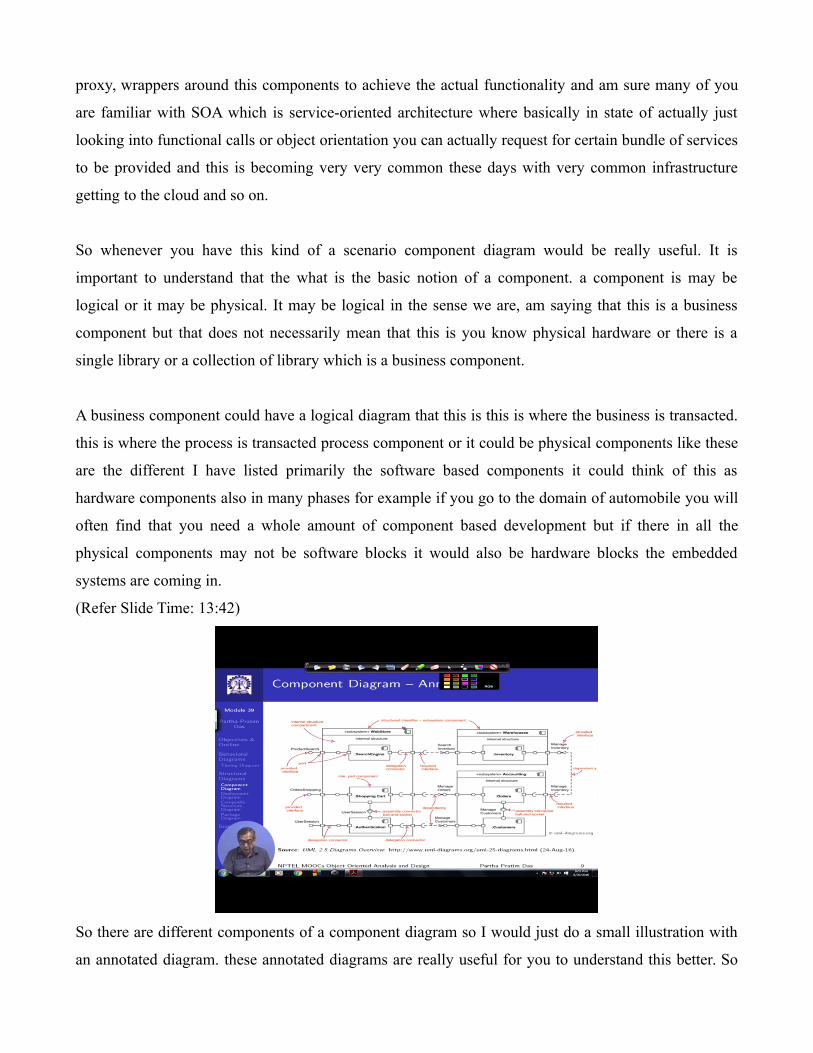
So there are different components of a component diagram so I would just do a small illustration with
an annotated diagram. these annotated diagrams are really useful for you to understand this better. So

we are talking about if you look into certainly by now you have understand the style of uml so this is
one component, this is another component and this is another. And these are kind of little big
component so you say by that you are subsystem components these are subsystems that we are
building.
And this in turn we has this subsystem component of web store which is to use certain web searching
activity which has 3 different sub components, the search engine, search the shopping cart for online
shopping and the authentication for maintaining user sessions. Similarly the warehouse where you
actually have the inventory as the inventory subcomponent the accounting has order as well as
customer. So these are the basic component structure, you can see that the implicit hierarchy of
containment in terms of the component.
And components really connect and talk to each other through what is known as ports. so basically how
do you connect you have different ports and ports have the required interface. Because you cannot for
example you cannot just I mean if you think of it this way that if you have a three pin male plug you
cannot insert that into a 2 pin female connector so these are ports and they need to have the same
interface. so for the 3 pin plug you need a 3 pin connection.
So in a similar manner, you need the required interface to supported on these ports and through that you
can connect the components as you can see here, as you can see here, the detail notation you can you
can read up then you actually need and then the you can provide the separate interface external
interface also of online shopping, user session, the product search or you can or ports could just be
internal to the system like this is connection from one subcomponent to another subcomponent within
the web store component which is internal connection that we have.
So whenever you have this requirement you put some kind of special connectors which are called
assembly connector ball and socket connector. So just to keep you know similarities with the
connectors in the physical world. So in this way the component diagram gives you a good idea in terms
of the different software components where how they are content hierarchically and who connects to
which port or which component, through what interface and so on.
And there are connectors can be so you have ports, you have connectors you have these connectors can
be delegate that is specialized and connector for building up the whole system.
(Refer Slide Time: 16:59)
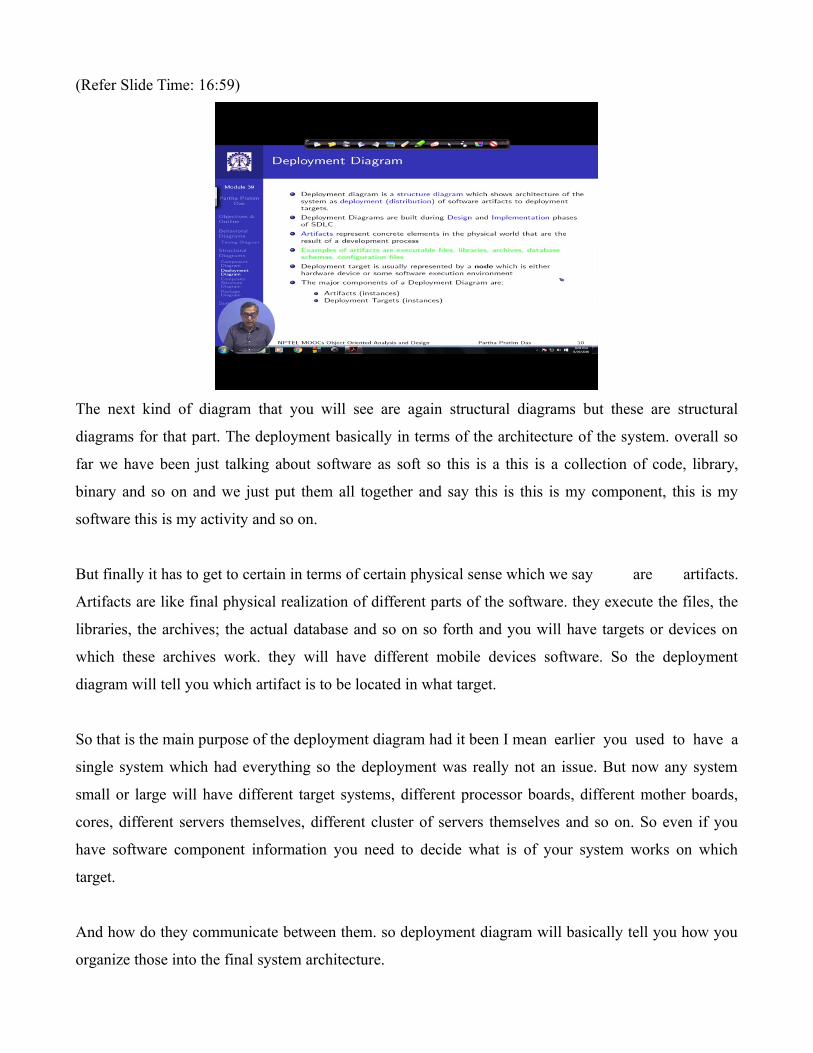
The next kind of diagram that you will see are again structural diagrams but these are structural
diagrams for that part. The deployment basically in terms of the architecture of the system. overall so
far we have been just talking about software as soft so this is a this is a collection of code, library,
binary and so on and we just put them all together and say this is this is my component, this is my
software this is my activity and so on.
But finally it has to get to certain in terms of certain physical sense which we say are artifacts.
Artifacts are like final physical realization of different parts of the software. they execute the files, the
libraries, the archives; the actual database and so on so forth and you will have targets or devices on
which these archives work. they will have different mobile devices software. So the deployment
diagram will tell you which artifact is to be located in what target.
So that is the main purpose of the deployment diagram had it been I mean earlier you used to have a
single system which had everything so the deployment was really not an issue. But now any system
small or large will have different target systems, different processor boards, different mother boards,
cores, different servers themselves, different cluster of servers themselves and so on. So even if you
have software component information you need to decide what is of your system works on which
target.
And how do they communicate between them. so deployment diagram will basically tell you how you
organize those into the final system architecture.
(Refer Slide Time: 19:05)
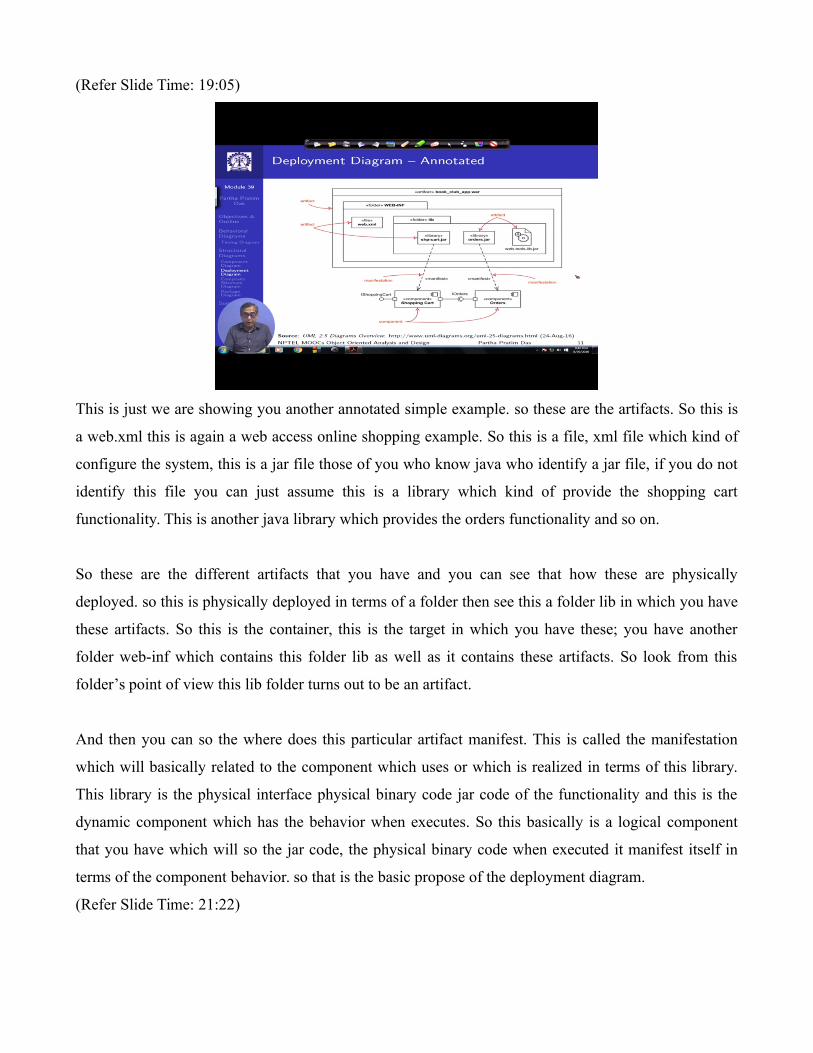
This is just we are showing you another annotated simple example. so these are the artifacts. So this is
a web.xml this is again a web access online shopping example. So this is a file, xml file which kind of
configure the system, this is a jar file those of you who know java who identify a jar file, if you do not
identify this file you can just assume this is a library which kind of provide the shopping cart
functionality. This is another java library which provides the orders functionality and so on.
So these are the different artifacts that you have and you can see that how these are physically
deployed. so this is physically deployed in terms of a folder then see this a folder lib in which you have
these artifacts. So this is the container, this is the target in which you have these; you have another
folder web-inf which contains this folder lib as well as it contains these artifacts. So look from this
folder’s point of view this lib folder turns out to be an artifact.
And then you can so the where does this particular artifact manifest. This is called the manifestation
which will basically related to the component which uses or which is realized in terms of this library.
This library is the physical interface physical binary code jar code of the functionality and this is the
dynamic component which has the behavior when executes. So this basically is a logical component
that you have which will so the jar code, the physical binary code when executed it manifest itself in
terms of the component behavior. so that is the basic propose of the deployment diagram.
(Refer Slide Time: 21:22)

And these are some of the other examples of deployment which is this is called specification level
deployment. You may not follow every detail here but just to understand here we are actually talking of
devices. This device is sun fire x4150 server. this is actually physical server you have got. And then
within that you have another which is called execution environment. the execution environment that is
a tomcat. Tomcat is nothing but a web server it is regularly used.
And then you have execution environment which is Catalina servlet container. Now this is something
of a execution environment that the user has created through certain other third parties. So these
artifices that we just saw they now get deployed in this execution environment or in this device. That
device itself is deployed in the server. So it works in terms of that it works on that server. Similarly
there are other there could be another device which is another server which connects, communicates
through certain tcp/IP protocol and these are different inventory, orders, users.
These are different artifacts which are deployed here using an execution environment which is oracle
database 10g. So all these information as we can see is not available while we talked about the other
diagram but here especially trying to look into these and get the details of system specification level,
deployment. this is just another variant of this is called the instance level deployment. So earlier we just
talked about the sun this particular server which is a generic class.
So there are hundreds of such server available in the world and here you talk about just the specific
instance of that server. So this is you get to this level when you are ready with you system or you are
about to ready with your system and you will really know want to know what are the servers on which
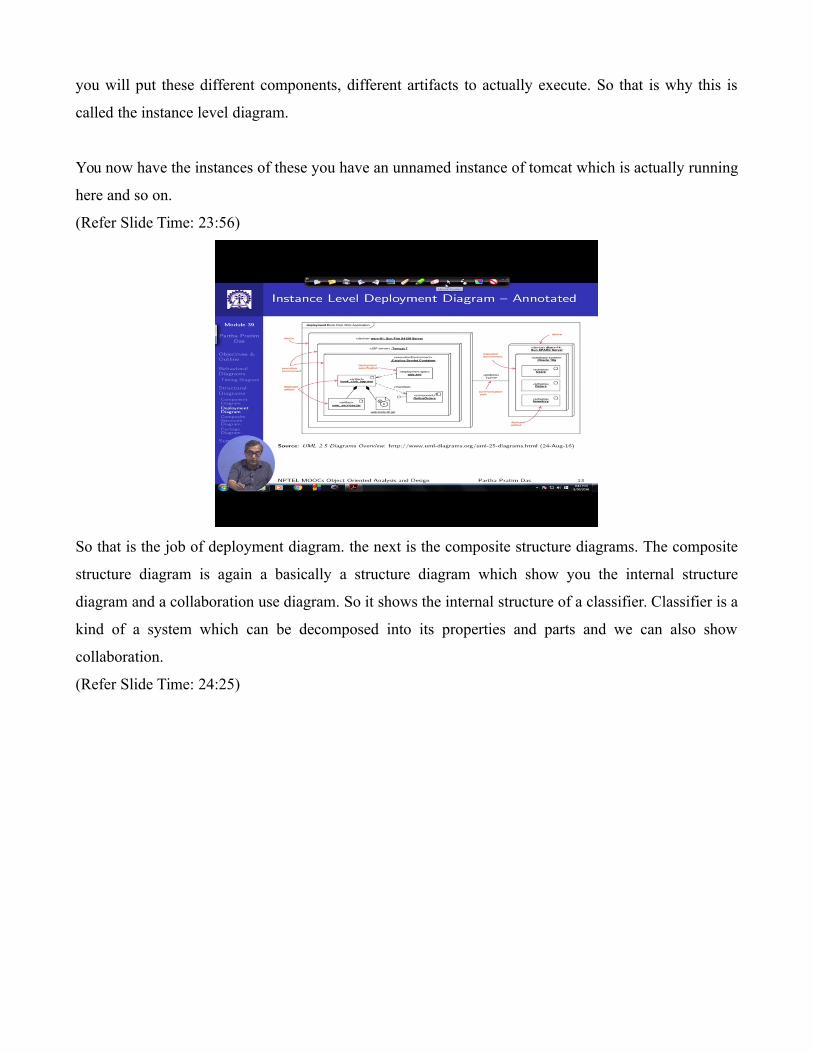
you will put these different components, different artifacts to actually execute. So that is why this is
called the instance level diagram.
You now have the instances of these you have an unnamed instance of tomcat which is actually running
here and so on.
(Refer Slide Time: 23:56)
So that is the job of deployment diagram. the next is the composite structure diagrams. The composite
structure diagram is again a basically a structure diagram which show you the internal structure
diagram and a collaboration use diagram. So it shows the internal structure of a classifier. Classifier is a
kind of a system which can be decomposed into its properties and parts and we can also show
collaboration.
(Refer Slide Time: 24:25)
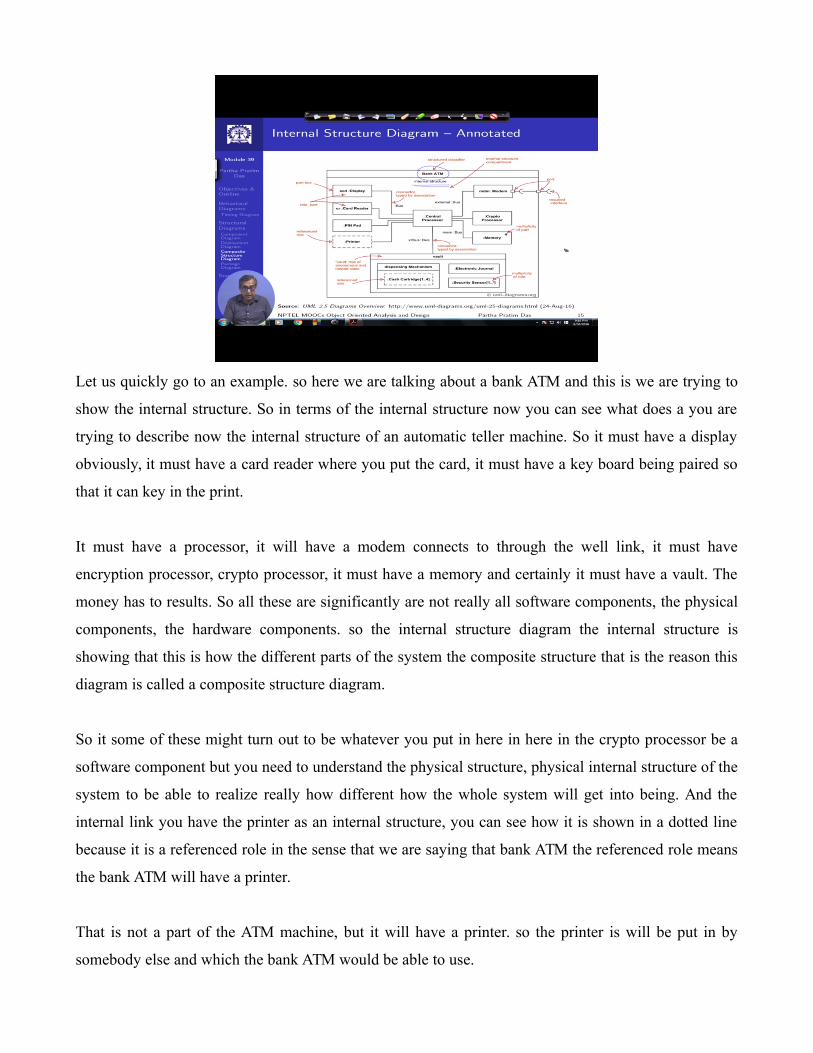
Let us quickly go to an example. so here we are talking about a bank ATM and this is we are trying to
show the internal structure. So in terms of the internal structure now you can see what does a you are
trying to describe now the internal structure of an automatic teller machine. So it must have a display
obviously, it must have a card reader where you put the card, it must have a key board being paired so
that it can key in the print.
It must have a processor, it will have a modem connects to through the well link, it must have
encryption processor, crypto processor, it must have a memory and certainly it must have a vault. The
money has to results. So all these are significantly are not really all software components, the physical
components, the hardware components. so the internal structure diagram the internal structure is
showing that this is how the different parts of the system the composite structure that is the reason this
diagram is called a composite structure diagram.
So it some of these might turn out to be whatever you put in here in here in the crypto processor be a
software component but you need to understand the physical structure, physical internal structure of the
system to be able to realize really how different how the whole system will get into being. And the
internal link you have the printer as an internal structure, you can see how it is shown in a dotted line
because it is a referenced role in the sense that we are saying that bank ATM the referenced role means
the bank ATM will have a printer.
That is not a part of the ATM machine, but it will have a printer. so the printer is will be put in by
somebody else and which the bank ATM would be able to use.

(Refer Slide Time: 26:32)
Besides that there are different collaboration use. I will skip these. you can study them.
(Refer Slide Time: 26:38)
These are some of the other ways you can show the composite structure.
(Refer Slide Time: 26:40)

And I will rather move on to the package diagram which is another very important diagram. the
package there are so far mostly if you see in terms of the component, in terms of the internal structure
and all that, we were primarily trying to take the whole system and trying to break it down into
different parts. in the package diagram we try to do the reverse. What you try to say that we have
different components, we have different parts. how should we put them together into different
envelopes into different packages so that they can be better managed, they can be maintained.
So packages again have a number of components through which the package diagrams express
themselves.
(Refer Slide Time: 27:30)
So this is again looking into example so here you are saying that there are different packages like web

shopping package, the mobile shopping package, the phone shopping package and the mall shopping
package. So this package is basically contain all that you need to do in terms of the shopping on the
way. All that you need to do in terms of shopping in your mobile phone and so on. and then it could
as this dotted blue lines show when you can merge them together this is called a package merge and big
may a bigger package.
And then you say that my shopping cart component actually is having this package to use. so this
packaging really helps you to refer to a multiple independent parts in terms of a common generalization
and this is these are the individual packages and then you could define dependencies between the
different packages. this is the payment package, and this is a web shopping package. So you can say
that they have a dependency in terms of in use of a payment using a web shopping and so on.
(Refer Slide Time: 28:43)
So these are these are different package diagrams. so to summarize we are trying to conclude on the
uml diagrams. So have we have already done the different structural and behavioral diagram
discussions and this module we tried to talk about the one more behavioral diagram as timing diagram
and 4 other structural diagrams and this will complete our exposure to the uml diagram as a whole and
we are now equipped to use the whole of uml to model and represent.
And refine any situation of analysis and design and in some cases might take them to the different
stages of implementation as well.