objective procedure for fis freshness evaluation based on ...dfo-mpo.gc.ca/library/38070.pdf ·...
TRANSCRIPT

38D10
Objective Procedure for Fis FreshnessEvaluation Based on u~leotide ChangesUsing a PLC System
B.G. Burns, PJ. Ke and B.B. Irvine
Fisheries and Oceans Scotia-Fundy RegionFisheries Development BranchHalifax Laboratories, PO. Box 550Halifax, Nova Scotia B3J 287
May 1985
Canadian Technica Reportof Fisheries and Aqua ic Sciences
0.1373
Fisheries P&hesand OCeans et oreans

anadian echnical Report ofFi herie and quatic cience
Techni al report contain cientific and technical information that contribute toe. i ting nowledge but v hi h i not normall~ appropriate for primar} literature.Technical report are directed primarily tov.ard a \\orld~ ide audience and have aninternational di tribution.. "0 re triction i placed on ubject matter and the eriereOect the broad intere t and policie of the Department of Fi herie and Ocean"namel}. fi herie and aquatic cience.
Te hni al report rna: b ited a full publi ati n . Th orr t itation appearabO\ e the ab tra t of each report. Each report i ab tracted in quaThFi h rie A h Irall and indexed in the Department' annual index tote hni al publication .
. 'umber I 6 in thi erie were i ued a Technical Report the Fi heriRe earch Board of Canada. r 4 14 \\ere i u d a Departm nt of theEm ironment. i heri and ervi e. Re earch and De\elopment Dire torateTechnical Rep rt .. urn er ,,\ere i ued a Department of Fi herie and theEn" ironm nt. Fi heri and arine en i e Te hnical R port. The urrent erienam ~ a hanged \\ ith report numb r 9 5.
Te hnical rep rt are produced regionall} but are numbered nationally. Reque tf rindi\idualrep rt \\illb filledbytheiuinge tabli hmentli ted on the front 0 erand title page. Out-of- t k rep rt \\ ill be upplied f r a fee b} commer ial ag nt .
Rapport technique canadien decience halieutique et aquatique
Le rapport technique contiennent de ren eignement cientifique et technique qui on tituent une contribution au. connai anc actuelle mai qui ne ontp normalement approprie pour la publication dan un journal ientifique. Lrapport technique ont de tine e entiellement a un pu blic int rnational et il ontdi tribue a cet echelon. II n'} a aucune re tri tion quant au ujet: de fait.la erie reOetela va te gamme de interet et de p litique du mini tere de Peche et de Ocean,c'e t-a-dire Ie cience halieutique et aquatique .
Le rapp rt technique peuvent etre cit' comme de publication complete. Letitre e act parait au-de u du re urn' de chaque rapport. Le rapport technique ontre ume dan la re\ ue Rio ume de . cience. aqualique el haliewique . et il ontla e dan I ind annual de publi ation ienti Ique t t chnique du ini the.
e numero I a 4 6 de ce te erie ont ete publie a titre de rapport technique del'Office de re herche ur Ie pecherie du Canada. e numero 5 a I ont paru atitre de rapport techniqu de la Directi n generale de la recherche et du developpement. en'ice de peche et de la mer. mini tere de l'Em ironnement. e numero 15 a924 ont et' pu blie a titre de rapport technique du en ice de peche et de la mer.mini tere de Pech et de l' 0' ironnement. Le nom actuel de la erie a ete etabli lorde la parution du num' ro 92 .
Le rapport techniqu nt pr duit a l'e helon regional. mai numerote aI ' helon national. Le d mande d rapport er nt at' fait par l'etabli ementauteur dont Ie n m figure ur la c merture et la page du tItre. Le rapport epui eeront fourni contre retributi n par de agent commer iau .

i
Canadian Technical Report of
Fisheries and Aquatic Sciences
No. 1373
May 1985
OBJECTIVE PROCEDURE FOR FISH FRESHNESS EVALUATION
BASED ON NUCLEOTIDE CHANGES USING A HPLC SYSTEM
By
B.G. Burns, P.J. Ke and B.B. Irvine
Fisheries and Oceans, Scotia-Fundy Region
Fisheries Development Branch
Halifax Laboratories
P.O. Box 550
Halifax, Nova Scotia
B3J 2S7


Figure 1Figure 2
iii
CONTENTS
PrefaceAbstractResumeIntroduction
Reagents
Recommended Procedure ee$@$.$@6@@@eO&6@$@0$@$ *.90@$@$ •• @@@@0@
Other Tests ••••••••••••••Resul ts and Discussion • e eo. " • $' •• iil • 0' IiII •• e • Q It 0 •• 0 III • $ $ $ $ •• iii & •• *' •••• e $ @ e • e
HPLC Application e s e .... lit e ... €I G ;;, Q .. e .. e ;;, e ~ e s sse a 1il ;;, iii ;li ... e .. ;;;. ...... ;; .;. Q e
Development of G and P Values as Quality Indices •••••••••••••••••Laboratory Tests for Quality Assessment ••••••••••••••••••••••••••
Post-mortem Nucleotide Degradations in Fish •••••••••••••••••Comparison of G and P Values with Other Quality Indicators
Recommended Objective Procedure for Fish Freshness EvaluationConclusions •••••••••••••••••••• e ••• e ••••••••••••••• e ••••••••••••• •••••
References •••••••• ., II 0 • I) ...... e •••• II •••• e •••••••••••••••••••••••••••••••
Table Hx, IMP, AMP and INa Content in Various Standards and FishSamples as Determined by the Recommended HPLC Method ••••••••
Table 2 - Relative Standard Deviation (%) of P and G ValuesCalculated for Various Fish Samples as Determinedby the Recommended HPLC Method ••••••••••••••••••••••••••••••
Table 3 - Various Interferences from Some Biocompounds in FishTissue on the Recommended HPLC Determination ••••••••••••••••
Tables 4-7 - Objective Quality Evaluation of Aquarium Held Cod,Commercially Caught Cod, Mackerel and Queen Crab ••••••••••••
Table 8 Recommended Guidelines for Quality Assessment of FreshFish Using G and P Values •••••••••••••• 8 •••• 60 •••• 0 •••••••••
Reaction Pathway for the XO Conversion of Hx to UA •••••••••Flow Sheet of the Extraction and Cleanup of Fish Samplesfor HPLC Analysis of Nucleotides and Their DegradationProdliC ts €I e ••••• If e e '9 e 0 0 ••• '& e •• e e e 0' II e • III • $ • *' .... e $ " It • '8 • (I '» • e €I •
Figure 3 - HPLC UV Trace of the Separation of Standard IMP, HX,AMP and INa Run on a Brownlee MPLC RP-2 Reversed PhaseAnalytical Column •••••• It ••••••••••••••••••••••• It •••••••••••
Figure 4 - Standard Curves for Nucleotide Determinations at254 nm using HX, IMP, AMP and INa as Standards
Figures 5-8 - I. Nucleotide, II. TMA, III. TVB, and IV. TBAChanges for Aquarium Cod, Commercial Cod, Mackereland Queen Crab Held on Ice •••• 0 ••••••••••••••••••••••••••••
Figures 9-12 - pH and FFA Changes for Aquarium Cod, CommercialCod, Mackerel and Queen Crab Held on Ice •••••••••••••••••••
Figures 13-16 - G Value Changes for Aquarium Cod, CommercialCod, Mackerel and Queen Crab Held on Ice •••••••••••••••••••
Figures 17-20 - P Value Changes for Aquarium Cod, CommercialCod, Mackerel and Queen Crab Held on Ice •••••••••••••••••••
iiiviv
1
1
1
2233
3
3445666
8
9
10
11
15
16
17
18
19
20
24
28
32

iv
ABSTRACT
B.G. Burns, P.J Ke and B.B. Irvine, 1985. Objective Procedure for FishFreshness Evaluation Based on Nucleotide Changes Using a HPLC System.Canadian Technical Report of Fisheries and Aquatic Sciences No. 1373,39 Pages
A high performance liquid chromatography (HPLC) method for determiningATP in has been deveNucleotides are extracted with 0.6 M perchloric acid, and determined by HPLCusing a reversed phase microparticulate column with UV absorbance detection(254 nm). The mobile phase is a 0.01 M phosphate buffer (pH 4.5) at0.5 ml/min.
By applying the described method, post-mortem nucleotide changes invarious fish meats have been investigated. Two new indicators of fishfreshness have been defined as G = (Hx + INO)/ (INO + IMP + AMP) and P = (Hx +INO)/(INO + IMP + AMP + Hx) where IMP, AMP, Hx and INO are concentrations ofinosine monophosphate, adenosine monophosphate, hypoxanthine and inosinerespectively. Assays can be completed in less than 12 minutes and goodcomparative results were observed between G and P values and other moretraditional quality indicators such as TVB, TBA, TMA and FFA. Biodeteoriationof post-mortem samples in terms of G and P values for a number of fish specieshave been discussed. Some tentative recommended guidelines of both P and Gvalues have been proposed for further grading operations.
, ,RESUME
B.G Burns, P.J. Ke et B.B. Irvine, 1985. Methode objective d'evaluation dela fraicheur du poisson basee sur la mesure de la variation de la teneuren nucleotides par CLHP. Canadian Technical Report of Fisheries andAquatic Sciences. No. 1373, 39 Pages.
On a mis au point une methode de chromatographie liquide a hauteperformance (CLHP) en vue de doser les produits de degradation de l'ATP dansdes echantillons biologiques. Les nucleotides sont extraits avec de l'acideperchlorique 0,6 M, puis doses par CLHP sur une colonne de micoparticules apolarite de phase inversee, munie d'un detecteur a absorbance UV (254 nm). Laphase mobile est constituee d'un tampon au phosphate 0,01 M (pH 4,5)s'ecoulant a un debit de 0,5 mL/min
Cette methode a ete appliquee pour mesurer, apres la mort, la variationde la teneur en nucleotides de la chair de divers poissons. On a defini deuxindices de fraicheur, soit G = (Hx + INO)/(INO + IMP + AMP) et P = (Hx +INO)/(INO + IMP + AMP + Hx), dans lesquelles IMP, AMP, Hx et INO sontrespectivement la concentration monophosphate d'inosine, de monophosphated'adenosine, d'hypoxanthine et d'inosine. Les analyses necessitent moins de12 minutes. Elles permettent d'obtenir de bans resultats avec lesquels onpeut comparer G, P et d'autres indices classiques de qualite, comme TVB, TBA,TMA et FFA. On discute de la biodegradation d'echantillons apres la mort dupoisson, en terms de G et de P pour un certain nombre d'especes. On proposecertaines directives provisoires relatives aux valeurs de P et de G au coursdes operations de classement.
INTRODUCTION
Uncontrolled enzyme protein degradation frombo th na tural and bacterial sources occurs as aresult of the failure of body regulators when fishdie (Tanikawa ai, 1970) ~ Most past studies onfish freshness been mainly based on the viewtha t freshness is lowered by bacterial action ~
However / as fresh fish spoils, it passes throughthe following sequence of events: rigor mortis dissolu tion of rigor mortis - autolysis ~ Therefore, freshness of fish must also be consideredclosely related to biochemical changes in fishr~fore putrefaction, as fish will also spoil underaseptic conditions through natural enzyme degradation (Ehira, 1976) 0 In particular autolytic andbiochemcial deteriorations in fresh fish becomemore important when proper chilling and handlingare used~
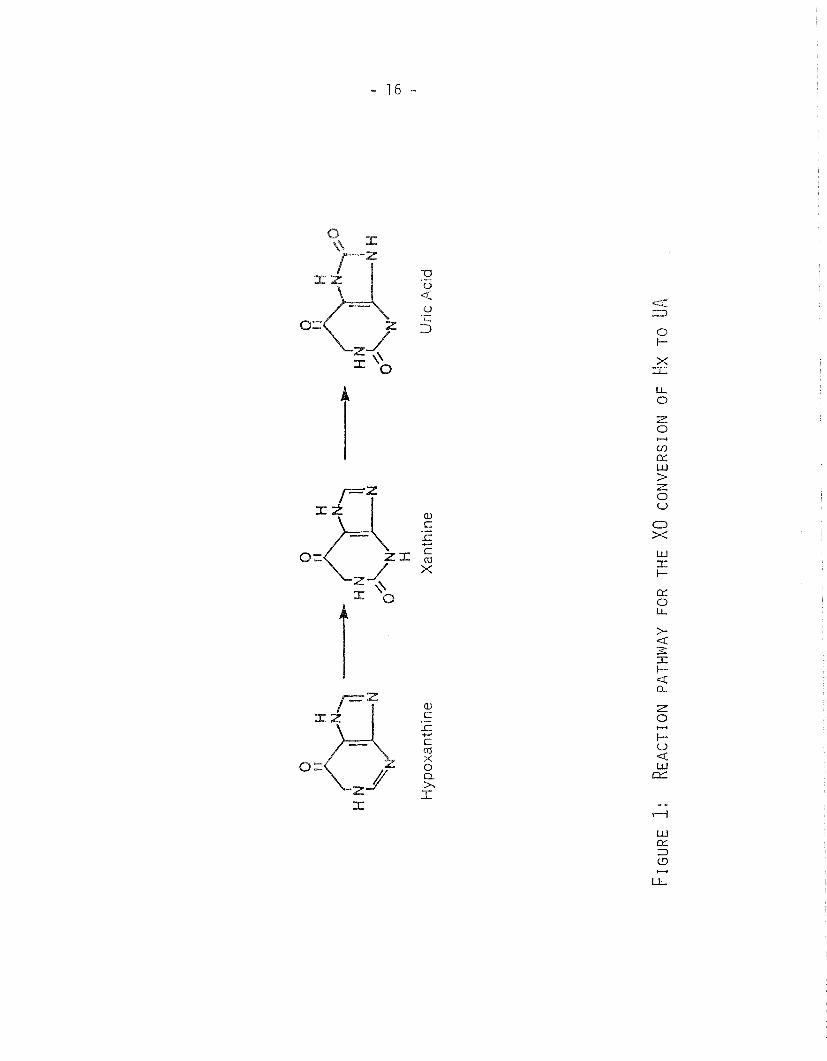
Post-mortem nucleotide degradation in mostfish muscle proceeds primarily via the followingsequence of reactions:
ATP - AMP - IMP - INO - Hx - Xa - UA
where ATP = adenosine triphosphate, AMP = adenosine monophospha te, IMP = inosine monophospha te,INO = inosine, Hx hypoxan thine, Xa = xanthine,and UA = uric acid. There are various stages inthis degradative sequence which could be considered as indices of quality such as the dephosphorylation of IMP or the formation of Hx. Themeasurement of nucleotides and their breakdownproducts offer distinct advantages over the otherobjective chemical tests such as trimethylamine(TMA), dimethylamine (DMA) , total vOlatile bases(TVB) and others which essentially measurebacterial spoilage (Martin et al, 1978). Forexample, dephosphorylation ~ IMP is primarilyautolytic (Jones 1965) and occurs during theperiod of early chilled storage~ Hx accumulationin fish tissue reflects the initial phases ofautolytic deterioration as well as later contributions through bacterial spoilage (Jones andMurray, 1962; Jones 1964; Fraser et196B; Kassemsarn Ehira, 1976):concen tra tions already been proven tocorrelate very well with eating quality in anumber of fish species (Jones et ai, 1964; Fraseret~, 1968; spi-nelli, 1969; Beuchat, 1973; Hiltzand Dyer, 1970).
One of the most popular methods of analysisof nucleotides and their degradation productsinvolves the use of selected enzymes. Hx has mostoften been analyzed by the enzymatic action ofXanthine oxidase which rapidly converts Hx to Xaand sUbsequently to UA (Figure 1) which ismeasured spectrophotometrically at 290 nm(Analytical Methods Committee, 1979). Modifica-tions to the enzyme method have led to automationemploying a redox indicator dye (Burt et aI,1968), test paper strips (Jahns ~ al, 1976), andcolormetric enzyme assay procedures (Beuchat,1973). Simultaneous assay of nucleotides andtheir breakdown products has in the past centeredmainly around ion exchange column chromatographicseparation (Jones, 1960; Jones and Murray, 1964)followed by the spectrophotometric quantifiea tionof fractions or more recently measurements withenzyme sensors (Karube, et aI, 1984). Fraser etai, 1967, also developed ~ rapid thin layer
chromatography (TLC) method, but the method wasonly semiquantitative~ Most of these methodssuffered either from non-specific measurements,laborious procedures, or poor reproducibi 1i 'ty ~
With various modifications to reversed phase highperformance liquid chromatography (HPLC) procedures (Anderson and Murphy, 1976; WorthesonaI, 1980; Brown aI, 1979) a rapid, simplespecific method simultaneously determining theIMP, AMP, Hx and INa content in fish tissuesamples has been developed (Burns and Ke I 1985) ~
The estimation of fish freshness is veryimportant in the food industry both to the consumer and the processor ~ Proven parameters offish quality such as FFA, TBA, TVB, TMA, DMA andpH values have already been used for variousquality control operations but difficulties havebeen experienced from variations in reproducibili ty and correlations wi th eating quality forsome species ~ We have applied the above HPLCmethod to the study of nucleotide changes inrepresentative members of fresh groundfish, fattyfish and shellfish. Recommended G and P valueshave been applied to the quali ty grading of thesespecies in an attempt to give more specificresults in comparison with other qualityparameters.
EXPERIMENTAL
PREPARATION OF REAGENTS
Hx, AMP, IMP, and INa were purchased inpurified form (Sigma Chemical Company). Potassiumphospha te (Baker), KOH, and perchloric acid(Fisher) were all ACS grade. Purified water(Omnisolv BDH) was used to prepare the HPLC mobilephase ~ Other chemicals used for various interference investigations were ACS grade.
(1) Extracting solvent: 0.6 M perchloric acid.Add 32.3 ml of concen tra ted perchloric (60%)to a 500 rnl volumetric and dilute to the markwith distilled water.
(2) Potassium hydroxide phosphate buffer pH 7.6:Dissolve 8.16 g of KH2P04 in approximately 60ml of water and adjust the pH to 7.6 with 50%KOH. Dilute to 100 ml with distilled H20.
(3) 50% KOH: Dissolve 50 g of KOH in 50 ml ofdistilled water and cool to room temperature.
(4) HPLC Mobile Phase: 0.01 M potassium phos-phate buffer pH 4.5. Dissolve 1.36 g KH2P04in approximately 400 ml of purified water,adjust the pH to 4.5 with KOH or H3P04 asnecessary; dilute to 1L.
(5) Standards:
Stock Solution: Individual standards areprepared by dissolVing 0.010 g of Hx, lNG,AMP, and IMP respectively in 40 ml of dis-ti lied wa ter. Make up to the mark in 50 mlvolumetrics. Keep individual standardsfrozen until required; thaw and dilute 1-10before use.

Hx content (/1 moles/g) = (6.97 x 10⁻⁴ )(KPkV1/W)(2 )
(4) Calculations of G and P Values: G and Pvalues are based on the accummulation and/ordegrada tion of Hx, IMP, AMP and INO. Hxcontent in fish tissue is calculated from thefollowing equation:
Based on our recommended procedures I theslope of the standard curve for Hx determination is 3130±130 (mm/pg), and the dilutionfactor (D), and injection volume (V2) are 10and 10 I'll respectively. Thus, equation (1)can be simplified as equation (2):
IMP! AMP and INO content in fish tissues arecalculated using the equation (1) but usingthe following K values: 5.75, 5.76 and 7.46(pl) (pmoles) / (pg) (ml) , respectively. Slopesmust be recalculated if columns or experimental conditions are changes. G values arecalculated from the following equation:
(1)KPkVl D/ HV 2W
peak height (mm)slope of standard curve (mm/pg)total volume of perchloric extractplus wash (ml)Dilution factor of neutralized extractbefore HPLCinjection volume on HPLC (pl)weight of sample (g), and14.71 (pl) (pmole) /(ml) (pg) aconstant which takes into account the1:1 dilution during neutralization.
D
V2W
K
Hx content (p moles/g)
where:PkH
V1
containing 1.0 ml of the potassium hydroxidephosphate buffer (pH 7.6). Mix the solution,cool to 0-4"C, then filter through a Watersaqueous clarification kit. Inject aliquots(V2) of the neutralized filtrate directlyinto the HPLC for analysis. Dilute withdistilled water if necessary (D).
(3) Set the flow rate at D.5if using the RP-8 column)
and let the column and detector equilibriate20-25 minutes. Inject 10 pl aliquots of eachmixed standard solution into the HPLC ..Determine the absorbances of the variousnucleotides from peak heights recorded at254 nm. Plot peak height versus pg injectedto provide a standard curve. Inj ect 10 pialiquots of appropria tely diluted sampleextracts.. Standard curves are prepared atleast twice per day to assure accuratequantitation.
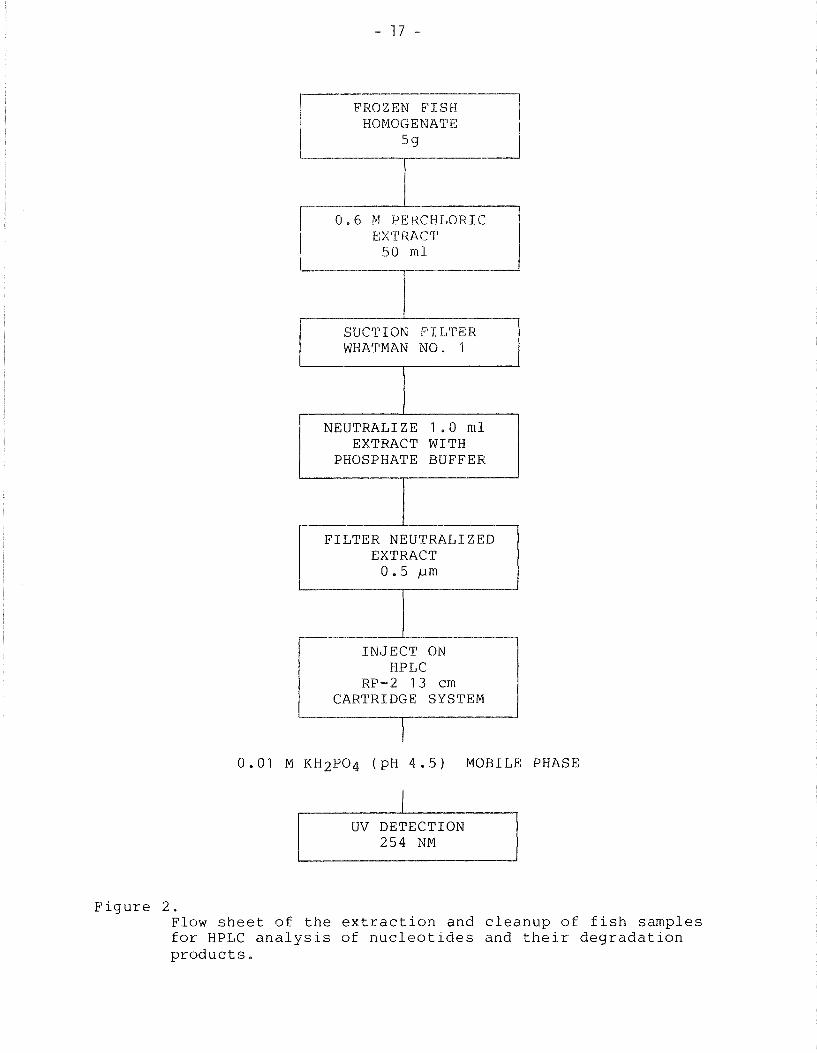
(1) Fish Sampling: Atlantic cod (Gadus morhua)were obtained live from the Halifax Laboratory aquaria and were bled, gutted, andplaced on ice immediately. Commerciallycaught cod and mackerel (Scomber scombrus)were obtained from local fresh fish retailers. The cod had been previously bled, gutted and held on ice.. Mackerel obtained inthe round state were gutted before beingplaced on ice~ These fish were considered tobe one day old upon arrival. Queen Crab(Chionoecetes opilio) were obtained li ve atdockside at Louisbourg l Nova Scotia andtransported to the Halifax Laboratory bytruck in an RSW system" Upon arrival thecrab were botched and the crab sectionsplaced on ice. Fish were sampled (at leas ttwo fish) at regular intervals throughout theholding experiments. Experiments ran up to26 days. Samples were filleted or shuckedand the meat samples homogenized in a foodprocessor and stored at -40"C in 2 kg plasticbags until analysis.
Mixed Standards (Working Solutions): 2.5,5.0, 7.5 and 10 pg/ml of IMP and Hx and 5.0,10, 15 and 20 pg/ml respectively of AMP andINO. Pipette 0.125, 0.25, 0.375 and 0.50 mlof each stock solution of IMP and Hx intofour separate 10 ml volumetric flasks. Add0.25, 0.50, 0.75 and 1.0 ml respectively ofeach stock solution of AMP and INO to theabove flasks~ Make up to the mark with distilled water~ The mixed standards solutionsare stable for about 1 week when stored at0-4"C.
APPARATUS
RECOMMENDED PROCEDURE
The apparatus used consisted of a Watersliquid chromatography system including two Model M510 pumps, a Model U6K injector, a Model 660solvent programmer, a Model 481 variable wavelength detector set at 254 nm, and a BBC Servogor120 strip chart recorder. The chromatographiccolumn was a RP-2 MPLC cartridge type (Brownleelabs) reversed phase analytical column (4.6 mm x10 cm; 10 pm particle size) directly coupled to a3 cm MPLC guard column packed with the samematerial. An RP-8 MPLC cartridge type column(4.6 mm x 10 em; 10 Mffi particle size) was used forsome of the work. The columns were held in a 13cm cartridge system holder (Brownlee labs). A
Virtis Model 1123" blender and a Waters aqueoussample clarification kit were used for samplepreparation.
Example: In a run the following da ta wasobtained for a Day aquarium cod samplecontaining Hx, IMP and INO.
(2) Extraction and Cleanup: Proceed as is au tlined in Figure 2. Weigh 5 g of the frozen,finely chopped fish meat samples and place inthe blender flask with 50 ml of 0.6 M perchloric acid. Blend for 2 minutes at maximumRPM. Suction filter flask contents throughWhatman No. 1 filter paper using a smallamount of distilled water to rinse theflask. Mix fil tra te well and note volumecarefully (V1). Transfer 1.0 ml of thefiltrate to a screw topped test tube
G = Hx + INOINO + IMP + AMP
while P values may be calculated from:
P = Hx + INOINO + IMP + Hx + AMP
(3 )
( 4)

Pk (mm) H (mm/pg) Vl V2 D W
IMP HX INO IMP HX INO (ml) (Ill) (g)
104 23 29 1838 3125 1338 66 10 10 5.777
Calculations:
Hx content (Ilmoles/g) 14.71 x 23 x 66 x 10/ 3125 x 10 x 5.7771.24
3
RESULTS AND DISCUSSION
HPLC APPLICATION
The percent relative standard deviations (RDS%) of Hx, IMP, AMP and INO determined by therecommended HPLC method over a range of standardsand fish sample concentrations is shown in Table1~ Replicate analysis of standard solutionsindicates good reproducabili ty over the range ofconcen tra tions studied (Table 1) wi th variationsof less than 7% in all cases$
• IMP content (pmoles/g) 5.75 x 104 x 66 x 10/ 1838 x lOx 5.7773.72
• INO content (Ilmoles/g) 7.46 x 29 x 66 x 10/ 1338 x 10 x 5.777
= 1.85
Therefore from equation (3) the G value is:
G = 1.24 + 1.85 = 0.551.85 + 3.72 + 0
and from equation (4) the P value is:
P= 1.24+1.85 =0.451.85 + 3.72 + 1.24 + 0
OTHER TESTS
(1) ~: pH was measured by direct insertion of acombined glass calomel electrode into thepooled fish homogenate in a manner similar tothat described by Vyncke (1981).
(2) TVB: TVB were estimated by the method ofWoyewoda and Ke (1980) as modified from Coxand Pearson (1962) where the TVB were distilled into a 2% boric acid solution. Theboric acid solution was then subsequentlytitrated back to its original pH.
(3) TMA was estimated by the method of Dyer1 ) as modified by Tozawa ( 1971) where
trimethylamine is colormetrically determinedat 410 nm as the picrate salt.
(4) TBA: TBA values in lean samples were determined by a rapid direct spectrophotometricmethod using a monophasic reaction system asdescribed by Ke and Woyewoda (1979). In thecase of fatty samples, a direct distillationmethod was employed (Robles - Martinez et ~,1982) •
(5) FFA: FFA were determined in tissues andlipids by a ti trametric method using aternary solvent system (CHCI 3 : MeOH: iPrOH)and with rn Cresol purple as indicator (Ke andWoyewoda, 1978).
(6) Miscellaneous: Moisture contents were determined on 5 9 samples of homogenate placed ina vacuum drying oven at 60°C. Percent fatwas determined as described by Ke andWoyewoda (1978).
Replicate HPLC analysis of homogeneous fishtissue samples from the initial sampling (day 0 orday 1) and from day 11 (cod and crab) and day 12(mackerel) fish held on ice were also completed(Table 1). Average percentage relative standarddeviations for Hx, IMP and INO contents were 6.17± 2.8 (range 3.3 in cod to 10 in crab); 4.95 ± 3.4(range 1.5 in cod to 9.9 in cod) and 4.09 ± 3.0(range 1.0 in cod to 8.7 in cod) respectively(Table 1). Unfortunately, AMP was not detected inany of the groups chosen indicating rapid conversion of ATP to IMP wi th no subsequent AMP buildup.
Recoveries of nucleotides (0.5 12.5pmoles/g) added to samples of cod, mackerel andcrab were in the 90% range. This compares quitefavorably with those reported by Worthesen et al(1980) whose 0.5 pmole Hx/g spike of whi tefishmuscle yielded recoveries of 92.5%.
IMP, Hx, AMP and INO are easily separatedfrom one another and completely eluted from the10 cm RP-2 reversed phase column using a 0.01 Mpotassium phosphate buffer (pH 4.5) at 0.5 ml/minwithin 12 minutes (Figure 3). If less than baseline separation is required, the analysis time canbe shortened to approximately 5 minutes at1. a ml/min with adequate resolution. The RP-2column is very stable wi th no loss of resolutionor change in retention times experienced over a 2month period of heavy usage. Highly reproducablelinear standard curves were obtained (Figure 4)over the range of concentrations used.. ATP andADP were not well separated from each other or thesolvent front and were therefore not included inthe mixed standard.. Fortunately ATP is rapidlydegraded to IMP during or shortly after the deathstruggle by the partial dephosphorylation anddeamination of ATP (Jones and Murray 1964; Martinet al 1978). The measurement of peak heights forquantitation were quite reproducable with 6-9replicate injections for each level of 25, 50, 75and 100 ng/ injection showing maximum variationsof 6.40, 1.37, 5.47 and 4.45% for Hx, INO, IMP andAMP respectively.. Retention times were verystable showing variations of less than 4% ..Detection limits for Hx and IMP were 5 ng and forAMP and INO, lOng.
DEVELOPMENT OF G AND P VALUES AS QUALITY INDICIES
While useful indicies of freshness could bebased on individual nucleotide or breakdownproducts accumulation or disappearance, an indicator that would incorporate the measurement ofseveral of these nucleotides would beadvan tagous.. Mul tiple measuremen ts remove somesample to sample and species to species variations

4
while Karube et al 1985 described a Kl value as:
wi th only a slight loss in sensi tivi ty. Ehira(1976) has described a K value based on theconcentrations of various nucleotides and theirbreakdown products estimated from the followingformula:
Now a freshness estimation index G is proposed which is calculated from equation 3. The Gvalue is based on the accumulation of Hx but alsoreflects the disappearance of IMP, AMP and INO.This index is useful over the entire iced shelflife of the fish studied.
Group B cod (Table 4) were essentially arepeat of the early stages of relaxed cod nucleotide degradation wi th daily samplings up to day8. An almost identical pattern emerged with IMPpeaking at 24 hours (Table 4) then gradually falling off to 0.394 j1moles/g (Table 4) indicatingthat perhaps cod naturally contain fairly highlevels of INO. AMP was not detected in either ofthe two groups of relaxed cod indicating rapidconversion of ATP to IMP with no subsequent AMPbuildup.
after death~ This is reflected in the nucleotidedegrada tion pat tern shown in Figure 5 ~ rni tiallevels of IMP are quite low at 0.451 pmoles/grising to 5.06 pmoles/g on day 2 (Table 4). thisis dissimilar from levels reported for trawlcaught cod which usually show high initial levelsof IMP as a result of ATP degradation during thedeath struggle (Jones and Murray 1962, 1974;Martin et al 1978). Inosine levels are also quitehigh ini ti-;:;lly at 4.70 )lmoles/g which is the highest level reached. I~O levels then fall rapidlyto 2.08 )lmoles/g on day 2 (Table 4) then rise toalmost initial levels then gradually tapering offto 0.132 ).lmoles/g on day 22. Hx levels areinitially low but rise rather steadily throughoutthe course of the experiment up to day 22 (Table4) • After day 22 Hx levels begin to tail off.These patterns (Figure 5) with the expection ofthe initially high INO levels are very similar tothose described for relaxed cod by Fraser et al,1967 and Jones and Murrary, 1961. - -
(5 )
(6 )
x 100+ Hx
K= -"'=c......:-..:.::::- _
Kl = INO + Hx x 100IMP + INO + Hx
Both of these values are based mainly on theappearance and disappearance of IMP and describe aperiod of early chill storage not measured by suchobjective chemical tests as the TMA test. Infact, by the time substantial amounts of TMAaccumulate, fish are in incipient stages of spoilage (Spinelli et al 1964; Jones 1965). The mostserious limitation of such an indicator is thatthe reaction is completed well wi thin the ediblestorage life of a number of fish species(Kassemsarn et al 1973; Jones et al 1964).
A second quality indicator P calculated fromequation (4) serves as an indica tor of spoilageduring the early stages of chill storage.
The RSD% of P and G values determined forcod, mackerel and crab samples are shown in Table2. Variations were less than 3% for P valueswhile variations of less than 2.9% were recordedfor G values (Table 2). G and P values wou ldappear to be effective in reducing some of thesample to sample variation noted above.
Tests for interferences from various biosubstances possibly present in fish tissue werecarried out by adding up to 50 mg of each compoundto a 5 g fish sample. All of the compounds listedin Table 3 did interfere slightly with thedescribed method giving relative deviations ofabout 5% or less for P values and 10% or less forG values.
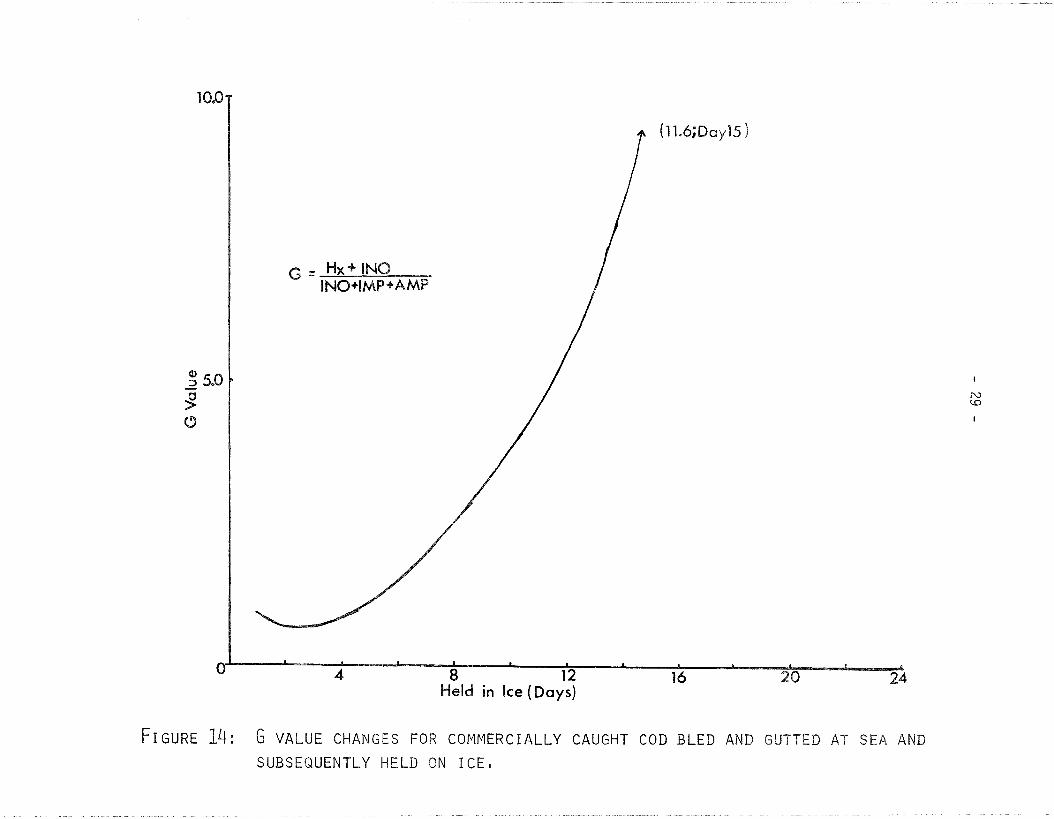
Commercially caught cod showed a very similardegrada tion pattern (Figure 6) to that describedfor aquarium held cod, especially after 3-4 daysholding period on ice (Figure 5, 6). Commerciallycaught cod were considered to be one day old atthe time of the first sampling. Therefore, theinitial values would be expected to vary slightlyfrom those of the aquarium held cod. INO and IMPfor the most part were at their highest on day 1,IMP did show a further increase on day 3 (Table 5)and gradually tapered off while Hx values increased steadily over the sampling period (Figure 6,Table 5). The most significant difference betweenthe aquarium held and commercially caught cod wasthat the degradations and/or accumulations occurred more qUickly (Figure 6, Table 5) indicating ashorter shelf-life for the commercially caughtcod. This no doubt reflects a less stringenthandling, washing and icing regime for a commercially caught fish versus laboratory handled fish.
LABORATORY TESTS FOR QUALITY ASSESSMENT
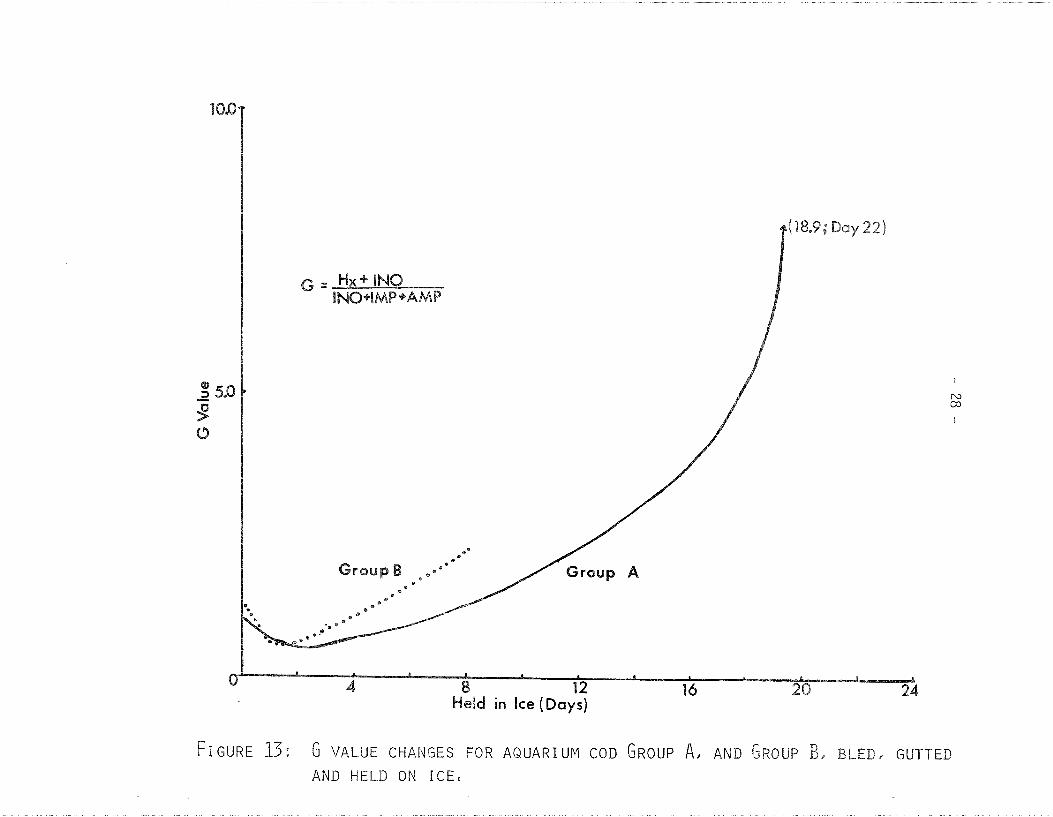
Tables 4-7 contain summaries of the resultsof all objective quality indicators determined foraquarium held cod, commercial cod, mackerel andqueen crab respectively. Figures 5-8 illustratethe degradation patterns of the chosen nucleotides, TMA, TVB and TBA changes in aquarium heldcod (Group A), commercially caught cod, mackereland queen crab respectively. The changes of pHand FFA during the icing shelf-life studies of thevarious fish species tested are shown in Figures 9through 12 while G and P values are shown inFigures 13-16 and 17-20 respectively.
Post-mortem Nucleotide Degradations in Fish
Aquarium held cod day 0 samples were veryfresh with samples being taken less than one hour
Nucleotide degradation patterns for mackerelwere distinctly different from those of the codsampled. INO levels were intially 4.18 prnoles/g(Table 6) and remained fairly consistent up to day19 on ice (Figure 7) where they fell to 1.09pmoles/g. IMP levels began at 2.74 pmoles/g onday 1, increased to 3.13 pmoles/g on day 3 thentapered off to 0.896 pmoles/g by day 10 (Table 6)of the holding period. Hx, in general, steadilyincreased throughout (Figure 7, Table 6). ValuesoQtained were quite similar to those previouslyreported for mackerel iced immediately aftercatching (Fraser et al 1968).
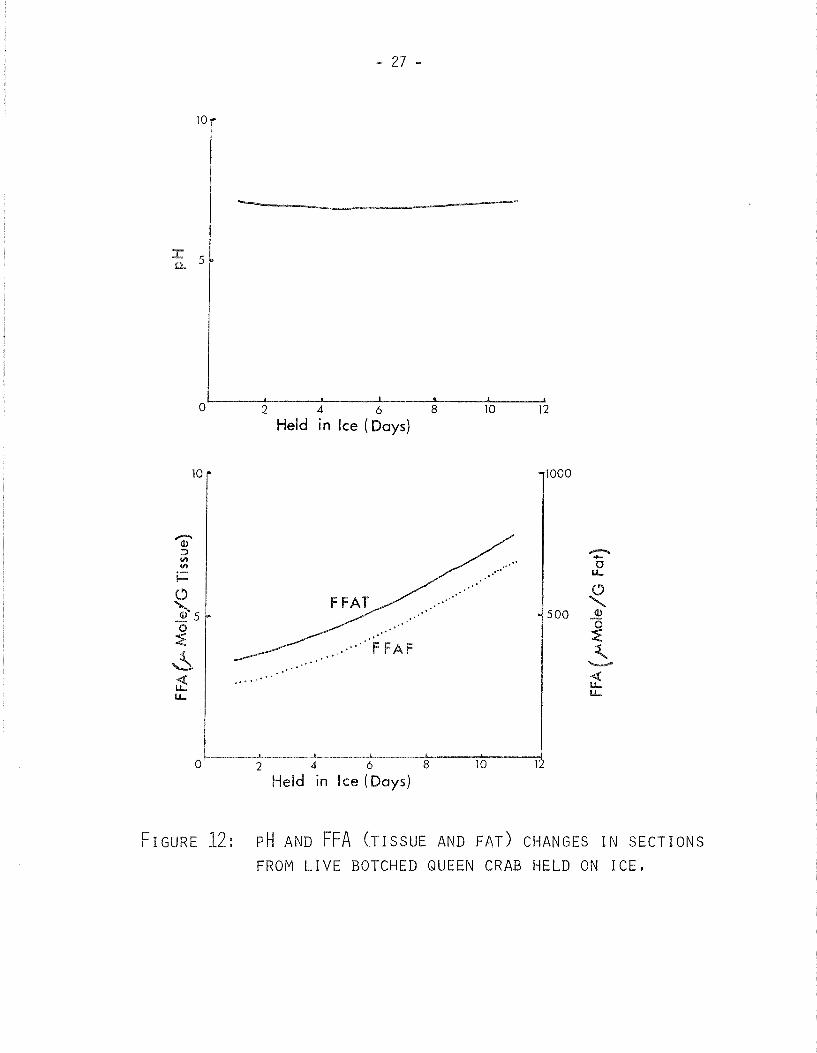
Queen crab were held for only eleven days onice because severe blackening of the sectionswould by this time render the product unsaleablein any case 0 Very foul odors were also in evidence by this time. IMP and INO values were at

5
never reachedpH (Figures 9,constant over
oxidative rancidity were(Robles-Martinez et al 1982).10) also remained relativelythe course of the experiment.
Mackerel fillets used in thecontained 4.01 ± 1.5% (range 0.656
- 5.73%) fat and 72.1 ± 2.3% (range 67.8 75.5%) moisture (Table 6).
(2 )
their maximum on day one on ice (Figure 8, 'J.'able7) and gradually tapered off to 0.018 and 0.529)lmoles/g respectively by day 9 (Table 7). Hxini tial levels of 0.289 )lmoles/g (Table 7) increased generally throughout the course of theexperiment (Figure 8)~ Maximum values of IMP, Hxand INa obtained for Queen crab throughout theholding period were less than one half thoseexperienced by either mackerel or cod~
Comparison of G and P Values withOther Quality Indicators
(1) Cod: Fillets from aquarium held cod used inthe experiment contained 0.471 ± 0.022%(range 0.454 - 0.518%) fat and 81.5 ± 1.4%(range 79.5 84.2%) moisture (Table 4).Commercial cod fish fillets contained 0.481 ±0.014% (range 0.448 - 0.500%) and 81.1 ±0.65% (range 80.0 - 82%) moisture (Table 5).
Initial TVB values for aquarium held cod wererelatively steady in the 22 mg-N/100g rangeup to day 14 where values tend to drama tically increase up to 75.4 mg-N/100 g on day26, the final sampling day (Table 4). Thisrise closely parallels the rise in G valueover the same period (Figure 5, 13) and marksa progressed state of fish spoilage. Valuesof over 30 mg-N/100g are indicative of spoiling fish while values approaching 50 mg-N/100g indicate spoiled fish (Pearson 1973;Woyewoda and Ke 1980). That is in a 3 gradesystem such as proposed for squid (Ke et ~1979) the aquarium held fish would be considered Grade F (unacceptable) around day 17 byphysical grading and TVB data (Figure 5). Asimilar pattern of results were observed forcommercially caught cod (Figures 6, 14, Table5) but the fish were judged unacceptable byphysical and TVB data at day 10.
The onset of bacterial spoilage is noted inthe aquarium held cod by a rise in the TMAvalues starting around day 8 (Figure 5, Table4). This initial rise corresponds to aleveling off of P values (Figure 17) whichoccurs at approximately day 8~ There is alsoa rapid increase in TMA values up to 38.6 mgTMA-N/100g beginning around day 15 (Figure 5,Table 4) corresponding to the previouslymentioned rise in G values. It has beenproposed that the maximum allowable TMAvalues be set between 5-10 mg/100g of tissuefor international trade (Martin et al 1978).Dyer and Mounsey ( 1945) judged cod andhaddock unacceptable when concentrations of10-20 mg/100g tissue had been reached.Woyewoda and Ke (1980) set levels of lessthan 3, 3-10 and greater than 10 for gradesA, Band F grade squid respectively.
Similar patterns are in evidence for thecommercially caught cod (Figures 6, 14 f 18,Table 5) with the onset of bacterial spoilagein evidence starting around day 4 with acorresponding rise in P values. A moredramatic increase starts around day 6corresponding to a rise in G values.
(3)
TVB values remain almost constant up to day14 at around 30 mg-N/100g then begin a fairlysteady increase (Figure 7)~ TMA values begina similar increase at about the same time(Figure 7). This is about the spot where theP value begins to pIa teau (Figure 19). Thisplateau tends to reflect the disappearance ofIMP which according to Fraser et al (1968) isat or near the unacceptabilitY--level formackerel. In any event sharp increases inei ther TMA or TVB values indicates a progressed state of protein degradation in thespecies under study. The pattern for the Gvalues closes resembles that of either theTVB or TMA values in that the initial valuesremain relatively constant up to days 12-14where a steady increase begins (Figure 15,'fable 6).
TBARS values have been correlated with tastepanel data and the recommended guidelines forassessing rancidity development in mackereland other fatty fish have been established(Roblez-Martinez 1982). Quality grades havebeen established as 0-8, 9-20 and over 21)lmolesjkg fish for excellent, good andunacceptable grades. Mackerel in this studywould be judged unacceptable around day 5 asa result of TBA values (Table 6, Figure 7).
FFA increased throughout the course of theexperiment. FFA accumulate as a result ofenzymatic fat hydrolysis ~ The increase inFFA in mackerel tissue as a function of holding time is depicted in Figure 11. Althoughcu t off lirni ts have not been assigned forvarious qual tiy grades, FFA would appear tobe a useful quality test for mackerel. pH aspreviously remains relatively constant(Figure 11) over the course of the experiment.
Queen Crab: QUeen crab used in this experiment contained 1.27±0.11% (range 1.13-1.43%)fat and 86.6±1.1% (range 85.3-87.6%) moisture(Table 7).
TVB, TMA and TBA values all show a fairlysharp increase beginning around day 4 (Figure8) • Limi ts of acceptabi li ty for TBA and TVBare reached around day 5-6 (Table 7, Figure8). These rises closely parallel a rise inthe G values (Figure 16, Table 7) and apIa teauing of the P values (Figure 20, Table7) • Blackening of the exposed meat in thecrab sections and objectionable odors havealso reached an unacceptable level by thistime.
Although both TBA values (Figures 5, 6) andFFA (Figures 9 flO) generally increase overthe course of the icing experiment, valuesassociated with spoilage as a result of
FFA also rise steadily thorough the course ofthe experiment and may also be useful as aquality indicator (Figure 12). pH valuesremain relatively constant over the course ofthe experiment (Figure 12).
RECOMMENDED OBJECTIVE PROCEDURE FORFISH FRESHNESS EVALUATION
The recommended G and P values for the quality assessment of fresh fish derived from comparisons with such chemical tests as TVB, TMA, TBA andFFA as well as physical evaluation are shown inTable 8 ~ These values serve only as a guide andmay be adjusted to meet needs or requirements if ahigher quality product is desired~ G and P valuesshould not be used as the only parameters toevaluate fish quality. Additional indicators suchas TBA I TVB, etc., should be used in order to havereliable quality assessments~
(1) Cod: the G value is most useful as a indicator of spoiled fish, i.e. establishing theline between TB and TF grade fish. If suggested values of 10 mg TMA-N/100g and 45mg-N/1 DOg for TMA and TVB respectively areaccepted as the cut off point for acceptablefish, then a G value of less than 5 wouldgive a similar indication (Figures 5, 13).
It is much more difficult to establish avalue for TA-TB grade fish. The disappearance of IMP has been correlated with a lossof fresh fish flavour in some species (Fraseret al 1968; Spinelli et al 1969; Jones andMurray, 1961) and may be a good TA/TB gradeindica tor for these species. For example I
IMP dephosphorylation occurs between 8-12days in chill stored cod (Jones 1963). Forthis reason the P value may be a good indicator of early loss of fish quality (TA/TB).If TMA levels of less than 3 and TVB valuesof less than 30 (Woyewoda and Ke, 1980) areaccepted as being close to the TAITB dividingline, aquarium held cod would go from TAITBgrade between day 10-14. If a P value ofgreater than 0085 is accepted as the cut offpoint for TAITB grade fish, then the fishwould pass from TA-TB grade at approximatelyday 8. If a G value of greater than 2 istaken as the cut off point, fish would passfrom A-B grade between days 10-14.
(2) Mackerel: The most useful indicators ofmackerel eating quality are those tests whichmeasure the oxidative rancidi ty or enzymatichydrolysis of fats contained in the mackerelflesh such as the TBA or FFA tests. G and Pvalues might prove useful in the assessmentof mackerel quality however l but only asindicators of protein degradation rather thanactual eating quality. G values of greaterthan 1.5 andlor P values of greater than 0.95would indicate an advanced state of proteindegradation and would provide informationsimilar to that provided by the TVB and TMAtest.
(3) Queen Crab: G and P values can prove usefulin establishing the line between TB and TFgrade crab. If a P value of greater than 0.9and G value of greater than 105 are used ascut off points for acceptable crab then aholding time of approximately 6 days on iceis indicated for this experiment (Figures 16 1
20) 0 This is in close agreement with TBA,TVB, TMA and physical data (Figures 8, 12).There appears as yet to be no acceptablepoint for establishment of a G or P valuewhich would indicate the TAITB grade transition for queen crab.
6
CONCLUSIONS
Overall either the G value alone or acombina tion of G and P values should provide anexcellent starting point for the establishment ofa grading system 0 G and P values can be chosenfor a 3 grade TA (excellen t), TB (good) and TF(rej ect) sys tem for cod and to establish the TB/TFtransi tion point for queen crabo G and P valuescan establish the degree of protein degradation inmackerel but are not useful indicators of eatingquali ty 0 Tests that measure the degree ofoxidative rancidity (TBA) an enzymatic hydrolysis(FFA) are more useful indicators of eating qualityfor mackerel,. Both G and P values are easily andquickly calculated from available data and couldbe easily programmed into a small microcomputer,.The method also provides a valuable al terna ti vetest in the monitoring of fish quality~
REFERENCES
Analytical Methods Commi ttee 1979. Recommendedgeneral methods for the examination of fishand fish products. Analyst. Vol. 104, May:p. 434.
Anderson, F.S. and R.C. Murphy, 1976. Isocraticseparation of some purine nucleotide, nucleoside and base metabolites from biologicalextracts by high performance liquid chromatography. J. Chromatog. 121, p. 251.
Beuchat l L .. Ro 19730 Hypoxanthine measurement inassessing freshness of chilled channel ca tfish (Ictalurus puncta tus) • J. Agr. FoodChem. 21, No.3: p. 453.
Brown, NoD q J .. A~ Kintzios and S~Eo Koetit 1979~
Determina tion of hypoxanthine 1 xanthine anduric acid in biological fluids by ion pairhigh-performance liquid chromatography. J.
Chromatog. 177, p. 170.
Burt l J.R" I Jo Murray, and G.. Do Stroud 1968.. Animproved automated analysis of hypoxanthine ..J. Fd. TechnoL 3, p. 165.
Cox, HoEo and D.. Pearson 1962. IIChemical Analysisof Foods II .. Chern.. Pub 0 Co.. Ltd .. 1 New York f
pp. 321.
Dyer, W.. J .. and Y.A. Mownsey 1945.. Amines in fishmuscle II.. Development of trimethylamine andother amines.. J .. Fish .. Res .. Ed .. Can .. 6:p. 359.
Ehria, S. 1976. A biochemical study on thefreshness of fish. Bull. Tokai Reg. Fish.Res. Lab. No. 88.
Fraser l 0 .. 101 JoRo Dingle, JoA .. Hines, SoC .. Nowlanand W.J. Dyer 1967. Nucleotide degradation,moni tared by thin layer chromotography andassociated postmortem changes in relaxed codmuscle. J. Fish Res. Bd. Can. 24, No.8: P.1837.

Fraser, D.I., D.P. Pitts and W.J. Dyer, 1968.Nucleotide degradation and organolepticquality in fresh and thawed mackerel muscleheld at and above ice temperature. J" FishRes Bd. Can 25(2): P. 239
Hiltz, D.J. and W. J. Dyer, 1970. Principal andsoluble nucleotides in adductor muscle of thescallop and their degration during postmortum storage in ice" J .. Fish Res" Bd" Can27: P. 83.
Jahns, P"D .. , J"L" Howe, R"J .. Coduri and A"G .. Rand,1976" A rapid visual enzyme test to assessfish freshness. Food Technol. 30:37, July.p. 27.
Jones, N .. R.. 1960" 'I'he separa tien and determina-tion of free purines, prymidines and nucleoside in cod muscle. Analyst 85: p. 111.
7
Ke, P.J. and A.D. Woyewoda. 1979. Microdetermination of thiobarbituric acid values in marinelipids by a direct spectrophotometric methodwi th a monophasic reaction sys tern" Anal ..Chim. Acta. 106: p. 279.
Ke, P.J., A.D. Woyewoda and M. Fierheller. 1979.Handling methods and quality evaluation offresh Canadian Atlantic squid
Fisheries and MarineNo. 900.
Martin, R.. E., R"J"H.. Gray and M.D" Pierson ..1978. Quali ty assessment of fresh fish andthe role of the naturally occurring microflora. Food Technol. May: p. 188.
Pearson, D. 1973. Laboratory techniques in foodanalysis. Butterworth and Co. (Publishers)Ltd. p. 168.
Jones, N.R. and J. Murray. 1961. Nucleotide Robles-Martinez, C., E. Cervantes and P.J. Ke.
concentration in codling (Gadus callarias) 1982. Recommended method for testing the
muscle passing through rigor mortis at O·C. objective rancidity development in fish
Z. vergleich Physiol. 44: p. 174. based on TBARS formation .. Can. Tech. Rep.Fish. Aquat. Sci. No. 1089.
Fujii. 1970.freshness in
Co., Tokyo.
Woyewoda , A.. 0 ..
quali tysquid.902.
Jones, N.R. and J. Murray. 1962. Degradation ofadenine and hypoxanthine-nucleotide in themuscle of chill-stored trawled cod (Gaduscallarias ) • J. Sci. Food Agric., Vol~September: p. 475.
Jones, N.R. 1963. Interconversions of flavorousnucleotide catabolites in chilled and frozenfish. In Proc. XI IntI. Congr. Refrig.Munich, IV-5, IntI. Inst. of Refrig., Paris,France: p. 917.
Jones, N.R., J. Murray, E.I. Livingston and C.K.Murray. 1964. Rapid estimations ofhypoxanthine concentrations as indicies ofthe freshness of chill-stored fish. J. Sci.Food Agric. Vol. 15, November: p. 763.
Jones, N.R. and J. Murray. 1964. Rapid measuresof nucleotide dephosphorylation in iced fishmuscle~ Their value as indicies of freshnessand of inosine 5-mono-phosphate concentration. J. Sci. Food Agric. 15: p. 684.
Jones, N.R. 19650 Hypoxanthine and other purinecontaining fractions in fish muscle asindicies of freshnesso In I'The Technology ofFish Utilization ll
• ed.. R .. Kreuzer. Fishingnews (Books) Ltd. London: p. 179.
Karube, I., H. Matsuoka, S. Suzuki, E. Watanabeand K. Toyama. 1984. Determination of fishfreshness wi th an enzyme sensor. J" Agric ..Food Chern. 82: p. 314.
Kassemsarn, B .. , Bo Sanz Perez, Jo Murray and N.. R.Jones. 1963. Nucleotide degradation in themuscle of iced haddock (Gadus aeglefinus),lemon sole (Pleuronectes microcephalus) andplaice (Pleuronectes platessu). J. FoodSci. 28: p. 28.
Ke, P.J. and A.D. Woyewoda. 1978. A titrimetricmethod for determination of free fatty acidsin tissues and lipids with ternary solventsand m-cresol purple indica tor.. Anal.. Chim ..Acta. 99: p. 387.
Spinelli, J., M. Eklund, D. Miyouchi. 1964.Measurement of hypoxanthine in fish as amethod of assessing freshness. J. Food Sci.29: p. 710.
Spinelli, J., G. Pelroy and D. Miyouchi. 1969.Quality indicies that can be used to assessirradiated seafoods. In uFreezing andIrradia tion of Fish".. ed. R. Kreuzer ..Fish-ing News (Books) Ltd., London, U.K.p. 425.
Tanikawa, E., T. Motohiro and T.Preservation and control ofmarine products.. Kosei Pub.Ch. 12.
Worthesen, J.J., P.T. Waletzko and F.F. Busta.1980. High pressure liquid chromotographicdetermination of hypoxanthine in refrigeratedfish. J. Agric. Food Chern. 28: p. 1308.
and P.J. Ke. 1980. Laboratoryassessment of Canadian AtlanticFish .. Marine Servo Tech .. Rep .. No.
Vyncke, W. 1981. pH of fish muscle: comparisonof determination methods.. Western EuropeanFish. Technol. Assoc., Copenhagen: p. 1.

Table 1 Hx, IMP, AMP and INO content in various standards and fish samples as determined bythe recommended HPLC method.
Sample Hx Content IMP Content AMP Content INO Content(pMoles/g ~ RSD%) (pMoles/g ~ RSD%) (pMoles/g + RSD%) (pMoles/g ~ RSD%)
aStandard 1 0.020 + (6.5) 0.021 + (5.5) 0.36 + (5.0) 0.044 ~ (1.6)
2 1 .50 ~ (2.3) 1 .58 ~ (3.3) 3.00 + (4.5) 3 31 ~ (1.4)
bCrab 1 0.289 + (10) 0.870 + (3.3) --- 1 60 ~ (4.8)
2 1 .07 :+ (4.3) 0.0141 ~ (2.5) --- 0.781 ~ (1.4)
bMackerel 1 0.914 + (6.5) 2.74 + (4.1) --- 4. 18 ~ (2.8)
2 1 .27 ~ (8.9) 0.787 + (8.4) --- 4 89 + (5.9)
bCod 1 1 .31 + (3.3) 5.07 + (1.5) --- 2 06 + (1.0)
2 2.66 ~ (4.0) O. 124 ~ (9.9) --- 1 87 + (8.7)
a. Standard concentrations are p moles/ml with 6 determinations done per standardb. 3 determinations
00
Table 2.
- 9 -
RSD% of P and G values calculated for various fishsamples as determined by the recommended HPLC method.
Sample P Value + RSD% G Value + RSD%- -Crab 1 0.680 + ( 3 . 0 ) 0.759 + ( 1 .6)- -
2 0.993 + (0.036) 2.28 + ( 1. 1 )- -Mackerel 1 0.651 + (0.11) 0.736 + (0.95 )-
2 0.887 + (0.32 ) 1 .09 + (0.65)- -Cod 1 0.923 + (0.17) 1. 06 + (0.55 )- -2 0.973 + (0.10) 2.27 + ( 2 . 9 )- -

10 -
e 3. Various interferences from some biocoiffiPloi nds in fish tissuethe recommended HPLC determ nation
r'nmnn Amount G Va ue % of P Value % of'-
added variation variation(mg)
Control* --- 2.25 --- 0.804 ---DMA 5 2.35 + 4.4 0.762 - 5.2CuS04 50 2.01 - 11 .0 0.790 - 1.7NaCI 50 2. 12 - 5.8 0.800 - 0.5Stearic Acid 5 2.20 - 2.2 0.816 + 1.5Cysteine 5 2.28 + 1.3 0.807 0.37TBHA 5 2.45 + 8.9 0.837 + 4. 1TBHQ 5 2.38 + 6.2 0.832 + 3.5TMAO 50 2.09 - 7 • 1 0.789 - 2.0Hemoglobin 5 2.09 - 7 . 1 0.802 - 0.25Cystine 50 2.06 - 8.4 0.784 - 2.5FeSo4 1 2.46 + 9.3 0.829 + 2.5Sucrose 50 2.49 + 11 .0 0.834 + 3.8Palmitic Acid 5 2.39 + 6.3 0.828 + 3. 1Lactic Acid 50 2.28 + 1 .4 0.818 + 1.9MnS04 5 2.38 + 5.8 0.833 + 2.9Sorbitol 5 2.13 - 5.3 0.799 - 0.62TMA 5 2.25 0.0 0.819 + 1 .9Lecithin 50 2.45 + 8.9 0.835 + 4.0Thiourea 5 2.29 + 1 . 7 0.819 + 1.8
*Samples of 5 g of cod tissue were used as the control and inall interference investigations.

Table 4. Objective quality evaluation of held cod
HELD IN ICE (DAYS)a
Objective QualityIndicator 0 1 2 3 4 6 8 11 14 8 22 26
TVB (mg-Nj100g) 21.6 - 21 .4 - 24.8 - 22.3 25.2 29.2 47.8 72. 75.4
TMA (mgTMA-Nj100g) 0 - 0 - o 391 - 0.492 3.76 4.03 14.0 38.6 26.6
FFA(llMolejg tissue 4.16 - 4.21 - 4.23 - 4.38 4.55 4.81 5 31 9.48 7.67
FFA (llMolejg oil) 920 - 919 - 928 - 960 1002 1027 1101 934 478
TBA (~Molejg oil) 0.704 - 0.640 - 0.711 - 0.747 0.830 0.905 1.30 2.82 0.962
TBAGuMolejkg fish) 3.09 - 2 93 - 3 43 - 3.85 4.56 4.52 6 42 14.2 5.03
pH 7.1 - 7. - 7.2 - 6.9 6.9 7.0 7 0 7.2 7.1
Moisture content% 81 .7 - 79 5 - 82.0 - 79.9 80.6 82.0 81 6 82 3 84.2
Percent Fat 0.456 - 0.456 - 0.456 - 0.456 0.454 0.469 o 482 o 49 0.518
b 0.451 - 5.06 - 3.83 - 0.174 0.124 0.091 0 33 0.157 0.145IMP(llMolejg) Ac
B 0.197 .07 3.54 2.41 o 394 0.165 0.074 - - - -
HX(~Molejg) A 0.731 - 1 .31 - 1 .29 - 1.63 2.66 2.14 4 44 5.43 4.51B 1.28 1.20 0.984 1.16 2.61 1. 74 2.73 - - - - -
AMP(pMolejg) A N/Dd - NjD - NjD - NjD NjD NjD NjDB NjD NjD N, NjD NjD NjD - - - - -
INO(llMolejg) A 4.70 - 2.08 3.36 4.56 - 2.85 1.87 2.01 1 02 o 137 0.054B 4.62 .64 2.43 4.03 3.87 1 .89 - - - - -
G value A 1.05 - 0.474 0.611 - 1.48 2.28 1 .98 4 74 8 9 23.5B 1 22 0.500 0.571 0.783 1.50 1 .39 2.44 - - - - -
P value A 0.923 - 0.40 - 0.604 - 0.963 0.974 0.979 0.977 o 973 0.968B 0.968 0.411 0.491 0.652 0.945 0.971 0.985 - - - - -
a. At least two cod fillets were pooled for each sampling day.b. Group A cod were held 26 days and sampled on days indicated.c. Group B cod were held 8 days and sampled on days indicated.d. Not detected.
............

Table 5. Objective quality evaluation of commercially caught cod
aHELD IN ICE (DAYS)
Objective QualityIndicator 1 3 5 7 9 13 15 7 19 21
TVB(mg-N/100g) 29.3 24.5 30.3 37.6 43.9 51 .4 74.2 81 .2 78.2 77 .3
TMA(mg TMA-N/100g) 0.502 0.848 7.77 14.3 16.6 32.9 43.7 36.0 40.0 37.3
FFA{~ole/g tissue) 5.10 5.91 4.58 6.76 7.81 7.56 8.59 8.54 8.65 7.54
FFA{~Mole/g oil) 1040 1184 1018 1442 1673 1572 1806 743 788 1554
TBA{~ole/g oil) 0.522 0.805 0.847 1.52 2.23 2.69 3.94 3.33 3.55 2.72
TBA(~ole/g fish) 2.76 3.98 3.82 7.43 10.5 13.1 19.0 16.4 7.3 13.3
pH 7.2 7.2 7.1 7.0 7.2 6.9 7.0 7.1 7.2 7.0
Moisture Content% 80.0 80.4 81 .0 81.3 82.1 81 .9 81.6 80.7 81 .1 80.9
Percent Fat 0.490 0.500 0.448 0.483 0.467 0.481 0.476 0.49 0.484 0.485
IMP{uMole/g) 1.88 3.33 0.499 0.157 0.133 0.135 0.189 0.176 0.238 0.102
Hx(~ole/g) 1.1 0.946 2.70 3.49 3.26 4.63 4.53 3.76 4.48 4.51
AMP (jUMole/g) N/Db N/D N/D N/D N/D N/D N/D N/D N/D
INO{/JMole/g) 3.99 3.12 2.85 2.07 1 .61 0.819 0.222 o. 34 O. 15 0.193
G value 0.869 0.631 1.66 2.50 2.80 5.71 11.6 12.6 13.0 16.0
P value 0.73 0.550 0.918 0.973 0.974 0.976 0.962 0.957 0.95 0.979
a. At least two cod fillets were pooled for each sampling day.b. Not detected.
N

Table 6. Objective quality evaluation of commercially caught mackerel
aHELD IN ICE (DAYS)
Objective QualityIndicator 1 3 6 8 10 12 14 16 19 22
TVB(mg-Nj100g) 30.0 30.9 33.8 33.1 30.9 29.7 36.6 56.8 1 2 52.1
TMA(mg TMA-Nj100g) 0.545 0.767 1 .79 2.38 4.20 3.65 17 .9 4'1.9 35 2 38.2
FFA(pMolejg tissue 9.67 10.2 14.2 10.2 23.3 20.9 23.5 26.9 27.1 32.5
FFA(pMolejg oil) 1475 389 288 178 552 498 595 478 604 977
TBA(NMolejg oil) 0.963 0.158 1 .1 5 0.785 1.23 3.16 1.50 1.69 1 .07 1.27
TBA(pMolejg fish) 6.32 4.17 60.5 45.0 51.8 133 59.4 66.6 48.1 42.3
pH 6.9 7.1 6.8 7.0 7.1 7.2 7.4 6.7 6 8 6.8
Moisture Content% 75.5 73.4 73.7 67.8 73.6 70.2 70.4 7 .3 73.5 71.8
Percent Fat 0.656 2.64 5.25 5.73 4.23 4.20 3.95 5.62 4 49 3.33
IMP(/UMolejg) 2.74 3.13 .54 1.37 0.896 0.787 0.342 0.384 0.250 0.221
Hx(/UMolejg) 0.914 0.703 1. 9 1.02 1. 73 1.27 2.00 2.53 2.59 2.75
AMP(pMolejg) NjDb NjD NjD NjD NjD NjD NjD NjD NjD NjD
INO(pMolejg) 4.18 3.85 4.75 4.57 4.48 4.89 3.89 2.83 1.09 0.834
G value 0.742 0.652 0.944 0.941 1.16 1.08 1.39 1.66 2.74 3.43
P value 0.650 0.592 o 794 0.803 0.874 0.887 0.945 0.933 0.936 0.942
a. At least two mackerel fillets were pooled for each sampling day.b. Not detected.
w

Ie Ii
- 14 -
evaluation of commercially ca t Queen
HELD IN ICE (DAYS)Objective Quality
Indicator 1 4 7 9 1 1
TVB(mg-N/l00g) 30.0 34 4 73.0 52 6 73 8
TMA(mgTMA-N/l00g) 0.832 1 .00 15.7 10.2 11 • 3
FFA(pMole/g Tissue 4. 14 3.78 6.17 6.58 7.85
FFA(pMole/g Oil) 292 303 506 522 696
TBA (pMole/g Oil) O. 153 0.210 8.62 8.08 8.60
TBA(pMole/g Fish) 2. 19 2.86 105 101 97 . 1
pH 7 • 1 6.9 6.8 7.0 7.0
Moisture Content% 85.4 85.3 87.2 87.6 87.4
Percent Fat 1 .43 1 .30 1 .22 1 .25 1 • 13
IMP (pMole/g) 0.870 0.615 0.038 0.018 0.014
Hx(pMOle/g) 0.289 0.348 0.901 1 .63 1 .07
AMP(pMole/g) N/Da N/D N/D N/D N/D
INO(pMole/g) 1 .60 1 .44 0.728 0.529 0.781
G Value 0.764 0.869 2. 13 3.94 2.33
P value 0.684 0.743 0.977 0.991 0.992
a. Not detected.
- 15 -
e 8 Tentatively recommended guidelines for qualiassessment of fresh fish using G and P valves.A = excellent, B = , F = reject
Fish Grade G Value P Value
Cod TA < 2 ( 0.85
TB 2 - 5 N.A.*
TF '> 5 N.A.
aMackerel TA or TB N.A. N.A.
TF )1.5 ) 0.95
b <0.9Queen Crab TA or TB <,1.5
TF )1.5 >0.9
*N.A. = not applicable
a. G and P valves for mackerel are indicators of the state ofprotein degradation but do not necessarily reflect the eatingquality. A fish with a G valve of (1.5 may still berejected on the basis of rancidity.
b. It is not possible to distinguish between A and B grade crabwith G and P valves.
- 16 -
u
<·0
:::::>
«
0l-
X:::cLL0
zi 0
(f)
e:::ill>Z0U
C)
><(J)e
ill5
::cl-
ez:r: C"Cl
e:::
0=
z-{x
0LL
:r: "0
>-<ti 3:::cI-<r:(L
z0-
(J)
l-
e
u
:c<t
+-'
ill
e
0:::
C"Clx00=0..>,
...-,I
ille::::::><..9
u...
- 17 -
FROZEN FISHHOMOGENATE
5g
0.6 M PERCHLORICEXTRACT
50 ml
SUCTION FILTERWHATMAN NO. 1
NEUTRALIZE 1 .0 mlEXTRACT WITH
PHOSPHATE BUFFER
FILTER NEUTRALIZEDEXTRACT0.5 pm
INJECT ONHPLC
RP-2 13 cmCARTRIDGE SYSTEM
I0.01 M KH2P04 (pH 4.5) MOBILE PHASE
IUV DETECTION
254 NM
Figure 2.Flow sheet of the extraction and cleanup of fish samplesfor HPLC analysis of nucleotides and their degradationproducts.

- 18 -
f4MP
(J)uc:o
...cI.-
oV)
...c4:
0.005
IMP
.. v..... . .
o 4 8 12 16
Time (Min.)
FIGURE 3: HPLC UV C254NM) TRACE OF THE SEPARATION OF STANDARDIMP, Hx (SONG EACH). AMP AND INO (JOONG EACH) RUN ONA BROWNLEE MPLC RP-2 (lOuM, 4.6MMID X IOcM, DEVELOPEDWITH 0.01 MKH2P04 BUFFER, pH 4,S AT O.SML/MIN)REVERSED PHASE ANALYTICAL COLUMN.

- 19 -
6
.",.......
E~.-..cQ').-Q)
:::c4
~
0Q)
0...
2
o 20 409 x 10 -3 (Injected)
60
FIGURE 4: STANDARD CURVES FOR NUCLEOTIDE DETERMINATIONS AT 254NM USING Hx, IMP, AMP AND INO AS STANDARDS.

I6.0
201284o
80
m>.... 60
o8S. 40
ZI
o:E 20
' .. .... ' .
IMP ••••••••J@A Q __ ~_ "--,---19-_-• •~O ...
o .4 8 12 16 20 24
~ 4.oH· ~~ F/ !~ 2.0 [/\ j "\o . .u I ....:
~-_.......~
No
,...Ol 8'40 ~
~"00
( :E 60
~'S..z
I1li
::>
§l 420
«m....
2
o .4 8 12 16 20 24 o .. 8 12 20
DAYS HElD IN ICE
FIGURE 5: I NUC IDE; II. T~1A, III. TVB Arm IV. TBf~ CH"\NGESFOR AQUARI (GROUP A) BLED. GUTTED AND HE ON ICE

I. I II ,
6.°t80
Hx CO
~ 4.0~ ••.•>.... 60
000
§WI. s. 40
Z. I.. 0.~ 20
... .o I , 1 =r= tII~": V$ •••-, :.;:.u.'
A ft ,..,16 20 24 0 4 8 12 20
II. IVN--'
---.8\40 ~ ---- {
00 "0'S. ~ 6Z 0I
« 1lI
~ 20:»
~.4
0 «~
co....2
J) .4 8 12 16 20 24 0 4 8 12 20
DAYS HELD IN ICE
FIGURE 6: I NUCLEOTIDE; II TMA, II TVB AND IV TBA CHANGES RCO~'1f1ERC I GHT COD BLED AND GUTTED AT SEA D
S SEQUE LY HE ON ICE,

L III.6.,0
80
, @ • .. , , •
o .. 8 12 16 20 24 1284o
co>.... 60
C)
8S. 40
Z,o~ 20
Hx
\INO
'.
~. IMP ••.•••-----.--._-.
1>" .... .:0 .... '" " .... " 'll ........'.'
"."C)
~4.0o~
~UZ 2.0oU
II. IV,
2
40C)0
,......
0
~
'S.z
(\)
0
,~
-«~ 20
~
C)
(\):;)
~
~«co....
8
6
4
NN
0 .. 8 12 16 20 24 0 4 8 2 16 20
DAYS HELD IN ICE
FIGURE 7: I NUCLEOTIDE; I H'lA, III TVB AND IV TBA CHANGES F
DED ROUND TH GUTTED AND HELD ON ICE.

- 23 -
2 2
(J)
r-- u- LU- > (J)
-0Z
(J)
LU<..'::""?
<:r.:u
N
c:::e: illt:O u
w l-V ::> :z:
0 0 0 0 0 0 0 0 0 ......... 0CX) '0 .., N ~ CX)
..,SAl DOOI/N-DW (6)j/alow~ anlOA VSl
Z c:::l c:::lZ ...J
0 o.:~N 0 <r. LU
)( Z ~...I :r:
:J: w t=-=l:J: >- (:Q
f- <1::
en CY.0 >--< u>- 1--1-< >--i -".
0 <'-
LU... LU
<: ::)co Z 0
II-
t=l- l--i LU- l--i :r:-/ '0 Ur-
LU 0t=l t:Q......r- LU
"Of 0 >
fLU...J ...J
· U
· ::)
· IN Z
: l--i u_
. C~
~ ~0 0 0 0
"Of N
Djs8 10 Ww"JNO) DOm/N-VWl DWLU~
::J<.D
u....

- 24 -
10
J: 5Q..
3
o 4 8 12 16Held in Ice (Days)
20 24
10 2000
1500 "='o
l.I...
«500 ~
.....
« 3l.I...l.I...
~(j)o 5 FFAF::E ..
f
o 4 8 12 16
Held in Ice (Days)20 24
FIGURE 9: pH AND FFA (TISSUE AND FAT) CHANGES FOR AQUARIUMCOD, (GROUP A) BLED, GUTTED AND HELD ON ICE.

- 25 -
10
7
I 5a.
3
o
10
4 8 12 16Held in Ice (Days)
20
2000
:<t: 3u..;u..;
FFAF .."., .'.'.'.'.',.'
"... ',.'.'.'
... ,t/fl•.'
1500 ~o
u..;
«u..;500 u..;
o 4 8 12 16
Held in Ice (Days)20
FIGURE 10: pH AND FFA (TISSUE AND FAT) CHANGES FOR COW1ERCIALLYCAUGHT COD, BLED AND GUTTED AT SEA AND SUBSEQUENTLYHELD ON ICE.

10
7
I 50..
J
o 4 8 12 16
Held In Ice (Days)20 24
<t:u
500 u..
1500 ,-;:o
u-
2000
........' .
.' ... ' FFAF
FFAT
.' ... ', .'......' .
10
~ J /'u..
o 4 8 12 16
Held in Ice (Days)20 24
FIGURE 11: pH AND FFA (TISSUE AND FAT) CHANGES FOR MACKERALLANDED ROUND THEN GUTTED AND HELD ON ICE.
- 27 -
10
-:c 50.
o 2 4 6 8
Held in Ice (Days)10 12
10 1000
--.-ou..
500
.'
FFAF.. '.. ,.. ,
o 246 8Held in Ice (Days)
10 12
FIGURE 12: pH AND FFA (TISSUE AND FAT) CHANGES IN SECTIONSFROM LIVE BOTCHED QUEEN CRAB HELD ON ICE.
- Hx+ INOINO+IMP+AMP
10.0
CI).2 5.0
~(j
GroulP B.... '
j0@olI
e
(l
NOJ
0' .4 8 12 16 24Held in Ice (Days)
FIGURE 13: GVALUE CHANGES FOR AQUARIUM COD GROUP A; AND GRO B B ; GUTTEDAND HE ON ICE.
10.0
G = Hx+ INCINO+·...:.=.IM...::..:P::::.....-,-A-M-P
Q,)..2 5.0
~<::>
(1l.6iDay15)
N'-D
o' . ,4 . 8 . 1'2 ' 16 I 2'0 ! 24Held in Ice (Days)
FIGURE 14: GVALUE CHANGES FOR COMMERCIALLY CAUGHT COD BLED AND GSUBSEQUENTLY HELD ON ICE,
D AT SAND

10.0
G:: Hx+ INOINO+IMP+AMP
Q)
..2 5.0
~C)
I @ J! , • I , , , , _'_ ' f
o 4 8 12 16Held in Ice (Days)
FIGURE 15: GVALUE CHANGES FOR MACKERAL LANDED ROUND THEN GUTTED AND HE ON ICE
wC)

10.0
G - Hx + INO- INO+IMP+AMP
Cll
.2 5.0~()
'f' • • " •o 2 4 6 8 10 12Held in Ice (Days)
FIGURE 16: GVALUE CHANGES IN SECTIONS FROM LIVE BOTCHED QUEEN CRAB HELD ON ,
w--'

1.0
········..··..
~ 0.5 r :
~Q..
........... • 41 ... IlII ~ •• ..._------------ _...... ,..•....
Group B:.......····..·•••••·•·•.
P = Hx + INOINO+IMP+Hx+AMP
WN
I • , « • • • , , , 8 8 f
o 4 8 12 16 20 24Held in Ice (Days)
FIGURE 17: P VALUE CHANGES FOR AQUARIUM COD GROUP A; AND GROUP B, B J ED ANDHELD ON ICE,

1.0
OJ 0.5::>
~Q..
p = Hx + INOINO+IMP+Hx+AMP
ww
o 4 8 12Held in Ice (Days)
16 20 24
FIGURE 18: P VALUE CHANGES FOR COMMERCIALLY CAUGHT COD BLED AND G .TTr-~
SUBSEQUENTLY HELD ON ICE.SEA AND

1.0
Q) 0.5:::>
~c..
p = Hx + INOINO+IMP+ +
w..j:::.
I 1\ I « A , ' , f , a $ f
o 4 8 12 16 20 24in lce{Days)
FIGURE 19: P VALUE CHANGES FOR MACKERAL LANDED ROUND THEN G D HE ON ICE,

- 35 -
illU